Sakalau02 Weekly Daily SessionsSakalau02: Weekly Daily Sessions – The Architecture of the Trading Week
The "Sakalau02 Weekly Daily Sessions" is a high-definition visual mapping tool designed to dissect the trading week into distinct daily blocks. More than just a period separator, this script defines the "field of play" for each day, allowing you to visualize where liquidity builds and how price interacts with temporal boundaries.
Here is why this script is the cornerstone of a professional Top-Down analysis:
📅 High-Definition Daily Structure
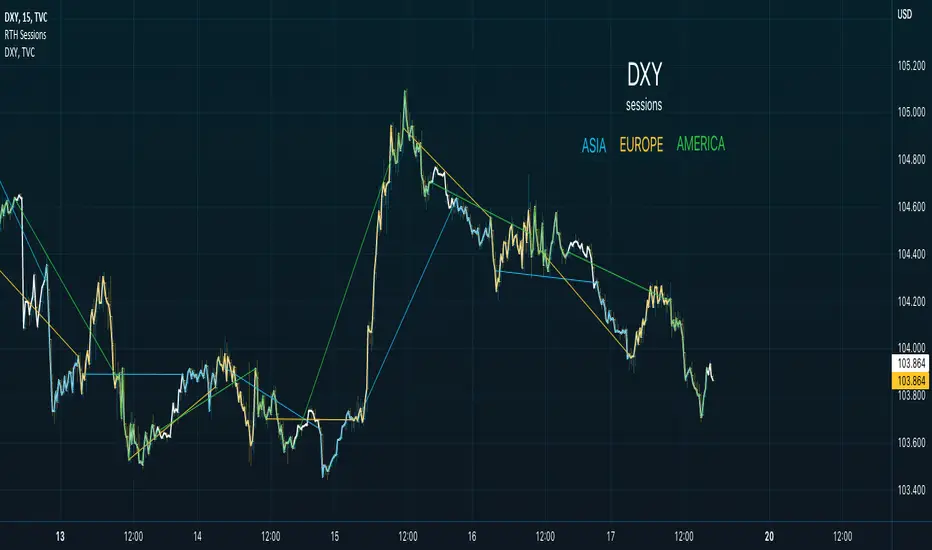
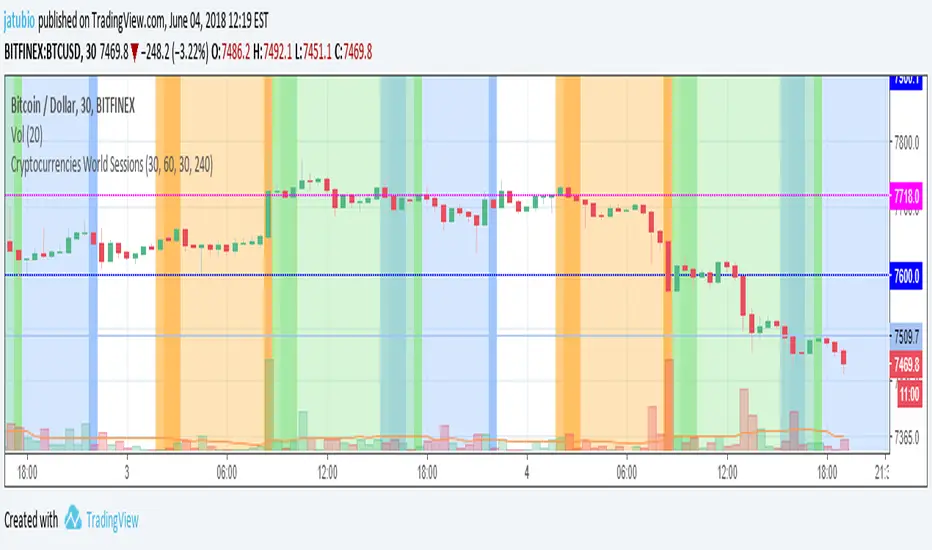
The indicator transforms your chart into a logical map of the week, providing visual support for all 7 days, with a focus on active trading from Monday to Friday.
Visual Identity: Each day is assigned its own unique color, helping you instantly recognize repetitive market signatures (like the "Tuesday Reversal" or "Mid-week Expansion").
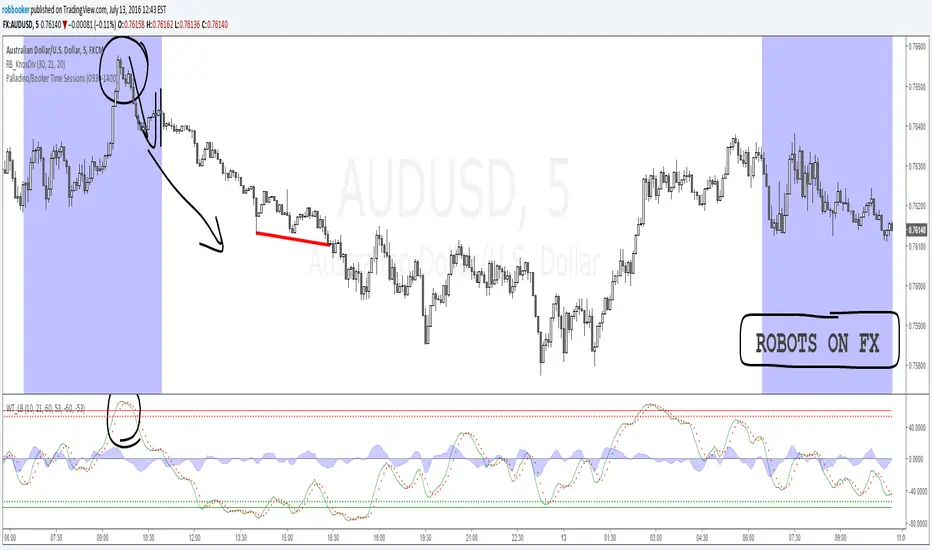
Timezone Precision: Featuring a dedicated Timezone Input, the script ensures that daily boxes open exactly at 00:00 according to your chosen financial hub (UTC, New York, London, etc.).
📐 Range and Liquidity Analysis
Through its Dynamic Box System, the script monitors price evolution in real-time:
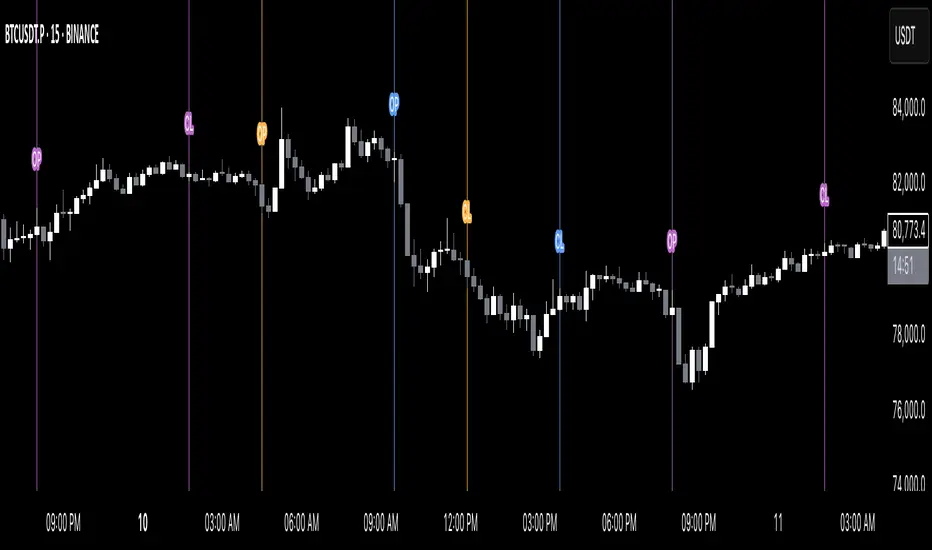
High/Low Tracking: Automatically expands the box boundaries as price carves out new daily highs or lows.
The 0.5 Level (Daily Equilibrium): Automatically calculates the midpoint of the entire day. This is the critical "Fair Value" zone where price decides whether to trend or mean-revert.
Open/Close Trajectory: A discreet line tracks price relative to the daily open, providing an instant read on the intraday bias (Bullish/Bearish).
⚡ Precision Alert System
Never miss a structural shift. The indicator comes equipped with built-in alerts for:
Session Starts: Be notified the moment a new daily cycle begins.
Liquidity Sweeps (New High/Low): Receive alerts the second price breaches the current day’s high or low—perfect for executing Judas Swings or Expansion setups.
💎 Versatile Display Modes
Boxes Mode: Encapsulates price for a clear view of market structure.
Zones Mode: Highlights the background for a cleaner integration with secondary indicators.
Timeline Mode: Marks the base of the chart, keeping the price action area completely untouched.
Piața nu este doar preț, este ritm. În timp ce alții se pierd în zgomotul fiecărei secunde, eu definesc limitele zilei. O structură creată pentru traderul care știe că volumul urmează timpul, iar profitul urmează disciplina — păstrați ochii pe echilibrul zilei!" — Semnat, Andrei (Sakalau02) ⏳
Pine Script®指標