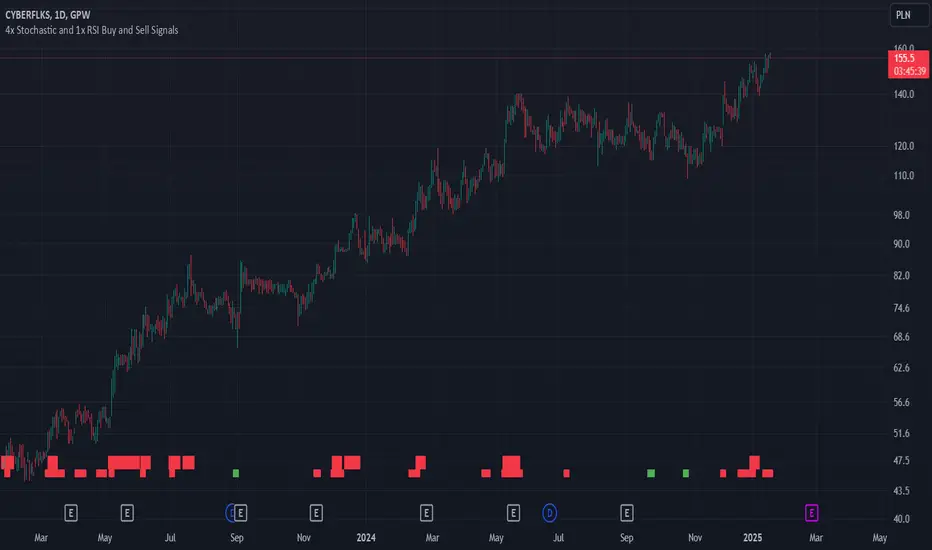
4x Stochastic and 1x RSI Buy and Sell SignalsBuy signal (green), when Stochastic 9, 14, 40 and 60 are bellow 20.
Sell signal (red), when Stochastic 9, 14, 40 and 60 are above 80.
Buy signal is larger, when RSI is also bellow 30.
Sell signal is larger, when RSI is also above 70.
Using RSI is optional and can be disabled.
Use this signals when confirmed by another indicators, like support and resistance levels, EMAs and fundamental analysis.
在腳本中搜尋"signal"
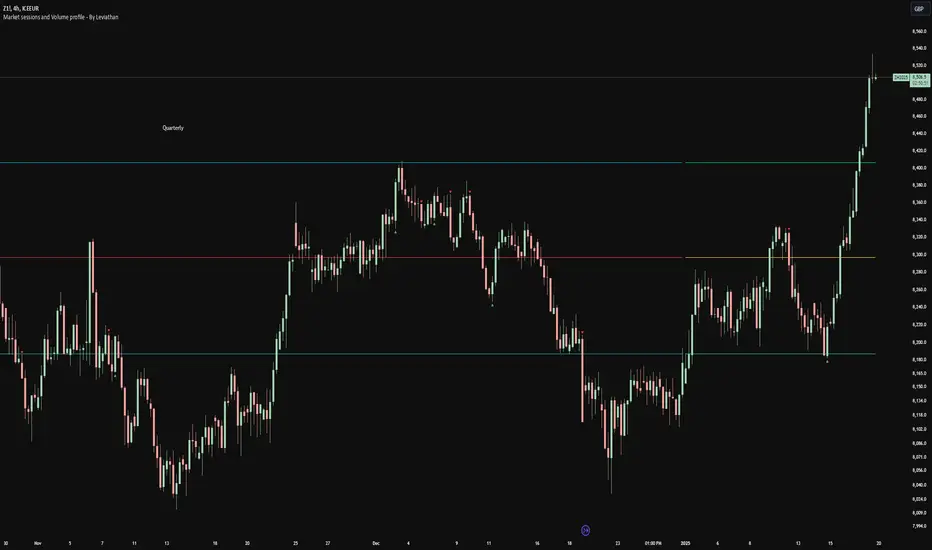
Volume profile [Signals] - By Leviathan [Mindyourbuisness]Market Sessions and Volume Profile with Sweep Signals - Based on Leviathan's Volume Profile
This indicator is an enhanced version of Leviathan's Volume Profile indicator, adding session-based value area analysis and sweep detection signals. It combines volume profile analysis with market structure concepts to identify potential reversal opportunities.
Features
- Session-based volume profiles (Daily, Weekly, Monthly, Quarterly, Yearly)
- Forex sessions support (Tokyo, London, New York)
- Value Area analysis with POC, VAH, and VAL levels
- Extended level visualization for the last completed session
- Sweep detection signals for key value area levels
Sweep Signals Explanation
The indicator detects two types of sweeps at VAH, VAL, and POC levels:
Bearish Sweeps (Red Triangle Down)
Conditions:
- Price makes a high above the level (VAH/VAL/POC)
- Closes below the level
- Closes below the previous candle's low
- Previous candle must be bullish
Trading Implication: Suggests a failed breakout and potential reversal to the downside. These sweeps often indicate stop-loss hunting above key levels followed by institutional selling.
Bullish Sweeps (Green Triangle Up)
Conditions:
- Price makes a low below the level (VAH/VAL/POC)
- Closes above the level
- Closes above the previous candle's high
- Previous candle must be bearish
Trading Implication: Suggests a failed breakdown and potential reversal to the upside. These sweeps often indicate stop-loss hunting below key levels followed by institutional buying.
Trading Guidelines
1. Use sweep signals in conjunction with the overall trend
2. Look for additional confirmation like:
- Volume surge during the sweep
- Price action patterns
- Support/resistance levels
3. Consider the session's volatility and time of day
4. More reliable signals often occur at VAH and VAL levels
5. POC sweeps might indicate stronger reversals due to their significance as fair value levels
Notes
- The indicator works best on higher timeframes (1H and above)
- Sweep signals are more reliable during active market hours
- Consider using multiple timeframe analysis for better confirmation
- Past performance is not indicative of future results
Credits: Original Volume Profile indicator by Leviathan
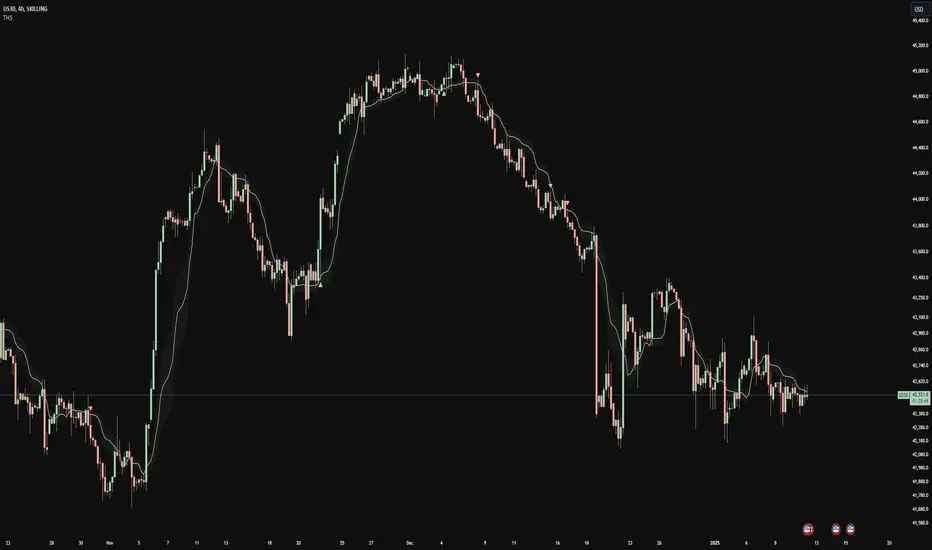
Adaptive Fourier Transform Supertrend [QuantAlgo]Discover a brand new way to analyze trend with Adaptive Fourier Transform Supertrend by QuantAlgo , an innovative technical indicator that combines the power of Fourier analysis with dynamic Supertrend methodology. In essence, it utilizes the frequency domain mathematics and the adaptive volatility control technique to transform complex wave patterns into clear and high probability signals—ideal for both sophisticated traders seeking mathematical precision and investors who appreciate robust trend confirmation!
🟢 Core Architecture
At its core, this indicator employs an adaptive Fourier Transform framework with dynamic volatility-controlled Supertrend bands. It utilizes multiple harmonic components that let you fine-tune how market frequencies influence trend detection. By combining wave analysis with adaptive volatility bands, the indicator creates a sophisticated yet clear framework for trend identification that dynamically adjusts to changing market conditions.
🟢 Technical Foundation
The indicator builds on three innovative components:
Fourier Wave Analysis: Decomposes price action into primary and harmonic components for precise trend detection
Adaptive Volatility Control: Dynamically adjusts Supertrend bands using combined ATR and standard deviation
Harmonic Integration: Merges multiple frequency components with decreasing weights for comprehensive trend analysis
🟢 Key Features & Signals
The Adaptive Fourier Transform Supertrend transforms complex wave calculations into clear visual signals with:
Dynamic trend bands that adapt to market volatility
Sophisticated cloud-fill visualization system
Strategic L/S markers at key trend reversals
Customizable bar coloring based on trend direction
Comprehensive alert system for trend shifts
🟢 Practical Usage Tips
Here's how you can get the most out of the Adaptive Fourier Transform Supertrend :
1/ Setup:
Add the indicator to your favorites, then apply it to your chart ⭐️
Start with close price as your base source
Use standard Fourier period (14) for balanced wave detection
Begin with default harmonic weight (0.5) for balanced sensitivity
Start with standard Supertrend multiplier (2.0) for reliable band width
2/ Signal Interpretation:
Monitor trend band crossovers for potential signals
Watch for convergence of price with Fourier trend
Use L/S markers for trade entry points
Monitor bar colors for trend confirmation
Configure alerts for significant trend reversals
🟢 Pro Tips
Fine-tune Fourier parameters for optimal sensitivity:
→ Lower Base Period (8-12) for more reactive analysis
→ Higher Base Period (15-30) to filter out noise
→ Adjust Harmonic Weight (0.3-0.7) to control shorter trend influence
Customize Supertrend settings:
→ Lower multiplier (1.5-2.0) for tighter bands
→ Higher multiplier (2.0-3.0) for wider bands
→ Adjust ATR length based on market volatility
Strategy Enhancement:
→ Compare signals across multiple timeframes
→ Combine with volume analysis
→ Use with support/resistance levels
→ Integrate with other momentum indicators

Normalized Price ComparisonNormalized Price Comparison Indicator Description
The "Normalized Price Comparison" indicator is designed to provide traders with a visual tool for comparing the price movements of up to three different financial instruments on a common scale, despite their potentially different price ranges. Here's how it works:
Features:
Normalization: This indicator normalizes the closing prices of each symbol to a scale between 0 and 1 over a user-defined period. This normalization process allows for the comparison of price trends regardless of the absolute price levels, making it easier to spot relative movements and trends.
Crossing Alert: It features an alert functionality that triggers when the normalized price lines of the first two symbols (Symbol 1 and Symbol 2) cross each other. This can be particularly useful for identifying potential trading opportunities when one asset's relative performance changes against another.
Customization: Users can input up to three symbols for analysis. The normalization period can be adjusted, allowing flexibility in how historical data is considered for the scaling process. This period determines how many past bars are used to calculate the minimum and maximum prices for normalization.
Visual Representation: The indicator plots these normalized prices in a separate pane below the main chart. Each symbol's normalized price is represented by a distinct colored line:
Symbol 1: Blue line
Symbol 2: Red line
Symbol 3: Green line
Use Cases:
Relative Performance Analysis: Ideal for investors or traders who want to compare how different assets are performing relative to each other over time, without the distraction of absolute price differences.
Divergence Detection: Useful for spotting divergences where one asset might be outperforming or underperforming compared to others, potentially signaling changes in market trends or investment opportunities.
Crossing Strategy: The alert for when Symbol 1 and Symbol 2's normalized lines cross can be used as a part of a trading strategy, signaling potential entry or exit points based on relative price movements.
Limitations:
Static Alert Messages: Due to Pine Script's constraints, the alert messages cannot dynamically include the names of the symbols being compared. The alert will always mention "Symbol 1" and "Symbol 2" crossing.
Performance: Depending on the timeframe and the number of symbols, performance might be affected, especially on lower timeframes with high data frequency.
This indicator is particularly beneficial for those interested in multi-asset analysis, offering a streamlined way to observe and react to relative price movements in a visually coherent manner. It's a powerful tool for enhancing your trading or investment analysis by focusing on trends and relationships rather than raw price data.

Trend Heuristics (+Signals)Trend Heuristics - Enhanced Rolling VWAP with Smart Signals
This indicator is an enhanced version of the Rolling VWAP (RVWAP) concept, originally based on PineCoders' ConditionalAverages library. It combines volume-weighted average price analysis with advanced signal detection for both sweeps and breakouts.
Core Features
1. Rolling VWAP System
- Implements a dynamic rolling VWAP that adapts to different timeframes
- Includes standard deviation bands for volatility measurement
- Offers flexible time period settings (fixed or auto-adjusting)
- Provides customizable visual elements including bands and fills
2. Dual Signal System
Sweep Signals
Detects high-probability reversal points with these conditions:
- Bullish Sweep:
- Opens above upper band
- Tests below upper band (low)
- Closes above upper band
- Shows stronger lower wick
- Closes above previous high
- Has favorable close position (upper 50% of candle)
- Bearish Sweep:
- Opens below lower band
- Tests above lower band (high)
- Closes below lower band
- Shows stronger upper wick
- Closes below previous low
- Has favorable close position (lower 50% of candle)
Breakout Signals
Identifies potential trend changes with these conditions:
- Bullish Breakout:
- Opens below VWAP
- Closes above upper band
- Indicates strong momentum shift upward
- Bearish Breakout:
- Opens above VWAP
- Closes below lower band
- Indicates strong momentum shift downward
Technical Details
Base Components
- Built upon PineCoders' ConditionalAverages library
- Incorporates custom alert system via CustomAlertLib
- Uses standard deviation for band calculations
Customization Options
- Adjustable standard deviation multiplier
- Flexible time period settings
- Independent controls for sweep and breakout signals
- Customizable visual elements (colors, sizes, positions)
- Custom alert message formatting
Use Cases
1. Trend Following:
- Use VWAP as dynamic support/resistance
- Monitor breakout signals for trend changes
2. Mean Reversion:
- Use sweep signals for counter-trend opportunities
- Standard deviation bands for range identification
3. Volume Analysis:
- VWAP provides volume-weighted price levels
- Helps identify significant price levels
Notes
- Best performed on liquid instruments with consistent volume
- Most effective on timeframes from 1hours to 4 hours and 1D, anything greater isn't very good
- Recommended to use in conjunction with other technical analysis tools
- Signals can be filtered based on higher timeframe trends
Credits
- Original Rolling VWAP concept by PineCoders
HMA Buy Sell Signals - Profit ManagerNote : Settings should be adjusted according to the selected time frame. Try to find the best setting according to the profitability rate
Overall Functionality
This script combines several trading tools to create a comprehensive system for trend analysis, trade execution, and performance tracking. Users can identify market trends using specific moving averages and RSI indicators while managing profit and loss levels automatically.
Trend Detection and Trade Signals
Hull Moving Averages (HMA):
Two HMAs (a faster one and a slower one) are used to determine the market trend.
A buy signal is generated when the faster HMA crosses above the slower HMA.
Conversely, a sell signal is triggered when the faster HMA crosses below the slower one.
Visual Feedback:
Trend lines on the chart change color to reflect the trend direction (e.g., green for upward trends and red for downward trends).
Trade Levels and Management
Entry, Take-Profit, and Stop-Loss Levels:
When the trend shifts upwards, the script calculates entry, take-profit, and stop-loss levels based on the opening price.
Similarly, for downward trends, these levels are determined for short trades.
Commission Tracking:
Each trade includes a commission cost, which is factored into net profit and loss calculations.
Dynamic Labels:
Entry, take-profit, and stop-loss levels are visually marked on the chart for easier tracking.
Performance Tracking
Profit and Loss Tracking:
The script keeps a running total of profits, losses, and commissions for both long and short trades.
It also calculates the net profit after all costs are considered.
Performance Table:
A table is displayed on the chart summarizing:
The number of trades.
Total profit and loss for long and short positions.
Commission costs.
Net profit.
Fractal Support and Resistance
Dynamic Lines:
The script identifies the most recent significant highs and lows using fractals.
It draws support and resistance lines that automatically update as new fractals form.
Simplified Visuals:
The chart always shows the last two support and resistance lines, keeping the visualization clean and focused.
RSI-Based Signals
Overbought and Oversold Levels:
RSI is used to identify overbought (above 80) and oversold (below 20) conditions.
The script generates buy signals at oversold levels and sell signals at overbought levels.
Chart Indicators:
Arrows and labels appear on the chart to highlight these RSI-based opportunities.
Customization
The script allows users to customize key parameters such as:
Moving average lengths for trend detection.
Take-profit and stop-loss percentages.
Timeframes for backtesting.
Starting capital and commission rates.
Conclusion
This script is a versatile tool for traders, combining trend detection, automated trade management, and visual feedback. It simplifies decision-making by providing clear signals and tracking performance metrics, making it suitable for both beginners and experienced traders.
* The most recently drawn fractals represent potential support and resistance levels. If the price aligns with these levels at the time of entering a trade, it may indicate a likelihood of reversal. In such cases, it’s advisable to either avoid entering the trade altogether or proceed with increased caution.

Alternate Bat Harmonic Pattern [TradingFinder] ALT Bat Indicator🔵 Introduction
The Alternate Bat harmonic pattern is one of the most precise and practical tools in technical analysis, introduced by Scott Carney in 2003. This pattern focuses on specific Fibonacci ratios, such as 0.382 at point B and 1.13XA at point D, to identify Potential Reversal Zones (PRZ) where price is likely to reverse.
The Alternative Bat pattern emerged as a result of repeated failures observed in the standard Bat pattern. Traders entering trades near the 0.886XA level of the standard Bat often encountered losses. In the Alternate Bat, point D extends beyond 0.886XA, typically reversing at 1.13XA, offering a more accurate identification of the reversal zone.
A key characteristic of this pattern is its M- or W-shaped structure, where the midpoint B retraces 0.382XA or less. Additionally, the CD leg requires an extension of 2.0 to 3.618 to complete the pattern. Due to its accuracy and the predictable behavior of price near the PRZ, the Alternate Bat pattern is recognized as a powerful tool for forecasting price reversals.
In the bullish Alternative Bat pattern, an M-shaped structure forms. After an initial upward movement (XA), price undergoes a short correction at point B (0.382XA) and then declines toward point D (1.13XA and an extension of 2.0 to 3.618BC), where a potential upward reversal is expected.
In the bearish Alternate Bat pattern, a W-shaped structure forms. After an initial downward movement (XA), price retraces slightly at point B (0.382XA) and then rises toward point D (1.13XA and an extension of 2.0 to 3.618BC), where a potential downward reversal is anticipated.
🔵 How to Use
The Alternate Bat harmonic pattern is a key tool for identifying potential reversal zones (PRZ) in the market. By leveraging the 0.382 retracement at point B and the 1.13XA extension at point D, along with symmetrical price structures, this pattern offers precise reversal opportunities in both bullish and bearish market conditions.
🟣 Bullish Alternate Bat Pattern
The bullish Alternate Bat pattern forms during a downtrend, signaling a potential reversal to the upside. This pattern consists of three downward movements with two corrective waves, ultimately reaching point D, which marks the PRZ.
At the PRZ, the convergence of Fibonacci levels—1.13XA and extensions ranging from 2.0 to 3.618BC—creates a strong support zone where price is likely to reverse upward.
🟣 Bearish Alternative Bat Pattern
The bearish Alternate Bat pattern develops during an uptrend, indicating a potential reversal to the downside. This pattern features three upward price movements with two retracements, ending at point D, where the PRZ forms.
Point D is defined by the 1.13XA extension and the 2.0 to 3.618BC projection, creating a strong resistance zone where price is expected to reverse downward.
🔵 Setting
🟣 Logical Setting
ZigZag Pivot Period : You can adjust the period so that the harmonic patterns are adjusted according to the pivot period you want. This factor is the most important parameter in pattern recognition.
Show Valid Format : If this parameter is on "On" mode, only patterns will be displayed that they have exact format and no noise can be seen in them. If "Off" is, the patterns displayed that maybe are noisy and do not exactly correspond to the original pattern.
Show Formation Last Pivot Confirm : if Turned on, you can see this ability of patterns when their last pivot is formed. If this feature is off, it will see the patterns as soon as they are formed. The advantage of this option being clear is less formation of fielded patterns, and it is accompanied by the latest pattern seeing and a sharp reduction in reward to risk.
Period of Formation Last Pivot : Using this parameter you can determine that the last pivot is based on Pivot period.
🟣 Genaral Setting
Show : Enter "On" to display the template and "Off" to not display the template.
Color : Enter the desired color to draw the pattern in this parameter.
LineWidth : You can enter the number 1 or numbers higher than one to adjust the thickness of the drawing lines. This number must be an integer and increases with increasing thickness.
LabelSize : You can adjust the size of the labels by using the "size.auto", "size.tiny", "size.smal", "size.normal", "size.large" or "size.huge" entries.
🟣 Alert Setting
Alert : On / Off
Message Frequency : This string parameter defines the announcement frequency. Choices include: "All" (activates the alert every time the function is called), "Once Per Bar" (activates the alert only on the first call within the bar), and "Once Per Bar Close" (the alert is activated only by a call at the last script execution of the real-time bar upon closing). The default setting is "Once per Bar".
Show Alert Time by Time Zone : The date, hour, and minute you receive in alert messages can be based on any time zone you choose. For example, if you want New York time, you should enter "UTC-4". This input is set to the time zone "UTC" by default.
🔵 Conclusion
The Alternate Bat harmonic pattern, with its precise Fibonacci ratios like 0.382 and 1.13XA, is a reliable tool for identifying Potential Reversal Zones (PRZ) in financial markets. By recognizing symmetrical price structures and focusing on both bullish and bearish scenarios, traders can identify optimal entry and exit points with high accuracy.
The key strength of this pattern lies in its ability to define strong support and resistance zones near the PRZ, increasing the probability of price reversals. Combining the pattern with candlestick confirmations and volume analysis enhances its effectiveness.
Ultimately, incorporating the Alternative Bat pattern with proper risk management and Fibonacci-based targets allows traders to enter the market confidently and capitalize on potential price reversals.

LRI Momentum Cycles [AlgoAlpha]Discover the LRI Momentum Cycles indicator by AlgoAlpha, a cutting-edge tool designed to identify market momentum shifts using trend normalization and linear regression analysis. This advanced indicator helps traders detect bullish and bearish cycles with enhanced accuracy, making it ideal for swing traders and intraday enthusiasts alike.
Key Features :
🎨 Customizable Appearance : Set personalized colors for bullish and bearish trends to match your charting style.
🔧 Dynamic Trend Analysis : Tracks market momentum using a unique trend normalization algorithm.
📊 Linear Regression Insight : Calculates real-time trend direction using linear regression for better precision.
🔔 Alert Notifications : Receive alerts when the market switches from bearish to bullish or vice versa.
How to Use :
🛠 Add the Indicator : Favorite and apply the indicator to your TradingView chart. Adjust the lookback period, linear regression source, and regression length to fit your strategy.
📊 Market Analysis : Watch for color changes on the trend line. Green signals bullish momentum, while red indicates bearish cycles. Use these shifts to time entries and exits.
🔔 Set Alerts : Enable notifications for momentum shifts, ensuring you never miss critical market moves.
How It Works :
The LRI Momentum Cycles indicator calculates trend direction by applying linear regression on a user-defined price source over a specified period. It compares historical trend values, detecting bullish or bearish momentum through a dynamic scoring system. This score is normalized to ensure consistent readings, regardless of market conditions. The indicator visually represents trends using gradient-colored plots and fills to highlight changes in momentum. Alerts trigger when the momentum state changes, providing actionable trading signals.

EMA Volatility Channel [QuantAlgo]EMA Volatility Channel 🌊📈
The EMA Volatility Channel by QuantAlgo is an advanced technical indicator designed to capture price volatility and trend dynamics through adaptive channels based on exponential moving averages. This sophisticated system combines EMA-based trend analysis with dynamic volatility-adjusted bands to help traders and investors identify trend direction, potential reversals, and market volatility conditions. By evaluating both price momentum and volatility together, this tool enables users to make informed trading decisions while adapting to changing market conditions.
💫 Dynamic Channel Architecture
The EMA Volatility Channel provides a unique framework for assessing market trends through a blend of exponential moving averages and volatility-based channel calculations. Unlike traditional channel indicators that use fixed-width bands, this system incorporates dynamic volatility measurements to adjust channel width automatically, helping users determine whether price movements are significant relative to current market conditions. By combining smooth EMA trends with adaptive volatility bands, it evaluates both directional movement and market volatility, while the smoothing parameters ensure stable yet responsive channel adjustments. This adaptive approach allows users to identify trending conditions while remaining aware of volatility expansions and contractions, enhancing both trend-following and reversal strategies.
📊 Indicator Components & Mechanics
The EMA Volatility Channel is composed of several technical components that create a dynamic channel system:
EMA Midline: Calculates a smoothed exponential moving average that serves as the channel's centerline, providing a clear reference for trend direction.
Volatility Measurement: Computes average price movement to determine dynamic channel width, adapting to changing market conditions automatically.
Smooth Band Calculation: Applies additional smoothing to the channel bands, reducing noise while maintaining responsiveness to significant price movements.
📈 Key Indicators and Features
The EMA Volatility Channel combines various technical tools to deliver a comprehensive analysis of market conditions.
The indicator utilizes exponential moving averages with customizable length and smoothing parameters to adapt to different trading styles. Volatility calculations are applied to determine channel width, providing context-aware boundaries for price movement. The trend detection component evaluates price action relative to the channel bands, helping validate trends and identify potential reversals.
The indicator incorporates multi-layered visualization with color-coded channels and bars to signal both trend direction and market position. These adaptive visual cues, combined with programmable alerts for channel breakouts, help traders and investors track both trend changes and volatility conditions, supporting both trend-following and mean-reversion strategies.
⚡️ Practical Applications and Examples
✅ Add the Indicator: Add the indicator to your TradingView chart by clicking on the star icon to add it to your favorites ⭐️
👀 Monitor Channel Position: Watch the price position relative to the channel bands to identify trend direction and potential reversals. When price moves outside the channel, consider potential trend changes or extreme conditions.
🔔 Set Alerts: Configure alerts for channel breakouts and trend changes, ensuring you can act on significant technical developments promptly.
🌟 Summary and Tips
The EMA Volatility Channel by QuantAlgo is a versatile technical tool, designed to support both trend following and volatility analysis across different market environments. By combining smooth EMA trends with dynamic volatility-based channels, it helps traders and investors identify significant price movements while measuring market volatility, providing reliable technical signals. The tool's adaptability across timeframes makes it suitable for both trend-following and reversal strategies, allowing users to capture opportunities while maintaining awareness of changing market conditions.

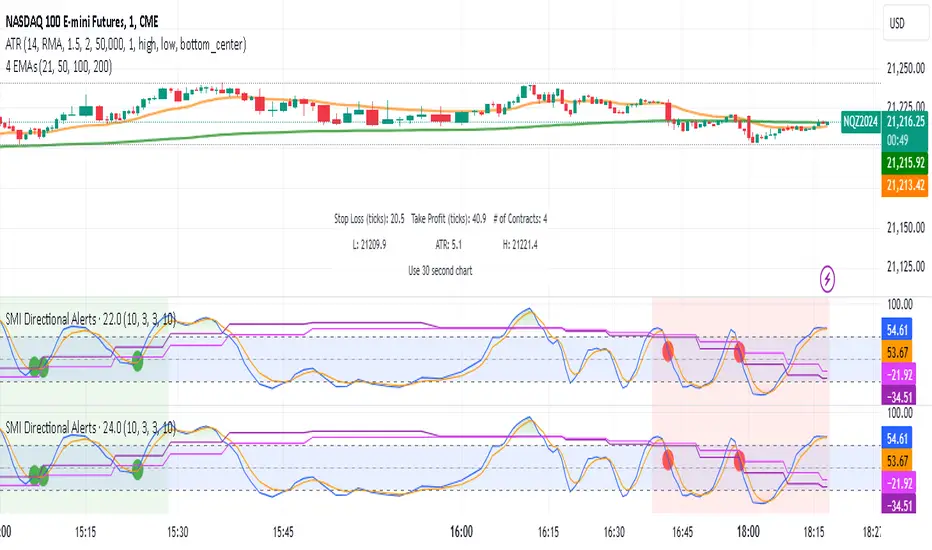
Dual Timeframe Stochastic Momentum Index w/buy sell signalsThis indicator combines momentum analysis across two timeframes to identify high-probability trading opportunities. It plots the Stochastic Momentum Index (SMI) for both the chart timeframe and a higher timeframe (default 10 minutes) to help traders align with the broader market trend.
Key Features
Displays SMI and its EMA for both timeframes
Background shading indicates favorable trading conditions
Signal dots mark potential entry points
Customizable parameters for fine-tuning
Signals Explained
Bullish Signals (Green Dots)
Appear when the chart timeframe SMI crosses above its EMA
Only trigger during periods when the higher timeframe shows:
SMI is above its EMA (increasing momentum)
SMI is between -40 and +40 (not overbought/oversold)
Bearish Signals (Red Dots)
Appear when the chart timeframe SMI crosses below its EMA
Only trigger during periods when the higher timeframe shows:
SMI is below its EMA (decreasing momentum)
SMI is between -40 and +40 (not overbought/oversold)
Settings
%K Length: Lookback period for SMI calculation (default: 10)
%D Length: Smoothing period for primary calculation (default: 3)
EMA Length: Smoothing period for signal line (default: 3)
Alternative Timeframe: Higher timeframe for trend analysis (default: 10 minutes)
Best Practices
Use higher timeframe signals to determine market bias
Wait for signal dots in the chart timeframe for entry timing
Avoid trades when higher timeframe SMI is in extreme zones (above 40 or below -40)
Consider additional confirmation from price action or other indicators
Note: This indicator combines trend and momentum analysis but should be used as part of a complete trading strategy that includes proper risk management.
ABCD Harmonic Pattern [TradingFinder] ABCD Pattern indicator🔵 Introduction
The ABCD harmonic pattern is a tool for identifying potential reversal zones (PRZ) by using Fibonacci ratios to pinpoint critical price reversal points on price charts.
This pattern consists of four key points, labeled A, B, C, and D. In this structure, the AB and CD waves move in the same direction, while the BC wave acts as a corrective wave in the opposite direction.
The ABCD pattern follows specific Fibonacci ratios that enhance its accuracy in identifying PRZ. Typically, point C lies within the 0.382 to 0.886 Fibonacci retracement of the AB wave, indicating the correction extent of the BC wave.
Subsequently, the CD wave, as the final wave in this pattern, reaches point D with a Fibonacci extension between 1.13 and 2.618 of the BC wave. Point D, which marks the PRZ, is where a potential price reversal is likely to occur.
The ABCD pattern appears in both bullish and bearish forms. In the bullish ABCD pattern, prices tend to increase at point D, which defines the PRZ; in the bearish ABCD pattern, prices typically decrease upon reaching the PRZ at point D.
These characteristics make the ABCD pattern a popular tool for identifying PRZ and price reversal points in financial markets, including forex, cryptocurrencies, and stocks.
Bullish Pattern :
Beaish Pattern :
🔵 How to Use
🟣 Bullish ABCD Pattern
The bullish ABCD pattern is another harmonic structure used to identify a potential reversal zone (PRZ) where the price is likely to rise after a downward movement. This pattern includes four main points A, B, C, and D. In the bullish ABCD, the AB and CD waves move downward, and the BC wave acts as a corrective, upward wave. This setup creates a PRZ at point D, where the price may reverse and move upward.
To identify a bullish ABCD pattern, begin with the downward AB wave. The BC wave retraces upward between 0.382 and 0.886 of the AB wave, indicating the extent of the correction.
After the BC retracement, the CD wave forms and extends from point C down to point D, with an extension of around 1.13 to 2.618 of the BC wave. Point D, as the PRZ, represents the area where the price may reverse upwards, making it a strategic level for potential buy positions.
When the price reaches point D in the bullish ABCD pattern, traders look for upward reversal signals. This can include bullish candlestick formations, such as hammer or morning star patterns, near the PRZ to confirm the trend reversal. Entering a long position after confirmation near point D provides a calculated entry point.
Additionally, placing a stop loss slightly below point D helps protect against potential loss if the reversal does not occur. The ABCD pattern, with its precise Fibonacci structure and PRZ identification, gives traders a disciplined approach to spotting bullish reversals in markets, particularly in forex, cryptocurrency, and stock trading.
Bullish Pattern in COINBASE:BTCUSD :
🟣 Bearish ABCD Pattern
The bearish ABCD pattern is a harmonic structure that indicates a potential reversal zone (PRZ) where price may shift downward after an initial upward movement. This pattern consists of four main points A, B, C, and D. In a bearish ABCD, the AB and CD waves move upward, while the BC wave acts as a corrective wave in the opposite, downward direction. This reversal zone (PRZ) can be identified with specific Fibonacci ratios.
To identify a bearish ABCD pattern, start by observing the AB wave, which forms as an upward price movement. The BC wave, which follows, typically retraces between 0.382 to 0.886 of the AB wave. This retracement indicates how far the correction goes and sets the foundation for the next wave.
Finally, the CD wave extends from point C to reach point D with a Fibonacci extension of approximately 1.13 to 2.618 of the BC wave. Point D represents the PRZ where the potential reversal may occur, making it a critical area for traders to consider short positions.
Once point D in the bearish ABCD pattern is reached, traders can anticipate a downward price movement. At this potential reversal zone (PRZ), traders often wait for additional bearish signals or candlestick patterns, such as engulfing or evening star formations, to confirm the price reversal.
This confirmation around the PRZ enhances the accuracy of the entry point for a bearish position. Setting a stop loss slightly above point D can help manage risk if the price doesn’t reverse as anticipated. The ABCD pattern, with its reliance on Fibonacci ratios and clearly defined points, offers a strategic approach for traders looking to capitalize on potential bearish reversals in financial markets, including forex, stocks, and cryptocurrencies.
Bearish Pattern in OANDA:XAUUSD :
🔵 Setting
🟣 Logical Setting
ZigZag Pivot Period : You can adjust the period so that the harmonic patterns are adjusted according to the pivot period you want. This factor is the most important parameter in pattern recognition.
Show Valid Forma t: If this parameter is on "On" mode, only patterns will be displayed that they have exact format and no noise can be seen in them. If "Off" is, the patterns displayed that maybe are noisy and do not exactly correspond to the original pattern.
Show Formation Last Pivot Confirm : if Turned on, you can see this ability of patterns when their last pivot is formed. If this feature is off, it will see the patterns as soon as they are formed. The advantage of this option being clear is less formation of fielded patterns, and it is accompanied by the latest pattern seeing and a sharp reduction in reward to risk.
Period of Formation Last Pivot : Using this parameter you can determine that the last pivot is based on Pivot period.
🟣 Genaral Setting
Show : Enter "On" to display the template and "Off" to not display the template.
Color : Enter the desired color to draw the pattern in this parameter.
LineWidth : You can enter the number 1 or numbers higher than one to adjust the thickness of the drawing lines. This number must be an integer and increases with increasing thickness.
LabelSize : You can adjust the size of the labels by using the "size.auto", "size.tiny", "size.smal", "size.normal", "size.large" or "size.huge" entries.
🟣 Alert Setting
Alert : On / Off
Message Frequency : This string parameter defines the announcement frequency. Choices include: "All" (activates the alert every time the function is called), "Once Per Bar" (activates the alert only on the first call within the bar), and "Once Per Bar Close" (the alert is activated only by a call at the last script execution of the real-time bar upon closing). The default setting is "Once per Bar".
Show Alert Time by Time Zone : The date, hour, and minute you receive in alert messages can be based on any time zone you choose. For example, if you want New York time, you should enter "UTC-4". This input is set to the time zone "UTC" by default.
🟣 Conclusion
The ABCD harmonic pattern offers a structured approach in technical analysis, helping traders accurately identify potential reversal zones (PRZ) where price movements may shift direction. By leveraging the relationships between points A, B, C, and D, alongside specific Fibonacci ratios, traders can better anticipate points of market reversal and make more informed decisions.
Both the bearish and bullish ABCD patterns enable traders to pinpoint ideal entry points that align with anticipated market shifts. In a bearish ABCD, point D within the PRZ often signals a downward trend reversal, while in a bullish ABCD, this same point typically suggests an upward reversal. The adaptability of the ABCD pattern across different markets, such as forex, stocks, and cryptocurrencies, further highlights its utility and reliability.
Integrating the ABCD pattern into a trading strategy provides a methodical and calculated approach to entry and exit decisions. With accurate application of Fibonacci ratios and confirmation of the PRZ, traders can enhance their trading precision, reduce risks, and boost overall performance. The ABCD harmonic pattern remains a valuable resource for traders aiming to leverage structured patterns for consistent results in their technical analysis.

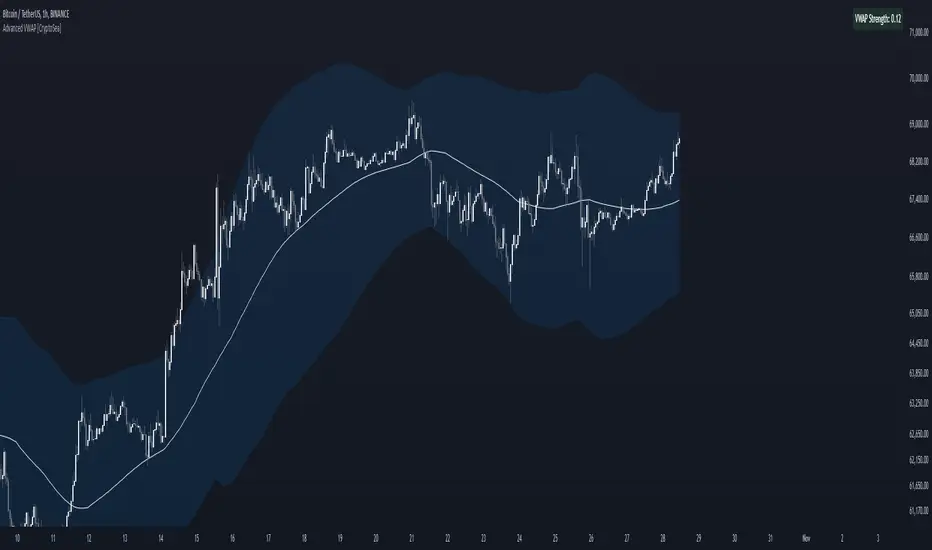
Advanced VWAP [CryptoSea]The Advanced VWAP is a comprehensive volume-weighted average price (VWAP) tool designed to provide traders with a deeper understanding of market trends through multi-layered VWAP analysis. This indicator is ideal for those who want to track price movements in relation to VWAP bands and detect key market levels with greater precision.
Key Features
Multi-Timeframe VWAP Bands: Includes multiple VWAP bands with different lookback periods (5, 10, 25, and 50), allowing traders to observe short-term and long-term price behavior.
Smoothed Band Options: Offers optional smoothing of VWAP bands to reduce noise and highlight significant trends more clearly.
Dynamic Median Line Display: Plots the median line of the VWAP bands, providing a reference for price movements and potential reversal zones.
VWAP Trend Strength Calculation: Measures the strength of the trend based on the price's position relative to the VWAP bands, normalized between -1 and 1 for easier interpretation.
In the example below we can see the VWAP Forecastd Cloud, which consists of multiple layers of VWAP bands with varying lookback periods, creating a dynamic forecast visualization. The cloud structure represents potential future price ranges by projecting VWAP-based bands outward, with darker areas indicating higher density and overlap of the bands, suggesting stronger support or resistance zones. This approach helps traders anticipate price movement and identify areas of potential consolidation or breakout as the price interacts with different layers of the forecast cloud.
How it Works
VWAP Calculation: Utilizes multiple VWAP calculations based on various lookback periods to capture a broad range of price behaviors. The indicator adapts to different market conditions by switching between short-term and long-term VWAP references.
Smoothing Algorithms: Provides the ability to smooth the VWAP bands using different moving average types (SMA, EMA, SMMA, WMA, VWMA) to suit various trading strategies and reduce market noise.
Trend Strength Analysis: Computes the trend strength based on the price's distance from the VWAP bands, with a value range of -1 to 1. This feature helps traders identify the intensity of uptrends and downtrends.
Alert Conditions: Includes alert options for crossing above or below the smoothed median line, as well as touching the smoothed upper or lower bands, providing timely notifications for potential trading opportunities.
This image below illustrates the use of smoothed VWAP bands, which provide a cleaner representation of the price's relationship to the VWAP by reducing market noise. The smoothed bands create a flowing cloud-like structure, making it easier to observe significant trends and potential reversal points. The circles highlight areas where the price interacts with the smoothed bands, indicating potential key levels for trend continuation or reversal. This setup helps traders focus on meaningful movements and filter out minor fluctuations, improving the identification of strategic entry and exit points based on smoother trend signals.
Application
Strategic Entry and Exit Points: Helps traders identify optimal entry and exit points based on the interaction with VWAP bands and trend strength readings.
Trend Confirmation: Assists in confirming trend strength by analyzing price movements relative to the VWAP bands and detecting significant breaks or touches.
Customized Analysis: Supports a wide range of trading styles by offering adjustable smoothing, band settings, and alert conditions to meet specific trading needs.
The Advanced VWAP by is a valuable addition to any trader's toolkit, offering versatile features to navigate different market scenarios with confidence. Whether used for day trading or longer-term analysis, this tool enhances decision-making by providing a robust view of price behavior relative to VWAP levels.
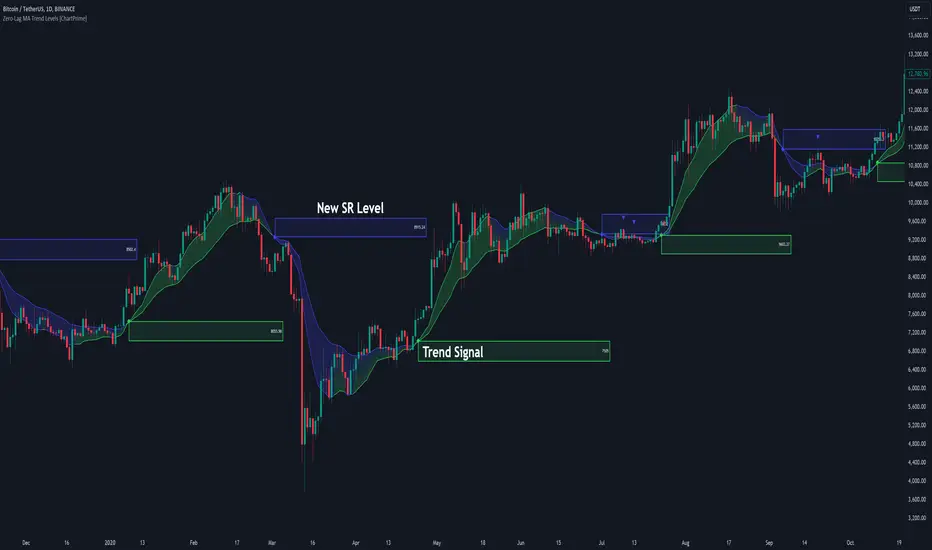
Zero-Lag MA Trend Levels [ChartPrime] The Zero-Lag MA Trend Levels indicator combines a Zero-Lag Moving Average (ZLMA) with a standard Exponential Moving Average (EMA) to provide a dynamic view of the market trend. This indicator uses a color-changing cloud to represent shifts in trend momentum and plots key levels when trend reversals are detected. The addition of trend level boxes helps identify significant price zones where market shifts occur, with retest signals aiding in spotting potential continuation or reversal points.
⯁ KEY FEATURES & HOW TO USE
⯌ Zero-Lag Moving Average (ZLMA) with EMA Cloud :
The indicator employs a Zero-Lag Moving Average (ZLMA) alongside a standard EMA.
series float emaValue = ta.ema(close, length) // EMA of the closing price
series float correction = close + (close - emaValue) // Correction factor for zero-lag calculation
series float zlma = ta.ema(correction, length) // Zero-Lag Moving Average (ZLMA)
The cloud between these averages changes color depending on the trend direction. During a downtrend, if the ZLMA begins to increase, the cloud partially turns green, signaling potential strength. Conversely, during an uptrend, if the ZLMA decreases, the cloud partially turns to the downtrend color (blue by default), indicating potential weakness.
Use : Traders can monitor the cloud's color shifts for early signs of changing momentum. A fully colored cloud aligning with the current trend indicates a strong directional move, while mixed colors suggest a potential trend change.
⯌ Trend Shift and Level Boxes :
Each time a crossover between the EMA and the ZLMA occurs, indicating a trend shift, the indicator plots a box around the price level where the shift occurred. This box remains on the chart to mark the price zone of the trend change.
Use : The boxes provide clear visual markers of where market sentiment shifted. These levels can act as support and resistance zones. Traders can use these boxes to identify potential entry or exit points when the market retests these key levels.
⯌ Retest Detection with Labels :
If the price action crosses a previously plotted trend level box, the indicator marks this event with triangle labels. An upward triangle (▲) appears when the price retests the top of a box during a bullish crossover, and a downward triangle (▼) appears when the price retests the bottom of a box during a bearish crossunder.
Use : These labels help traders identify potential continuation or reversal points at critical price levels, offering additional confirmation for trading decisions.
⯌ Dynamic Color-Coding :
The color of the ZLMA and the EMA is adjusted according to their current trend direction, with the ZLMA adopting green for upward trends and blue for downward trends. This visual representation makes it easier to quickly gauge the market's momentum at a glance.
Use : Traders can use the color-coding to quickly assess the strength and direction of the current trend, allowing for more informed decision-making.
⯁ USER INPUTS
Length : Sets the period for both the ZLMA and EMA calculations.
Trend Levels : Toggle to display the trend level boxes on the chart.
Colors (+ / -) : Define the colors for bullish and bearish trends.
⯁ CONCLUSION
The Zero-Lag MA Trend Levels - ChartPrime indicator offers a nuanced approach to trend detection by combining the ZLMA with a traditional EMA. Its dynamic cloud color changes, trend level boxes, and retest labels make it a versatile tool for traders seeking to identify trend shifts and key price zones effectively. By incorporating elements of support and resistance along with trend momentum, this indicator provides a comprehensive view of market dynamics for both trend-following and counter-trend trading strategies.
Opening Range with Breakouts & Targets [LuxAlgo]Opening Range with Breakouts & Targets is based on the long-standing Opening Range Breakout strategy popularized by traders such as Toby Crabel and Mark Fisher.
This indicator measures and displays the price range created from the first period within a new trading session, along with price breakouts from that range and targets associated with the range width.
🔶 USAGE
The Opening Range (OR) can be a powerful tool for making a clear distinction between ranging and trending trading days. Using a rigid structure for drawing a range, provides a consistent basis to make judgments and comparisons that will better assist the user in determining a hypothesis for the day's price action.
NOTE: During a suspected "Range Day", the Opening Range can be used for reversion strategies, typically targeting the opposite extreme of the range or the mean of the range. However, more commonly the Opening Range is used for breakouts on suspected "Trend Days", targeting further upward or downward market movement.
The common Opening Range Breakout Strategy (ORB) outlines a structure to enter and exit positions based on rigid points determined by the Opening Range. This methodology can be adjusted based on markets or trading styles.
Determine Opening Range High & Low: These are the high and low price within a chosen period of time after the market opens. This can be customized to the user's trading style and preference. Common Ranges are from 5-60 mins.
Watch for a Breakout with Volume: A Breakout occurs when price crosses the OR High (ORH) or OR Low (ORL), an increase in volume is typically desired when witnessing these breakouts to confirm a stronger movement.
Manage Risk: Based on user preference and the appropriately determined amount of risk, multiple ways can be determined to manage risk by using Opening Range.
For Example: A stop-loss could be set at OR Mean (ORM) or the opposite side of the range, while a profit target could optionally be set at the first price target generated by the script.
Alternatively, a user might want to use a Moving Average (MA) as an adaptive stop-loss and use price targets to scale out. These are just 2 examples of the possible options, both capable with this tool.
🔹 Signals
Signals will fire based on the break of the opening range, this is indicated by arrows above and below the range boundaries.
Optionally, a bias can be added to these signals to aid in mitigating false signals by using a directional filter based on the current day's OR relative to the previous day's OR.
Regardless of the signal bias being enabled, the Opening Range Zone will always be colored directionally according to this.
If the current day's OR is above the previous day's OR, the Zone will be Green.
If the current day's OR is below the previous day's OR, the Zone will be Red.
By enabling the signal bias, signals in the opposite direction of the daily bias will fire on the cross of the first target in that direction.
🔹 Targets
In this indicator, targets are not limited and will generate infinitely based on a % width of the Opening Range.
Additionally, there are 2 display methods for these targets.
Extended: Extends the targets to the current bar and displays all targets that have been crossed so far within the session.
Adaptive: Extends only the 2 closest targets surrounding price, allowing for a display consisting of fewer lines at one time.
🔶 DETAILS
🔹 Historical Display
This indicator can be utilized in multiple ways, for use in real-time, and for historical analysis to form methods. Because of this, the indicator has an option to display only the current day's data or the entire historical data. This can also help clean up the chart when it is in use.
🔹 Time Period
The specific time period to create the opening range is entirely up to each user's preference, by default it is set to 30 mins; however, this time period can be edited with full control if desired.
Simply toggle on the "Custom Range" and input a range of time to create the range.
🔹 Session Moving Average
The Session Moving Average is a common Moving Average, which resets at the beginning of a new session. This allows for an unbiased MA that was created entirely from the current session's price action.
Note: The start of the session is determined by the start of the Opening Range if using a custom range of time.
🔶 SETTINGS
Show Historical Data: Choose to display only the current session's data or the full history of data.
Opening Range Time Period: Select the time period to form the opening range from. This operates on Session Start, so it will change with the chart.
Custom Range: Opt for a custom Range by enabling this and inputting your range times as well as your needed timezone.
Breakout Signal Bias: Select if the Breakout Signals will use a Daily Directional Bias for firing.
Target % of Range: Sets the % of the Range width that will be used as an increment for the Targets to display in.
Target Cross Source: Choose to use the Close price or High/Low price as the crossing level for Target displays. When this source crosses a target it will generate more targets.
Target Display: Choose which style of display to use for targets.
Session Moving Average: Optionally enable a Moving average of your choice that resets at the beginning of each session (start of opening range).

ETH Signal 15m
This strategy uses the Supertrend indicator combined with RSI to generate buy and sell signals, with stop loss (SL) and take profit (TP) conditions based on ATR (Average True Range). Below is a detailed explanation of each part:
1. General Information BINANCE:ETHUSDT.P
Strategy Name: "ETH Signal 15m"
Designed for use on the 15-minute time frame for the ETH pair.
Default capital allocation is 15% of total equity for each trade.
2. Backtest Period
start_time and end_time: Define the start and end time of the backtest period.
start_time = 2024-08-01: Start date of the backtest.
end_time = 2054-01-01: End date of the backtest.
The strategy will only run when the current time falls within this specified range.
3. Supertrend Indicator
Supertrend is a trend-following indicator that provides buy or sell signals based on the direction of price changes.
factor = 2.76: The multiplier used in the Supertrend calculation (increasing this value makes the Supertrend less sensitive to price movements).
atrPeriod = 12: Number of periods used to calculate ATR.
Output:
direction: Determines the buy/sell direction based on Supertrend.
If direction decreases, it signals a buy (Long).
If direction increases, it signals a sell (Short).
4. RSI Indicator
RSI (Relative Strength Index) is a momentum indicator, often used to identify overbought or oversold conditions.
rsiLength = 12: Number of periods used to calculate RSI.
rsiOverbought = 70: RSI level considered overbought.
rsiOversold = 30: RSI level considered oversold.
5. Entry Conditions
Long Entry:
Supertrend gives a buy signal (ta.change(direction) < 0).
RSI must be below the overbought level (rsi < rsiOverbought).
Short Entry:
Supertrend gives a sell signal (ta.change(direction) > 0).
RSI must be above the oversold level (rsi > rsiOversold).
The strategy will only execute trades if the current time is within the backtest period (in_date_range).
6. Stop Loss (SL) and Take Profit (TP) Conditions
ATR (Average True Range) is used to calculate the distance for Stop Loss and Take Profit based on price volatility.
atr = ta.atr(atrPeriod): ATR is calculated using 12 periods.
Stop Loss and Take Profit are calculated as follows:
Long Trade:
Stop Loss: Set at close - 4 * atr (current price minus 4 times the ATR).
Take Profit: Set at close + 2 * atr (current price plus 2 times the ATR).
Short Trade:
Stop Loss: Set at close + 4 * atr (current price plus 4 times the ATR).
Take Profit: Set at close - 2.237 * atr (current price minus 2.237 times the ATR).
Summary:
This strategy enters a Long trade when the Supertrend indicates an upward trend and RSI is not in the overbought region. Conversely, a Short trade is entered when Supertrend signals a downtrend, and RSI is not oversold.
The trade is exited when the price reaches the Stop Loss or Take Profit levels, which are determined based on price volatility (ATR).
Disclaimer:
The content provided in this strategy is for informational and educational purposes only. It is not intended as financial, investment, or trading advice. Trading in cryptocurrency, stocks, or any financial markets involves significant risk, and you may lose more than your initial investment. Past performance is not indicative of future results, and no guarantee of profit can be made. You should consult with a professional financial advisor before making any investment decisions. The creator of this strategy is not responsible for any financial losses or damages incurred as a result of following this strategy. All trades are executed at your own risk.

RSI Buy/Sell SignalsThis Pine Script is designed to plot Buy and Sell signals based on the Relative Strength Index (RSI) for both 15-minute and hourly timeframes. It calculates the RSI values for the current 15-minute chart and requests the hourly RSI data for comparison. Buy signals are generated when the RSI crosses above 60 in either timeframe, while sell signals occur when the RSI crosses below 40. The script also plots visual markers on the chart, indicating buy signals with green labels below the price bars and sell signals with red labels above the price bars. Additionally, it allows for alert conditions, notifying the user when a buy or sell signal is triggered.

True Strength Index with Buy/Sell Signals and AlertsThe True Strength Index (TSI) is a momentum oscillator that helps traders identify trends and potential reversal points in the market. Here’s how it works:
1. **Price Change Calculation**:
- **`pc = ta.change(price)`**: This calculates the change in price (current price minus the previous price).
2. **Double Smoothing**:
- **`double_smooth(src, long, short)`**: This function smooths the price change data twice using two Exponential Moving Averages (EMAs):
- The first EMA smooths the raw data.
- The second EMA smooths the result of the first EMA.
- **`double_smoothed_pc`**: The double-smoothed price change.
- **`double_smoothed_abs_pc`**: The double-smoothed absolute price change, which helps normalize the TSI value.
3. **TSI Calculation**:
- **`tsi_value = 100 * (double_smoothed_pc / double_smoothed_abs_pc)`**: This calculates the TSI by dividing the double-smoothed price change by the double-smoothed absolute price change, then multiplying by 100 to scale the value.
- The TSI oscillates around the zero line, indicating momentum. Positive values suggest bullish momentum, while negative values suggest bearish momentum.
4. **Signal Line**:
- **`signal_line = ta.ema(tsi_value, signal)`**: This creates a signal line by applying another EMA to the TSI value. The signal line is typically used to identify entry and exit points.
5. **Buy and Sell Signals**:
- **Buy Signal**: Occurs when the TSI crosses above the signal line (`ta.crossover(tsi_value, signal_line)`), indicating that bullish momentum is strengthening, which might suggest a buying opportunity.
- **Sell Signal**: Occurs when the TSI crosses below the signal line (`ta.crossunder(tsi_value, signal_line)`), indicating that bearish momentum is strengthening, which might suggest a selling opportunity.
6. **Visual Representation**:
- The TSI line and the signal line are plotted on the chart.
- Buy signals are marked with green "BUY" labels below the bars, and sell signals are marked with red "SELL" labels above the bars.
**How to Use It**:
- **Trend Identification**: When the TSI is above zero, it suggests an uptrend; when it's below zero, it suggests a downtrend.
- **Buy/Sell Signals**: Traders often enter a buy trade when the TSI crosses above the signal line and enter a sell trade when the TSI crosses below the signal line.
- **Divergences**: TSI can also be used to spot divergences between the indicator and price action, which can signal potential reversals.
The TSI is particularly useful in identifying the strength of a trend and the potential turning points, making it valuable for trend-following and swing trading strategies.

Sniper Signal- Description
The Sniper Signal is a sophisticated technical indicator designed for traders seeking to maximize accuracy in identifying key turning points within a market. This indicator is built on a dual approach, combining the power of the Wave Trend Momentum Oscillator (WTMO) with the robustness of a long-term Simple Moving Average (SMA), making it an ideal tool for trading in dynamic and trending market environments.
The WTMO is known for its ability to capture momentum and underlying price direction, providing early signals of trend changes. By smoothing price movements using an exponential moving average (EMA), the WTMO accurately identifies when price is overextending in one direction, which may precede a reversal.
The 100-period SMA acts as a critical trend filter, ensuring that trades are only made in the direction of the prevailing market flow. This approach ensures that signals generated by the WTMO align with the long-term trend, filtering out false signals that can appear in sideways or low volatility markets.
The Sniper Signal is not just an indicator that marks entries and exits; it is a complete strategy in itself, designed for traders who understand the importance of trading in the direction of the prevailing trend. Buy signals are generated only when momentum is at its lowest point (WT1 < -5) and the price is supported by a confirmed uptrend (price above the SMA). Conversely, sell signals are only triggered when momentum is at extremely high levels (WT1 > 5) and the market shows clear signs of weakness (price below the SMA).
This combination of momentum and trend analysis creates a balanced approach that allows traders to capture significant moves in the market, while minimizing exposure to unnecessary risk. The Sniper Signal is particularly effective in markets with well-defined trends, where the key to success lies in entering the market at optimal points and exiting before a significant reversal occurs.
In summary, the Sniper Signal is an advanced tool designed for serious traders looking to take advantage of the combination of momentum and trend to execute high probability trades in moving markets.
- How to use the script?
The Sniper Signal indicator code is written in Pine Script, the native programming language of TradingView. To use this indicator, users must copy the code and paste it into the Pine Script editor within the TradingView platform. Once they have done this, they can save and add the script to their chart to begin displaying buy and sell signals directly on their price charts.
When using the Sniper Signal, traders should pay attention to the signals represented by the triangles on the chart: an upward-facing blue triangle indicates a possible buying opportunity, while a downward-facing red triangle suggests a possible selling opportunity. It is crucial that users also watch the 100-period Simple Moving Average (SMA), shown as a gray line on the chart, to ensure that trades align with the overall market trend. This helps filter out less reliable signals and improves the accuracy of trading decisions.
- Open-source reuse
The indicator code is based on common and widely used concepts in technical analysis, such as the Wave Trend Momentum Oscillator (WTMO) and the Simple Moving Average (SMA). These components are not proprietary and are part of the general knowledge in the trading community, which means that many developers can create their own versions based on these same principles.

Ehlers Band-Pass FilterHeyo,
This indicator is an original translation from Ehlers' book "Cycle Analytics for Traders Advanced".
First, I describe the indicator as usual and later you can find a very insightful quote of the book.
Key Features
Signal Line: Represents the output of the band-pass filter, highlighting the dominant cycle in the data.
Trigger Line: A leading indicator derived from the signal line, providing early signals for potential market reversals.
Dominant Cycle: Measures the dominant cycle period by counting the number of bars between zero crossings of the band-pass filter output.
Calculation:
The band-pass filter is implemented using a combination of high-pass and low-pass filters.
The filter's parameters, such as period and bandwidth, can be adjusted to tune the filter to specific market cycles.
The signal line is normalized using an Automatic Gain Control (AGC) to provide consistent amplitude regardless of price swings.
The trigger line is derived by applying a high-pass filter to the signal line, creating a leading
waveform.
Usage
The indicator is effective in identifying peaks and valleys in the market data.
It works best in cyclic market conditions and may produce false signals during trending periods.
The dominant cycle measurement helps traders understand the prevailing market cycle length, aiding in better decision-making.
Quoted from the Book
Band-Pass Filters
“A little of the data narrowly passed,” said Tom broadly.
Perhaps the least appreciated and most underutilized filter in technical analysis is the band-pass filter. The band-pass filter simultaneously diminishes the amplitude at low frequencies, qualifying it as a detrender, and diminishes the amplitude at high frequencies, qualifying it as a data smoother.
It passes only those frequency components from input to output in which the trader is interested. The filtering produced by a band-pass filter is superior because the rejection in the stop bands is related to its bandwidth. The degree of rejection of undesired frequency components is called selectivity. The band-stop filter is the dual of the band-pass filter. It rejects a band of frequency components as a notch at the output and passes all other frequency components virtually unattenuated. Since the bandwidth of the deep rejection in the notch is relatively narrow and since the spectrum of market cycles is relatively broad due to systemic noise, the band-stop filter has little application in trading.
Measuring the Cycle Period
The band-pass filter can be used as a relatively simple measurement of the dominant cycle.
A cycle is complete when the waveform crosses zero two times from the last zero crossing. Therefore, each successive zero crossing of the indicator marks a half cycle period. We can establish the dominant cycle period as twice the spacing between successive zero crossings.
When we measure the dominant cycle period this way, it is best to widen the pass band of the band-pass filter to avoid distorting the measurement simply due to the selectivity of the filter. Using an input bandwidth of 0.7 produces an octave-wide pass band. For example, if the center period of the filter is 20 and the relative bandwidth is 0.7, the bandwidth is 14. That means the pass band of the filter extends from 13-bar periods to 27-bar periods.
That is, roughly an octave exists because the longest period is twice the shortest period of the pass band. It is imperative that a high-pass filter is tuned one octave below the half-bandwidth edge of the band-pass filter to ensure a nominal zero mean of the filtered output. Without a zero mean, the zero crossings can have a substantial error.
Since the measurement of the dominant cycle can vary dramatically from zero crossing to zero
crossing, the code limits the change between measurements to be no more than 25 percent.
While measuring the changing dominant cycle period via zero crossings of the band-pass waveform is easy, it is not necessarily the most accurate method.
Best regards,
simwai
Good Luck with your trading! 🙌

long&short signal Smart Money Concepts (SMC) with MACD Signals Smart Money Concepts (SMC) with MACD Signals
Advanced SMC and MACD Integration for Precision Trading
The "Smart Money Concepts (SMC) with MACD Signals" indicator is a powerful and versatile tool designed to enhance trading strategies by integrating two highly effective technical analysis methods into a single, cohesive indicator. This advanced script combines the Smart Money Concepts (SMC) methodology with the Moving Average Convergence Divergence (MACD) indicator to provide traders with a comprehensive trading solution that identifies key market trends and potential trading opportunities.
What It Does:
Smart Money Concepts (SMC):
The SMC component of this indicator identifies significant price levels and zones where market participants, particularly institutional investors, may be active. It calculates high and low anchor levels based on historical price data, creating zones that help traders understand where price action may encounter support or resistance. These anchor levels are used to plot background colors on the chart, highlighting critical areas of interest where price might react, and generating buy (long) and sell (short) signals based on price interactions with these levels.
MACD (Moving Average Convergence Divergence):
The MACD component provides insights into market momentum and trend strength. By calculating the difference between two moving averages and comparing it to a signal line, the MACD indicator helps traders identify potential changes in trend direction. The script plots the MACD line, signal line, and histogram, offering a clear visual representation of market momentum. Buy (long) and sell (short) signals are generated when the MACD line crosses above or below the signal line, providing timely alerts to potential trading opportunities.
Why It’s Special:
This indicator stands out for its dual functionality, combining the price level analysis of SMC with the momentum-based insights of MACD. The integration allows traders to benefit from both trend and price level analysis, offering a more robust and accurate trading tool. The SMC component highlights critical price zones and provides context for price action, while the MACD component confirms the strength and direction of market trends.
By using this combined approach, traders can make more informed decisions based on comprehensive market analysis. The indicator not only helps in identifying significant price levels and potential market reversals but also provides real-time signals to capitalize on these opportunities. Whether you are a day trader or a swing trader, the "Smart Money Concepts (SMC) with MACD Signals" indicator is designed to enhance your trading strategy with precision and clarity.
This unique combination of SMC and MACD offers a powerful toolset for traders looking to refine their trading strategies and improve their market analysis. With its user-friendly visualizations and signal generation, this indicator is an essential addition to any trader’s toolkit.

Polynomial Regression Keltner Channel [ChartPrime]Polynomial Regression Keltner Channel
⯁ OVERVIEW
The Polynomial Regression Keltner Channel [ ChartPrime ] indicator is an advanced technical analysis tool that combines polynomial regression with dynamic Keltner Channels. This indicator provides traders with a sophisticated method for trend analysis, volatility assessment, and identifying potential overbought and oversold conditions.
◆ KEY FEATURES
Polynomial Regression: Uses polynomial regression for trend analysis and channel basis calculation.
Dynamic Keltner Channels: Implements Keltner Channels with adaptive volatility-based bands.
Overbought/Oversold Detection: Provides visual cues for potential overbought and oversold market conditions.
Trend Identification: Offers clear trend direction signals and change indicators.
Multiple Band Levels: Displays four levels of upper and lower bands for detailed market structure analysis.
Customizable Visualization: Allows toggling of additional indicator lines and signals for enhanced chart analysis.
◆ FUNCTIONALITY DETAILS
⬥ Polynomial Regression Calculation:
Implements a custom polynomial regression function for trend analysis.
Serves as the basis for the Keltner Channel, providing a smoothed centerline.
//@function Calculates polynomial regression
//@param src (series float) Source price series
//@param length (int) Lookback period
//@returns (float) Polynomial regression value for the current bar
polynomial_regression(src, length) =>
sumX = 0.0
sumY = 0.0
sumXY = 0.0
sumX2 = 0.0
sumX3 = 0.0
sumX4 = 0.0
sumX2Y = 0.0
n = float(length)
for i = 0 to n - 1
x = float(i)
y = src
sumX += x
sumY += y
sumXY += x * y
sumX2 += x * x
sumX3 += x * x * x
sumX4 += x * x * x * x
sumX2Y += x * x * y
slope = (n * sumXY - sumX * sumY) / (n * sumX2 - sumX * sumX)
intercept = (sumY - slope * sumX) / n
n - 1 * slope + intercept
⬥ Dynamic Keltner Channel Bands:
Calculates ATR-based volatility for dynamic band width adjustment.
Uses a base multiplier and adaptive volatility factor for flexible band calculation.
Generates four levels of upper and lower bands for detailed market structure analysis.
atr = ta.atr(length)
atr_sma = ta.sma(atr, 10)
// Calculate Keltner Channel Bands
dynamicMultiplier = (1 + (atr / atr_sma)) * baseATRMultiplier
volatility_basis = (1 + (atr / atr_sma)) * dynamicMultiplier * atr
⬥ Overbought/Oversold Indicator line and Trend Line:
Calculates an OB/OS value based on the price position relative to the innermost bands.
Provides visual representation through color gradients and optional signal markers.
Determines trend direction based on the polynomial regression line movement.
Generates signals for trend changes, overbought/oversold conditions, and band crossovers.
◆ USAGE
Trend Analysis: Use the color and direction of the basis line to identify overall trend direction.
Volatility Assessment: The width and expansion/contraction of the bands indicate market volatility.
Support/Resistance Levels: Multiple band levels can serve as potential support and resistance areas.
Overbought/Oversold Trading: Utilize OB/OS signals for potential reversal or pullback trades.
Breakout Detection: Monitor price crossovers of the outermost bands for potential breakout trades.
⯁ USER INPUTS
Length: Sets the lookback period for calculations (default: 100).
Source: Defines the price data used for calculations (default: HLC3).
Base ATR Multiplier: Adjusts the base width of the Keltner Channels (default: 0.1).
Indicator Lines: Toggle to show additional indicator lines and signals (default: false).
⯁ TECHNICAL NOTES
Implements a custom polynomial regression function for efficient trend calculation.
Uses dynamic ATR-based volatility adjustment for adaptive channel width.
Employs color gradients and opacity levels for intuitive visual representation of market conditions.
Utilizes Pine Script's plotchar function for efficient rendering of signals and heatmaps.
The Polynomial Regression Keltner Channel indicator offers traders a sophisticated tool for trend analysis, volatility assessment, and trade signal generation. By combining polynomial regression with dynamic Keltner Channels, it provides a comprehensive view of market structure and potential trading opportunities. The indicator's adaptability to different market conditions and its customizable nature make it suitable for various trading styles and timeframes.

Predictive Order Blocks [CryptoSea]The Predictive Order Blocks Indicator is a unique and innovative tool that enhances market analysis by identifying support and resistance blocks based on standard deviations from a median line. Unlike traditional indicators that rely solely on the close price, this indicator leverages the median line and standard deviations to form areas of interest, rather than targeting a single price point. This approach provides a more accurate representation of market structure, especially during periods of consolidation and expansion.
Key Features
Multi-Term Length Analysis: The indicator offers short, medium, and long-term settings, allowing traders to customise the analysis based on their preferred trading strategy and timeframe. This flexibility ensures that the tool is adaptable to various market conditions and trading styles.
Standard Deviation-Based Order Blocks: The core functionality of the indicator revolves around calculating standard deviations from a median line to form support and resistance blocks. These blocks provide a clearer and more reliable picture of market structure compared to single-point levels. By focusing on areas rather than exact price levels, the indicator helps traders identify zones where price is likely to react, leading to more informed trading decisions.
Dynamic Box Creation: The indicator dynamically creates breakout boxes based on user-selected standard deviation ranges. These boxes are formed at the start of market expansion following periods of consolidation. This feature is particularly useful because it highlights key levels where price is likely to retrace after breaking out, providing traders with actionable insights during market transitions.
Proximity-Based Gradient Colors: The indicator features gradient colors that change based on the price's proximity to the standard deviation bands. This visual aid helps traders quickly assess the current market condition and the potential significance of the support and resistance blocks.
Adaptive Display Options: To accommodate different trading preferences, the indicator includes options to toggle the display of the trend line (median line) and the standard deviation bands. This flexibility allows traders to customise their chart view to match their analysis style, whether they prefer a more clutter-free view or a detailed breakdown of market levels.
In the example below, the indicator shows the bands compressing during a period of consolidation, highlighting the potential for a breakout.
How it Works
Median Line Calculation: The indicator calculates the median line using a user-defined period. This line serves as the central reference point from which the standard deviations are calculated. By using the median line instead of just the close price, the indicator provides a more stable and reliable baseline for identifying support and resistance areas.
Standard Deviation Bands: Around the median line, the indicator calculates multiple standard deviation bands. These bands represent areas where price is statistically likely to find support or resistance. By focusing on these areas, traders can better anticipate where price might react, rather than relying on arbitrary levels.
Dynamic Box Creation and Expansion Detection: The indicator monitors the compression and expansion of the standard deviation bands. During periods of low volatility (squeeze), the bands compress, indicating consolidation. Once the bands start expanding, it signals the potential for a breakout. At this point, the indicator dynamically creates predictive order blocks based on the selected standard deviation range. These blocks highlight key levels where price might retrace or react, providing traders with valuable entry and exit points.
Color-Coded Proximity Alerts: To further enhance usability, the indicator uses color gradients to indicate how close the current price is to the calculated bands. This visual representation helps traders quickly assess the potential significance of the price's current position relative to the support and resistance areas.
In the example below, the indicator shows the bands expanding with the price, triggering the formation of the predictive order block.
In the final example, the price retraces into the order block before bouncing back to the upside, demonstrating the effectiveness of the identified support area.
Alerts
Trend Line Alerts: The indicator provides alerts when the price crosses above or below the trend line (median line). This feature is crucial for traders looking to identify potential trend changes early, allowing them to act quickly on emerging opportunities.
Band Alerts: Alerts are also triggered when the price crosses above or below the upper or lower bands for each standard deviation level. This helps traders identify potential breakout or breakdown scenarios, ensuring they are notified of significant market movements as they happen.
Customisable Alert Conditions: To cater to different trading strategies, the indicator allows users to set alert conditions for each standard deviation band and the trend line. This level of customisation ensures that traders receive alerts that are relevant to their specific trading style and market analysis.
Application
Strategic Decision-Making: The Predictive Order Blocks Indicator assists traders in making informed decisions by providing detailed analysis of potential breakout zones. By identifying key support and resistance areas, the indicator helps traders plan their entries and exits with greater precision.
Trend Confirmation: The indicator reinforces trading strategies by identifying key levels where price is likely to react. This confirmation is crucial for traders looking to enter trades with higher confidence.
Customized Analysis: The indicator adapts to various trading styles with extensive input settings that control the display and calculation of order blocks. Whether you're a day trader, swing trader, or long-term investor, the indicator can be tailored to meet your specific needs.
Visual Clarity: With customizable color settings and display options, the indicator enhances chart readability, allowing traders to quickly and easily interpret market data.
The Predictive Order Blocks Indicator by CryptoSea is an invaluable addition to a trader's toolkit, offering depth and precision in market trend analysis to navigate complex market conditions effectively.

Ultimate Bands [BigBeluga]Ultimate Bands
The Ultimate Bands indicator is an advanced technical analysis tool that combines elements of volatility bands, oscillators, and trend analysis. It provides traders with a comprehensive view of market conditions, including trend direction, momentum, and potential reversal points.
🔵 KEY FEATURES
● Ultimate Bands
Consists of an upper band, lower band, and a smooth middle line
Based on John Ehler's SuperSmoother algorithm for reduced lag
Bands are calculated using Root Mean Square Deviation (RMSD) for adaptive volatility measurement
Helps identify potential support and resistance levels
● Ultimate Oscillator
Derived from the price position relative to the Ultimate Bands
Oscillates between overbought and oversold levels
Provides insights into potential reversals and trend strength
● Trend Signal Line
Based on a Hull Moving Average (HMA) of the Ultimate Oscillator
Helps identify the overall trend direction
Color-coded for easy trend interpretation
● Heatmap Visualization
Displays the current state of the oscillator and trend signal
Provides an intuitive visual representation of market conditions
Shows overbought/oversold status and trend direction at a glance
● Breakout Signals
Optional feature to detect and display breakouts beyond the Ultimate Bands
Helps identify potential trend reversals or continuations
Visualized with arrows on the chart and color-coded candles
🔵 HOW TO USE
● Trend Identification
Use the color and position of the Trend Signal Line to determine the overall market trend
Refer to the heatmap for a quick visual confirmation of trend direction
● Entry Signals
Look for price touches or breaks of the Ultimate Bands for potential entry points
Use oscillator extremes in conjunction with band touches for stronger signals
Consider breakout signals (if enabled) for trend-following entries
● Exit Signals
Use opposite band touches or breakouts as potential exit points
Monitor the oscillator for divergences or extreme readings as exit signals
● Overbought/Oversold Analysis
Use the Ultimate Oscillator and heatmap to identify overbought/oversold conditions
Look for potential reversals when the oscillator reaches extreme levels
● Confirmation
Combine Ultimate Bands, Oscillator, and Trend Signal for stronger trade confirmation
Use the heatmap for quick visual confirmation of market conditions
🔵 CUSTOMIZATION
The Ultimate Bands indicator offers several customization options:
Adjust the main calculation length for bands and oscillator
Modify the number of standard deviations for band calculation
Change the signal line length for trend analysis
Toggle the display of breakout signals and candle coloring
By fine-tuning these settings, traders can adapt the Ultimate Bands indicator to various market conditions and personal trading strategies.
The Ultimate Bands indicator provides a multi-faceted approach to market analysis, combining volatility-based bands, oscillator analysis, and trend identification in one comprehensive tool. Its adaptive nature and visual cues make it suitable for both novice and experienced traders across various timeframes and markets. The integration of multiple analytical elements offers traders a rich set of data points to inform their trading decisions.
