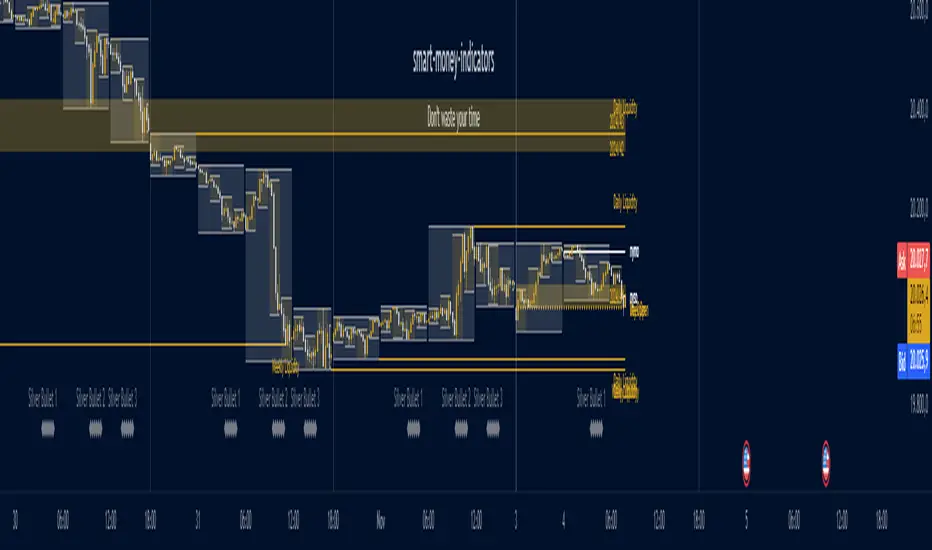
Ultimate ICT [smart-money-indicators]This indicator is a tool to support the "ICT" strategy.
This indicator does not provide entry or exit signals.
This indicator is a tool to mark key price areas.
This indicator is a tool to mark key time areas.
This indicator is particularly distinguished by its high customizability of tools,
setting it apart from the indicators currently available on the TradingView platform.
The following key areas are marked with the help of lines, boxes, background color, or plots:
Time Separators:
- Monthly separator
- Weekly separator
- Daily separator
Liquidity Zones:
- Daily highs/lows
- Weekly highs/lows
- Monthly highs/lows
- Asia Session (during or after the session)
- London Session (during or after the session)
- New York Session (during or after the session)
- London Close Session (during or after the session)
- Session Quarters
- Central Banks Dealer Range
Opening Prices/Average Prices:
- Weekly opening price
- New Week Open Gap
- Daily opening price
- Premium/Discount zone of the day (50% line)
- New York Midnight Open price
- New York Session Open price
Manipulation Times:
- 3 Silver Bullet times
- Macros
How can I use or interpret these areas?
Liquidity Zones:
The liquidity zones used here are time-based.
Liquidity zones can be used, depending on the reaction, either to confirm the continuation of the current trend
or as a signal for a reversal of the current trend.
Opening Prices/Average Prices:
These can be used as separators between the premium and discount zones.
If the price is below one of these values, you are in the discount zone and might look for buy signals.
If the price is above one of these values, you are in the premium zone and might look for sell signals.
在腳本中搜尋"smart"

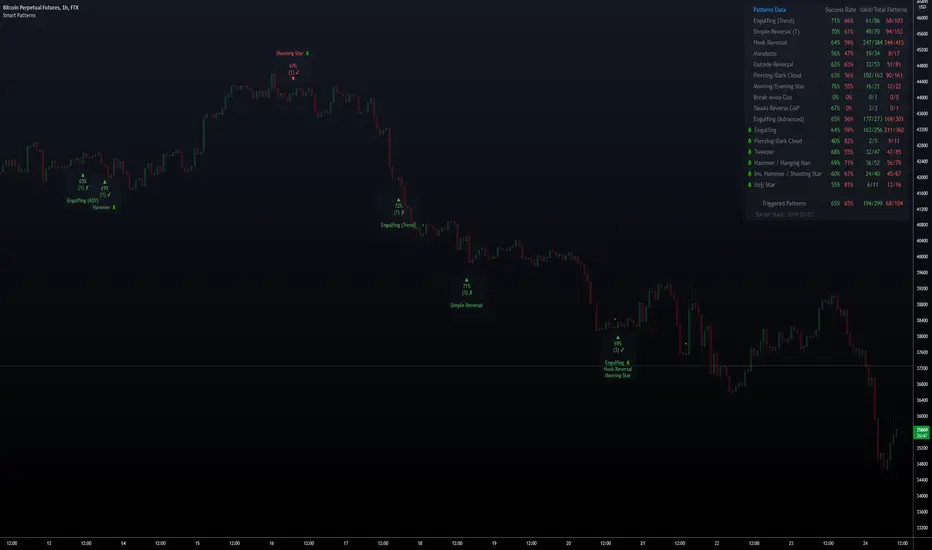
Smart PatternsHi Traders, and welcome to Smart Patterns.
Patterns can be very profitable, yet hard to trade, even when combined with other indicators and techniques. This script aims to increase the accuracy of signals by adding a statistical approach to candle patterns, along with tools to filter them.
For example, if the Success Rate is above a certain threshold, it means that the pattern has resulted in a higher ratio of profitable trades and hence it has a higher likelihood of succeeding in the current market conditions. However, should that pattern fall below the desired Success Rate, the script will "hide" it and won't trigger a signal, but still keeping track of its performance to start firing it again when coming back above the Success Rate.
Key Features
The script features custom patterns as well as some of TradingView's built-in patterns. Not all patterns can be added of course, but let me know if I missed other interesting ones and I will do my best to add them in future updates.
When a Pattern reaches the Min. Target % within the Candles Range selected, it is then considered valid. Please remember that doesn't take into account possible draw-downs or stop-losses.
Patterns are constantly evaluated inside the script; when a pattern's overall score (Success Rate %) is below the required minimum, the signal won't be triggered. However, the script will keep monitoring it in the background, and trigger a signal again when its score comes back above the minimum Success Rate.
The Patterns' signals can be filtered by Success Rate, Minimum Patterns detected and candle size (calculated via ATR).
The Data Panel will show individual statistics for Enabled Patterns as well as final statistics for Triggered Patterns.
Tooltips in the settings panel will further explain available options.
Alerts: simple alerts can be added by selecting "any alert() function call" when adding an Alert. Customizable alerts can also be created through dropdown menu ( Bullish \ Bearish Patterns Detected).
Fully customizable to adapt to light and dark themes
Notes and Recommendations
Always be realistic when tweaking settings, making sure the output makes sense in a normal trading environment. Statistics are helpful but shouldn't be the only factor to base your decisions on - even if a pattern reaches 100% Success Rate, it doesn't mean it will keep being profitable.
Since the script crunches quite some data it may give output errors especially if settings are not properly tweaked - or if the filters are too liberal (e.g. Min Target % set to 0.1) - hence triggering lots of signals. Please adjust the settings or enable only the Patterns you are trading.
If the script gives the error "Too many drawings, cannot clean oldest" it means your settings give too many signals and that is usually not a good sign - it's recommended to double-check your settings as mentioned above.
Credits
Trading View for built-in patterns
Special thanks go to PineCoders community for their incredible efforts and learning material to help mastering PineScript!
Smart Bottom SignalThis indicator is used to find temporary bottoms that are validated with a subsequent candle that closes above the high. The indicator is based on elliott wave theory and tries to signal entries on wave lows. It triggers off of code from " TD D-Wave" 0, 2, 4, A, and C bull wave lows by finding a candle with a close higher that the high of the lowest wave candle or the high of a bullish candle that first breaks above the 8EMA. Green arrows will plot on close indicating that the indicator was triggered.
There are 3 options for display of plots provided:
ShowSmartSigs - This is defaulted to true (display) and allows users to toggle the green arrow alert plots on/off that appear below the candle when triggered.
ShowOnOffPlots - This is logic I use to signal a downturn/upturn and is indicated by red/green arrows appearing above the trigger candle.
ShowBounceSigs - This is defaulted to false and would show as an orange arrow under a candle where a bullish candle first climbs above the 8EMA when ShowOnOffPlots is signaling a downturn and SlowtSochastics is below 21. The SlowStochastics settings are adjustable on the settings screen and default to 21,3.
Alerts Available:
"Smart Buy Bounce" - This alert fires when the ShowSmartSigs signal is triggered.
"Buy Bounce" - This alert fires when the ShowBounceSigs signal is triggered.
"Turn Off Bots"/"Turn On Bots" - This alert fires when the ShowOnOffPlots signals are triggered. I use this to turn off shorter timeframe (15m-1H) bots during a prolonged price drop.
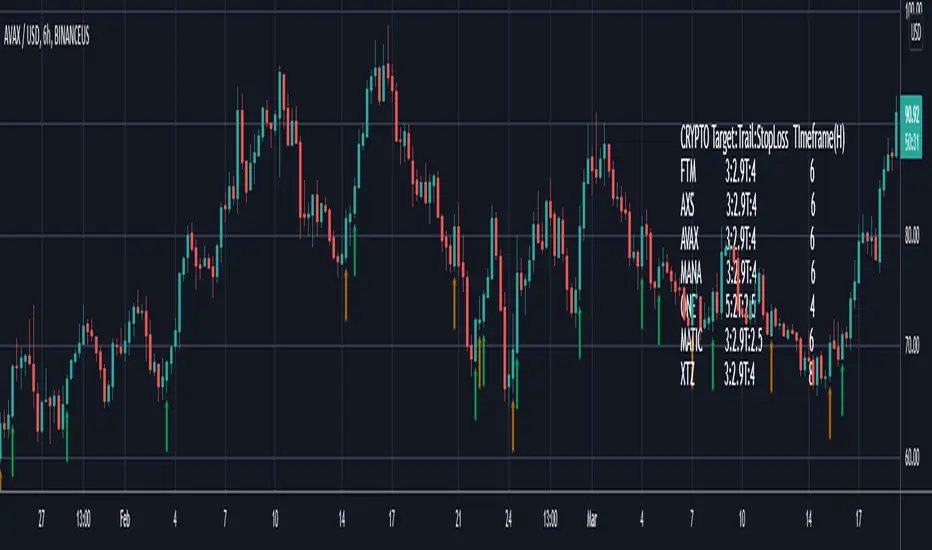
This is an early prototype that is filtered to the following tested cryptos against the specified chart timeframes and using the expressed target/trail/stoploss logic.
CRYPTO Target:Trail:StopLoss TImeframe(H)
FTM 3:2.9T:4 6
AXS 3:2.9T:4 6
AVAX 3:2.9T:4 6
MANA 3:2.9T:4 6
ONE 5:2T:2.5 4
MATIC 3:2.9T:2.5 6
XTZ 3:2.9T:4 8
Smart RebalanceThis script is based on the portfolio rebalancing strategy. It's designed to work with cryptocurrencies, but it can work with any market.
How portfolio rebalance works?
Let's assume your initial capital is $1000, and you want to distribute it into 4 coins. This script takes the USDT as the stable coin for the initial money, so in case you want other currency, the pairs must be with that fiat as the quote.
Following our example, you would take BTC, ETH, BNB, and FTT. After selecting the coins, it's time to choose how much allocation is on each. Let's put 25% on each. This way, $250 of our capital on each coin.
After selecting the coins and their allocation, you choose the price change ratio for rebalancing. Let's use 1%. Next, you start to watch the markets. The first thing that happens, following our example, is the BTCUSDT price moving 1% up.
That amount hit the ratio of 1% for the rebalance. Hence, you sell 1% of BTC for USDT and redistribute to the other coins, buying 0.25% of each currency to rebalance the portfolio.
Next, ETHUSDT goes 1% down, time to rebalance again. This time, you need to take 0.33% of each other coin and buy ETH, so this way, it's all divided as the chosen allocation.
Why use rebalancing?
Looks easy, right? It is, but very time demanding. Demands even more if you raise the number of coins you want to distribute. Having a system to do that automatically is a must to work efficiently. Rebalancing spreads the risk among multiple currencies. This way, you earn small when it goes up, but you lose small when it goes down.
What this script helps with portfolio rebalance?
This indicator will not buy/sell for you but will help you choose the best markets for your rebalancing. Which coin will work best in that period? Do I need to have more than 8 coins? How much must be my ratio? Those questions you can answer using this indicator.
What this script has?
Start and End dates
The script will work for a certain period. All calculations will be done in that period.
Coin Ratio %
The amount of price movement of each asset that will be used to calculate the rebalancing
Initial Capital and Broker Fee
The amount of capital to be used on the rebalancing and the broker fee you want to use the strategy. The cost will be applied on every trade, buying or selling the coins.
Assets, allocations, and colors
It's possible to select from 2 to 10 assets to be used on the portfolio. Each purchase must have the allocation %. Suppose the sum of the allocations is different from 100%. In that case, a warning message will appear on the chart instead of the statistics.
Panel and tooltips
There is a panel with a summary of the results
Set allocations automatically
There is an option to make the indicator use the daily asset volume from the day before to determine the allocation percentage of each asset. This option is better if you are unsure how much allocation you want to use on each coin.
Use this indicator as a backtest for your rebalancing strategy. The selected market on the chart will not affect the calculation on this indicator, but the time frame will. The higher the time frame, the higher the coin ratio % must be.
About the code
The code is written to use arrays to store the values of each asset, making the calculations on each candle inside the time range. The for-loops are used to reduce the code length and make it easy to change the analysis of all assets. Finally, the script has some comments on the code.

Smart Swing Strategy for StockSpecial indicator for stock but you can try another instrument.
Trend determination and buy/sell signals are using the Alligator system from Bill Williams .
To get maximum profit, the system uses the trailing stop technique using Average True Range (ATR) with 4 moving average options (RMA, SMA , EMA , WMA ).
Please leave comments if any opinions.
Disclaimer
The content is in any event provided with the intention of being for general circulation and availability only. As such it is not intended to and does not form part of any offer or recommendation directed at you specifically, or have any regard to your investment objectives, financial situation, or needs of yourself or any other specific person. Before committing to a trade or investment, please seek advice from financial or other professional advisers regarding the suitability of the trade for you. If you do not wish to seek such financial advice, please consider carefully whether the product is suitable for you as you alone remain responsible for your trading gains and losses.

Smart AlertsThis indicator provides back-tested signals and alerts from multiple technical indicators.
No more guessing whether or not you should trust an indicator. See your indicators' past performance at a glance.
No more false alarms. Disable re-painting of signals.
When multiple indicators overlap, a Confluence indicator will print (large triangle). With your settings properly tuned, this will show a HIGH probability of a move.
Current Signal/Alert Options (more to come):
RSI Oversold
RSI Overbought
EMA Crossing Up
EMA Crossing Down
Buy Signal Confluence
Sell Signal Confluence
Instructions:
-Enable/disable individual indicators so you can fine tune one at a time
-Adjust the indicator's settings
-Adjust your trade parameters (Max Wait, Take Profit %). Signals that would have given the desired profit in the time allowed will be painted orange.
-Repeat this process with each indicator until you're satisfied
-Set-up alerts

Smart EMA SignalsThis indicator starts by plotting each time the price action crosses above or below the EMA, of which you can tune the timeframe and duration.
It then takes it a step further and plots whether or not that indicator would have given you a profitable trade, of which you can also tune the parameters (Max wait time, and % Profit).
Once you have your EMA tuned to your liking, set up alerts to notify you of a golden opportunity.

Smart Labelling - Candlestick ChartingThis is a full-fledged implementation of a system presented in an unique research paper 'Profitability of Candlestick Charting Patterns in the Stock Exchange of Thailand' (2017) on candlestick charting, candlestick patterns, trend identification methods, and testing.
You can easily find this paper in the Web. For example, visit: www.researchgate.net
This script is best suited for middle-to-higher time frames. Possible future developments: trend identification and factor calculation techniques.
Donate: PayPal (paypal.me)

Smart Labelling - Range FilterThis is a labelling module based on a range filter . Notice that the trick here is to use fibonachi numbers . Use smaller range multiplier for higher TFs. This module may serve as a signal generator to be passed through a signal filter.
Quote from the original author:
This is an experimental study designed to filter out minor price action for a clearer view of trends. Inspired by the QQE's volatility filter, this filter applies the process directly to price rather than to a smoothed RSI. First, a smooth average price range is calculated for the basis of the filter and multiplied by a specified amount. Next, the filter is calculated by gating price movements that do not exceed the specified range. Lastly the target ranges are plotted to display the prices that will trigger filter movement.

Smart Target Introduction
This is the first forward-looking indicator on TradingView!
A normal moving average indicator will use two averages of differing lengths, referred to as “fast and slow” or “short and long” moving averages, to identify trends and potential trades.
The Smart Target indicator uses the average trade profitability and trade duration of a moving average strategy to determine a forward-looking target that is specific to the chart that it has been applied to.
Every historical trade is considered when the indicator determines the future price target of an asset and the accuracy will improve with time as new trade data is continually introduced.
Indicator Utility
If the fast-moving average crosses above the slow, a blue target will appear.
A red target will appear when the fast-moving average crosses below the slow.
The target will never change once it has been plotted and will not repaint in any way which means that it is fully functional for trading in real-time.
Input Values
The period length of the two moving averages will need to be determined by the user and can be changed in the indicator settings panel.
View the full documentation on this indicator at this link: www.kenzing.com

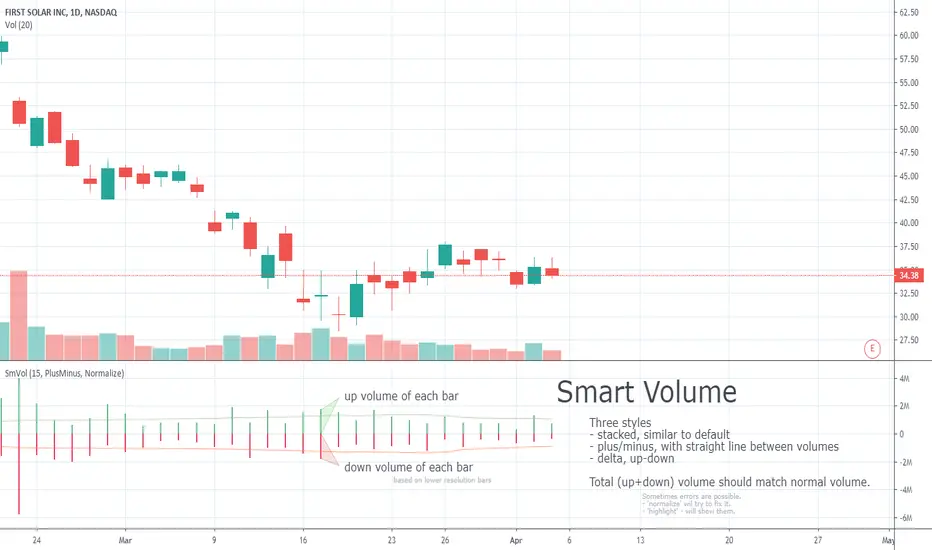
Smart VolumeOut of beta!
This script distinguishes up/down volume based on lower resolution.
It's important to set correct input "Detailed Resolution" — it affects detalization/loading speed. If equal to chart resolution, should match builtin "volume". The lower it is, the more detalized up/down border.
Smart Volume (beta)This script distinguishes up/down volume based on lower resolution.
It's important to set correct inputs. Second - affects detalisation/loading speed. Third one needs to be set according to your chart resolution. 1440 for 'D', 30 for '30'.

Mxwll Price Action Suite [Mxwll]Introducing the Mxwll Price Action Suite!
The Mxwll Price Action Suite is an all-in-one analysis indicator incorporating elements of SMC and also ideas extending beyond the trading methodology!
Features
Internal structures
External structures
Customizable Sensitivities
BoS/CHoCH
Order Blocks
HH/LH/LL/LH Areas
Rolling TF highs/lows
Rolling Volume Comparisons
Auto Fibs
And more!
The image above shows the indicator's market structure identification capabilities. Internal BoS and CHoCH structures in addition to overarching market structures are available with customizable sensitivities.
The image above shows the indicator identifying order blocks! Additionally, HH/LH/LL/LH areas are also identified.
The image above shows a rolling area of interest. These areas can be compared to supply/demand zones, where traders might consider a bargain long/short/sell area.
The indicator displays a rolling 4hr high/low and 1D high/low, alongside auto fibonacci levels with a customizable sensitivity.
Finally, the Mxwll Price Action Suite shows relevant session information.
Table information
Current Session
Countdown to session close
Next Session
Countdown to next session open
Rolling 4-Hr volume intensity
Rolling 24-Hr volume intensity
Introducing the Mxwll SMC Suite!
The Mxwll SMC Suite is an all-in-one analysis indicator incorporating elements of SMC and also ideas extending beyond the trading methodology!
Features
Internal structures
External structures
Customizable Sensitivities
BoS/CHoCH
Order Blocks
HH/LH/LL/LH Areas
Rolling TF highs/lows
Rolling Volume Comparisons
Auto Fibs
And more!
The image above shows the indicator's market structure identification capabilities. Internal BoS and CHoCH structures in addition to overarching market structures are available with customizable sensitivities.
The image above shows the indicator identifying order blocks! Additionally, HH/LH/LL/LH areas are also identified.
The image above shows a rolling area of interest. These areas can be compared to supply/demand zones, where traders might consider a bargain long/short/sell area.
The indicator displays a rolling 4hr high/low and 1D high/low, alongside auto fibonacci levels with a customizable sensitivity.
Finally, the Mxwll Price Action Suite shows relevant session information.
Table information
Current Session
Countdown to session close
Next Session
Countdown to next session open
Rolling 4-Hr volume intensity
Rolling 24-Hr volume intensity
Expanded Features of Mxwll Price Action Suite
Internal and External Structures
Internal Structures: These elements refer to the price formations and patterns that occur within a smaller scope or a specific trading session. The suite can detect intricate details like minor support/resistance levels or short-term trend reversals.
External Structures: These involve larger, more significant market patterns and trends spanning multiple sessions or time frames. This capability helps traders understand overarching market directions.
Customizable Sensitivities
Adjusting sensitivity settings allows users to tailor the indicator's responsiveness to market changes. Higher sensitivity can catch smaller fluctuations, while lower sensitivity might focus on more significant, reliable market moves.
Break of Structure (BoS) and Change of Character (CHoCH)
BoS: This feature identifies points where the price breaks a significant structure, potentially indicating a new trend or a trend reversal.
CHoCH: Detects subtle shifts in the market's behavior, which could suggest the early stages of a trend change before they become apparent to the broader market.
Order Blocks and Market Phases
Order Blocks: These are essentially price levels or zones where significant trading activities previously occurred, likely pointing to the positions of smart money.
HH/LH/LL/LH Areas: Identifying Higher Highs (HH), Lower Highs (LH), Lower Lows (LL), and Lower Highs (LH) helps in understanding the trend and market structure, aiding in predictive analysis.
Rolling Timeframe Highs/Lows and Volume Comparisons
Tracks highs and lows over specified rolling periods, providing dynamic support and resistance levels.
Compares volume data across different timeframes to assess the strength or weakness of the current price movements.
Auto Fibonacci Levels
Automatically calculates and plots Fibonacci retracement levels, a popular tool among traders to identify potential reversal points based on past movements.
Session Data and Volume Intensity
Session Information: Displays current and upcoming trading sessions along with countdown timers, which is crucial for day traders and those trading on session overlaps.
Volume Intensity: Measures and compares the volume within the last 4 hours and 24 hours to gauge market activity and potential breakout/breakdown movements.
Visualizations and Practical Use
Dynamic Visuals: The suite provides dynamic visual aids, such as real-time updating of high/low markers and Fibonacci levels, which adjust as new data comes in. This feature is critical in fast-paced markets.
Strategic Entry/Exit Points: By identifying order blocks and using Fibonacci levels, traders can pinpoint strategic entry and exit points, maximizing potential returns.
Risk Management: Enhanced features like session countdowns and volume intensity help in better risk management by providing traders with more data on market sentiment and potential volatility.

Indexrate Code SMIndexrate Code SM is an indicator and part of the Indexrate Code Set of Algorithm, which additionally includes the Indexrate Code A strategy and Indexrate Code B indicator.
The Indexrate Code Set of Algorithms can be used for any trading instruments and on any existing markets (Stock market, Forex, Cryptocurrency market, etc.).
Getting access to the Indexrate Code A strategy, you gain access to the whole set of Indexrate Code algorithms.
Indexrate Code SM is an indicator, based on the Smart Money concept. Smart money is large market participants with sufficient volumes to influence the price. This is a small group that includes banks and large funds. Their every move is controlled down to the smallest detail. In the modern world, this is done with the help of artificial intelligence and other complex algorithms that move the price to certain values. Unique programs that lower and raise the price are effective because they know the behavior of people, which will invariably be based on fear and greed.
On the other side are the majority of traders, including us - this is uninformed money. This group includes retail traders and small funds. Residents of this group believe that due to their numbers, they move the market. But in fact, the retail sector cannot have any influence on the price. This is due to low volumes: a large group in monetary terms is not as large as it may seem. Large volumes that can do this are in a small group - smart money. Retail traders are too small and make up only a small percentage of the money in circulation on the market (~5%), so the main target for smart capital is always funds.
Smart Money is following large market participants. With the help of this concept and its tools, you can identify and track the actions of smart money. As long as there is liquidity in the market, the concept will be effective in application.
Indexrate Code SM consists of a set of signals displayed on the chart, configured in a unique way to interact with each other and allowing traders to comprehensively analyze the movement of the asset price.
The indicator displays the zones of interest of "bulls" and bears", which are highlighted with lines of the corresponding color. Where gray is the zone of "bears", and blue is the zone of "bulls". When these zones are broken, the indicator displays the corresponding signals to buy or sell.
The indicator also displays the zone of fair price, highlighting it in yellow. This zone acts as a conditional magnet in the event of a price rebound from the zones of interest.
In addition, the indicator displays the zone of the greatest local interest of buyers (storng high) and sellers (weak low). When the zone of fair price is broken, the asset often rushes to these local levels. From which a rebound often occurs, both during a reversal of movement and during a breakout.
The lines of the previous daily high (PDH) and the previous daily low (PDL) give traders an understanding of the intraday range of price movement.
The Indexrate Code SM integrates the Sequential and Trend HMA trend algorithms, known to us from the Indexrate Code A strategy. By default, these algorithms are not displayed on the chart (you can enable the display in the settings), since they are displayed in the strategy, but they continue to work inside the indicator to establish more accurate signals to buy or sell. The settings of these algorithms are identical to the settings displayed in the Indexrate Code A strategy.
The search for optimal signal settings includes the time structure, that is, the period for which the calculation and search for areas of interest are carried out. As well as the number of order blocks.
drive.google.com
The settings of the Sequential and Trend HMA trend algorithms are aimed at eliminating false signals as much as possible.
drive.google.com
The signals on the chart are displayed as green dots for buying and red dots for selling.
Provided that the Indexrate Code A strategy is configured most successfully, the appearance of a confirmation signal can provide the potential probability of the strongest price movement.
It is also worth considering that when working with the Heiken Ashi chart, for which the Indexrate Code Set of Algorithm works, you must install OHLC as shown in the screenshot below. Since this parameter allows you to take into account real exchange prices, without calculating average Heiken Ashi values, which can mislead the trader regarding the current state of the market. And also take into account the percentage of the exchange commission and the On bar close parameter.
telegra.ph
The Indexrate Code Set of Algorithms is suitable for conservative traders who evaluate their success in the long term, and not in short-term excess profits.
IT IS IMPORTANT TO KNOW that no indicator is capable of 100% predicting a successful trade.
The market is a collection of people. It is thanks to human psychology that shapes the forces of supply and demand that financial markets exist (Charles Dow Theory).
Forecasting based on the analysis of mathematical algorithms (indicators) uses data from past trading - the price of the previous period of time and the volume of previous trading. It is these two indicators that are used by modern technical analysis.
The Indexrate Code Set of Algorithm is based on algorithms that evaluate trends, prices and volume indicators. As well as human psychology, which requires an assessment of the exact preceding periods for a specific timeframe, and not an assessment of the entire period from the moment of listing of a trading instrument on a specific exchange. Since market indicators completely change throughout the trading period and the exchange trading volume also changes.
All updates to the Indexrate Code Set of Algorithm will be free.
Trading is trading on probabilities. Investing is trading on opportunity. Nobody knows the future - Always protect your profits!
Russian translation
Indexrate Code SM - это индикатор являющийся частью Комплекта алгоритмов Indexrate Code, включающего в себя дополнительно стратегию Indexrate Code А и индикатор Indexrate Code B.
Комплект алгоритмов Indexrate Code, может быть использован для любых торговых инструментов и на любых существующих рынках (Фондовый рынок, Форекс, Криптовалютный рынок и тд).
Получая доступ к индикатору Indexrate Code SM, вы получаете доступ ко всему комплекту алгоритмов Indexrate Code.
Indexrate Code SM это индикатор, основанный на концепции Smart Money. Умные деньги — это крупные участники рынка, имеющие достаточные объемы, чтобы оказывать влияние на цену. Это небольшая группа, в которую входят банки и крупные фонды. Каждое их движение, до мельчайших деталей контролируется. В современном мире это делается с помощью искусственного интеллекта и других сложных алгоритмов, которые двигают цену на определенные значения. Уникальные программы, которые опускают и поднимают цену, эффективны, потому что они знают поведение людей, которое неизменно будет основываться на страхе и жадности.
По другую сторону находится большинство трейдеров, включая нас – это не информированные деньги. В такую группу входят ритейл трейдеры и небольшие
фонды. Резиденты такой группы считают, что из-за их численности они двигают рынок. Но на самом деле розничный сектор не может оказывать никакого влияния на цену. Обуславливается это низкими объемами: большая группа в денежном эквиваленте не так уж велика, как может показаться. Крупные объемы, способные это делать, находятся в небольшой группе — умных денег. Ритейл трейдеры слишком малы и составляют только небольшой процент обращаемых денег на рынке (~5%), поэтому основной целью для умного капитала всегда выступают фонды.
Smart Money это следование за крупными участниками рынка. С помощью
этой концепции и ее инструментов, вы сможете идентифицировать и отслеживать действия умных денег. Пока на рынке будет ликвидность, до тех пор концепция будет эффективна в применении.
Indexrate Code SM состоит из совокупности отображаемых сигналов на графике, настроенных уникальным образом для взаимодействия между собой и позволяющих трейдерам комплексно анализировать движение цены актива.
Индикатор отображает зоны интереса «быков» и медведей», которые подсвечиваются линиями соответствующего цвета. Где серый это зона «медведей», а голубой это зона «быков». При прорыве этих зон, индикатор отображает соответствующие сигналы на покупку или на продажу.
Также индикатор отображает зону справедливой цены, подсвечивая ее желтым цветом. Данная зона выступает в качестве условного магнита, в случае отскока цены от зон интереса.
Дополнительно на индикаторе отображены зона наибольшего локального интереса покупателей (storng high) и продавцов (weak low). При прорыве зоны справедливой цены, актив чаще устремляется именно к этим локальным уровням. От которых зачастую происходит отскок, как и при развороте движения, так и при пробитии.
Линии предыдущего дневного хая (PDH) и предыдущего дневного лоя (PDL), дают трейдерам понимание внутридневного диапазона движения цены.
В Indexrate Code SM интегрированы трендовые алгоритмы Sequential и Trend HMA, известные нам по стратегии Indexrate Code A. По умолчанию данные алгоритмы не отображаются на графике (можно включит отображение в настройках), так как они отображены в стратегии, но продолжают работать внутри индикатора, для установления более точных сигналов на покупку или продажу. Настройки указанных алгоритмов идентичны, настройкам, отображаемым в стратегии Indexrate Code A.
Поиск оптимальных настроек сигналов, включает в себя структуру времени, то есть период, за который идет расчет и поиск зон интереса. А также количество ордер блоков.
drive.google.com
Настройки трендовых алгоритмов Sequential и Trend HMA, направлены для максимального исключения ложных сигналов.
drive.google.com
Сигналы на графике отображены точками зеленого цвета на покупку и красного цвета на продажу.
При условии наиболее удачной настройки стратегии Indexrate Code A, появление подтверждающего сигнала, может давать потенциальную вероятность наиболее сильного движения цены.
Стоит также учесть, что при работе с графиком Heiken Ashi, для которого работает Комплект алгоритмов Indexrate Code, необходимо устанавливать OHLC как показано ниже на скриншоте. Поскольку этот параметр позволяет учитывать реальные биржевые цены, без расчета усредненных значений Heiken Ashi, которые могут ввести трейдера в заблуждение относительно текущего состояния рынка. А также учитывать процент комиссии биржи и параметр On bar close.
telegra.ph
Комплект алгоритмов Indexrate Code, подходит консервативным трейдерам, оценивающим свой успех в долгосрочном перспективе, а не в краткосрочной сверх прибыли.
ВАЖНО ЗНАТЬ, что ни один индикатор не способен на 100% предсказать успешную сделку.
Рынок - это совокупность людей. Именно благодаря психологии людей, формирующей силы спроса и предложения, существуют финансовые рынки (Теория Чарльза Доу).
Прогнозирование на основе анализа математических алгоритмов (индикаторов), использует данные прошлых торгов - цену предыдущего периода времени и объем предыдущих торгов. Именно эти два показателя и используются современным техническим анализом.
В основе Комплекта алгоритмов Indexrate Code, лежат алгоритмы оценивающие тенденции, цены и показатели объема. А также психология людей, которая требует оценки точных предшествующих периодов для конкретного таймфрейма, а не оценка всего периода с момента листинга торгового инструмента на конкретной бирже. Так как показатели рынка полностью изменяются на всем торговом периоде и также меняется биржевой объем торгов.
Все обновления Комплекта алгоритмов Indexrate Code, будут бесплатны.
Трейдинг - это торговля на вероятностях. Инвестиции - это торговля на возможностях. Никто не знает будущего - Всегда защищайте свою прибыль.

CRT [TakingProphets]Candle Range Theory (CRT) is an exclusive, closed-source indicator designed for traders who use ICT and Smart Money Concepts (SMC). It combines higher timeframe (HTF) visualization, Candle Range Transition (CRT) detection, and Smart Money Divergence (SMT) into one cohesive tool, giving traders a structured way to monitor institutional price behavior without switching timeframes.
Unlike generic market structure tools, CRT was built from the ground up to help traders:
Keep higher timeframe context visible directly on lower timeframe charts
Identify potential transition or rejection points in real time
Visualize correlated market divergences that are often invisible to the naked eye
This original approach is what makes CRT a premium, invite-only indicator. It is not a repackaged combination of common moving averages, oscillators, or support/resistance tools. It’s a specialized model designed to consolidate multiple ICT/SMC concepts into one workflow-friendly system.
How CRT Works
1. Higher Timeframe Candle Overlay
Projects up to three higher timeframe candles (1-minute to monthly) onto your active chart.
Displays open, high, low, and close with wick and body precision.
Lets you trade the lower timeframe with higher timeframe bias always visible.
2. Candle Range Transition (CRT) Detection
A Bearish CRT is detected when the current candle forms a higher high but closes lower than the previous candle.
A Bullish CRT occurs when the current candle forms a lower low but closes higher than the previous candle.
These transitions often highlight areas where price fails to continue its prior move, signaling a potential shift in delivery.
3. Smart Money Divergence (SMT)
Monitors correlated instruments (e.g., ES vs NQ, EURUSD vs GBPUSD).
Flags divergence when one instrument confirms a move while the other hesitates or rejects it.
SMT signals appear in real time, helping traders filter potential liquidity traps or engineered moves.
4. Real-Time HTF Candle Projections
Continuously plots the projected open, high, low, and close of the current HTF candle.
Acts as evolving reference points for support/resistance or decision-making zones.
5. Custom Display and Info Box
Fully configurable candle width, wick colors, label sizes, and transparency.
Built-in info box shows symbol, selected HTF timeframe, and session date for chart clarity.
6. Integrated Alert System
Four alert types:
• Bullish CRT
• Bearish CRT
• Bullish SMT Divergence
• Bearish SMT Divergence
Alerts help you track multiple instruments without staring at the screen all day.
Why CRT is Exclusive and Worth It
Most market structure indicators either plot generic support/resistance or recycle concepts already available in open-source scripts. CRT is original because:
It consolidates multiple ICT/SMC concepts (HTF bias, CRT transitions, SMT divergence) into one cohesive model.
It uses a proprietary visualization and detection method designed specifically for real-time application.
It provides clarity without chart clutter, allowing traders to make faster, more structured decisions.
While CRT does not execute trades or guarantee profits, it gives serious traders a unique analytical edge by revealing subtle higher timeframe and intermarket dynamics in real time.
If you understand ICT principles and Smart Money Concepts, CRT provides a workflow upgrade that simply isn’t available in free or generic scripts.

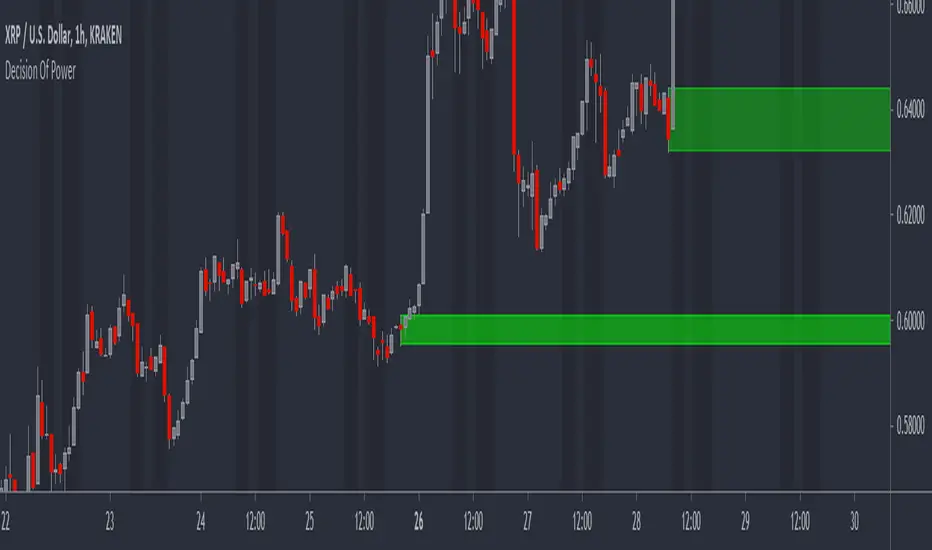
DOP - Load-Level Identification & Setup Assistant (L.I.S.A)This toolkit is made up of more than 3+ innovative indicators that have been designed to assist people in trading smart-money concepts. Get access to a variety of trading tools & relevant data all within one indicator to create your own, smart-money trading strategy.
Catering To SMART-Money Trading Styles
Our toolkit works in any market & allows users to:
• Detect the trend of the market by displaying real-time changes in market structure.
• Detect institutional activity in the market by highlighting structural changes.
• Get automatic order block support and resistance levels in real-time to assist with order entry placement and target take profit levels.
• Timely removal of order blocks that have been run through to give a clear picture of current market structure.
How Does It Work?
The algorithm tracks key pivot points within market data and when these are broken by price movements it provides key information to the user such as when it broke structure, where it broke structure and what levels are now considered support and resistance.
Trend Bar Colouring
The trend bar colouring feature provides a clear visual indication of the market trend by colouring candles red or green depending on the last break in market structure.
Market Structure Breaks
Breaks in market structure are displayed with a single line between two candles, this indicates that there may have been a shift in market trend.
Order Block Levels
Once structure breaks it creates support and resistance levels which can help in trade entries and deciding on take profit targets; these are displayed in real-time with colour coded boxes at either the support or resistance levels. If a level has been broken it is automatically removed from the chart to give a clear representation of the current market state.
If you are using this script you acknowledge past performance is not necessarily indicative of future results and there are many more factors that go into being a profitable trader.
You can see the Author's instructions below to get instant-access to this indicator.
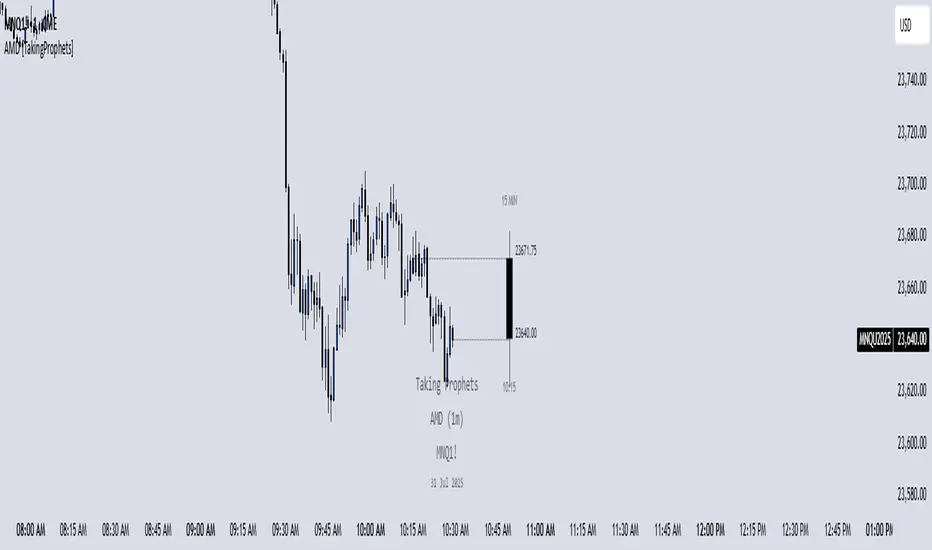
AMD [TakingProphets]Accumulation Manipulation Distribution – Real-Time HTF Candle Projection for ICT/SMC Traders
Accumulation Manipulation Distribution (AMD) is a premium, real-time indicator designed for traders who use ICT and Smart Money Concepts (SMC). It projects higher timeframe (HTF) candles directly onto your lower timeframe chart, allowing you to monitor institutional price behavior without switching timeframes.
By continuously tracking the open, high, low, and close (OHLC) of active HTF candles, AMD helps traders interpret whether the market is in a phase of accumulation, manipulation, or distribution—a key concept for understanding institutional order flow.
Core Features and How It Works
1. Live HTF Candle Visualization
Displays complete HTF candles — including body and wicks — in real time.
Provides immediate higher timeframe context for lower timeframe execution.
Supports any timeframe from 1 minute to monthly.
2. Real-Time OHLC Projections
Projects the open, high, low, and current close of the active HTF candle as it develops.
Acts as evolving reference points for support, resistance, and directional bias.
Fully customizable with adjustable colors, line styles, and labels.
3. Session Timing and Labeling
Optional time labels mark candle openings and help anticipate session closes.
Supports 12-hour and 24-hour formatting for flexibility across markets.
4. Complete Visual Customization
Configure candle width, wick transparency, border color, and projection lines.
Maintain a clean, professional overlay that aligns with your preferred charting style.
How to Use AMD
Determine HTF Bias: Identify whether the active candle is expanding in your trade direction or showing signs of rejection.
Track Price Reaction: Monitor how price interacts with projected HTF highs, lows, and midpoints—especially during ICT killzones or after liquidity events.
Anchor Lower Timeframe Entries: Combine AMD with tools like Order Blocks, Liquidity Levels, or Rejection Blocks to confirm high-probability Smart Money setups.
This approach allows traders to synchronize LTF executions with HTF market structure, enhancing clarity and confidence in trade selection.
FXC Order Block Finder █ OVERVIEW
The FXC Order Bock Finder finds and draws institutional order blocks according to the Smart Money Concept. Order blocks are zones where institutions have most likely left some orders that need to be filled at a later point in time. In These order blocks or POIs can be used to either place limit orders or to look for instant entries as price comes to retest the zone. It works on all time frames but higher time frames tend to be more precise.
█ HOW DOES IT WORK?
The indicator waits for a break of structure (BOS) and then prints a zone if there's an engulfing pattern and an open imbalance. Basically it draws zones where a fake move followed by aggressive buying or selling happened and Imbalances were left open.
█ WHAT MAKES IT UNIQUE?
Apart from the fact that I haven’t found any indicator that is able to properly draw order blocks most indicators do re-paint which doesn’t make any sense in the case of the Smart Money Concept.
Furthermore does this indicator have settings that let’s you adjust how the order blocks are drawn. From wick to end of the imbalance or candle close to imbalance. Also you can set how many candles it takes into consideration for the imbalance in case the imbalance starts after the engulfing pattern has formed. And you can set how many candles have to checked to determine a BOS or an internal BOS by using fractal breaks.
█ HOW TO USE IT?
Either place sell limits at the lower end of the order block with SL slightly above the OB and buy limits at the upper end of the OB with SL slightly below the OB. Target a fixed Risk Reward Ratio or trade it to the next order block. By using multi time frame analysis you can determine the overall direction of the market and prevent low probability trades. Also worth mentioning is that order blocks that have been created during high volume sessions tend to result in way better trades than with order blocks that have been printed during the Asia session.
█ ADDITIONAL INFO
As soon as price retested an order block the order block is mitigated and therefore not valid anymore. Also order blocks that are too far back in time are less probable to deliver good trades. In general the win rate tends not to be too high using this method but more often than not there's a reaction as price taps into an order block and trades with high RRR are quite often. As always in trading, proper money management and risk management is key.
█ DISCLAIMER
This is not financial advice. The Indicator spots these zones according to the smart money concept . However there's absolutely no guarantee that a nice order blocks results in a good trade.
█ Examples

SIP SmartlyIntroduction:
The SIP Smartly indicator is designed to mimic the behavior of a systematic investment plan, a popular investment strategy where a fixed quantity of an asset is purchased at regular intervals, typically monthly. In this case, we're applying this concept to trading by specifying a start date, a fixed purchase quantity, and certain conditions for buying.
Indicator Components:
User Inputs:
1. Start Date Inputs:
startyear, startmonth, startday: These inputs allow you to specify the year, month, and day when the SIP strategy begins.
2. buyQty:
This input allows you to specify the quantity of the security to purchase in each SIP installment.
What is Standard SIP ?
A Standard Systematic Investment Plan (SIP) is an investment strategy where individuals consistently invest a fixed amount of money at regular intervals, such as monthly or quarterly, in mutual funds or stocks. This approach promotes disciplined and long-term investing, taking advantage of rupee-cost averaging, where more shares are purchased when prices are low and fewer when prices are high. SIPs are designed for individuals seeking gradual wealth accumulation over time while mitigating the impact of market volatility through consistent, automated investments.
Logic of the Smart SIP Indicator:
Dynamic Quantity: The Smart SIP indicator allows you to invest a fixed quantity of a security at regular intervals based on technical analysis conditions. This is different from a standard SIP, where you typically invest a fixed amount of money.
Technical Analysis Driven: The Smart SIP indicator employs technical analysis indicators, such as multiple moving averages and uses the crossover of a higher MA with a lower MA which indicates a possible trend reversal, to determine Buy signals based on price trends. In contrast, a standard SIP doesn't consider technical factors but rather involves regular investments regardless of market conditions.
Adaptability: Unlike a standard SIP, which follows a predetermined investment schedule, the Smart SIP can adapt to changing market conditions. It triggers Buy actions only when specific technical conditions are met, providing a more flexible and responsive approach to investing or trading.
Market Value Tracking: The Smart SIP continuously tracks the market value of the invested quantity in real-time. This allows you to monitor the performance of your SIP investments dynamically, considering market fluctuations. In a standard SIP, you typically track the overall portfolio value without real-time adjustments.
Alert Notifications: The Smart SIP can send alert notifications when Buy conditions are met. This feature ensures timely execution of trades when favorable market conditions align with the technical criteria. In a standard SIP, you usually follow a fixed investment schedule without real-time alerting.
In summary, the unique logic of the Smart SIP indicator lies in its adaptability, technical analysis-driven approach, and real-time tracking and alerting features, making it well-suited for trading in financial markets while still following the concept of a systematic investment plan.
How to Use the SIP Smartly Indicator:
Start Date Selection:
Input your desired start date using the startyear, startmonth, and startday parameters. This is the date when your SIP strategy will begin.
Buy Quantity Setting:
Set the buyQty input to the quantity of the security you want to purchase in each SIP installment.
Alerts:
The indicator can trigger alerts when Buy conditions are met. These alerts can be configured to notify you when it's time to make a SIP installment.
Risk Management and Considerations:
Confirmation: While the SIP Smartly indicator provides insights, use it alongside other technical and fundamental analysis tools for confirmation before making trading decisions.
Backtesting: Before using this indicator in live trading, conduct thorough backtesting on historical data to evaluate its performance under different market conditions.
Position Sizing: Determine your position size and risk management rules based on the quantity purchased in each SIP installment.
Market Awareness: Stay informed about market conditions and news events that could impact price movements. This indicator is a tool to aid your trading strategy, not a standalone solution.
Conclusion:
The SIP Smartly Indicator offers a systematic approach to trading by simulating a SIP strategy. By inputting your start date and desired buy quantity, you can follow a disciplined investment approach in your trading. Remember to customize the inputs to match your trading preferences and risk tolerance.
Disclaimer: This indicator is provided for educational purposes and should be used with caution. Trading involves risks, and you should thoroughly test any strategy before applying it in live trading.

Prophet Model [TakingProphets]Indicator Description
The Prophet Model is a structured, logic-driven indicator designed specifically for traders familiar with ICT (Inner Circle Trader) methodologies. Built to streamline the analytical workflow, this tool integrates multiple Smart Money Concepts into a clear and actionable trading framework, simplifying the identification of high-probability setups without chart clutter.
What Does This Indicator Do?
The Prophet Model guides traders by dynamically identifying and visually aligning key components of ICT methodology:
Higher Time Frame (HTF) PD Array Identification:
Automatically locates and maps critical Fair Value Gaps (FVGs) from higher timeframes onto your lower timeframe charts, clearly highlighting institutional areas of interest.
Candle Range Theory (CRT) Validation:
Monitors higher timeframe candles to detect shifts in market delivery, confirming directional bias according to ICT Candle Range Theory.
Liquidity Sweep Detection:
Precisely identifies buy-side and sell-side liquidity sweeps within marked HTF zones, clearly highlighting areas where price is likely to reverse or continue.
Change in State of Delivery (CISD):
Pinpoints the exact moment when market structure shifts via significant displacement, providing a clear reference point for trade entries.
Overlapping Fair Value Gap (FVG) Refinement:
Enhances entry precision by automatically adjusting entry points (EPE) when internal gaps overlap the CISD candle.
Risk Management Levels:
Dynamically calculates and plots your Stop Loss (SL), Break-Even (BE), and Take Profit (TP) levels based on actual structural movements (2.25x CISD range for TP, recent highs/lows for SL).
Real-Time Setup Checklist:
Provides a dynamic visual checklist confirming when all entry criteria (HTF PDA, CRT, Liquidity Sweep, CISD) are met.
Optimal Entry Tracking:
Marks refined entry points after CISD confirmation, automatically adjusting when internal imbalances (FVGs) are detected, ensuring accurate and efficient entries.
Chart Info Box:
Optionally displays complete symbol, timeframe, and indicator name for transparent chart annotations and efficient trade journaling.
How Does It Work?
Identify HTF Institutional Interest:
The indicator scans higher timeframes for unmitigated FVGs, displaying these critical zones automatically on your trading timeframe.
Confirm Market Delivery Shift (CRT):
Confirms directional conviction by comparing the range and behavior of recent higher timeframe candles.
Detect Liquidity Sweeps:
Clearly marks liquidity levels that have been swept, signaling potential price reversals or continuations.
Spot Displacement & Structure Shifts (CISD):
Highlights decisive movements indicating a significant change in market direction, crucial for entry timing.
Precision Entry Adjustments (EPE):
Refines entry positions by identifying overlapping FVGs within the displacement candle structure.
Manage Risk Clearly:
Calculates realistic SL, BE, and TP levels based on structural price action, removing guesswork and improving consistency.
Why Is It Worth Paying For?
Simplified Confluence-Building:
Removes ambiguity by automatically aligning multiple ICT criteria into a single, easy-to-follow visual workflow.
Precision & Efficiency:
Improves execution timing by dynamically updating entry and risk management levels based on actual market structure rather than arbitrary measures.
Real-Time Adaptation:
Continuously updates as market conditions evolve, providing confidence and clarity in dynamic trading environments.
Focused Trading Decisions:
Keeps traders disciplined by visually confirming setups step-by-step, aligning trades only with strong institutional-backed movements.
Important Considerations
This indicator is intended for traders with foundational knowledge of ICT methodologies.
It is not a standalone buy/sell signal provider; it must be combined with proper risk management and market narrative analysis.
Always use discretion and confirm the context of each trade within your overall trading strategy.
By providing traders with actionable insights and clear visual confirmations aligned strictly with professional ICT concepts, the Prophet Model significantly enhances trading decisions and execution precision.

[TehThomas] - ICT Rejection BlocksWhat Are Rejection Blocks?
Rejection Blocks are price zones formed when a candle attempts to push through a level, gets rejected with force, and then closes in the opposite direction. This price action creates a “block” that reflects clear intent from smart money participants. These blocks are typically marked by a large wick that fails to close beyond a key high or low, followed by a body that closes back inside the previous range. The zone around the candle body becomes a footprint of where buyers or sellers aggressively stepped in, often defending that level with size.
Why Rejection Blocks Matter to Smart Money Traders
In any smart money model, understanding where large players are active is key. Rejection Blocks highlight exactly that. These zones often sit just above inducement highs or below engineered lows, where liquidity was taken before displacement occurred. By identifying where price got rejected with conviction, traders can spot the origin of institutional interest. These levels often act as magnets for retracement and can provide high-probability entries when price trades back into them. The best part is they often line up with other SMT elements like Fair Value Gaps, Breaker Blocks, or market structure shifts, allowing for strong confluence-based setups.
How the Indicator Works and Why It’s Effective
This script is designed to do one thing exceptionally well, automatically detect and display clean, high-quality rejection blocks. It filters out noise and only marks candles that meet strict rejection criteria. That means long wicks showing failed pushes, and bodies that close convincingly in the opposite direction. The indicator then draws a box over the candle body to mark the rejection zone. These boxes help map out areas where price is likely to react or stall in the future. By automating this process, the indicator saves time, improves consistency, and removes guesswork. You no longer have to manually scan charts or second-guess if a level is valid, the tool handles it for you.
What This Adds to Your Trading Workflow
This tool fits perfectly into any smart money strategy built around liquidity, displacement, and market structure. It helps you focus on the most meaningful zones, especially when price sweeps a high or low and leaves behind a reversal. Whether you trade breakouts, reversals, or liquidity setups, Rejection Blocks give you a visual confirmation of where price got turned away. They act as future entry zones, rejection points, or even stop placement areas. You can pair them with your Fair Value Gap entries, or use them to validate the direction of a shift in structure. This is the type of tool that simplifies your chart without losing precision.
Optimized for Focus and Clarity
There’s no clutter, no overload of options, and no distractions. Just clean, focused rejection zones that update in real-time. The boxes stay until invalidated, giving you a static map of relevant zones without recalculating on every bar. This makes it ideal for traders who want to plan entries, set alerts, or manage risk without redrawing levels every session. Whether you scalp on the 5M or swing trade using the 4H, this tool helps lock in the zones where price already told you something important, rejection with force.
Conclusion
The Rejection Blocks indicator is for traders who want cleaner charts, smarter levels, and more conviction behind every entry. It isolates zones where price showed clear rejection and turns them into actionable blocks that fit seamlessly into any smart money strategy. If you rely on liquidity sweeps, displacement, and reaction-based entries, this tool brings clarity and consistency to your edge. Just turn it on and let it show you where real rejection occurred.
Example of how to use it

[AlbaTherium] MTF Internal Ranges Analysis - IRA-Phoenix for SMCIntroduction:
The MTF Internal Ranges Analysis - IRA - Phoenix acts as an extension to the original main SMC Indicator by AlbaTherium . This add-on provides insights into multi-timeframe internal structure points, swing structure points, POIs (Points of Interest), and order blocks (OB). By integrating this enhancement, your multi-timeframe analyses become more streamlined, expediting the process and minimizing chart workload .
This tool represents an advanced smart money technical analysis aimed at enhancing your trading experience. It introduces four pivotal concepts:
Main Features:
Multiple Timeframes and Confluences,
SCOB Internal Order Block.
Demand to Supply (D2S) or Supply to Demand (S2D) across Multiple timeframes
SCOB on LTF and SCM on HTF across same Candle
By combining these concepts all in one, traders can find confluences zones across multiple timeframes and gain a comprehensive understanding of market dynamics, theses confluences zones empower order block skills and potentiality, showcasing them as essential, crucial, powerful, strategic, and pivotal, one of the pillars in smart money concepts trading strategy to make more informed decisions.
Settings Overview:
Select timeframe {Select or current chart}
Inside bar ranges
Internal structure as Internal zigzag {turn on/ off / unconfirmed(live) zigzag}
Single Candle Mitigation Pattern {turn on/ off / confirmed / unconfirmed}
Single Candle Order Block Pattern {turn on/ off / confirmed / unconfirmed}
Demands and Supplies (D&S) {turn on/ off / confirmed / unconfirmed}
OB Mitigation {touch/ extended}
Understanding the Features:
Chapter 1: Multiple Timeframes and Confluences
Our Multi-timeframe analysis approach enables traders to analyze market trends and volatility across different timeframes. Confluences, where signals align across multiple timeframes, provide strong indications for trading opportunities.
Practical Example:
- With MTF IRA - Phoenix , traders can seamlessly transition between different timeframes while maintaining a cohesive analysis. For instance, traders can monitor the M15, H1, or M5 charts while focusing on entry on the M1 timeframe, enabling a holistic view of market trends and opportunities .
Chapter 2: SCOB Internal Order Block across Multiple Timeframe
SCOB Internal Order Block (SCOB IOB) highlights critical zones in price action, showcasing the dominance of aggressive buyers or sellers on orders blocks. As confluences accumulate across multiple timeframes, the strength of the order block intensifies, presenting entry opportunities.
Practical Example:
You have the ability to detect zones where price ranges have formed; these areas are highly sought after for taking buying as well as selling positions, especially when these areas are reflected across 1 or 3 timeframes.
The only practical way to see theses confluences is to use this Indicator, see the example below
Chapter 03: Demand to Supply (D2S) or Supply to Demand (S2D) across Multiple timeframes
The Demand to Supply or Supply to Demand feature within MTF Internal Ranges Analysis - IRA - Phoenix offers a nuanced analysis of price action dynamics across various timeframes. By identifying shifts in supply and demand zones, traders gain valuable insights into market sentiment and potential price reversals.
This feature enables traders to anticipate changes in market direction by recognizing the interplay between demand and supply across different timeframes. By understanding how price reacts at key support and resistance levels, traders can make informed decisions and capitalize on emerging trends.
The Demand to Supply or Supply to Demand feature enhances the indicator's usefulness by providing traders with actionable information to navigate complex market conditions effectively. With this comprehensive analysis, traders can better manage risk and optimize trading strategies across multiple timeframes.
Real-world Example:
Chapter 04: SCOB on LTF and SCM on HTF across same Candle
with MTF Internal Ranges Analysis - IRA - Phoenix , explores the concepts of SCOB (Single Candle Order Block) on Lower Timeframes (LTF) and SCM (Single Candle Mitigation) on Higher Timeframes (HTF).
SCOB on LTF refers to the identification and analysis of single candle order blocks within shorter timeframes. These blocks represent critical price levels where significant buying or selling activity occurred within a single candlestick. By recognizing SCOB patterns, traders can pinpoint key areas of market interest and anticipate potential price movements.
On the other hand, SCM on HTF involves analyzing single candle mitigation entries within longer timeframes. This technique aims to capitalize on price reversals or shifts in market sentiment indicated by single candlestick patterns. By incorporating SCM analysis, traders can gain insights into broader market trends and make strategic trading decisions accordingly.
the intricacies of SCOB on LTF and SCM on HTF, offering traders valuable tools to enhance their analysis and decision-making processes across different timeframes. Through a comprehensive understanding of these concepts, traders can identify high-probability trading opportunities and navigate the markets with confidence.
Real-world Example:
SCOB on M5 and SCM on M15 generate a powerful order block.
Conclusion:
MTF Internal Ranges Analysis - IRA - Phoenix for Smart Money Concepts is a valuable asset for traders seeking to add more insights in today's dynamic markets especially for Intraday Traders. By focusing on concepts like "Multiple timeframes and Confluences, with one single timeframe u can analyze all timeframes", "SCOB Internal Order Block. With its innovative features and user-friendly interface, whether you're a seasoned trader or just starting your journey, MTF IRA - Phoenix can help you navigate through the complexities of price action and make more informed trading choices.
This document provides an extensive overview of MTF Internal Ranges Analysis - IRA - Phoenix, emphasizing its importance in comprehending market dynamics and utilizing essential smart money concepts trading principles.
