ICT KillZones Hunt [TradingFinder] 4 Sessions + OB + FVG + Alert🔵 Introduction
🟣 ICT
The "ICT" style is a subset of "Price Action" technical analysis. The primary goal of the ICT trading strategy is to merge "Price Action" with the "Smart Money" concept to pinpoint optimal trade entry points.
However, this approach's strength extends beyond merely finding entry points. It also helps traders gain a deeper understanding of price behavior and adapt their trading strategies to the market structure.
The most important concepts of "ICT" :
Order Block
Fair Value Gap(FVG)
Liquidity
🟣 Session
Financial markets are divided into several time periods, each featuring distinct characteristics and levels of activity. These periods, known as sessions, are active at different times during the day.
The primary active sessions in financial markets include :
Asian Session
European Session
New York Session
Based on the UTC time zone, the schedule for these key sessions is :
Asian Session: 23:00 to 06:00
European Session: 07:00 to 16:30
New York Session: 13:00 to 22:00
Note
To avoid session overlap and minimize interference during kill zones, the session times have been modified as follows :
Asian Session: 23:00 to 06:00
European Session: 07:00 to 14:25
New York Session: 14:30 to 22:55
🟣 KillZone
Kill zones are periods within a session where trader activity spikes. During these times, trading volume surges, and price movements become more pronounced.
The major kill zones, according to the UTC time zone, are as follows :
Asian Kill Zone: 23:00 to 03:55
European Kill Zone: 07:00 to 09:55
New York Morning Kill Zone: 14:30 to 16:55
New York Evening Kill Zone: 19:30 to 20:55
🔵 How to Use
🟣 Order Block
Order blocks are a distinct category of "Supply and Demand" zones, formed when a series of orders are grouped together. These blocks are often created by banks or other significant market participants.
Banks typically execute large orders in blocks during their trading sessions. If they were to enter the market with small quantities, substantial price movements would occur before the orders were fully executed, reducing potential profit.
To mitigate this, they divide their orders into smaller, more manageable positions. Traders should seek "buy" opportunities in "demand order blocks" and "sell" opportunities in "supply order blocks."
🟣 Fair Value Gap (FVG)
To pinpoint the "Fair Value Gap" on the chart, meticulous candle-by-candle analysis is essential. Pay close attention to candles with significant bodies, examining each candle alongside the one preceding it.
The candles flanking this central candle should exhibit elongated shadows, with bodies that do not intersect the body of the central candle. The span between the shadows of the first and third candles is referred to as the FVG range.
Note :
The origin of all Order Blocks and FVGs starts from inside a kill zone and extends up to the end of the same session.
🟣 Kill Zone Hunt
Following this strategy, after the conclusion of the kill zone and the stabilization of its high and low lines, if the price touches either of these lines within the same session and encounters a robust rejection, it presents an opportunity to enter a trade.
🔵 Setting
🟣 Global Setting
Show All Order Block :
If it is turned off, only the last Order Block will be displayed.
Show All FVG :
If it is turned off, only the last FVG will be displayed.
Show More Info Session :
If it is turned on, more information about kill zones (Trade Volume, Time, Number of Candles) will be displayed.
🟣 Logic Parameter
Pivot Period of Order Blocks Detector :
Enter the desired pivot period to identify the Order Block.
Order Block Validity Period (Bar) :
You can specify the maximum time the Order Block remains valid based on the number of candles from the origin.
Mitigation Level Order Block :
Determining the basic level of a block order. When the price hits the basic level, the order block due to mitigation.
🟣 Order Blocks Display
Demand Order Block :
Show or not show and specify color.
Supply order Block :
Show or not show and specify color.
🟣 Order Block Refinement
Refine Demand OB :
Enable or disable the refinement feature. Mode selection.
Refine Supply OB :
Enable or disable the refinement feature. Mode selection.
🟣 FVG
FVG Validity Period (Bar) :
You can specify the maximum time the FVG remains valid based on the number of candles from the origin.
Mitigation Level FVG :
Determining the basic level of a FVG. When the price hits the basic level, the FVG due to mitigation.
Show Demand FVG :
Show or not show and specify color.
Show Supply FVG :
Show or not show and specify color.
FVG Filter :
Enable or disable filtering of FVGs. Select filter mode.
🟣 Session
Show More Info Session Color
Asia Session, London Sesseion, New York am Session & New York pm Session :
Show or not show session and kill zones. Change the display color.
🟣 Alert
Send Alert When Touched Session high & Low :
On / Off
Alert Demand OB Mitigation :
On / Off
Alert Supply OB Mitigation :
On / Off
Alert Demand FVG Mitigation :
On / Off
Alert Supply FVG Mitigation :
On / Off
Message Frequency :
This string parameter defines the announcement frequency. Choices include: "All" (activates the alert every time the function is called), "Once Per Bar" (activates the alert only on the first call within the bar), and "Once Per Bar Close" (the alert is activated only by a call at the last script execution of the real-time bar upon closing). The default setting is "Once per Bar".
Show Alert Time by Time Zone :
The date, hour, and minute you receive in alert messages can be based on any time zone you choose. For example, if you want New York time, you should enter "UTC-4". This input is set to the time zone "UTC" by default.
Display More Info :
Displays information about the price range of the order blocks (Zone Price) and the date, hour, and minute under "Display More Info". If you do not want this information to appear in the received message along with the alert, you should set it to "Off".
在腳本中搜尋"smart"

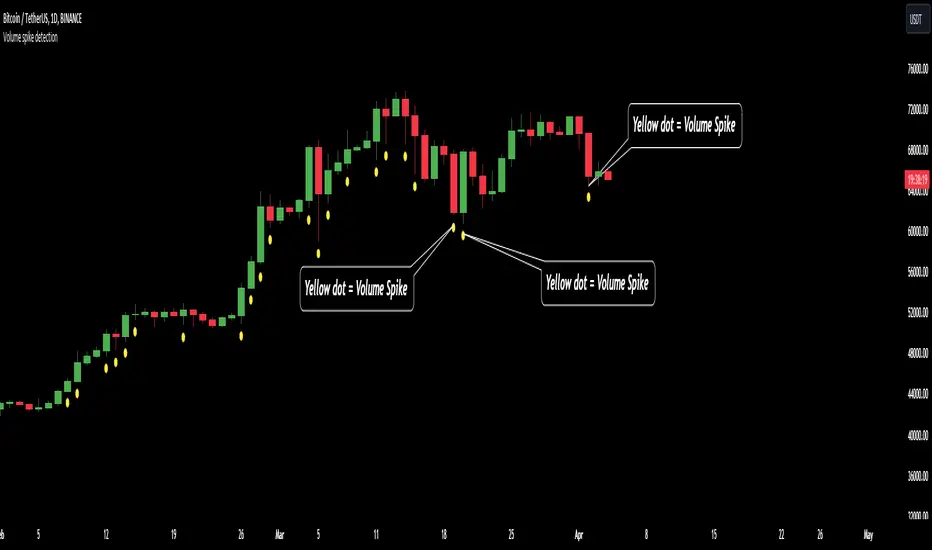
Volume spike detection🔶What it is ?
Volume spike detection that is a tool to help you to define Volume spike better to know whether that is a real signal to focus to trade/invest or you should skip it.
This indicator will measure the current trading volume and then compare with average trading volume to give out volume spike signal. A candle has volume spike that will be marked by a yellow dot below the candle.
Our purpose is, help traders to define Volume spike faster and easier by automation tools and save time during analyzation to give out an exactly investing decision.
What is Volume spike in detail ?
To help you to undertand better about Volume spike, please refer to below picture :
We're having some candles that their trading volume are higher than average volume (blue line on the bottom of chart). They're candles with volume spike and giving us the signal about a huge money flow joined to Bitcoin at that time. You should be careful if you're taking any position that is reversal with these trading volume.
🔶 Who can use it ?
1. All traders who are using NCI, ICT , Smart money concepts, MACD system and other systems...
2. Recommend to use it for H1 timeframe and higher
3. All traders who are trading on Forex, Crypto, Stock, Indicies...
4. All traders who are new or experienced traders
5. Recommend to use for investing or long swing trader
🔶 The purpose of indicator
1. Define big money flow when it joined to market.
2. Helping trader to define MOMENTUM of WAVE
3. Helping trader to define MOMENTUM of candle/price patterns
4. Always "Empty your mind" during Trading because you checked chart less with automation tool.
🔶 How will indicator appear on chart
After you added it on chart, indicator will mearsure and give out the candle having volume spike. Indicator will mark a yellow dot right below the candle for you to recognize the power better.
🔶 INPUT value
There're 2 input value that you can change if you need :
1. Spike ratio % : The value is over from average trading volume
As above picture, you can see we're having 3 volume that is over average trading volume.
The gap is from average value to highest trading volume is spike ratio.
2. Trading period : Here is length of period you want to compare.
For example, you want calculate average volume of 20 periods before as standard to compare and judge a volume spike.
I recommend to set these numbers as default.
🔶 How to use indicator
After setting indicator, indicator will mearsure and run automatically to mark volume spike below the candles on your chart.
You can combine volume spike with your own system to define momentum of wave, price patterns to trade or invest normally.
I hope this indicator help you to trade more effectively.
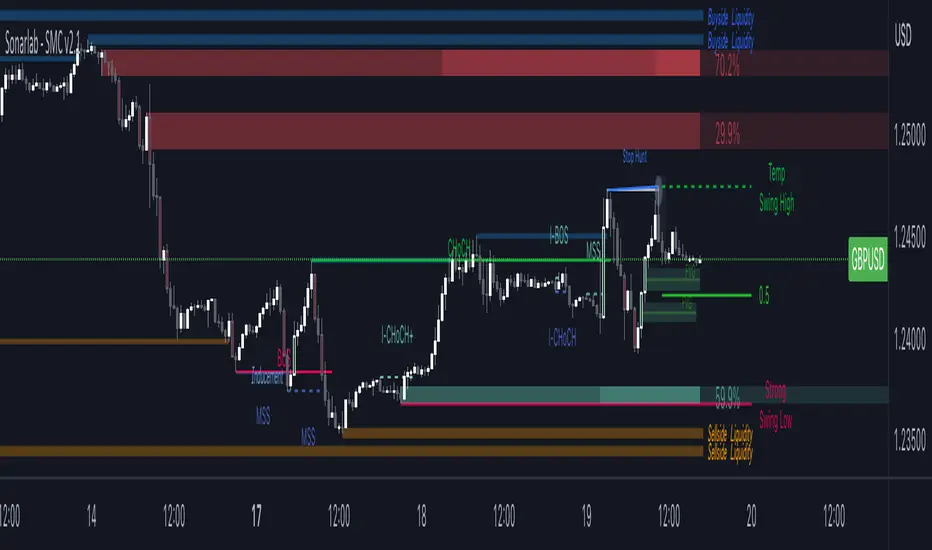
Market Structure with Inducements & Sweeps [LuxAlgo]The Market Structure with Inducements & Sweeps indicator is a unique take on Smart Money Concepts related market structure labels that aims to give traders a more precise interpretation considering various factors.
Compared to traditional market structure scripts that include Change of Character (CHoCH) & Break of Structures (BOS) -- this script also includes the detection of Inducements (IDM) & Sweeps which are major components of determining other structures labeled on the chart.
SMC & price action traders have historically considered this a more accurate representation of market structure by including these components.
🔶 USAGE
Below we can see a diagram for how market structure is displayed within the Market Structure with Inducements & Liquidity indicator.
Change of Characters (CHoCH) are based on swing points detection, while Break of Structures (BOS) are based on trailing maximum & minimums from the detected Change of Characters. We do this for a more dynamic & timely display of market structure.
🔹 Inducements (IDM)
Traders that consider inducements as a part of their analysis of Change of Characters & Break of Structures can more easily avoid fakeouts within trends as shown below.
In this script IDM's are always required between each market structures.
🔹 Sweeps of Liquidity (x)
SMC traders looking to properly analyze market structure need to look for sweeps of liquidity to ensure levels that are wicked are noted as sweeps, while levels that are fully closed above / below are labeled as confirmed market structures.
In the chart below we can see a Sweep of Liquidity which typically can occur on the longer term price action and indicate a potential reversal.
Notably, since labels such as CHoCH or BOS's can occur at the same level as a Sweep of liquidity, we have allowed the indicator to display the market structure label at the current bar in the event this happens.
The Sweeps of Liquidity are also based on trailing maximum / minimum, which allows for a continuous evaluation of areas for liquidity sweeps to occur.
This can be helpful for traders looking for longer term & shorter term sweeps.
🔶 SETTINGS
CHoCH Detection Period: Detection period for CHoCH's, higher values will return longer term CHoCH's.
IDM Detection Period: Detection period for IDM's, higher values will return longer term IDM's.
Thank you all for 500k followers on TradingView! Enjoy!

Lune Technical Analysis Premium⬛️ Overview
Lune Technical Analysis is a state-of-the-art TradingView indicator, meticulously designed to provide real-time market insights. Distinguished by its non-repainting features that operate in real-time, this tool brings enhanced accuracy and timeliness to your market analysis.
🟦 Features
Lune Technical Analysis equips traders with an array of innovative features:
🔹 Candle Coloring: The Candle Coloring feature introduces an innovative approach to visualizing market sentiment by coloring chart candles. It is devised to streamline your market analysis, offering a readily digestible snapshot of market trends. For example, if you aim to gauge the predominant market sentiment promptly, enable this feature for instant candle color-coding in accordance with prevailing bullish or bearish market structures. Though it currently supports only Market Structure-based Candle Coloring, its settings can be manipulated for enabling or disabling this feature. This feature operates by applying predefined algorithms that interpret market sentiment, coloring the candles accordingly.
🔹 Chart Pattern Detection: This sophisticated tool automatically detects and illustrates common chart patterns on your chart, simplifying the process of pattern identification. It identifies a range of patterns such as Head & Shoulders, Inverted Head & Shoulders, Ascending/Descending Wedges, Broadening Wedges, various Triangles, and Double Tops/Bottoms, enhancing your confluence detection in the market. For example, upon detecting a Double Top pattern, you could anticipate a potential price reversal due to this bearish signal. The sensitivity of this tool can be customized according to your trading style, with lower settings for short-term changes and higher for long-term. This feature leverages predefined formulas and price action analysis to identify these patterns.
🔹 Trendlines: With the Automatic Trendline Drawing tool, your technical analysis becomes significantly more efficient and precise. This feature is engineered to identify upward and downward Trendlines, aiding in locating potential pivots, and market support/resistance. For instance, if the price consistently rebounds off a Trendline, it may continue to do so, serving as a support/resistance level. However, a break through the Trendline could signal potential volatility and trend change. This feature's sensitivity to price changes can be adjusted to either short or long-term. It works by tracing Trendlines based on price action and wick formations to detect potential pivots.
🔹 Liquidity Bubbles: Liquidity Bubbles is an advanced tool that pinpoints key liquidity areas and large positions in real-time. This feature significantly contributes to effective trading strategy formulation by highlighting potential entry and exit points. It operates in real-time, ensuring zero repaint or lag, and supports two modes: Enhanced Bubbles and Basic Bubbles. For instance, the detection of multiple bullish Liquidity Bubbles during a ranging market could suggest an upward price movement due to dominant bullish volume. This feature's settings include thresholds for insignificant bubble filtering and a mode selection feature. Liquidity Bubbles operates by applying a proprietary formula to volume data, determining general volume direction and potential positions.
🔹 Market Structure: The Market Structure tool identifies key market structures such as Break of Structures (BoS) and Change of Character (ChoCh), thereby enhancing your ability to read market trends and sentiment. This smart money concept gives you a unique insight into short-term and long-term market trends. For instance, the appearance of a bullish Break of Structure and Change of Character after a predominantly bearish market sentiment could suggest a new bullish trend. This feature allows users to select which Market Structures to display and calculates these structures based on the market's high and low points.
🔹 Order Blocks: Order Blocks provide a visual representation of areas where large market participants are likely to place orders. These zones, where significant buying or selling activity has occurred in the past, offer insightful data for future price movements. The Order Blocks feature operates in real-time, providing real-time Order Blocks without any lag. For instance, if the price enters a large Order Block with predominantly bullish volume, an upward price movement can be anticipated. However, if the price breaks through the block, it could suggest the block's invalidation and a likely continued price fall. You can configure the settings to enable an additional Order Block, customize timeframes, overlap functions, and apply a quality filter. This feature calculates Order Blocks using the volume and candle size data.
🔹 Supply/Demand Zones: This real-time tool identifies crucial supply and demand zones, revealing potential price reaction points. These zones, where supply (selling pressure) and demand (buying pressure) have historically impacted price significantly, provide traders with insights into potential areas of strong support (demand) and resistance (supply). For example, if the price enters a large supply zone, a price rejection could be anticipated due to historical selling pressure at this zone. The settings enable users to add an additional Supply/Demand Zone, customize the timeframe, and apply a quality filter. This feature identifies common Supply/Demand Zones patterns based on volume and the size of the zone and displays them on the chart.
🔹 Fair Value Gaps: The Fair Value Gaps tool is designed to identify potential price correction zones or "gaps". These areas, where the market price sharply deviated from the fair value, suggest potential price adjustments in the future. For instance, the formation of a bullish Fair Value Gap could indicate a future price drop to fill this gap, potentially followed by an upward movement if the gap was of fair value. The settings allow users to enable additional Fair Value Gaps, customize the timeframe, and apply a quality filter. This feature measures large market gaps based on the size of the gap and its volume.
These features and tools collectively offer a comprehensive solution for traders to understand and navigate the financial markets. It's important to remember that they are designed to assist in making informed trading decisions and should be used as part of a balanced trading strategy.
🟧 Usage
Lune Technical Analysis's unique feature set can be leveraged both individually and synergistically. It is important to understand each feature and experiment with different configurations to best suit your unique trading needs.
🔸 Example #1: The following example demonstrates how the Order Block and Liquidity Bubbles feature can be used together to enhance your market analysis.
Order Blocks work in real-time to identify key order zones based on price action. These zones are often crucial for predicting price fluctuations. Meanwhile, Liquidity Bubbles act as real-time visual cues that detect significant market positions, facilitating an understanding of market accumulation, distribution, and trapped positions.
In this instance, at point 1, a bearish Basic and Enhanced Liquidity Bubble is visible within a crucial Order Block. The combination of these indicators augments the bearish sentiment, leading to a potential price decrease. Similarly, at point 2, the conjunction of two bullish Basic Liquidity Bubbles within an Order Block strengthens the bullish sentiment, culminating in a subsequent price increase.
🔸 Example #2: The following example demonstrates how Supply and Demand Zones can be used to detect strong and quality supports and resistance.
Supply and Demand Zones operate in real-time, detecting crucial zones based on price action and volume. This feature is invaluable for predicting potential price reaction points.
At point 1, the price enters a Supply Zone, a historical hotspot for selling activity, which usually leads to a price rejection and consequent decrease. At point 2, a Demand Zone indicating a bullish sentiment suggests a potential reversal when the price touches this level.
🔸 Example #3: The following example demonstrates how the Chart Pattern Detection feature is able to detect chart patterns to help enhance your trades.
Chart Pattern Detection employs formulas and price action analysis to identify common chart patterns as they form. Here, it successfully detects a 'Head and Shoulders' pattern, a conventionally bearish pattern, indicating a potential price drop.
🟥 Conclusion
Lune Technical Analysis stands as an exceptional blend of real-time insights into market activity. Its real-time, non-repainting features offer traders a more precise and timely approach to market analysis, promoting improved decision making in ever-changing market conditions.
🔻 Access
You can see the Author's instructions below to get instant access to this indicator & our Premium Suite.
🔻 Disclaimer
Lune Technical Analysis is a tool for aiding in market analysis and is not a guarantee of future market performance or individual trading success. We strongly recommend that users combine our tool with their trading strategies and do their due diligence before making any trading decisions.
Remember, past performance is not indicative of future results. Please trade responsibly.

Market Dynamics Pro [ChartPrime]ChartPrime Market Dynamics Pro is designed to cater to those traders who are more interested in market structures, price action and fundermentals. Analysing volume, key levels in the market, market phases and multi-timeframe can help a trader build a clearer and more actionable view of the market. ChartPrime performs analysis on data in a unique way therefore attempting to give insights into the market otherwise unseen.
Major Features:
Order blocks: The ChartPrime order blocks provide sleek and clear levels in the market where the price might find support and resistance. It is important to note this data isn't availible currently therefore these are derived from data outside of order books. Order blocks are segmented into 4 sections reflecting the volume at a given levels. Low, Medium, High and very high based on relevant and dynamic averages. This allows a trader to identify how significant a level is in the market in a simpler method. Bearish order blocks have a red color bias and bullish order blocks have a green color bias allowing a trader to identify what type of order block it is. The order blocks also dynamically show the remaining volume at that given level.
Pattern Detection: ChartPrime leverages unique pattern identification methods providing earlier and cleaner chart formations. Patterns are commonly used in trading to assess whether bulls or bears are performing optimally in a market or losing strength. ChartPrime identifies; Ascending wedges, descending wedges, symmetrical Triangles, H&S, iH&S, broadening wedges and double tops/bottoms. Patterns often have associated theory behind them for entries and targets that we suggest a trader covers before using this feature. ChartPrime also allow for the user to adjust where a pattern is drawn from. In pattern theory there are 2 main approaches to drawing a formation; from candle body and candle wick. ChartPrime allows for this to be adjusted by a user and also allow for alerts to be set on these patterns.
MTF SR: Taking into account multi timeframes when trading is a key idea. Having ideas of the larger market moves can provide deeper context when trading. ChartPrime Market Dynamics Pro allows for 3 varying SR plots from 3 varying user desired timeframes. These are graded via pivot analysis and grid analysis. This rank is on a 1-10 scale with 1 being the highest rank and 10 is the lowest.
Market Stucutures : These labels are commonly found and used by the Smart Money community. They denote a break of stucture and a chance of character. BOS are labelled when the price breaks a lower low or higher high (in the trending markets) and a CoC occurs when price breaks a trending market pivot. These break a market into clearer breakouts of price action and can help a trader deduce relevant moves. The indicator allows for the user to adjust the detection length of these structures.
Premium and Discount Zones: Premium and Discount zones are underpinned by a simple piece of logic. A premium zone is taken from a higher swing point and the discount from a lower swing point. Although a very generic approach this can show areas in the market that could see a reaction. An asset being in a discount zone implies the price is undervalued. An asset being in a premium zone implies the asset is overpriced or overextended. These are excellent when used in confluence with other SR methods. These naturally will have a delay as they are derived from swing points in a market but still are extremely relevant levels.
Fair Value Gaps: These are gaps in the market where price has seen a highly volatile move and they are assumed to act as magnets in the market. The price may come back and visit these 'gaps' after the move has occured. These are a common technique now used by traders and added to this toolkit for convinience.
Settings:
Order Blocks: Select the scale of the order blocks displayed
BoS/CoC: Toggle these on/off and adjust the lookback on these market structures
Premium/Discount Zones: Toggle on/off and adjust lookback
Enable FVG: Toggle on/off FVGs
Swing Levels: Enable basic swing levels in market
MTF Support/Resistance: Enable and select the relevant timeframe to obtain MTF SR levels on your chart. Up to 3 timeframes at a time.
Predictive Ranges: Toggle on/off
Trend Lines Detection: Toggle on/off trendlines
Wedge Detection: Adjust how patterns are detected; whether from wick or candle body
Toggles provided for relevant patterns.
Example usecases:
ChartPrime order blocks give a deeper insight into market support and resistance levels. Looking for order blocks labelled with High can indicate this level being a significant support or resistance in the market. Adding in further confluences here can assist further in deciding where the price may see a reaction. Take the screenshot below:
Adding in confluences from other timeframes can also help give a broader view. Using the multi time frame graded frame support and resistance levels we can use these to further assist us in finding significant levels in the market.
ChartPrime also provides breaker blocks. These are still significant levels in the market despite being "broken" prior. These too can be used in a classical manor and act as relevant areas in the market. These are particularly effective when used in confluence with Premium and discount zones. We can see in the example below price sees a strong reaction and bounces at these levels.
Market Dynamics Pro provides a comprehensive toolkit of unique features and mixes in the classical concepts allowing for a cleaner charting experience.
All content and indicators provided by ChartPrime are purely for informational & educational purposes only. Past performance does not guarantee future results.

Inversion GapsAn inverted fair value gap (FVG) occurs when candles start closing below a bullish FVG or above a bearish FVG and in this case, support FVGs become resistances and vice versa. This is a smart money concept introduced by ICT. While we a number of have indicators for FVGs, we don't have any for inversion FVGs. This indicator is just for that - it shows FVGs only after they're inverted.
The meat of it comes from being able to plot HTF inverted FVGs in LTF. In the above BTC chart, you can see M15 inverted FVGs plotted on M1 chart and you can see price respecting them. Mitigations can also be shown as lines (as you can see in the chart).
You can also setup alerts for formation and mitigation of such inversion FVGs.

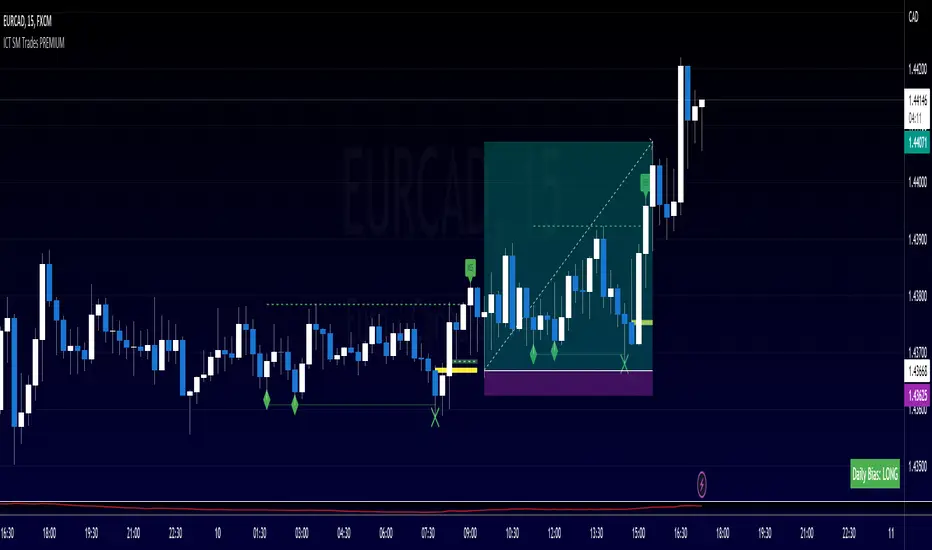
ICT SM Trades PREMIUMIndicator looks for ICT & Smart Money trades on any timeframe. These types of trades reveal how the big institutions, banks and hedge funds trade with big money. If they want their very big positions to be filled they need to find areas in chart where the majority of the money is sitting. Where is it? Where is the majority of orders placed? Right below supports or right above resistance, these orders are stoplosses or stop orders. So they need to push the price to these areas, take all the available stoplosses and trigger all the available stop orders in order to fill their positions and then push the price to the opposite side to make profit (and retail to lose).
Indicator looks for support or resistance (S/R) areas which are represented by dotted lines. This S/R areas are created by minimum of 2 pivot high/low (H/L). Every pivot H/L that creates the S/R area is marked with diamond label. This S/R area is called liquidity. After liquidity is created, indicator looks for liquidity grab (mostly represented by fast spike to this area - it is labeled with x-cross) and then price should go fast to the opposite side of the created structure. Indicator considers as a created structure everything that was created on the other side of the candles from the oldest pivot H/L which creates particular liquidity. For example, if liquidity is created with 3 pivot highs, indicator looks at the oldest pivot high and from there it is looking for the lowest low. Under this lowest low is dashed line which means that this level should be broken with closed candle. This action is called market structure shift (MSS), when the price shifted very fast from highs to lows. After MSS, when the price went fast to one direction, there were some imbalances in prices, in our example selling pressure was a lot bigger than buying pressure and there were created some long untested bearish candles. This untested areas in candles are called imbalances or gaps of fair value gaps (FVG). These are labeled with rectangles. It is expected that these gaps will be tested in near future to "balance the market".
We can put limit orders into these gaps (or into order blocks in PREMIUM indicator) and await some retracement after MSS to open our positions and after the positions are opened we can expect trend continuation in the direction where market structure shift was made (away from liquidity grab). So stoplosses can be placed above/below liquidity grab candle (marked with x-cross).
Alerts can be set for MSS to Long & Short and for liquidity grabs to Long & Short.
All settings of this indicator should be self-explanatory and most of them have tooltips for better understanding.
BIAS NotesUsage: This indicator allows you to note on your desired pair what is the current state of the trends.
!! How to use: You have to input the values for each table case to your desire in the indicator settings. !!
With this indicator you can note :
-what is the timeframe Bias
-which supply or demand we`ve just hit
I use this as a tool for my analysis with Insitutional Orderflow/SMC (Smart Money Concepts).

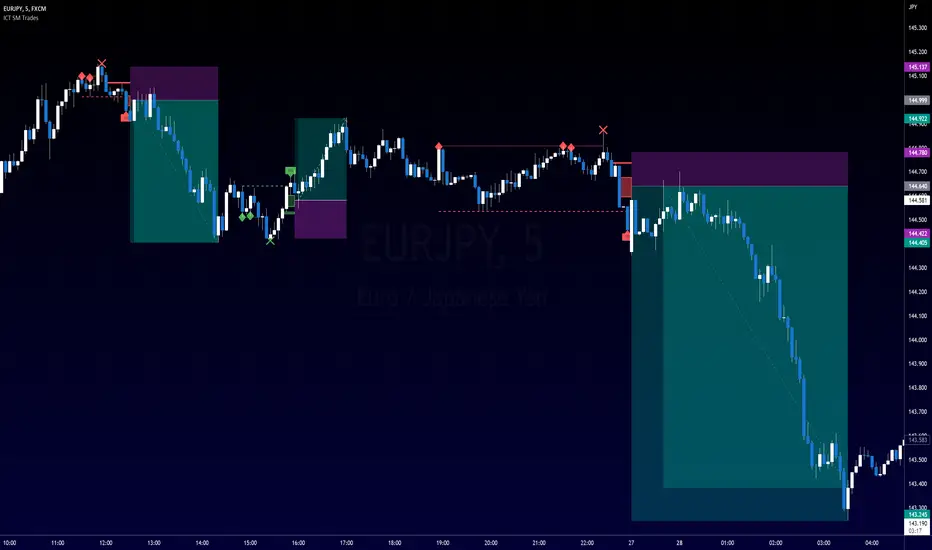
ICT SM Trades (liquidity find & grab, MSS, FVG, killzones)Indicator looks for ICT & Smart Money trades on any timeframe. These types of trades reveal how the big institutions, banks and hedge funds trade with big money. If they want their very big positions to be filled they need to find areas in chart where the majority of the money is sitting. Where is it? Where is the majority of orders placed? Right below supports or right above resistance, these orders are stoplosses or stop orders. So they need to push the price to these areas, take all the available stoplosses and trigger all the available stop orders in order to fill their positions and then push the price to the opposite side to make profit (and retail to lose).
Indicator looks for support or resistance (S/R) areas which are represented by dotted lines. This S/R areas are created by minimum of 2 pivot high/low (H/L). Every pivot H/L that creates the S/R area is marked with diamond label. This S/R area is called liquidity. After liquidity is created, indicator looks for liquidity grab (mostly represented by fast spike to this area - it is labeled with x-cross) and then price should go fast to the opposite side of the created structure. Indicator considers as a created structure everything that was created on the other side of the candles from the oldest pivot H/L which creates particular liquidity. For example, if liquidity is created with 3 pivot highs, indicator looks at the oldest pivot high and from there it is looking for the lowest low. Under this lowest low is dashed line which means that this level should be broken with closed candle. This action is called market structure shift (MSS), when the price shifted very fast from highs to lows. After MSS, when the price went fast to one direction, there were some imbalances in prices, in our example selling pressure was a lot bigger than buying pressure and there were created some long untested bearish candles. This untested areas in candles are called imbalances or gaps of fair value gaps (FVG). These are labeled with rectangles. It is expected that these gaps will be tested in near future to "balance the market".
We can put limit orders into these gaps and await some retracement after MSS to open our positions and after the positions are opened we can expect trend continuation in the direction where market structure shift was made (away from liquidity grab). So stoplosses can be placed above/below liquidity grab candle (marked with x-cross).
In settings of the indicator you can set whether only long or only short trades will be shown. Long trades are green and short trades are red. You can set if fair value gaps will be shown as well. The last thing in settings is session. You can set custom session which will be shown as background color on your chart.
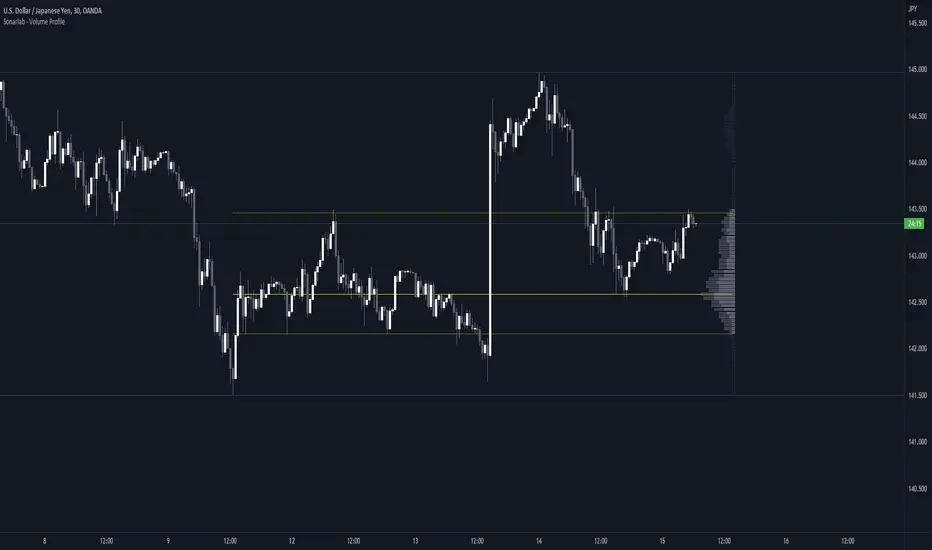
Sonarlab - Volume ProfileThis Volume Profile is a charting tool that traders use to show the traded volume amount over a given time period. The reason we build this volume profile indicator is to confirm S&D zones and show where the most volume is resting in a specific given time.
Settings
- Auto Placement: Option to have the Volume Profile automatically placed
- Manual Placement: Able to place and move the Volume Profile anywhere of your choosing
- Bull vs. Bear Candle Style
- Up/Down Candle Style
- Highlight Point of Control (PoC)
Usage:
Focused on combining with SMC:
When trading SMC, normal volume profiles can be confusing and hard to trade - since it will catch the volume on the overall chart you're on. When trading SMC, we are interested in catching specific parts in a range which defines supply or demand.
What makes this volume profile different?
The Sonarlab Volume Profile is focused on combining with SMC, integrated with Smart Money Concepts (SMC) levels, such as the Swing High and Low levels. The Indicator will automatically find the most applicable position using our custom Swing Levels to provide users with maximum utility with zero effort. Where other volume profiles are more focused on overall volume, this volume profile is focused on volume in a specific range on automation using swing points in the market.
As in this example, the high volume areas are matching with traditional supply and demand zones. The price level with the most volume is highlighted by the "point of control" (POC), displayed by the yellow line. We can consider price will react from those "high volume" areas and trade more easily through "low volume" areas.
Whale Momentum Wave Oscillator//Credits: @Noldo - Whale Trading System @rumpypumpydumpy - ALMA Ribbons @QuantNomad - Elastic Volume Weighted Moving Average
Composite Indicator, created by taking QuantNomad's EVWMA and using that as input for a variation of rumpypumpydumpy's ALMA Ribbons. Each Ribbon had its sub ribbons summed up and then averaged. The averages were then fed through the ta.rsi and the ta.mom functions giving us our momentum waves. Signal line created from the close value being fed through the ta. ema into the ta.rsi then ta.wma then ta.mom function. Why those in that order? No reason in particular just what I stumbled upon after many variations. I then overlayed Noldo's Whale Trading System to view what "whales" were doing, giving us a good view of when capital is flowing into and out the asset which often contradicts the momentum waves prior to trend changes. Provides a nice visual for how capital is moving along with momentum. Can see when smart money is buying up a big dip or of they seem to still be waiting on the sidelines.

Sonarlab - SMC Multi Timeframe add-onThe SMC HTF Indicator is an add-on for the original SMC Indicator . This add-on will show you multi timeframe Internal structure points, swing structure points and POI's. This will make it easier for you to do your multi timeframe analyses to speed up the process and save you chart work.
Main features:
- POI's
- Structure points (Swing and Internal)
- Trading panel (based on structure breaks)
Setting overview
Higher timeframe structure
Select timeframe {turn on/ off} / {amount to show}
Internal structure {turn on/ off} / {amount to show}
Swing structure {turn on/ off} / {amount to show}
POI {turn on/ off} / {amount to show}
OB Mitigation {wick/ close}
Alerts
Bullish/ bearish POI
Bullish/ bearish BOS
Bullish/ bearish CHoCH
Swing Bullish/ bearish BOS
Swing Bullish/ bearish CHoCH
Second higher timeframe structure
Select timeframe {turn on/ off} / {amount to show}
Internal structure {turn on/ off} / {amount to show}
Swing structure {turn on/ off} / {amount to show}
POI {turn on/ off} / {amount to show}
OB Mitigation {wick/ close}
Alerts
Bullish/ bearish POI
Bullish/ bearish BOS
Bullish/ bearish CHoCH
Swing Bullish/ bearish BOS
Swing Bullish/ bearish CHoCH
Trading panel
Styling options

Super OrderBlock / FVG / BoS Tools by makuchaku & eFeThis super indicator is a Swiss army knife for Smart Money traders for OrderBlocks / FVG / BoS
It provides many options for drawing (non-repainting) boxes for OrderBlocks, Fair Value Gaps (FVG) and Break of Structures. The boxes are extended into the future, until the first retest/mitigation.
Some of the additional options (not explained in the diagrams above)
PPDD OB : An order block which is formed after interacting with Liquidity (old low/high, fractal low/high, etc). Since these OB's are in the most premium or most discount, they are Premium Premium Discount Discount OB's (PPDD OB)
HVB Bars : When the volume of any bar is higher than the average volume of last N bars, it could mean something important (in the right context). Hence, the indicator allows for coloring them differently.
This indicator was built as a collaboration between @makuchaku & eFe
Pro tip : This indicator is a simply a tool to visualize trading concepts on the candle stick chart. It is the job of the trader to sequence these effectively into a profitable trade.
If you come across any bug or have a question on how to effectively use the indicator, please don't hesitate to ask questions.
Good luck & good trading!

Sonarlab - Smart Money ConceptsSupply and Demand is one of the core strategies used in trading. It focuses on the ancient laws of supply and demand and how price moves in a free-flowing market. Supply and demand zones are a popular analysis technique used in all kinds of trading styles. The zones are the periods of sideways price action that come before explosive price moves, and are typically marked out using a box. We wanted to make these squares drawn automatically for you - so it will save you time spotting the zones.
Green Box
The green box defines demand - in these areas you will look for long opportunities. You can also use these zones for take profit levels when you are in a sell trade.
Blue Box
The blue box defines supply - in these areas you will look for short opportunities. You can also use these zones for take profit levels when you are in a buy trade.
Break of structure
For markets to move up and down a break in market structure must occur. A break in market structure occurs when the market begins to shift direction and break the previous HH and HL or HL and LL of the market. We also integrated the feature that you can see the BOS lines. In the indicator settings you can adjust the values:
1) Sensitivity
2) Min. candles in structure
3) BOS type: close or wick
Warning Never blindly take a position on each box - wait for a proper signal to occur before considering a position.
LuxAlgo® - Price Action Concepts™Price Action Concepts™ is a first of it's kind all-in-one indicator toolkit which includes various features specifically based on pure price action.
Order Blocks w/ volume data, real-time market structure (BOS, CHoCH, EQH/L) w/ 'CHoCH+' being a more confirmed reversal signal, a MTF dashboard, Trend Line Liquidity Zones (real-time), Chart Pattern Liquidity Zones, Liquidity Grabs, and much more detailed customization to get an edge trading price action automatically.
Many traders argue that trading price action is better than using technical indicators due to lag, complexity, and noisy charts. Popular ideas within the trading space that cater towards price action trading include "trading like the banks" or "Smart Money Concepts trading" (SMC), most prominently known within the forex community.
What differentiates price action trading from others forms of technical analysis is that it's main focus is on raw price data opposed to creating values or plots derived from price history.
Mostly all of the features within this script are generated purely from price action, more specifically; swing highs, swing lows, and market structure... which allows users to automate their analysis of price action for any market / timeframe.
🔶 FEATURES
This script includes many features based on Price Action; these are highlighted below:
Market structure (BOS, CHoCH, CHoCH+, EQH/L) (Internal & Swing) multi-timeframe
Volumetric Order Blocks & mitigation methods (bullish & bearish)
Liquidity Concepts
Trend Line Liquidity Zones
Chart Pattern Liquidity
Liquidity Grabs Feature
Imbalance Concepts MTF w/ multiple mitigation methods
Fair Value Gaps
Balanced Price Range
Activity Asymmetry
Strong/Weak Highs & Lows w/ volume percentages
Premium & Discount Zones included
Candle Coloring based on market structure
Previous Highs/Lows (Daily, Monday's, Weekly, Monthly, Quarterly)
Multi-Timeframe Dashboard (15m, 1h, 4h, 1d)
Built-in alert conditions & Any Alert() Function Call Conditions
Advanced Alerts Creator to create step-by-step alerts with various conditions
+ more (see changelog below for current features)
🔶 BASIC DEMONSTRATION
In the image above we can see a demonstration of the market structure labeling within this indicator. The automatic BOS & CHoCH labels on top of dashed lines give clear indications of breakouts & reversals within the internal market structure (short term price action). The "CHoCH+" label is also demonstrated as it triggers only if price has already made a new higher low, or lower high.
We can also see a solid line with a larger BOS label in the middle of the chart. This label demonstrates a break of structure taking into account the swing market structure (longer term price action). All of these labels are generated in real-time.
🔶 USAGE & EXAMPLES
In the image below we can see how a trade setup could be created using Order Blocks w/ volume metrics to find points of interest in the market, swing / internal market structure to get indications of longer & shorter term reversals, and trend line liquidity zones to find more likely impulses & breakouts within trends.
We can see in the next image below that price came down to the highest volume order block marked out previously as our point of interest for an entry used in confluence with the overall market structure being bullish (swing CHoCH). Due to price closing below the middle Order Block at (24.77%), we saw it was mitigated, and then price revisited liquidity above the Trend Line zone above, leading us to the first Order Block as a target.
You will notice the % values adjust as Order Blocks are touched & mitigated, aligning with the correct volume detected when the Order Block was established.
In the image below we can see more features from within Price Action Concepts™ indicator, including Chart Pattern Liquidity, Fair Value Gaps (one of many Imbalance Concepts), Liquidity Grabs, as well as the primary market structures & OBs.
By using multiple features as such, users can develop a greater interpretation of where liquidity rests in the market, which allows them to develop trading plans a lot easier. Liquidity Grabs are highlighted as blue/red boxes on the wicks during specific price action that indicates the market has made an impulse specifically to take out resting buy or sell side orders.
We can notice in the trade demonstrated below (hindsight example) how price often moves to the areas of the most liquidity, even if unexpected according to classical technical analysis performed by retail traders such as chart patterns. Wicks to take out orders above & potentially trap traders are much more noticeable with features such as these.
The Chart Patterns which can be detected include:
Ascending/Descending Wedges (Asc/Desc Wedge)
Ascending/Descending Broadening Wedges (Asc/Desc BW)
Ascending/Descending/Symmetrical Triangles (Asc/Desc/Sym Triangle)
Double Tops/Bottoms (Double Top/Double BTM)
Head & Shoulders (H&S)
Inverted Head & Shoulders (IH&S)
General support & resistance during undetected patterns
In the image below we can see more features from within the indicator, including Balanced Price Range (another imbalance method similar to FVG), Market Structure Candle Coloring, Accumulation & Distribution zones, Premium & Discount zones w/ a percentage on each zone, the MTF dashboard, as well as the Previous Daily Highs & Lows (one of many highs/lows) displayed on the chart automatically.
The colored candles use more specific market structure analysis, specifically allowing users to visualize when trends are considered "normal" or "strong". By utilizing other features alongside this market structure analysis, such as noticing price retesting the PDL level + the Equilibrium as resistance, a Balanced Price Range below price, the discount with a high 72% metric, and the MTF dashboard displaying an overall bearish structure...
...users can instantly gain a deeper interpretation of price action, make highly confluent trading plans while avoiding classical technical indicators, and use traditional retail trading concepts such as chart patterns / trend lines to their advantage in finding logical areas of liquidity & points of interest in the market.
The image below shows the previous chart zoomed in with 2 liquidity concepts re-enabled & used alongside a new range targeting the same Discount zone.
🔶 SETTINGS
Market Structure Internal: Allows the user to select which internal structures to display (BOS, CHoCH, or None).
Market Structure Swing: Allows the user to select which swing structures to display (BOS, CHoCH, or None).
MTF Scanner: See market structure on various timeframes & how many labels are active consecutively.
Equal Highs & Lows: Displays EQH / EQL labels on chart for detecting equal highs & lows.
Color Candles: Plots candles based on the internal & swing structures from within the indicator on the chart.
Order Blocks Internal: Enables Internal Order Blocks & allows the user to select how many most recent Internal Order Blocks appear on the chart as well as select a color.
Order Blocks Swing: Enables Swing Order Blocks & allows the user to select how many most recent Swing Order Blocks appear on the chart as well as select a color.
Mitigation Method: Allows the user to select how the script mitigates an Order Block (close, wick, or average).
Internal Buy/Sell Activity: Allows the user to display buy/sell activity within Order Blocks & decide their color.
Show Metrics: Allows the user to display volume % metrics within the Order Blocks.
Trend Line Liquidity Zones: Allows the user to display Trend Line Zones on the chart, select the number of Trend Lines visible, & their colors.
Chart Pattern Liquidity: Allows the user to display Chart Patterns on the chart, select the significance of the pattern detection, & their colors.
Liquidity Grabs: Allows the user to display Liquidity Grabs on the chart.
Imbalance Concepts: Allows the user to select the type of imbalances to display on the chart as well as the styling, mitigation method, & timeframe.
Auto FVG Threshold: Filter out non-significant fair value gaps.
Premium/ Discount Zones: Allows the user to display Premium, Discount , and Equilibrium zones on the chart
Accumulation / Distribution: Allows the user to display accumulation & distribution consolidation zones with an optional Consolidation Zig-Zag setting included.
Highs/Lows MTF: Displays previous highs & lows as levels on the chart for the previous Day, Monday, Week, Month, or quarter (3M).
General Styling: Provides styling options for market structure labels, market structure theme, and dashboard customization.
Any Alert() Function Call Conditions: Allows the user to select multiple conditions to use within 1 alert.
🔶 CONCLUSION
Price action trading is a widely respected method for its simplicity & realistic approach to understanding the market itself. Price Action Concepts™ is an extremely comprehensive product that opens the possibilities for any trader to automatically display useful metrics for trading price action with enhanced details in each. While this script is useful, it's critical to understand that past performance is not necessarily indicative of future results and there are many more factors that go into being a profitable trader.
🔶 HOW TO GET ACCESS
You can see the Author's instructions below to get instant access to this indicator & our premium suite.

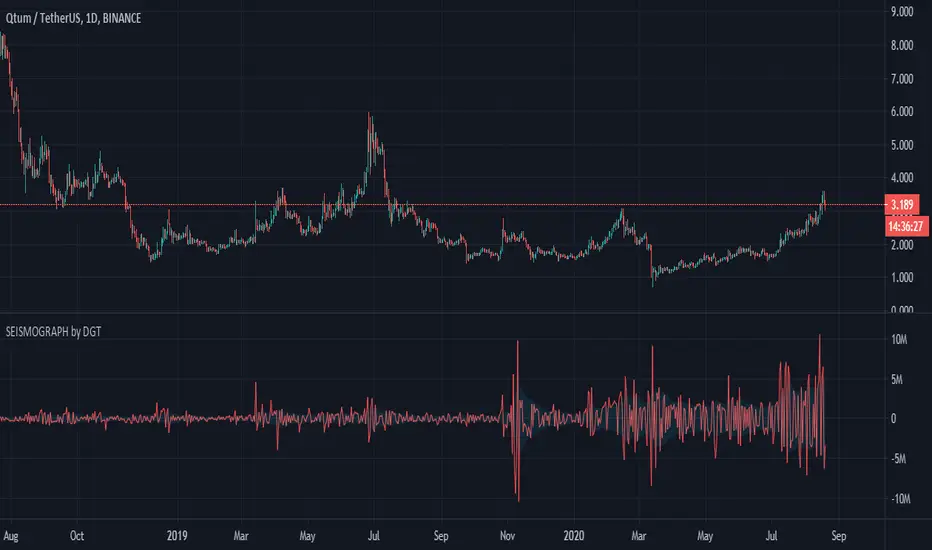
Earthquake Effect by DGTInstitutional investors have a profound impact on financial instruments prices because of the large volume, and their trading activities can greatly impact the price of financial instruments. They sometimes may split trades over time in order to not make a material impact and of course not to decrease liquidity to the point where there may be no one to take the other side of the trade.
Institutional investors (Smart Money) may create an Elephant Effect on the prices of financial instruments, and this study aims to display by emphasizing high volume changes
In the memory of the North Anatolian Earthquake that struck on August 17, 1999, that we remember with pain today, and similarities of plotting outcomes to seismograph plotting I preferred to name this study as Earthquake Effect (SEISMOGRAPH)
Disclaimer:
Trading success is all about following your trading strategy and the indicators should fit within your trading strategy, and not to be traded upon solely
The script is for informational and educational purposes only. Use of the script does not constitute professional and/or financial advice. You alone have the sole responsibility of evaluating the script output and risks associated with the use of the script. In exchange for using the script, you agree not to hold dgtrd TradingView user liable for any possible claim for damages arising from any decision you make based on use of the script
Badshai Trading ToolsBadshai Trading Tools is the tool where Buy and sell signals generates automatically according to the candles behavior.
It uses WD Gann Levels to calculate entry point with the help of VWAP .
Pivot points determines the recent support and resistance levels.
Trading rule for this indicator
This indicator is designed for Indian equity stocks
Best performance is expected on 10 minutes chart basic user can use 5 minutes chart for stock value less than 500 rupees, else 15 minutes chart
Plotted line shows the market sentiment, green for buy, red for sell and black for neutral market.
Order thumb rule
For buy signals there is a up triangle in green color
For sell signal there is a down triangle in red color
1. avoid any trade signal before 9:35 AM Indian time
2. signal and related stop loss candle must be formed in the same day
3. if order placed in 5 minutes chart then don't go for a target of 15 minutes chart
4. if order placed in 15 minutes time frame and target is too far then check the target in 5 minutes time frame
5. if signal candle touches the target then avoid the signal.
6. Money management is most important for this indicator.
7. Take trade only if it satisfy risk reward ratio.
8. It has long target but need patience.
Signal
using vwap calculates gann square of 9 levels and if any smart money activity on that level then checks the confirmation of the trend by higherhigh or lowerlow formation
Buy Entry : entry price should be on the high of the candle before signal for buy and sl on bottom of flagged candle just before signal
SellEntry : entry price should be on the low of the candle before signal for sell and sl on top of flagged candle just before signal
Please add some extra value to the Stop Loss for safe trading
Warning : Don't place any order without stop loss, This tool is made for educational and learning purpose only, take any trade at your own risk.

Intraday Masters AnalogyIntraday Masters Analogy is the tool where Buy and sell signals generates automatically according to the candles behavior.
It uses WD Gann Levels to calculate entry point with the help of VWAP.
Zigzag trend lines shows the momentum behavior for last few days and shows whether it following current trend or building new trend.
Pivot points determines the recent support and resistance levels.
Trading rule for this indicator
This indicator is designed for Indian equity stocks
Best performance is expected on 5 minutes chart or 15 minutes chart
Order thumb rule
1. avoid any trade signal before 9:35 AM Indian time
2. signal and and related stop loss candle must be formed in the same day
3. if order placed in 5 minutes chart then don't go for a target of 15 minutes chart
4. if order placed in 15 minutes time frame and target is too far then check the target in 5 minutes time frame
5. if signal candle touches the target then avoid the signal.
6. Money management is most important for this indicator.
7. Take trade only if it satisfy risk reward ratio
Signal
using vwap calculates gann square of 9 levels and if any smart money activity on that level then checks the confirmation of the trend by higherhigh or lowerlow formation
Buy Entry : entry price should be on the high of the candle before signal for buy and sl on bottom of flagged candle just before signal
SellEntry : entry price should be on the lowof the candle before signal for sell and sl on top of flagged candle just before signal
Warning : Don't place any order without stop loss

MCDX SmartMoneyHot Money Indicator is an indicator based on specific formula to detect Institutional/Banker investor activities..
Red means Smart Money Flowing in
Green means Retailer
Preferable to have RED more than GREEN to go long.

BullTrading Market StructureThere are many paths for profitability in the markets, but understanding the framework in which Smart Money operates is one valuable way to simplify the process, no matter if you are a scalper or a swing trader, by applying this concepts in your trading you will dramatically improve your performance (BullTrading will publish a book very soon).
BullTrading Market Structure is a background indicator that will display in your charts a Weekly Envelope, Daily Highs and Lows, end of Weeks and Days.
In order to properly visualize the indicator you will need to adjust the preferred colors and Format of your Chart Layout, simply click the small gear located at the top left corner from your charts, select "Background" and set the Vertical and Horizontal Grid transparency to 100%, also you must set and verify your individual timezone settings.
Best Regards
The BullTrading Team

MK_OSFT-Multi-Timeframe MA Dashboard & Smart Alerts-v2📊 Multi-Timeframe MA Dashboard & Smart Alerts v2.0
Transform your trading with the ultimate moving average monitoring system that tracks up to 8 different MA configurations across multiple timeframes simultaneously.
🎯 What This Indicator Does
This advanced dashboard eliminates the need to constantly switch between timeframes by displaying all your critical moving averages on a single chart. Whether you're scalping on 5-minute charts or swing trading on daily timeframes, you'll instantly see the big picture.
⭐ Key Features
📈 Multi-Timeframe Moving Averages
Monitor up to **8 different MA configurations** simultaneously
Support for **SMA and EMA** across 6 timeframes (5m, 15m, 1h, 4h, Daily, Weekly)
Each MA fully customizable: length, color, alert settings, and visibility
Smart visual representation with labeled horizontal lines and connecting plots
🚨 Intelligent Alert System
Cross-over/Cross-under alerts for price vs MA interactions
Three alert modes : No alerts, Once only, or Once per bar close
Smart batching system prevents alert spam during volatile periods
Queue management with 3-second delays between alerts for optimal performance
Easy alert reset functionality for "once only" alerts
📊 Real-Time Information Dashboard
Live countdown timers showing time remaining until each timeframe closes
Color-coded progress bars with gradient visualization (green → yellow → orange → red)
Instant cross-over detection with up/down arrow indicators
Price vs MA relationship clearly displayed (above/below coloring)
🎨 Professional Visualization
Anti-overlap technology prevents labels from clustering
Customizable label positioning and sizing options
Drawing order control (larger timeframes first/last)
Connecting lines link current price to MA values
Status line integration for quick value reference
💡 Perfect For
Multi-timeframe traders [/b who need complete market context
Trend followers monitoring key MA levels across timeframes
Breakout traders waiting for price to cross critical moving averages
Risk managers using MAs as dynamic support/resistance levels
Anyone wanting organized, clutter-free MA monitoring
⚙️ Highly Configurable
Moving Average Settings
Individual enable/disable for each of 8 MA slots
Flexible timeframe selection : 5m, 15m, 1h, 4h, Daily, Weekly
MA type choice : SMA or EMA for each configuration
Custom lengths from 1 to any desired period
Color customization for each MA line and label
Alert Management
Per-MA alert configuration : Choose which MAs trigger alerts
Source selection : Current bar vs last confirmed bar calculations
Frequency control : Prevent over-alerting with smart queuing
Reset functionality : Easily reactivate "fired" once-only alerts
Display Options
Table positioning : Top-right, bottom-left, or bottom-right
Label styling : Size, offset, and gap control
Line customization : Width and extension options
Timezone adjustment : Align timestamps with your local time
🔧 Technical Excellence
Optimized performance with efficient array management and single-pass calculations
Real-time vs historical mode handling for accurate backtesting
Memory-efficient label and line management prevents accumulation
Robust error handling and edge case management
Clean, well-documented code following Pine Script best practices
📋 How to Use
Add to chart and configure your desired MA combinations
Set alert preferences for each MA (none/once/per bar)
Create TradingView alert using "Any alert() function calls"
Monitor the dashboard for cross-over signals and timeframe progress
Use the info table to track all MA values and alert statuses at a glance
🎓 Educational Value
This indicator serves as an excellent educational tool for understanding:
Multi-timeframe analysis principles
Moving average confluence and divergence
Alert system design and management
Professional indicator development techniques
---
Transform your trading workflow with this professional-grade multi-timeframe MA monitoring system. No more chart hopping - get the complete moving average picture in one powerful dashboard!
© MK_OSF_TRADING | Pine Script v6 | Mozilla Public License 2.0

TRI - Smart Zones============================================================================
# TRI - SMART ZONES v2.0
## Professional Smart Money Concepts Indicator for Pine Script v6
============================================================================
## 📊 OVERVIEW
**TRI - Smart Zones** is a comprehensive Smart Money Concepts indicator that
combines multiple institutional trading concepts into a single, powerful tool.
Built with Pine Script v6 for optimal performance and reliability.
## 🎯 CORE FEATURES
### **Fair Value Gaps (FVG)**
- **Detection**: Automatic identification of price imbalances
- **Types**: Bullish and Bearish Fair Value Gaps
- **Threshold**: Customizable gap size requirements (0.1% default)
- **Extension**: Configurable zone projection length
- **Mitigation**: Real-time tracking of gap fills
### **Order Blocks (OB)**
- **Detection**: Volume-based institutional footprint identification
- **Types**: Bullish and Bearish Order Blocks
- **Method**: Pivot-based volume analysis with configurable lookback
- **Validation**: Market structure confirmation required
- **Extension**: Adjustable zone projection
### **BSL/SSL Liquidity Levels**
- **Multi-Timeframe**: Automatic higher timeframe reference
- **Dynamic**: Real-time level updates and extensions
- **Visual**: Clear line markings with timeframe labels
- **Smart**: Adaptive timeframe selection based on current chart
### **Fibonacci Extensions**
- **ZigZag Integration**: Advanced pivot point detection
- **Levels**: Customizable Fibonacci ratios (38.2%, 61.8%, 100%, 161.8%)
- **Projection**: Dynamic extension from swing points
- **Visual**: Subtle dashed lines with level/price labels
### **Smart Dashboard**
- **Zone Statistics**: Real-time FVG and OB counts
- **Success Rates**: Mitigation percentages for each zone type
- **Market Bias**: Intelligent bullish/bearish/neutral assessment
- **Positioning**: Customizable location and size
### **Zone Analysis Engine**
- **Technical Confluence**: RSI, ADX, ATR, Volume analysis
- **VWAP Integration**: Institutional price reference
- **Confidence Scoring**: High/Mid/Low signal classification
- **Signal Arrows**: Visual trade direction indicators
## 🔔 ALERT SYSTEM
### **Market Structure Alerts**
- `Market Bias Changed` - Shift in overall market sentiment
- `BSL Touched` - Buy Side Liquidity level reached
- `SSL Touched` - Sell Side Liquidity level reached
### **Zone Touch Alerts**
- `OB Touched` - Any Order Block interaction
- `Bullish OB Touched` - Bullish Order Block touch
- `Bearish OB Touched` - Bearish Order Block touch
- `FVG Touched` - Any Fair Value Gap interaction
- `Bullish FVG Touched` - Bullish FVG touch
- `Bearish FVG Touched` - Bearish FVG touch
- `Zone Touched` - Any Smart Zone interaction
- `Bullish Zone Touched` - Any bullish zone touch
- `Bearish Zone Touched` - Any bearish zone touch
## ⚙️ CONFIGURATION
### **Zone Detection**
- Enable/disable FVG and OB detection independently
- Maximum zones per type (3-15, default: 8)
- Zone-specific threshold and extension settings
### **Visual Customization**
- Individual color schemes for each zone type
- Adjustable transparency levels
- Configurable line styles and widths
- Dashboard positioning and sizing options
### **Technical Analysis**
- RSI, ADX, ATR period customization
- Volume threshold multipliers
- Confidence level color coding
- Signal display toggle
## 🚀 PINE SCRIPT v6 OPTIMIZATIONS
- **User-Defined Types**: Structured data for zones and statistics
- **Methods**: Type-specific operations for better code organization
- **Enhanced Arrays**: Optimized memory management
- **Switch Statements**: Improved performance for zone classification
- **Error Handling**: Robust input validation and edge case management
- **Performance**: Efficient algorithms for real-time analysis
## 📈 TRADING APPLICATIONS
### **Entry Strategies**
- Zone confluence for high-probability setups
- Multi-timeframe confirmation via BSL/SSL
- Fibonacci extension targets
- Signal arrows for directional bias
### **Risk Management**
- Zone mitigation for stop-loss placement
- Market bias for position sizing
- Dashboard statistics for strategy validation
### **Market Analysis**
- Institutional footprint identification
- Liquidity level mapping
- Market structure assessment
- Trend continuation vs reversal analysis
## 🔧 TECHNICAL SPECIFICATIONS
- **Version**: Pine Script v6
- **Overlay**: True (draws on price chart)
- **Max Objects**: 100 boxes, 100 lines, 50 labels
- **Performance**: Optimized for real-time analysis
- **Compatibility**: All TradingView chart types and timeframes

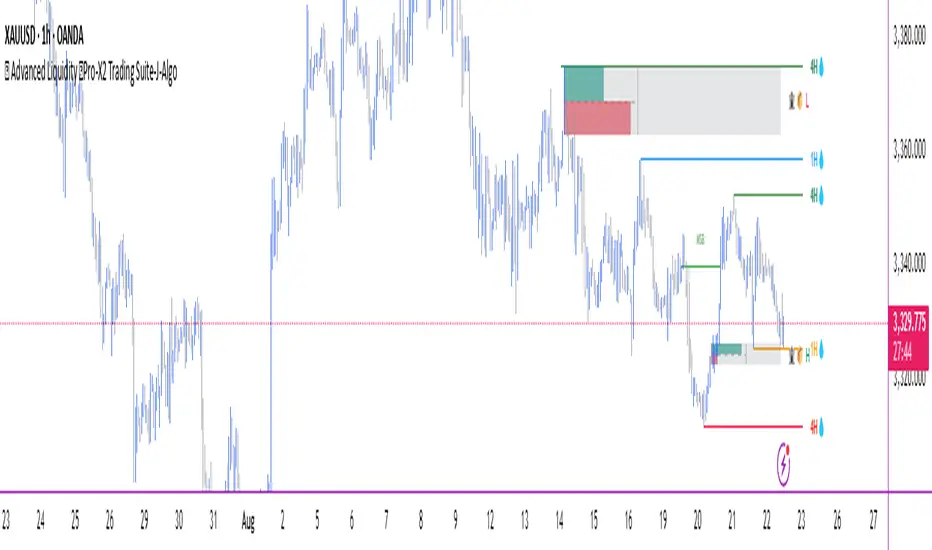
🏆 Advanced Liquidity 💧Pro-X Trading Suite-J-Algo# 🏆 Advanced Liquidity 💧Pro-X Trading Suite-J-Algo
## 📊 **INSTITUTIONAL-GRADE MULTI-TIMEFRAME TRADING SUITE**
Transform your trading with this comprehensive institutional-style indicator that combines **Smart Money Concepts**, **Market Structure Analysis**, and **Multi-Timeframe Liquidity Detection** in one powerful tool.
---
## 🎯 **KEY FEATURES**
### 💧 **Multi-Timeframe Key Liquidity Levels**
- **HTF (Higher Timeframe)**: Major institutional levels (4H, Daily, Weekly)
- **LTF (Lower Timeframe)**: Precision entry levels (1H, 4H)
- **CTF (Current Timeframe)**: Chart-specific liquidity zones
- **Smart Mitigation Detection**: Automatically removes hit levels or shows mitigated zones
- **Customizable Extensions**: Short, Current, or Maximum extension options
### ⚡ **Dynamic Trendlines with Breakout Detection**
- **Automatic Trend Recognition**: Self-adjusting bullish and bearish trendlines
- **Channel Formation**: Upper and lower channel boundaries
- **Breakout Alerts**: Real-time notification when trendlines break
- **Gradient Fill Options**: Beautiful visual presentation with transparency
- **Historical Tracking**: Option to keep broken trendlines visible
### 📦 **Institutional Order Blocks**
- **Volume-Weighted Strength**: Calculates bullish/bearish institutional pressure
- **Smart Overlap Detection**: Prevents cluttered display
- **Violation Monitoring**: Tracks when order blocks are breached
- **Visual Separation**: Clear distinction between buy and sell zones
- **Customizable Display**: Show last X order blocks for clean charts
### 🎯 **Premium/Discount Zones (PD Zones)**
- **Swing-Based Calculation**: Identifies key value areas
- **Three-Zone System**: Premium, Equilibrium, and Discount levels
- **Dynamic Updates**: Zones adjust with market structure changes
- **Color-Coded**: Easy identification of value zones
### 🔄 **Trading Sessions Analysis**
- **Major Sessions**: Asian, London, New York with custom times
- **Session Overlaps**: Highlights high-volatility periods
- **High/Low Tracking**: Session range identification
- **Timezone Support**: Full IANA timezone compatibility
- **Historical Sessions**: Multi-day session display
### 📊 **Market Structure Breaks (MSB)**
- **Real-Time Detection**: Identifies structure shifts instantly
- **Trend Confirmation**: Validates market direction changes
- **Visual Clarity**: Clean MSB line and label display
---
## ⚙️ **CONFIGURATION OPTIONS**
### 🎛️ **Master Controls**
- Toggle any feature ON/OFF for customized analysis
- Performance optimization with selective loading
- Clean interface with organized input groups
### 🎨 **Visual Customization**
- **Color Schemes**: Fully customizable colors for all elements
- **Line Weights**: Adjustable thickness for all lines
- **Text Sizes**: Multiple size options for labels
- **Transparency**: Gradient and opacity controls
### 🚨 **Alert System**
- **HTF Liquidity Hits**: Get notified when major levels are touched
- **Customizable Alerts**: Choose which events to monitor
- **Real-Time Notifications**: Instant alerts for trading opportunities
---
## 📈 **TRADING APPLICATIONS**
### 🎯 **Entry Strategies**
- **Liquidity Raids**: Trade reversals at key liquidity levels
- **Order Block Reactions**: Enter on institutional zone interactions
- **Trendline Breaks**: Capitalize on momentum shifts
- **Session Overlap Scalping**: High-probability setups during active periods
### 🛡️ **Risk Management**
- **Structure-Based Stops**: Use order blocks and liquidity levels
- **Multi-Timeframe Confirmation**: Align entries across timeframes
- **Premium/Discount Bias**: Trade with institutional flow direction
### 📊 **Analysis Framework**
- **Top-Down Analysis**: HTF bias, LTF precision entries
- **Market Structure**: Understand institutional sentiment
- **Session Awareness**: Trade during optimal market hours
---
## 🔧 **TECHNICAL SPECIFICATIONS**
### ⚡ **Performance Optimized**
- **Pine Script v6**: Latest version with enhanced performance
- **Smart Memory Management**: Efficient array and object handling
- **Selective Calculations**: Only processes enabled features
- **Display Limits**: Prevents chart overload
### 📱 **Compatibility**
- **All Timeframes**: Optimized for 5m and higher
- **All Markets**: Forex, Crypto, Stocks, Indices
- **All Devices**: Desktop, mobile, tablet responsive
### 🎯 **Best Performance**
- **Recommended**: 15m+ timeframes for optimal speed
- **Mobile Friendly**: Lightweight when features are selectively enabled
- **Multi-Chart**: Can run multiple instances efficiently
---
## 📚 **HOW TO USE**
### 🚀 **Quick Start**
1. **Add to Chart**: Apply indicator to your favorite pair
2. **Choose Timeframes**: Enable HTF (4H/Daily) and LTF (1H) liquidity
3. **Select Features**: Toggle on desired analysis tools
4. **Customize Colors**: Match your chart theme
5. **Set Alerts**: Enable notifications for key events
### 📊 **Professional Setup**
- **Multi-Timeframe Analysis**: Daily bias, 4H structure, 1H entries
- **Session Focus**: Trade during London/NY overlap for best results
- **Confluence Trading**: Combine liquidity + order blocks + trendlines
- **Risk Management**: Use structure levels for stops and targets
### 🎯 **Advanced Strategies**
- **Liquidity Sweeps**: Look for false breaks followed by reversals
- **Order Block Mitigation**: Enter on first touch of fresh blocks
- **Premium/Discount Entries**: Buy discount, sell premium
- **Session Breakouts**: Trade range breaks during session opens
---
## ⭐ **WHAT MAKES THIS SPECIAL**
### 🏆 **Professional Grade**
- **Institutional Concepts**: Based on how big money actually trades
- **Multi-Timeframe Integration**: Seamless analysis across timeframes
- **Smart Automation**: Reduces manual chart analysis time
- **Visual Excellence**: Clean, professional appearance
### 💎 **Unique Features**
- **Combined Analysis**: Multiple methodologies in one indicator
- **Smart Detection**: Automatic identification of key levels
- **Customizable Depth**: From beginner-friendly to expert analysis
- **Performance Focused**: Optimized for real-time trading
### 🎯 **Trader Benefits**
- **Faster Analysis**: Instantly see key levels and zones
- **Better Entries**: High-probability setups with confluence
- **Clearer Direction**: Understand market structure quickly
- **Professional Edge**: Trade like institutional traders
---
## 🛠️ **SETTINGS GUIDE**
### 💧 **Liquidity Settings**
- **Left/Right Bars**: Adjust sensitivity of level detection
- **Timeframes**: Choose HTF (4H, Daily) and LTF (1H, 4H) periods
- **Display Limit**: Control number of active levels
- **Extension**: How far to project levels
### ⚡ **Trendline Settings**
- **Period**: Lookback for pivot detection
- **Channel Padding**: Distance between trendline channels
- **Gradient**: Enable/disable fill effects
- **History**: Keep broken trendlines visible
### 📦 **Order Block Settings**
- **Swing Length**: Sensitivity of structure detection
- **Display Count**: Number of active blocks
- **Violation Type**: Wick or close-based breaks
- **Overlap**: Hide/show overlapping blocks
---
## 🎯 **PERFECT FOR**
### 📈 **Trading Styles**
- **Scalpers**: Session overlap and liquidity level trades
- **Day Traders**: Intraday structure and order block analysis
- **Swing Traders**: Multi-timeframe confluence setups
- **Position Traders**: Major timeframe liquidity and structure
### 💱 **Markets**
- **Forex**: All major and minor pairs
- **Crypto**: Bitcoin, altcoins, DeFi tokens
- **Stocks**: Individual stocks and ETFs
- **Indices**: S&P 500, NASDAQ, Dow Jones
- **Commodities**: Gold, Silver, Oil
### 🎯 **Experience Levels**
- **Beginners**: Start with basic liquidity levels
- **Intermediate**: Add order blocks and sessions
- **Advanced**: Full suite with custom alerts
- **Professionals**: Multi-timeframe institutional analysis
---
## 🚀 **GET STARTED TODAY**
Ready to trade like the institutions? This indicator provides everything you need for professional market analysis in one comprehensive package.
**Add to your charts now and experience the difference institutional-grade analysis makes!**
---
## 📞 **SUPPORT & UPDATES**
- **Regular Updates**: Continuous improvement and new features
- **Community Support**: Active user community
- **Documentation**: Comprehensive setup guides
- **Compatibility**: Always updated for latest TradingView features
---
*Transform your trading with institutional-grade analysis. Join thousands of traders using professional Smart Money Concepts for consistent market success.*
**🏆 ADVANCED LIQUIDITY 💧PRO-X TRADING SUITE-J-ALGO** - Your Gateway to Institutional Trading