Smart Money Concept + Strategy Backtesting Toolkit [Shah]This indicator, primarily designed for strategy backtest. It’s important to emphasize that the orders generated by this indicator are in the form of stop-limit orders .
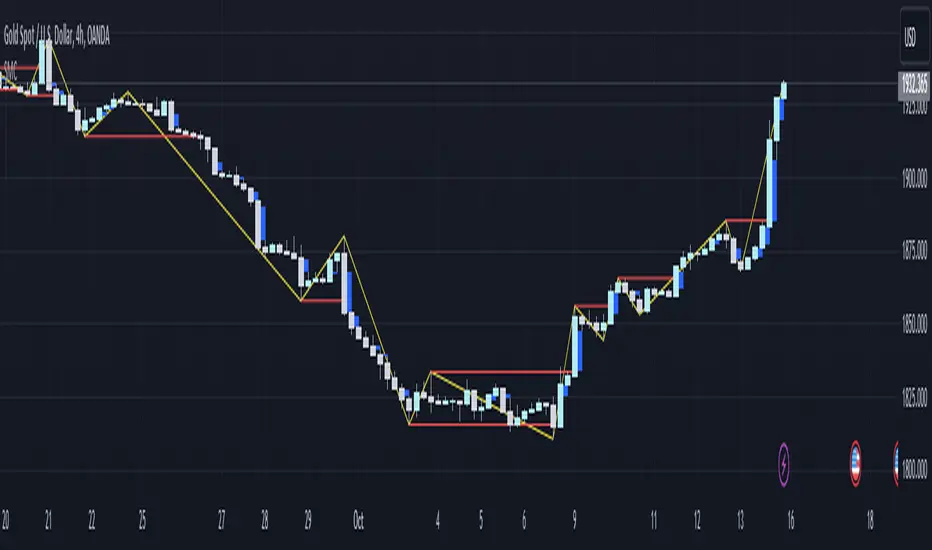
For Long setup , When lower lows and lower highs form, after price moving up from the last higher high, a “change of character” occurs. Entry will takes place in the golden zone.
This the Long setup:
And this is the Long setup Example on chart:
For Short setup , When higher lows and higher highs form after the price moves down from the last higher low, a “change of character” occurs. Entry will take place within the golden zone.
This the Short setup:
And this is the Short setup Example on chart:
Key Features:
Date Period:
Users can customize the date period during which the strategy is tested, allowing for a more granular analysis of performance over specific timeframes.
DCA Entry:
Entry is based on Fibonacci level between the Lower Low and Higher High pivots for Long deals .
Entry is based on Fibonacci level between the Higher High and Lower Low pivots for Short deals .
Allowing a second entry with a specified position size
Entering at a different price based on a Percent or ATR change.
There is a feature that If the risk-to-reward ratio is below the specified input (rr), the trading deal wont initiate, and the signal alert wont be triggered.
Stop Loss:
Adjustable based on Fibonacci levels , Percent and ATR.
The percent and ATR is calculate from LL pivot point for Long and HH pivot point for short (not Entry price)’
Targets:
Adjustable based on Source, Fibonacci levels , Percent and ATR.
Source indicates the maximum (minimum) value between the open and close of the candle where the Higher High (Lower Low) pivot point was formed for Long (Short) deals.
Percent and ATR calculates from Entry 1 Price
There is a feature that closes the part of the position size at Target 1 based on a percentage, leaving the rest to close at Target 2, entry, exit price, or stop loss.
Plots:
The visual representation of the indicator includes the key plots:
Reset Deal Calculation Fibonacci Level
Alert Fire Fibonacci Level
Entry 1
Entry 2
Entry Average
Stop Loss
Target 1
Target 2
Labels:
Displays informative labels upon trade open and close, providing details about each transaction like gain and equity and etc.
Risk Management:
Allows setting initial capital, risk per trade, and commission for each transaction.
Score Table:
Provides statistical information for Regular deals (refers to deals that closed in Target price or Stop loss price) and Exited deals (representing deals that didn’t touch the stop loss or targets.):
Number of trades
Win rate
Profit factor
Average Risk to Reward ratio
Total Profit and Loss (PnL)
Commission paid
Live equity
It should note that Winrate calculated based on closed deals at target or stop loss. (Exited trades doesn’t into account in calculation of Winrate)
Exit Methods :
The goal is to offer users a diverse set of exits before the price touches the target or stop loss.
1. Pending Entry Time-out
cancel pending entry based on candle counting since alert fired. (before deal started)
2. Break Even
If Target 2 is reached, the stop loss automatically adjusts to the entry price.
3. Active Deal Reverse
If a deal (long or short position) is currently open, and the reverse signal is emitted, the script will close the existing deal.
4. Reverse Deal Exit
If a deal (long or short position) is currently open, and the reverse signal is emitted, the script will automatically close the existing deal.
5. Move Exit
With this method, if Entry 2 is triggered, the deal will be closed when the price touches the Entry price.
6. Candle Counting Exit
This exit type is based on the number of candles since the deal started.
7. Profit Zone Shield Exit
Once a deal enters profit, the Exit level moves to the entry level after reaching a Fibonacci level between TP1 and Entry 1.
Deep Backtesting Table:
It includes:
Time period of the backtest
Pair name and timeframe
Count the long and short trades
Win streak and loss streak
Total deal chances and missed chances
Count the deals goes directly from entry 1 to tp1 and entry 2 to tp1
Count the deals that touched entry 2 and entry 2 filled percent
Count the number of each exit type
Other statistics such as CAGR, Sharpe, Kurtosis, Skewness, and Max Drawdown.
在腳本中搜尋"smart"

Smart money conceptThe indicator tracks the smallest movements of price action. It can monitor and analyze market context, attempting to identify trends within each time frame.
If a candle has its entire body above the previous swing high, it indicates a strong upward momentum. The market is leaning towards an upward direction. If the candle remains within the range of the previous swing high, it signifies weak upward momentum. The market is reluctant to move higher.
If a candle has its entire body below the previous swing low, it reflects a strong downward momentum. The market is leaning towards a downward direction. If the candle remains within the range of the previous swing low, it indicates weak downward momentum. The market is reluctant to move lower.
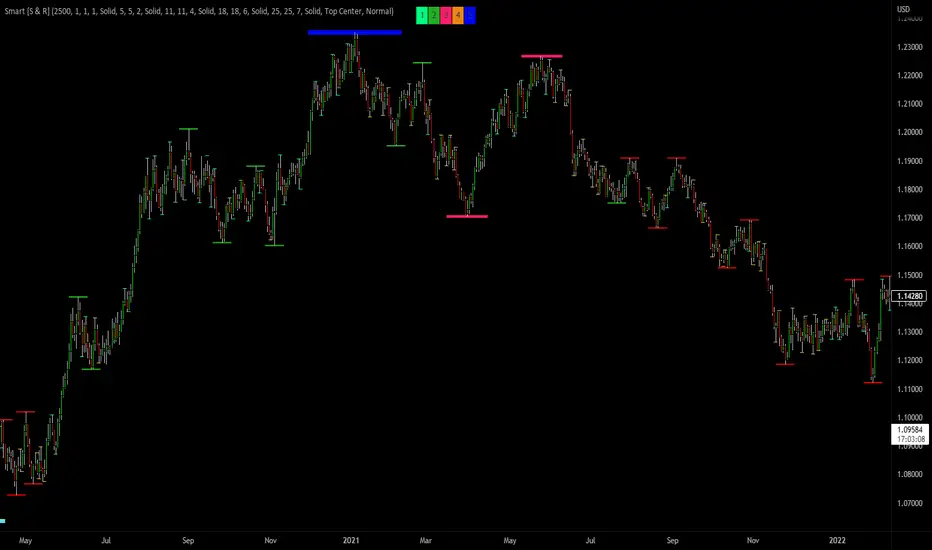
Smart Support & Resistance(My goal creating this indicator): Provide a way to categorize and label key structures on multiple different levels so I can create a plan based on those observable facts.
The Underlying Concept / What is Momentum?
Momentum indicates transaction pressure. If the algorithm detects price is going up, that would be considered positive momentum. If the algorithm detects price is going down negative momentum would be detected.
The Momentum shown is derived from a price action pattern. Unlike my previous Support & Resistance indicator that used Super Trend, this indicator uses a unique pattern I created. On the first bar bearish momentum is detected a resistance Level is made at the highest point of the previous bullish condition. On the first bar bullish momentum is detected a support Level is made at the lowest point of the previous bearish condition. This happens on 5 different Momentum Levels, (short-term to long-term). I currently use this pattern to trade so the source code is protected.
What is Severity?
Severity is How we differentiate the importance of different Highs and Lows. If Momentum is detected on a higher level the Supply or Demand Level is updated. The Color and Size representing that Level will be shown. Demand and Supply Levels made by higher levels are more SEVERE than a demand level made by a lower level.
Technical Inputs
- to ensure the correct calculation of Support and Resistance levels change BAR_INDEX. BAR_INDEX creates a buffer at the start of the chart. For example: If you set BAR_INDEX to 300. The script will wait for 300 bars to elapse on the current chart before running. This allows the script more time to gather data. Which is needed in order for our dynamic lookback length to never return an error (Dynamic lookback length can't be negative or zero). The lower the timeframe the greater the number of bars need. For Example, if I open up a 1min chart I would enter 5000 as my BAR_INDEX since that will provide enough data to ensure the correct calculation of Support and Resistance levels. If I was on a daily chart, I would enter a lower number such as 800. Don't be afraid to play around with this.
- Toggle options (Close) or (High & Low) creates Support and Resistance Levels using the Lowest close and Highest close or using the Lowest low and Highest high.
Level Inputs
- The indicator has 5 Different Levels indicating SEVEREITY of a Supply and Demand Levels. The higher the Level the more SEVERE the Level.
Display Inputs
- You have the option to customize the Length, Width, Line Style, and Colors of all 5 different
- This indicator includes a Trend Chart. To Easily verify the current trend of any displayed by this indicator toggle on Chart On/Off. You also get the option to change the Chart Position and the size of the Trend Chart
How Trend Is being Determined?
(Close > Current Supply Level) if this statement is true technically price made a HH, so the trend is bullish.
(Close < Current Demand Level) if this statement is true technically price made a LL, so the trend is bearish.
- Fully customize how you display Market Structure on different levels. Line Length, Line Width, Line Style, and Line color can all be customized.
How it can be used?
(Examples of Different ways you can use this indicator): Easily categorize the severity of each and every Supply or Demand Level in the market (The higher Level the stronger the level)
: Quickly Determine the trend of any Level.
: Get a consistent view of a market and how different Levels are behaving but just use one chart.
: Take the discretion from hand drawing support and resistance lines out of your trading.
: Find and categorize strong levels for potential breakouts.
: Trend Analysis, use Levels to create a narrative based on observable facts from these Levels.
: Different Targets to take money off the table.
: Use Severity to differentiate between different trend line setups.
: Find Great places to move your stop loss too.
Smc Best Time Zone [VINO]smart money concepts
best time zone For Scalping
This Time Enter Trade
Best Move Market

Smart Reg channel [monpotejulien]This indicator calculates an adaptative regression channel over a specified period or interval.
Resources:
rosettacode.org
en.wikipedia.org

Smart ColorThis script color bars to filter the noise.
If the bar color is green, the price is either ranging or going up so we considere that the momentum is for longs
If the bar color is red, the price is either ranging or going down so we considere that the momentum is for shorts
I use this indicator in 3 ways.
In confirmation with other indicators to get early in a trade. Let's say I see a short divergence and i want to enter only when the momentum is going down. So i will wait that bar color pass to red to enter in a position.
I can also use this indicator alone, but if i do so, since i am more a counter trend trader, i will first wait a lower low with a nice % of variation for the past series of the same color, so when it will change color, there is a higher chance that the price retrace more % and my profit target have more chance to be hit.
And the last way I use this indicator is to exit a position at a "better price". In profit : Let's say i am long and i am fine with the profit i have.Then I decide to put my profit target 0.5% above the actual price. But if the bar color change to red, i will close my trade even if my target is not hit. In loss : Let's say i have a trade with negative PNL and the bar color just changed in my direction. So at the place of taking a loss right now, i will wait the potential little upward, and whenever the barcolor will change again against me, I will close it here. It is just a little optimisation. But the sum of all little optimisation is decent
How to parameter this script?
To parameter it you need to understand how it works. If you have too many variation of colors. It means there is too much noise.
There is an input that you can change to filter the level of noise you want to filter. The defval = 5, step = 1 ,minval = 1, maxval =100.
So from defval, up it up to a level in which noise is filtered ; a level in which candle succession of the same color does a nice % variation.

NiGapo Notes / Remember Rules / Anchored TextThis is a notes indicator.
You can customize up to 15 lines.
You can use different textsize and customize the background and font color.
You can also disable/enable or choose different border width.

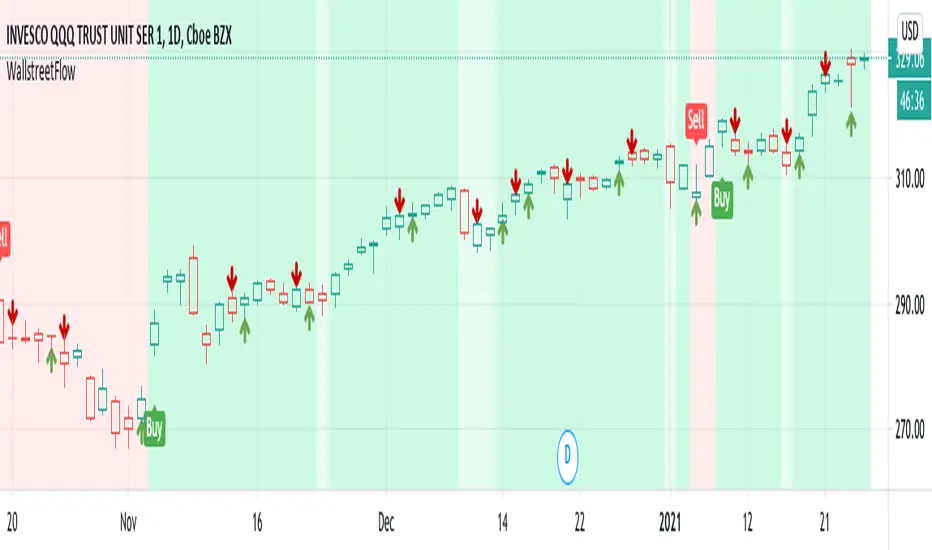
Smart Money Flow v.2.0 BY Stock_InshotsThis Indicator is made by combination of indicators as follows
1) Super Trend - Period 15,2.5
Signal Filtered on the closing basis of SMA High 20 for strength
2) Simple Moving Average - period 50
In which Purple indicates Uptrend
Orange Indicates down trend
3) Bill William's Fractal - This indicator indicates important candle for formation of swing of High or low with Triangle shape at the bottom & top on the chart .
After Signal one can wait for fractal candle formation also for Big risk reward Ration
Buy Setup : After signal Try to place long order near Sma50
Sell Setup : After signal Try to place Short order near Sma50
If missed wait for next Signal , Don't Run behind Price
Keep Trailing Your Stop loss with ATR Values
Note : Nothing is 100% , You may customize this indicator according to your values .
Best to use with other momentum / strength indicator before taking positions
Like RSI / Support & Resistance Levels
For Targets use BB% levels / Pivot Points / Fibonacci levels / Nearest Demand & Supply Zone
Thanks to the Trading view as i used open Source Codes in combination of this indicator. it helped a lot .
Feedback will be welcomed .
Refer Image

SMART indicatorThis script combines the usage of the SMA and ATR indicator in order to provide signals for opening and closing trades, either buy or sell signals. It uses SMA and ATR, both configurable by the users.
The trigger of Buy and Sell Signals are calculated through the SMA and ATR:
* Buy Signals: They are highlighted by a dark green background area.
* Sell Signals: They are highlighted by a dark red background area.
The trigger of Close Buy and Close Sell Signals are calculated through current price using SMA and ATR:
* Close Buy Signals: The fast SMA crosses under the close price and at the same time the trend is bullish. They are highlighted by a lighter green area.
* Close Sell Signals: The fast SMA crosses over the close price and at the same time the trend is bearish. They are highlighted by a lighter red area
Few important points about the indicator and the produced signals:
* This is not intended to be a strategy, but an indicator for analyzing the market conditions. It gives you the triggers depending on the real time analysis of the prices, but not being a proper strategy, pay attention about "fake signals" and add always a visual analysis to the provided signals
* Following this indicator, the trade positions should be opened only when background color appears GREEN. Either in this case, analyze the chart in order to see if the signals are "weak" ones, due to "waves" around the SMA . In these cases, you might wait for the next confirmation signals after the waves, when the trend will be better defined
* The close trade signals are provided in order to help to understand when you should close the buy or sell trades. Even in this case, always add a visual analysis to the signals, and pay attention to the support/resistance areas. Sometimes, you can have the close signals in correspondence to support/resistance areas: in these cases wait for the definition of the trend and eventually for the next close trade signals if they will be better defined
Final Notes
* Indicator will show Trend, Pullback, Market bounce and some support and resistance level.
Smart Money Entry (Bursa)Calculate any entry price transaction
Red is cumulative of banker money, default value is RM 150,000 entry in every resolution
Orange is cumulative of big money, default value is RM 50,000 entry in every resolution
Green is cumulative of retailer money, default is below RM 50,000 entry in every resolution
All can be set in variable resolution, check in the setting

Smart Forex Buy Sell Signal by LukasHi again!
So, this is BUY and SELL signal base on Price action, RSI, and Correlation between Forex Major Pairs.
It's only work for Forex Major Pairs because I only took their data.
Included alert : Spec, Buy, Strong
Recommended to wait for double signal :
Spec Buy > Buy or Spec Sell > Sell
Buy > Strong Buy or Sell > Strong Sell
So execute after the second signal triggered.
It's indicate the trend.
Looking forward for your feedback to improve the script.
Thank you.
It's better combine it with Moving average indicator to indicate direction, I use Moving Average Adaptive Q from cheatcountry to help me make decision.

Smart Indicator 28 - Swing Pivots (Higher Highs and Lower Lows)A simple way to find Higher Highs and Lower Lows (HH and LL) whit automatic Fibonacci Lines in the most common levels.
In this indicator the Higher Highs only happens when a high value are rising from each other in the last "Length of Real Pivots" highs and the next same number of highs are falling in every single bar.
The Lower Lows are inverted, LL only appears if a low is falling in every single bar in the last number of length and the lows price of the "n" bars next are rising.
You can use this Indicator in any kind of market.

Smart Indicator 21 - Fibonacci LinesA simple Indicator that create Fibonacci Lines as Price.
It's a good way to see next Support and Resistance.

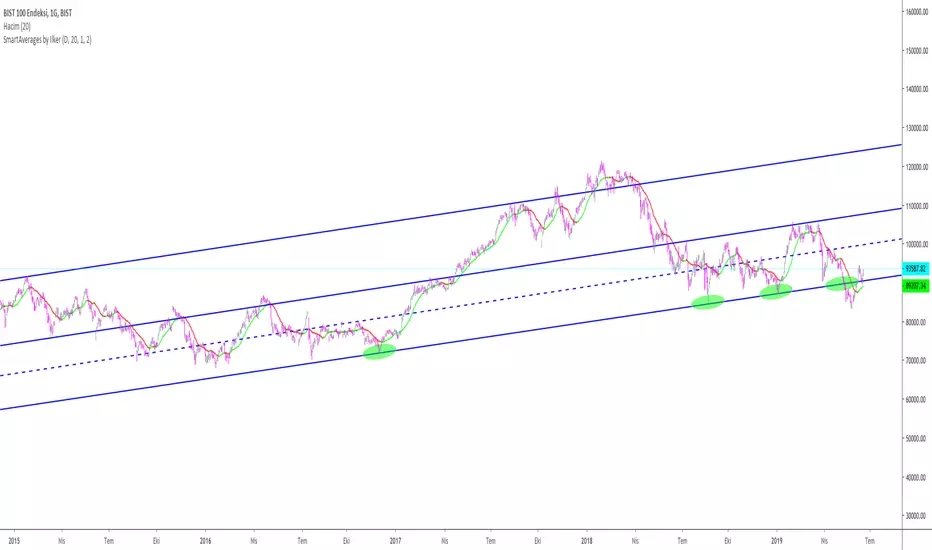
Smart Envelope - Running Away From The TrendIntroduction
Envelopes indicators consist in displaying one upper and one lower extremity on the price chart. They are most of the time built by adding/subtracting a volatility estimator (rolling stdev, atr, range...etc) to a central tendency estimator (SMA, EMA, LSMA...etc) . Their interpretation is often subject to debate amongst technical analyst, some will use a support and resistance methodology, where price will start a downtrend once it cross the upper extremity, and a down trend once it cross the lower one. Others will prefer a breakout methodology, where price will reach higher highs once it cross the upper extremity, and lower lows when it cross the lower one. Because of price non stationarity its hard to select the best methodology, the support and resistance one will mostly work on ranging markets, while the breakout methodology mostly work on trending ones.
Therefore new methods where proposed, instead of using moving averages with a high lag, faster filters where used, such as the least squares moving average or zero lag exponential moving average, other band indicators where also created using adaptive filters, but improvements remain relatively low. The most difficult task would be to make extremities with the ability to return accurate support and resistances levels, and today i want to provide a new way to construct such extremities by using the recursive bands framework that allow extremely creative and efficient indicators.
The Main Idea
With classical bands indicators, the upper and lower extremity will still be correlated with the main trend, the problem behind such method is that we can't use a support and resistance methodology with trending markets, the fact that reversals exist tells us that our extremities will always be crossed by the main trend, here is an example :
Here the support is correlated with the main trend, in order for it to be accurate we must assume the trend will go on for ever, and will only detect higher lows, this is what we expect with the orange line, but we can see that a severe down trend totally destroy our plan.
In short we need to give some headroom to our extremities, and thus one extremity can't be correlated with the main trend.
The proposed Indicator
We want to minimize the correlation between the extremities, so if the upper extremity rise, the lower one must fall. This allow to give some headroom and allow the user to anticipate larger movements, this is how bands seeking to give support and resistances points should work.
The indicator has a length setting that control the wideness of the extremities, unlike other indicators low values such as 14 can still create really wide bands, take that into account.
length = 5. Lower length values allow for more motion from the extremities, but does not necessarily involve detecting shorter terms support and resistances levels. The factor setting is not that important, but it allow to return extremities with more motion when high, and really wide bands when below 1 and greater than 0.
Central Tendency Estimator
Something fun with the recursive band framework is that the bands are no longer based on the central tendency estimator but its the central tendency estimator who is based on the bands. The central tendency estimator can also provide support and resistances points with the price, like classical moving averages, altho its lack of motion is this time a downside.
Conclusion
Altho the extremities are more accurate than other band indicators, the problem remain the same, larger trend will always break the extremities and continue creating higher/lower highs/lows, at this point our stop loss would certainly be triggered. This is a huge downsides of contrarian strategy, we sure might anticipate reversals earlier, but we are exposed to larger price movements, therefore the risk is extreme.
But the proposed methodology might still prove useful to develop more robust support and resistances levels based on envelopes indicators.
Thanks for reading !


Smart MexShark [Eric]This is an epic trading tool-set,
You can activate 4 different modes:
1) BackGround color
2) Scalping Mode
3) Slow Trend
4) Rapid Trend
Invited Only.


Smart Impulse [Eric]Inspired by the hard work proofed by @OoKo.
Thank you.
Impulse == entry signal.
It can be a false signal, so you have to place the orders with stop loss.
This is the first algo for experimenting the market price action and volume impulse.
I will release a better update in the future.

Smart RSIC [Eric]This RSIC can perform better than the normal RSI and RSIC on predicting the trend by representing different color and showing divergence also.

SMART RSISimilar to RSI in concept, but with a few enhancements!
Improvements over the standard RSI indicator?
1. Adaptive Decision Boundaries:
Who says 70-30 are the best decision boundaries to use for trading off of the RSI indicator? Why not 80-20, or another combination? Is 70-30 still the best when you shorten or lengthen the RSI indicator's look-back window? What about when you change the time frame? I wondered this for a while too, and thats what inspired me to create this indicator! Instead of using fixed lines for the boundaries, the boundaries are calculated based off of a user specified percentile. What this means is that the reference lines are calculated by looking at the values the RSI indicator took over some look back window, and calculating an upper and lower bound where the RSI actually stayed n% of the time over that look-back window. The default parameter given for this argument is 90. What that means is over the last n days, the RSI indicator spent 90% of it's time between the upper and lower bound.
2. Smoothing The RSI Indicator:
The RSI indicator on smaller time windows tends to be very noisy. However a simple linear regression over a short time period on the RSI indicator helps to cancel out this noise without losing too much information. This makes cross-overs more meaningful as they are less likely to happen due to small deviations. In addition, it also paints a smoothed picture of the price momentum that is easy and pleasant to read. The reference lines are also smoothed.
3. Color Coding Crosses When They Happen!
Wouldn't it be great if your software highlights cross overs when they happen for you so you would not have to go back over your chart and identify it for yourself? Well this software does! It paints red behind the indicator when the RSI indicator goes above the upper reference line, and paints blue when the RSI goes below the lower reference line.
The default parameters were selected based on what I feel is useful for daily candles on BTCUSD. However you are free to change the parameters as you see fit for different securities and time frames.

Smart Volume (alpha)This script distinguishes up/down volume based on lower resolution.
It's important to set correct inputs.

SignalX PRO📈 SignalX PRO — The Ultimate Indicator for Every Market, Every Timeframe, Every Strategy
✅ What is it?
SignalX PRO is a high-precision visual-technical analysis tool designed for TradingView, created for traders seeking clarity, reliability, and full control over every trade — regardless of the market or timeframe.
🔍 Key Features:
🔹 LONG/SHORT Trading Signals
Automatically identifies the best entry and exit points, following market structure and trend direction.
🔹 SUPPLY & DEMAND Zones
Highlights areas where institutional liquidity is concentrated. These are not just levels — they are true market turning points.
🔹 Compatible with all asset classes:
🪙 Cryptocurrencies: BTC, ETH, SOL, DOGE, and all altcoins
💹 Forex: EUR/USD, GBP/JPY, USD/CAD
📈 Stocks: Tesla, Apple, Amazon
🧱 Indices, commodities, futures: S&P 500, Nasdaq, gold, oil
🔹 Perfect for every timeframe:
⏱ Scalping: 1m, 5m, 15m
⏰ Intraday: 30m, 1H, 4H
📅 Swing & investing: 1D, 1W
🧠 Operational Strategy:
Choose your asset and preferred timeframe.
Wait for a BUY or SELL signal in a SUPPLY or DEMAND zone.
Check the trend direction (the indicator does this for you).
Enter on the impulsive move.
Take profit in the opposite zones or based on your Risk/Reward.
Always protect your capital with a smart stop-loss or breakeven.
🔐 Real Benefits for Serious Traders:
🧭 Adaptable to any trading style: scalping, intraday, swing
🔔 Supports alerts — receive signals directly on your phone
📲 Compatible with smartphones and tablets — trade from anywhere
🎯 Filters market noise, removes uncertainty
📉 Elegant and professional visual design
🚀 Why is SignalX PRO different?
Because it’s not just an indicator — it’s a smart companion that reads the market in real-time, identifies key levels, and guides you through the most critical phases of your trades.
Whether you're in a professional trading room or trading from your smartphone by the sea, SignalX PRO is with you.
💬 What traders are saying:
“Finally, an indicator that shows where the real money is in the market.”
— Marco, BTC scalper
“SignalX PRO transformed my trading from reactive to strategic.”
— Lorenzo, multi-asset trader
⚡️ The future of trading is here. Your competitive edge is called SignalX PRO.
It doesn’t matter what you trade, when you trade, or where you are.
Only one thing matters: the quality of your decisions.
And with SignalX PRO, they will always match the pace of the market.
