Supp_Ress_V1This indicator automatically plots support and resistance levels using confirmed pivot highs and lows, then manages them smartly by merging nearby levels, extending them, and removing them once price breaks through.
It also draws trendlines by connecting valid higher-lows (uptrend) or lower-highs (downtrend), ensuring they slope correctly and have enough spacing between pivots.
In short: it gives you a clean, trader-like map of the most relevant S/R zones and trendlines, updating dynamically as price action unfolds.
在腳本中搜尋"smart"
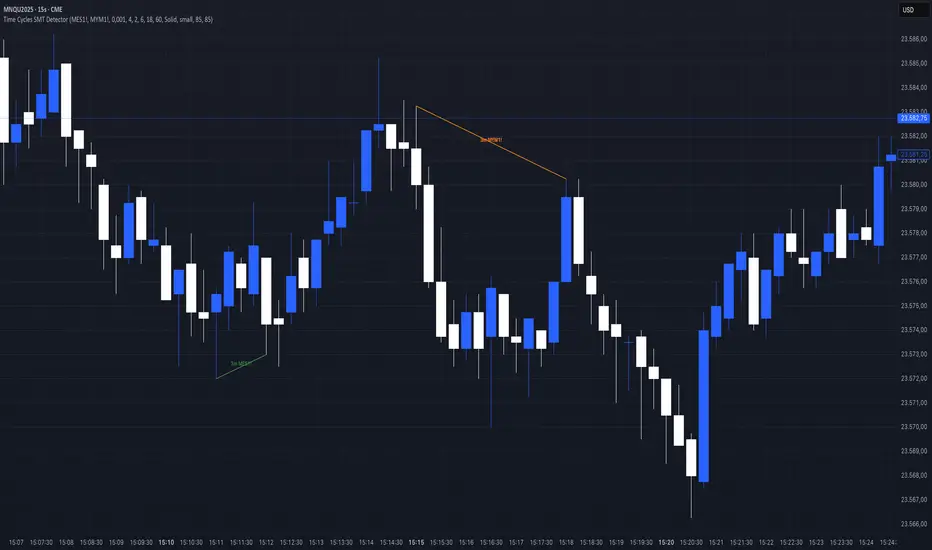
Time Cycles SMT Detector📊 Overview
The Time Cycles SMT Detector is an advanced indicator designed to identify Smart Money Technique (SMT) divergences across multiple time cycles during the New York trading session. It compares price action between correlated instruments to spot institutional footprints and potential market reversals.
🎯 What is SMT (Smart Money Timing)?
SMT occurs when correlated markets fail to make matching highs or lows, indicating potential institutional manipulation or positioning. This divergence often precedes significant market moves.
⚙️ Key Features
Multi-Timeframe Cycle Analysis:
90-minute cycles (6 cycles per trading day) - Major institutional positioning
30-minute cycles (18 cycles per trading day) - Intermediate market structure
10-minute cycles (54 cycles per trading day) - Intraday momentum shifts
3-minute cycles (180 cycles per trading day) - Scalping opportunities
Intelligent Overlap Prevention
Hierarchical priority system prevents visual clutter
Higher timeframe SMTs take precedence over lower timeframes
Clean, readable charts even with multiple active signals
Dual Correlation Analysis
Compare your main chart with two different instruments simultaneously
Default setup: MES1! (S&P 500) and MYM1! (Dow Jones)
Fully customizable ticker selection
📈 Trading Signals
Bullish SMT
Main instrument makes a higher low while correlated instrument makes a lower low
Indicates potential upward movement
Displayed with customizable bullish colors (default: green for MES, aqua for MYM)
Bearish SMT
Main instrument makes a lower high while correlated instrument makes a higher high
Indicates potential downward movement
Displayed with customizable bearish colors (default: red for MES, orange for MYM)
🔧 Customization Options
Visual Settings:
Toggle individual timeframe cycles on/off
Customize colors for each ticker's bullish/bearish signals
Choose line styles (solid, dashed, dotted)
Show/hide cycle text labels
Optional SMT zones with adjustable transparency
Cycle boxes for visual time segmentation
Analysis Settings:
Compare only consecutive cycles or scan multiple cycles back
Adjust maximum cycles to compare (1-20)
Enable/disable bullish or bearish SMT detection separately
Real-time alerts for all timeframes
💡 How to use it
Add to your chart - Works best on 1-minute timeframe for maximum precision
Select your correlated instruments - Default MES/MYM for NQ traders
Monitor for divergences - Look for SMT lines connecting cycle highs/lows
Confirm with market context - Use alongside your existing strategy
Trade the convergence - Expect prices to realign after SMT divergence
🎓 Best Practices
Focus on higher timeframes first - 90m and 30m SMTs carry more weight
Look for confluence - Multiple timeframes showing same direction SMT
Time your entries - Use lower timeframe SMTs (10m, 3m) for precise entry timing
Respect the hierarchy - When overlapping signals occur, higher timeframes have priority
⏰ Trading Hours
The indicator operates during New York trading hours (7:00 AM - 4:00 PM ET), automatically resetting at the start of each trading day.
🚀 Why This Indicator?
Institutional Logic: Based on how smart money creates divergences before major moves
Multi-dimensional Analysis: Four different time cycles provide complete market perspective
Clean Visualization: Smart overlap prevention keeps your charts readable
Flexible Configuration: Adapt to any correlated market pairs
Real-time Alerts: Never miss a significant SMT formation
📝 Notes
Designed primarily for index futures (NQ, ES, YM) but works with any correlated instruments
Best results on 1-minute charts for accurate cycle detection
All cycles reset at 7:00 AM New York time
Maximum effectiveness during regular trading hours
Acknowledgement
This indicator is based on ICT (Inner Circle Trader) concepts and Smart Money techniques for identifying institutional order flow through market divergences.
ATR: Body % + Ranges and AnomaliesATR: Body % + Ranges and Anomalies
This indicator provides a dual analysis of price bars to help you better understand market dynamics and volatility. It combines two powerful concepts into one tool: a candle body percentage and a range analysis with an anomaly-excluding average.
Key Features:
1. Candle Body Percentage
This feature plots the size of the candle's body as a percentage of its total high-low range.
A high percentage (e.g., above the 50% gray line) indicates strong, directional movement. The more solid the body is relative to its wicks, the more conviction is behind that move.
The 100% red line marks "Marubozu" candles—bars with no wicks, showing absolute control by buyers or sellers.
2. Range Analysis with Anomalies
This is a unique part of the indicator that helps you identify and understand normal vs. abnormal volatility.
Custom SMA: It calculates an average range of the last N bars, but it smartly excludes "anomalous" bars (spikes or unusually small ranges) from the calculation. This gives you a more reliable baseline for normal volatility.
Anomaly Detection: Bars are colored differently based on their range:
Blue: Small anomalies (range less than 0.5 * ATR). These often occur during periods of low liquidity or indecision.
Red: Large anomalies (range greater than 1.8 * ATR). These can signal a sudden burst of volatility, breakout events, or capitulation.
ATR Range % Label: The label on the chart shows the current bar's range as a percentage of the custom SMA. This tells you how much larger or smaller the current bar's range is compared to a clean average.
How to Use:
Spotting Trends: Use the Body % to confirm the strength of a trend. A series of bars with high body percentages can indicate a strong, healthy trend.
Identifying Volatility: Use the Range Analysis to find areas of interest. A large red anomaly bar could signal a significant event, while a series of blue anomalies might suggest the market is in a tight consolidation before a breakout.
Contextual Analysis: The combination of these tools can provide powerful context. For example, a bar with a high Body % and a red anomaly color suggests a strong, volatile move that could be a turning point or the start of a major trend.
Experiment with the input settings to fine-tune the ATR and SMA periods for different timeframes and assets.

Harvey's Super Trend & Signals📈 Harvey’s Super Trend & Trade Signals – Multi-Tool ATR Precision
⚠️ Disclaimer
For educational purposes only. Not financial advice. Test thoroughly and manage your own risk.
⸻
🚀 One-Liner Intro
Catch trends, mark key levels, and manage trades — all in one tool. Harvey’s Super Trend & Trade Signals blends a Smart Trend Average, ATR-tightened trails, and auto-plotted trade levels to keep you ahead of the move and in control.
⸻
📝 Overview
Harvey’s Super Trend & Trade Signals is an advanced, all-in-one market tool that:
• Detects clean Buy (“B”) and Sell (“S”) opportunities using a Smart Trend Average crossover with ATR-based confirmation.
• Auto-plots entry, stop-loss, and 3 profit targets for each trade.
• Marks Previous Day High/Low, New York Open, and NY Opening Range Breakout (ORB) for added confluence.
⸻
⚙️ How It Works
• Calculates a smoothed Smart Trend Average from your selected candle source and optional higher timeframe.
• Wraps the Smart Trend with tighten-only ATR bands to reduce noise and false flips.
• Triggers Buy/Sell flips when price pierces the opposite ATR trail.
• Filters signals to prevent duplicates or conflicts within user-defined lookback windows.
• Auto-draws trade management lines (entry, SL, TP1–TP3) with live updates until trade completion.
• Continuously updates PDH/PDL, NYO, and ORB levels with optional alerts.
⸻
🎛 User Inputs
• Trend chill factor – Higher = smoother, fewer flips. Lower = faster, more sensitive.
• Timeframe cheat – Apply Smart Trend & ATR calc on a higher timeframe.
• Candle flavor – Select your price source (Close, HL2, OHLC4, etc.).
• Show ATR line / trades – Toggle individual visual elements.
⸻
📊 How to Use
1. Wait for a “B” or “S” flip confirmed by your filters.
2. Follow plotted entry, SL, and profit target lines for reference.
3. Watch PDH/PDL, NYO, and ORB levels for reaction points.
4. Use alerts to get notified instantly of flips, targets, or key level hits.
⸻
💡 Pro Tips
• Pair with volume spikes or price action patterns at PDH/PDL for high-probability trades.
• Use higher “Trend chill factor” + HTF cheat for swing trading bias; lower values for scalping.
• ORB levels can act as intraday breakout/fade reference points.

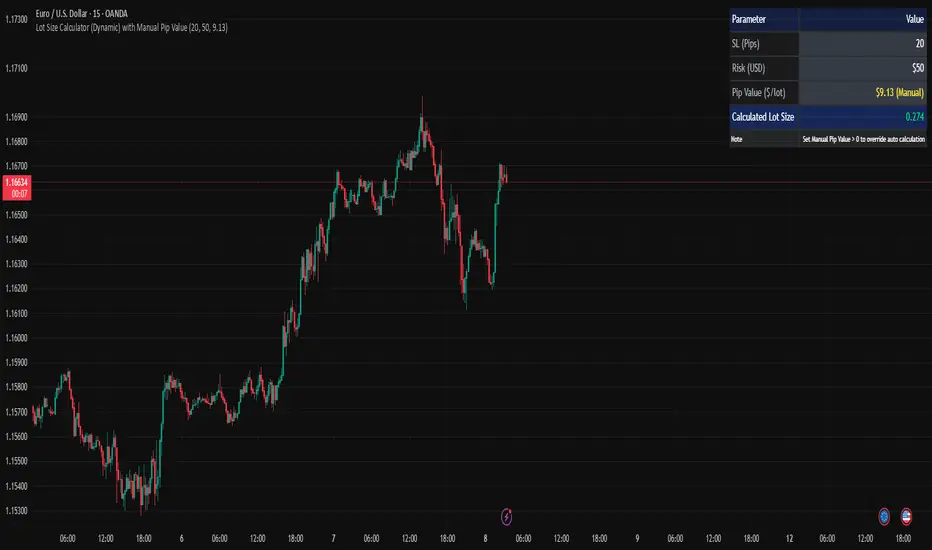
Lot Size Calculator (Dynamic) with Manual Pip ValueDevoleper: Sheikh Rakib
This TradingView indicator helps you calculate the correct lot size based on your risk amount in USD and stop loss (SL) in pips. It dynamically detects pip value per lot depending on the trading instrument (e.g., Forex majors, minors, gold, crypto), and also allows manual override if needed.
✅ Key Features:
📏 Input SL in pips and risk amount in USD
⚙️ Automatically detects pip size and pip value per lot
🧮 Calculates lot size based on your inputs
✍️ Manual pip value override option if auto-detection is incorrect
🖥️ Clean, organized info panel displayed on chart
💹 Works with Forex, Gold (XAUUSD), Silver (XAGUSD), BTC, ETH, and more
📘 Usage Tips:
Set your SL in pips and how much you want to risk per trade (USD)
If the pip value is not calculated correctly (rare for exotic pairs), enable and set your own value using the “Manual Pip Value” input
Recommended for scalpers, day traders, and swing traders who want to manage risk smartly
Built with risk management in mind — because consistent trading starts with proper lot sizing.
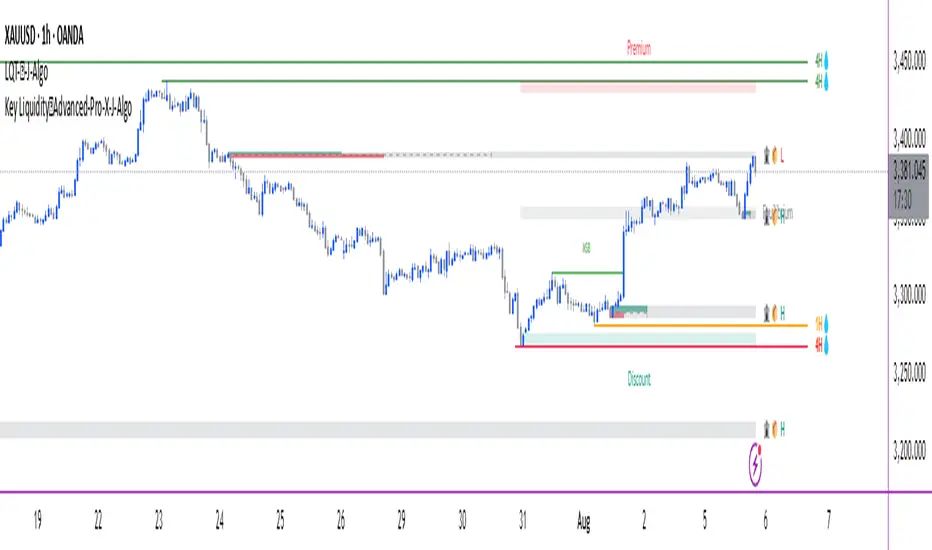
Key Liquidity💧Advanced-Pro-J-Algo# 💧 Key Liquidity Advanced Pro - Multi-Timeframe Institutional Analysis
## 🏆 **Premium Institutional Trading Indicator**
Transform your trading with this comprehensive **multi-timeframe liquidity analysis tool** that combines **Smart Money Concepts (SMC)** and **ICT methodology** into one powerful indicator. Designed for serious traders who demand institutional-grade analysis.
---
## 🔥 **Key Features**
### 💧 **Multi-Timeframe Key Liquidity Levels**
- **HTF (Higher Timeframe)**: Major institutional levels with real-time alerts 🚨
- **LTF (Lower Timeframe)**: Precision entry/exit levels for optimal timing
- **CTF (Current Timeframe)**: Flexible analysis for any chart timeframe
- **Smart Mitigation Detection**: Automatically removes hit liquidity levels
- **Professional Labels**: Clean timeframe identification (4H, 1H, etc.)
### 🏦 **Institutional Order Blocks**
- **📦 Smart Money Order Blocks**: Identify where institutions placed large orders
- **Volume-Weighted Analysis**: Bullish/Bearish strength calculations
- **Professional Labels**: 🏦📦 H (High) and 🏦📦 L (Low) markers
- **Violation Detection**: Automatic cleanup when order blocks are broken
- **Overlap Prevention**: Clean chart presentation without clutter
### 🚨 **Advanced Alert System**
- **HTF Liquidity Hit Alerts**: Never miss major institutional level breaks
- **Detailed Notifications**: Timeframe, price, and timestamp information
- **Smart Frequency Control**: No spam - only meaningful alerts
- **Mobile Ready**: Perfect for Trading View mobile app notifications
### 📊 **Market Structure Analysis**
- **MSB (Market Structure Breaks)**: Current trend direction changes
- **Premium/Discount Zones**: ICT-style institutional price zones
- **Clean Presentation**: Only shows current MSB, removes historical clutter
### 🔄 **Trading Session Analysis**
- **Multi-Session Support**: Asian, London, New York sessions
- **Session Overlaps**: Highlighted with special bar coloring
- **Configurable Display**: Show 0-10 previous days of session data
- **High/Low Tracking**: Session-specific price levels
---
## 🎯 **Perfect For**
### **Trading Styles:**
- ✅ **Forex Trading** (ICT/SMC methodology)
- ✅ **Index Trading** (institutional analysis)
- ✅ **Crypto Trading** (smart money concepts)
- ✅ **Swing Trading** (HTF liquidity levels)
- ✅ **Scalping** (multi-timeframe precision)
### **Methodologies:**
- ✅ **Smart Money Concepts (SMC)**
- ✅ **Inner Circle Trader (ICT)**
- ✅ **Institutional Order Flow**
- ✅ **Liquidity Hunting Strategies**
- ✅ **Market Structure Trading**
---
## ⚙️ **Comprehensive Settings**
### **Master Controls:**
- 💧 Enable/Disable Key Liquidity Levels
- 🏦 Enable/Disable Order Blocks
- 📊 Enable/Disable Market Structure Breaks
- 🎯 Enable/Disable Premium/Discount Zones
- 🔄 Enable/Disable Trading Sessions
### **Customization Options:**
- **Timeframe Selection**: Choose your HTF and LTF periods
- **Color Schemes**: Professional color coding for each timeframe
- **Display Limits**: Control chart clutter with smart limits
- **Text Sizing**: Scalable labels for any screen size
- **Extension Options**: Short, Current, or Max line extensions
### **Alert Configuration:**
- 🚨 HTF High Liquidity Hit Alerts
- 🚨 HTF Low Liquidity Hit Alerts
- Smart frequency control to prevent spam
---
## 🎨 **Visual Excellence**
### **Professional Design:**
- **Clean Interface**: No chart clutter, only relevant information
- **Consistent Labeling**: All elements perfectly aligned and positioned
- **Smart Color Coding**: Visual hierarchy based on timeframe importance
- **Emoji Integration**: Instant visual recognition (💧🏦📦📊)
### **Label System:**
- **Liquidity Levels**: Timeframe labels (4H, 1H, etc.) with tooltips
- **Order Blocks**: 🏦📦 H/L institutional liquidity markers
- **Market Structure**: MSB break notifications
- **Sessions**: Clear session identification and overlaps
---
## 🔬 **Technical Implementation**
### **Performance Optimized:**
- Efficient memory management with `max_bars_back()` settings
- Smart array handling to prevent performance issues
- Clean object deletion to maintain chart responsiveness
### **Advanced Logic:**
- **Pivot Detection**: Sophisticated swing high/low identification
- **Mitigation Algorithms**: Smart detection of liquidity level hits
- **Volume Analysis**: Institutional strength calculations
- **Multi-Timeframe Security**: Proper HTL/LTF data handling
---
## 📈 **How to Use**
### **Setup:**
1. Add indicator to your chart
2. Configure your preferred HTF (default: 4H) and LTF (default: 1H)
3. Enable desired features via Master Controls
4. Set up TradingView alerts for HTF liquidity hits
### **Trading Workflow:**
1. **Identify Bias**: Use HTF liquidity levels for market direction
2. **Find Entries**: Use LTF levels and Order Blocks for precision entries
3. **Confirm Structure**: Check MSB for trend continuation/reversal
4. **Time Entries**: Use session analysis for optimal timing
5. **Get Alerted**: Never miss major HTF liquidity hits
---
## 🏅 **Why Choose This Indicator?**
### **Professional Grade:**
- Combines multiple premium concepts into one comprehensive tool
- Institutional-quality analysis typically found in expensive platforms
- Clean, professional presentation suitable for serious trading
### **Complete Solution:**
- No need for multiple indicators - everything in one package
- Covers all aspects of modern institutional trading methodology
- Suitable for beginners learning SMC/ICT and professionals alike
### **Constantly Updated:**
- Built with modern Pine Script v6
- Performance optimized for all timeframes
- Clean code structure for reliability
---
## 🚨 **Important Notes**
- **Timeframe Compatibility**: Works on all intraday timeframes (not suitable for daily/weekly/monthly)
- **Best Performance**: Recommended for 1m-4H chart timeframes
- **Alert Setup**: Configure TradingView alerts for mobile notifications
- **Education**: Best used with understanding of SMC/ICT concepts
---
## 📞 **Support & Updates**
This indicator represents months of development and testing, combining the best of institutional trading analysis into one comprehensive tool. Perfect for traders who demand professional-grade analysis and real-time alerting.
**🎯 Take your trading to the institutional level with Key Liquidity Advanced Pro!**
---
*Disclaimer: This indicator is for educational and informational purposes. Past performance does not guarantee future results. Always practice proper risk management.*
Josh SMC Key Features of Josh SMC
✅ Automatically detects Order Blocks (OB) — both Bullish and Bearish
✅ Accurately identifies Fair Value Gaps (FVG) and tracks whether they are “filled” or not
✅ Detects Change of Character (CHOCH) to signal potential trend reversals
✅ Analyzes price structure in real-time based on Smart Money Concepts
✅ Beginner-friendly, yet powerful for advanced traders
✅ Customizable zone colors and number of OB/FVG displays
✅ Works on all timeframes from 1-minute and up
📌 What You’ll Gain from Using Josh SMC
🔺 Spot potential reversal zones before the crowd
🔻 Avoid chasing fake trends and getting trapped
🎯 Plan your entries and exits with OB and FVG precision
🚫 Eliminate guesswork from your analysis
🚀 Trade with confidence and structure — like smart money does
🔍 Who Is This For?
Traders who follow Smart Money Concepts (SMC), ICT, or Price Action
Anyone seeking high-quality entry/exit zones
Traders who want to understand how institutions move the market
Josh SMC – Smart Money Concepts Indicator
🔍 เข้าใจเจตนารมณ์ของรายใหญ่ มองเห็นตลาดอย่างมืออาชีพ
🔧 จุดเด่นของอินดี้ Josh SMC
✅ ตรวจจับ Order Block (OB) ทั้งฝั่ง Bullish และ Bearish โดยอัตโนมัติ
✅ แสดง Fair Value Gap (FVG) อย่างแม่นยำ พร้อมระบบตรวจจับว่า FVG ถูก “เติมเต็ม” แล้วหรือยัง
✅ ตรวจจับ Change of Character (CHOCH) เพื่อหาสัญญาณกลับตัวในเทรนด์
✅ ใช้การวิเคราะห์โครงสร้างราคาตามหลัก Smart Money Concept แบบ Real-Time
✅ ใช้งานง่าย เหมาะทั้งเทรดเดอร์มือใหม่และมืออาชีพ
✅ ปรับแต่งสีและจำนวนโซนที่ต้องการแสดงได้อย่างยืดหยุ่น
✅ รองรับ Timeframe ตั้งแต่ 1 นาทีขึ้นไป
📌 สิ่งที่คุณจะได้เมื่อใช้ Josh SMC
🔺 มองเห็นจุดกลับตัวของราคาได้ก่อนใคร
🔻 หลีกเลี่ยงการติดดอยจากเทรนด์หลอก
🎯 วางแผนการเข้าออกออเดอร์อย่างแม่นยำตาม OB และ FVG
🚫 ลดความผิดพลาดจากการวิเคราะห์แบบเดาสุ่ม
🚀 เทรดด้วยความมั่นใจและมีระบบ เหมือนรายใหญ่ในตลาด
🔍 เหมาะสำหรับใคร?
เทรดเดอร์สาย Smart Money Concepts (SMC), ICT, Price Action
เทรดเดอร์ที่ต้องการกรอง "จุดเข้า-ออก" คุณภาพสูง
ผู้ที่ต้องการระบบช่วยมองภาพ "พฤติกรรมของรายใหญ่"
Advanced Forex Currency Strength Meter
# Advanced Forex Currency Strength Meter
🚀 The Ultimate Currency Strength Analysis Tool for Forex Traders
This sophisticated indicator measures and compares the relative strength of major currencies (EUR, GBP, USD, JPY, CHF, CAD, AUD, NZD) to help you identify the strongest and weakest currencies in real-time, providing clear trading signals based on currency strength differentials.
## 📊 What This Indicator Does
The Advanced Forex Currency Strength Meter analyzes currency relationships across 28+ major forex pairs and 8 currency indices to determine which currencies are gaining or losing strength. Instead of relying on individual pair analysis, this tool gives you a bird's-eye view of the entire forex market, helping you:
Identify the strongest and weakest currencies at any given time
Find high-probability trading opportunities by pairing strong vs weak currencies
Avoid ranging markets by detecting when currencies have similar strength
Get clear LONG/SHORT/NEUTRAL signals for your current trading pair
Optimize your trading strategy based on your preferred timeframe and holding period
## ⚙️ How The Indicator Works
### Dual Calculation Method
The indicator uses a sophisticated dual approach for maximum accuracy:
Pairs-Based Analysis: Calculates currency strength from 28+ major forex pairs (EURUSD, GBPUSD, USDJPY, etc.)
Index-Based Analysis: Incorporates official currency indices (DXY, EXY, BXY, JXY, CXY, AXY, SXY, ZXY)
Weighted Combination: Blends both methods using smart weighting for enhanced accuracy
### Smart Auto-Optimization System
The indicator automatically adjusts its parameters based on your chart timeframe and intended holding period:
The system recognizes that scalping requires different sensitivity than swing trading, automatically optimizing lookback periods, analysis timeframes, signal thresholds, and index weights.
### Strength Calculation Process
Fetches price data from multiple timeframes using optimized tuple requests
Calculates percentage change over the specified lookback period
Optionally normalizes by ATR (Average True Range) to account for volatility differences
Combines pair-based and index-based calculations using dynamic weighting
Generates relative strength by comparing base currency vs quote currency
Produces clear trading signals when strength differential exceeds threshold
## 🎯 How To Use The Indicator
### Quick Start
Add the indicator to any forex pair chart
Enable 🧠 Smart Auto-Optimization (recommended for beginners)
Watch for LONG 🚀 signals when the relative strength line is green and above threshold
Watch for SHORT 🐻 signals when the relative strength line is red and below threshold
Avoid trading during NEUTRAL ⚪ periods when currencies have similar strength
Note: This is highly recommended to couple this indicator with fundamental analysis and use it as an extra signal.
### 📋 Parameters Reference
#### 🤖 Smart Settings
🧠 Smart Auto-Optimization: (Default: Enabled) Automatically optimizes all parameters based on chart timeframe and trading style
#### ⚙️ Manual Override
These settings are only active when Smart Auto-Optimization is disabled:
Manual Lookback Period: (Default: 14) Number of periods to analyze for strength calculation
Manual ATR Period: (Default: 14) Period for ATR normalization calculation
Manual Analysis Timeframe: (Default: 240) Higher timeframe for strength analysis
Manual Index Weight: (Default: 0.5) Weight given to currency indices vs pairs (0.0 = pairs only, 1.0 = indices only)
Manual Signal Threshold: (Default: 0.5) Minimum strength differential required for trading signals
#### 📊 Display
Show Signal Markers: (Default: Enabled) Display triangle markers when signals change
Show Info Label: (Default: Enabled) Show comprehensive information label with current analysis
#### 🔍 Analysis
Use ATR Normalization: (Default: Enabled) Normalize strength calculations by volatility for fairer comparison
#### 💰 Currency Indices
💰 Use Currency Indices: (Default: Enabled) Include all 8 currency indices in strength calculation for enhanced accuracy
#### 🎨 Colors
Strong Currency Color: (Default: Green) Color for positive/strong signals
Weak Currency Color: (Default: Red) Color for negative/weak signals
Neutral Color: (Default: Gray) Color for neutral conditions
Strong/Weak Backgrounds: Background colors for clear signal visualization
### 🧠 Smart Optimization Profiles
The indicator automatically selects optimal parameters based on your chart timeframe:
#### ⚡ Scalping Profile (1M-5M Charts)
For positions held for a few minutes:
Lookback: 5 periods (fast/sensitive)
Analysis Timeframe: 15 minutes
Index Weight: 20% (favor pairs for speed)
Signal Threshold: 0.3% (sensitive triggers)
#### 📈 Intraday Profile (10M-1H Charts)
For positions held for a few hours:
Lookback: 12 periods (balanced sensitivity)
Analysis Timeframe: 4 hours
Index Weight: 40% (balanced approach)
Signal Threshold: 0.4% (moderate sensitivity)
#### 📊 Swing Profile (4H-Daily Charts)
For positions held for a few days:
Lookback: 21 periods (stable analysis)
Analysis Timeframe: Daily
Index Weight: 60% (favor indices for stability)
Signal Threshold: 0.5% (conservative triggers)
#### 📆 Position Profile (Weekly+ Charts)
For positions held for a few weeks:
Lookback: 30 periods (long-term view)
Analysis Timeframe: Weekly
Index Weight: 70% (heavily favor indices)
Signal Threshold: 0.6% (very conservative)
### Entry Timing
Wait for clear LONG 🚀 or SHORT 🐻 signals
Avoid trading during NEUTRAL ⚪ periods
Look for signal confirmations on multiple timeframes
### Risk Management
Stronger signals (higher relative strength values) suggest higher probability trades
Use appropriate position sizing based on signal strength
Consider the trading style profile when setting stop losses and take profits
💡 Pro Tip: The indicator works best when combined with your existing technical analysis. Use currency strength to identify which pairs to trade, then use your favorite technical indicators to determine when to enter and exit.
## 🔧 Key Features
28+ Forex Pairs Analysis: Comprehensive coverage of major currency relationships
8 Currency Indices Integration: DXY, EXY, BXY, JXY, CXY, AXY, SXY, ZXY for enhanced accuracy
Smart Auto-Optimization: Automatically adapts to your trading style and timeframe
ATR Normalization: Fair comparison across different currency pairs and volatility levels
Real-Time Signals: Clear LONG/SHORT/NEUTRAL signals with visual markers
Performance Optimized: Efficient tuple-based data requests minimize external calls
User-Friendly Interface: Simplified settings with comprehensive tooltips
Multi-Timeframe Support: Works on any timeframe from 1-minute to monthly charts
Transform your forex trading with the power of currency strength analysis! 🚀

Institutional Analyst LLM📊 Institutional Analyst Board LLM – Smart Money Confluence Scanner for XAUUSD, Forex, Crypto 🔍 Overview The Institutional Analyst Board is a complete multi-timeframe smart money toolkit designed for traders who demand clarity, confluence, and precision. It brings together institutional-grade metrics—Order Blocks (OB), Fair Value Gaps (FVG), Liquidity Sweeps, MACD/RSI...
PTS Ultimate Analysis Board (Flexible Position + Ticker)
GoldenTradeClub
GoldenTradeClub
Updated
Jul 15
PTS Ultimate Analysis Board (Flexible Position + Ticker) Version: Pine v5 Description: This indicator builds a fully customizable, multi-timeframe dashboard table that surfaces 19 key metrics for any ticker (current chart TF, 1 h, 4 h). You can position the table at the top-right or bottom-right of your chart and toggle each metric on or off. Key...
Trading Engine AI Light
GoldenTradeClub
GoldenTradeClub
Jul 14
The Trading Engine includes the best and most effective technical analysis tools. It has 27 different Buy Signal parameters and 26 different Sell Signal parameters. Furthermore, it also has 9 Stop Loss triggers for Long Positions and 8 Stop Loss triggers for Short Positions. Many of the Buy or Sell Signal parameters function as Take Profit and Stop Loss signals...
Elliott Wave Complete
GoldenTradeClub
GoldenTradeClub
Jul 4
1. Indicator Presentation Name: Elliott Wave Complete Type: Pine Script v5 overlay dashboard for TradingView Purpose: Automates Elliott Wave motive (1-5) and corrective (A-B-C) pattern detection on any timeframe, enriches it with classic ZigZag pivots, dynamic Fibonacci projection levels, optional wave-count info box, and real-time alerts—all in one...
💀⚡ PTS WIZARD 666™ ULTIMATE SUPREME V5.0 - COMPLETE FIXED ⚡💀
GoldenTradeClub
GoldenTradeClub
Jul 4
1. Indicator Presentation Name: 💀⚡ PTS WIZARD 666™ ULTIMATE SUPREME V5.0 – COMPLETE FIXED Short ID: PTS-666-SUPREME Type: Pine Script v5 overlay dashboard for TradingView Purpose: An all-in-one trading overlay that integrates advanced WaveTrend momentum, RSI/MFI analysis, POC volume profiling, multiple Fibonacci golden/ultimate zones, volume footprint & imbalance...
🔥 PTS TRADE 666™ ULTIMATE BOOKMAP + QUANTUM ENGINE
GoldenTradeClub
GoldenTradeClub
Jul 4
1. Indicator Presentation Name: 🔥 PTS TRADE 666™ ULTIMATE BOOKMAP + QUANTUM ENGINE Short ID: PTS666_QUANTUM_FINAL Type: Pine Script v5 overlay dashboard for TradingView Purpose: A cutting-edge, institutional-grade suite that unifies bookmap-style footprint volume profiling, dynamic heatmap liquidity analysis, AI-driven pattern recognition, smart-money protocols,...
🔥 PTS TRADE 666™ - ULTIMATE INSTITUTIONAL TOOL 🔥
GoldenTradeClub
GoldenTradeClub
Jul 4
1. Indicator Presentation Name: 🔥 PTS TRADE 666™ – ULTIMATE INSTITUTIONAL TOOL V2.0 Short ID: PTS666_UIT_V2 Type: Pine Script v5 overlay dashboard for TradingView Purpose: Combines institutional-grade footprint volume analysis, smart-money structure detection, statistical anomaly checks, multi-timeframe divergence, Ichimoku insights, pattern recognition, and an...
PTS Wizard
GoldenTradeClub
GoldenTradeClub
Jul 4
1. Indicator Presentation Name: PTS Wizard Short Title: PTS Wizard Type: Pine Script v5 overlay dashboard for TradingView Purpose: A unified multi-strategy toolkit that overlays key market insights—liquidity zones, smart-money structure, footprint-style volume profile, consolidation ranges, statistical deviation bands, price forecasts, and session analysis—into a...
🔥 PTS.TRADE 666™ ULTIMATE HYBRID + MTF V3
GoldenTradeClub
GoldenTradeClub
Jul 4
1. Indicator Presentation Name: 🔥 PTS.TRADE 666™ ULTIMATE HYBRID + MTF V3 Short ID: PTS666_ULTIMATE_MTF_V3 Type: Overlay dashboard for TradingView Purpose: A next-level hybrid trading suite that merges institutional-grade order-flow analysis, smart-money concepts, AI-driven insights, classic momentum oscillators (WaveTrend, divergence, “Gold” signals),...
🧙♂ PTS WIZARD V3.0 - FINAL EDITION
GoldenTradeClub
GoldenTradeClub
Jul 4
1. Indicator Presentation Name: 🧙♂ PTS WIZARD V3.0 – FINAL EDITION Short Title: PTS-WIZARD-V3-FINAL Type: Overlay trading dashboard for TradingView Purpose: A comprehensive multi-module indicator that blends classic cipher momentum signals, Elliott Wave pattern detection, advanced statistical analyses (Z-Score, Benford’s Law, Ehlers SNR), footprint-style volume...
🧙♂ PTS WIZARD V3.0 + FOOTPRINT ULTIMATE
GoldenTradeClub
GoldenTradeClub
Jul 4
Name: PTS WIZARD V3.0 + FOOTPRINT ULTIMATE Type: Overlay trading dashboard for TradingView Purpose: Combines classic cipher-style momentum signals with an advanced footprint volume profile, multi-timeframe bias, statistical filters, and a fusion-score system—displayed in a customizable on-chart dashboard. Core Modules Cipher Momentum Signals WaveTrend...
🧙♂ PTS WIZARD V3.0 - BASIC
GoldenTradeClub
GoldenTradeClub
Jul 1
PTS WIZARD V3.0 Basic – Ultimate Multi-Tool Trading Dashboard An all-in-one overlay combining classic cipher signals, Elliott Wave pattern detection, volume analytics, divergence spotting, and smart-entry timing—backed by advanced statistical filters and a live dashboard. Key Features Cipher Signals WaveTrend with overbought/oversold zones & cross signals RSI...
Trading Engine vCD AI
GoldenTradeClub
GoldenTradeClub
Jun 15
The Trading Engine includes the best and most effective technical analysis tools. It has 27 different Buy Signal parameters and 26 different Sell Signal parameters. Furthermore, it also has 9 Stop Loss triggers for Long Positions and 8 Stop Loss triggers for Short Positions. Many of the Buy or Sell Signal parameters function as Take Profit and Stop Loss signals...
Trading Engine vCD
GoldenTradeClub
GoldenTradeClub
Updated
Mar 21
The Trading Engine includes the best and most effective technical analysis tools. It has 27 different Buy Signal parameters and 26 different Sell Signal parameters. Furthermore, it also has 9 Stop Loss triggers for Long Positions and 8 Stop Loss triggers for Short Positions. Many of the Buy or Sell Signal parameters function as Take Profit and Stop Loss signals...
TE CLIENT v13
GoldenTradeClub
GoldenTradeClub
Updated
Mar 15
The Trading Engine includes the best and most effective technical analysis tools. It has 27 different Buy Signal parameters and 26 different Sell Signal parameters. Furthermore, it also has 9 Stop Loss triggers for Long Positions and 8 Stop Loss triggers for Short Positions. Many of the Buy or Sell Signal parameters function as Take Profit and Stop Loss signals...
Trading Engine v13
GoldenTradeClub
GoldenTradeClub
Updated
Mar 15
The Trading Engine includes the best and most effective technical analysis tools. It has 27 different Buy Signal parameters and 26 different Sell Signal parameters. Furthermore, it also has 9 Stop Loss triggers for Long Positions and 8 Stop Loss triggers for Short Positions. Many of the Buy or Sell Signal parameters function as Take Profit and Stop Loss signals...
Trading Engine B2B
GoldenTradeClub
GoldenTradeClub
Updated
Jan 14
The Trading Engine includes the best and most effective technical analysis tools. It has 25 different Buy Signal parameters and 24 different Sell Signal parameters. Furthermore, it also has 9 Stop Loss triggers for Long Positions and 8 Stop Loss triggers for Short Positions. Many of the Buy or Sell Signal parameters function as Take Profit and Stop Loss signals...
Trading Engine B2B FX V9
GoldenTradeClub
GoldenTradeClub
Updated
Jan 14
The VFLOW Trading Engine includes the best and most effective technical analysis tools. It has 20 different Buy Signal parameters and 18 different Sell Signal parameters. Furthermore, it also has 7 Stop Loss triggers for Long Positions and 5 Stop Loss triggers for Short Positions. Many of the Buy or Sell Signal parameters function as Take Profit and Stop Loss...
English
Select market data provided by ICE Data services.
Select reference data provided by FactSet. Copyright © 2025 FactSet Research Systems Inc.
© 2025 TradingView, Inc.
More than a product
Supercharts
Screeners
Stocks
ETFs
Bonds
Crypto coins
CEX pairs
DEX pairs
Pine
Heatmaps
Stocks
ETFs
Crypto
Calendars
Economic
Earnings
Dividends
More products
Yield Curves
Options
News Flow
Pine Script®
Apps
Mobile
Desktop
Tools & subscriptions
Features
Pricing
Market data
Trading
Overview
Brokers
Special offers
CME Group futures
Eurex futures
US stocks bundle
About company
Who we are
Athletes
Blog
Careers
Media kit
Merch
TradingView store
Tarot cards for traders
The C63 TradeTime
Policies & security
Terms of Use
Disclaimer
Privacy Policy
Cookies Policy
Accessibility Statement
Security tips
Bug Bounty program
Status page
Community
Social network
Wall of Love
Refer a friend
House Rules
Moderators
Ideas
Trading
Education
Editors' picks
Pine Script
Indicators & strategies
Wizards
Freelancers
Business solutions
Widgets
Charting libraries
Lightweight Charts™
Advanced Charts
Trading Platform
Growth opportunities
Advertising
Brokerage integration
Partner program
Education program
Look First
Close
Updated 3 hours ago
Institutional Analyst Board
Manage access
Remove from favorites
Use on chart
0
11
Jul 19
📊 Institutional Analyst Board – Smart Money Confluence Scanner for XAUUSD, Forex, Crypto
🔍 Overview
The Institutional Analyst Board is a complete multi-timeframe smart money toolkit designed for traders who demand clarity, confluence, and precision. It brings together institutional-grade metrics—Order Blocks (OB), Fair Value Gaps (FVG), Liquidity Sweeps, MACD/RSI bias, VWAP positioning, and Break of Structure (BoS)—into a single powerful visual dashboard.
This indicator is especially optimized for Gold (XAUUSD) but is also compatible with Crypto and Forex assets.
🧠 Key Features
✅ Multi-Timeframe Dashboard (5M / 15M / 1H)
✅ Order Block Detection with dynamic zones that extend until broken
✅ Fair Value Gap Detection with clear zone shading and border distinction
✅ MACD + RSI Confluence for momentum and bias alignment
✅ VWAP Positioning to identify premium/discount zones
✅ Liquidity Sweeps (internal/external range breaks)
✅ Killzone Highlighting (Asia / London / New York)
✅ Break of Structure (BoS) with advanced confluence filters
✅ Gold Bias Flags across timeframes (BUY / SELL / NEUTRAL)
✅ Dynamic Price Watermark with real-time data
✅ Fully customizable colors, transparencies, and text labels
🧠 How It Works
The Board uses institutional logic to analyze the chart in real time:
Metric Purpose
OB Zones Highlight potential smart money footprints where price is likely to react.
FVG Zones Identify imbalance areas between buyers and sellers—ideal for mean reversion entries.
MACD/RSI Confirm momentum direction and relative strength confluence.
VWAP Determine whether price is trading at a premium or discount.
Liquidity Sweeps Detect manipulative moves before major reversals.
BoS Mark potential trend reversals, filtered by institutional confluence.
Each signal is computed across 3 timeframes and visualized in a clean board that updates live. You’ll also see labels, alerts, and session overlays for maximum clarity.
📌 Ideal Use Case
This tool is perfect for:
Funded Challenge Traders (FTMO, MyForexFunds, etc.)
Gold scalpers and intraday traders
Crypto price action traders using BTC, ETH, SOL, etc.
Smart Money Concept (SMC) and ICT followers
⚙️ Customization Options
Toggle each module (OB, FVG, VWAP, MACD/RSI, etc.)
Set transparency and color for each zone type
Adjust Killzone timing (Asia, London, NY)
Control board position (Top/Bottom) and metric visibility
📈 Compatible Assets
✅ XAUUSD (optimized)
✅ Forex majors/minors
✅ Crypto pairs (BTC, ETH, SOL, etc.)
✅ Indices (GER40, NASDAQ, SPX with minor adaptation)
🛠️ Requirements
Use on TradingView v5
Set chart time to UTC+0 or UTC+3 for optimal Killzone accuracy
For crypto, redefine Killzone hours if needed (24/7 market)
🧠 Pro Tip
Pair this indicator with volume profile tools, CVD/Delta Flow, or Footprint overlays to build high-confidence trade setups with clear institutional confluence.

Delta OrderFlow Sweep & Absorption Toolkit @MaxMaserati 2.0Delta OrderFlow Sweep & Absorption Toolkit @MaxMaserati 2.0
This is a professional-grade smart money order flow analysis tool that reveals smart money activity, volume absorption patterns, and liquidity sweeps in real-time. It combines advanced market microstructure concepts into one comprehensive toolkit that shows you where and how institutions are trading.
A CLEAR VISUALIZATION OF THE INDICATOR CAPACITY
🔥 Core Features Explained
1. Delta Order Flow Analysis
Tracks cumulative buying vs selling pressure (Delta)
🔥BUY/🔥SELL labels show aggressive order flow imbalances
Real-time market sentiment based on actual volume flow
Session delta tracking with automatic resets
2. Institutional Detection
🏦↑/🏦↓ labels identify large block trades and smart money activity
Automatic threshold detection based on volume patterns
Smart money flow tracking with institutional bias indicators
Institutional buyers getting in
3. Advanced Sweep Detection
SWEEP↑/SWEEP↓ labels detect stop-loss hunts with volume confirmation
Wick rejection analysis ensures proper sweep identification
Institutional reaction confirmation - shows when opposite side takes control
4. Volume Absorption Analysis
ABSORB↑/ABSORB↓ shows successful volume breakthroughs
H↑BuV Fail/H↑BeV Fail shows institutional volume failures (reversal signals)
Context-aware analysis based on recent institutional activity
Bullish Absorption scenario
Bearish Absorption scenario
5. Point of Control (POC) Levels
Dynamic support/resistance based on executed volume
POC SUP (Green) / POC RES (Purple)
POC Support Broken
6. Net Delta Bubbles
Visual representation of net buying/selling bias
Positive Delta (Green) = Bullish bias bubbles below candles
Negative Delta (Red) = Bearish bias bubbles above candles
6 positioning methods with full customization
The Net Delta Bubbles allow to see clearer, the highest reversal/continuity areas
7. Smart Alert System
Large order flow imbalances
Institutional activity detection
Stop sweep confirmations
Volume absorption patterns
📊 How to Read the Signals
🔥BUY (below candles) = Aggressive institutional buying
🔥SELL (above candles) = Aggressive institutional selling
Threshold: Customizable imbalance percentage (default 75%)
🏦 Institutional Labels:
🏦↑ (below candles) = Large institutional buying detected
🏦↓ (above candles) = Large institutional selling detected
Volume: Based on block trade size detection
⚡ Sweep Labels:
SWEEP↑ (below candles) = Stop hunt below, expect reversal UP
SWEEP↓ (above candles) = Stop hunt above, expect reversal DOWN
Confirmation: Requires wick rejection + volume confirmation
🎯 Absorption Labels:
ABSORB↑ = True bullish breakthrough above institutional levels
ABSORB↓ = True bearish breakdown below institutional levels
H↑BuV Fail (Orange) = Bullish volume failed = Bearish signal
H↑BeV Fail (Blue) = Bearish volume failed = Bullish signal
💡 Trading Strategies
🟢 Bullish Setups:
🔥BUY + 🏦↑ = Strong institutional buying confirmation
SWEEP↓ + High volume = Stop hunt below, enter long on reversal
H↑BeV Fail = Bearish volume failed, bullish reversal signal
POC Support holding + positive delta = Bounce play
ABSORB↑ = Successful break above resistance
🔴 Bearish Setups:
🔥SELL + 🏦↓ = Strong institutional selling confirmation
SWEEP↑ + High volume = Stop hunt above, enter short on reversal
H↑BuV Fail = Bullish volume failed, bearish reversal signal
POC Resistance holding + negative delta = Rejection play
ABSORB↓ = Successful break below support
⚡ High-Probability Entries:
Multiple confirmations on same candle/area
Volume spikes with directional bias
Failed institutional attempts (reversal plays)
POC level interactions with delta confirmation
📱 Best Practices
🎯 Timeframe Usage:
1-5 minutes: Scalping with institutional confirmation
15-30 minutes: Day trading with sweep detection
1-4 hours: Swing trading with POC levels
Daily: Position trading with major delta shifts
🔧 Optimization Tips:
Start with defaults and adjust sensitivity based on your instrument
Use multiple confirmations - don't trade single signals
Watch volume bubbles for additional bias confirmation
Enable alerts for key institutional activity
Combine with price action for best results
⚠️ Important Notes:
No repainting - all signals are final when candle closes
Volume-based - works best on liquid instruments
Context matters - consider overall market conditions
Risk management - use proper position sizing

Nifty 50 Gainers Losers Table
How it Works
1. Dropdown List Selection
allows for dynamic interaction, making it flexible and user-friendly.
Scripts added to list as per Their Weightage Allocated in Nifty_50 Index.
Switch Lists Option: to Check Complete List of 50 ( List is Splitted Because of Restriction to use of 40)
Use the dropdown to switch between "Main 40" and "Remaining 10" lists dynamically.
2. Interpret Values
User Setting to Show Hide Column : Unchanged
Gainers (Green): Number of stocks that closed higher than the previous day.
Losers (Red): Number of stocks that closed lower.
Unchanged (Gray): No change in close from the previous day.
3. Compact Table Display :
User Setting to show Hide Table & Table Position As per Need (TOP,Bottom,Middle Etc)
is smartly placed and keeps the layout clean and readable.
4. User Input to Set Text Size. you can change Text Size as per Need.
✅ How to Use This Indicator Effectively
🔹 Step-by-Step User Flow:
Add to Chart
Apply this indicator to any chart—ideally NIFTY or NIFTY FUTURES (to keep contextually relevant).
Use in Decision Making
Use this internally as a market breadth tool.
If Gainers >> Losers, the market is strong/bullish.
If Losers >> Gainers, the market is weak/bearish.
If balanced, market is range-bound or sector-specific moves dominate.

Alpha - Combined BreakoutThis Pine Script indicator, "Alpha - Combined Breakout," is a combination between Smart Money Breakout Signals and UT Bot Alert, The UT Bot Alert indicator was initially developer by Yo_adriiiiaan
The idea of original code belongs HPotter.
This Indicator helps you identify potential trading opportunities by combining two distinct strategies: Smart Money Breakout and a modified UT Bot (likely a variation of the Ultimate Trend Bot). It provides visual signals, draws lines for potential take profit (TP) and stop loss (SL) levels, and includes a dashboard to track performance metrics.
Tutorial:
Understanding and Using the "Alpha - Combined Breakout" Indicator
This indicator is designed for traders looking for confirmation of market direction and potential entry/exit points by blending structural analysis with a trend-following oscillator.
How it Works (General Concept)
The indicator combines two main components:
Smart Money Breakout: This part identifies significant breaks in market structure, which "smart money" traders often use to gauge shifts in supply and demand. It looks for higher highs/lows or lower highs/lows and flags when these structural points are broken.
UT Bot: This is a trend-following component that generates buy and sell signals based on price action relative to an Average True Range (ATR) based trailing stop.
You can choose to use these signals independently or combined to generate trading alerts and visual cues on your chart. The dashboard provides a quick overview of how well the signals are performing based on your chosen settings and display mode.
Parameters and What They Do
Let's break down each input parameter:
1. Smart Money Inputs
These settings control how the indicator identifies market structure and breakouts.
swingSize (Market Structure Time-Horizon):
What it does: This integer value defines the number of candles used to identify significant "swing" (pivot) points—highs and lows.
Effect: A larger swingSize creates a smoother market structure, focusing on longer-term trends. This means signals might appear less frequently and with some delay but could be more reliable for higher timeframes or broader market movements. A smaller swingSize will pick up more minor market structure changes, leading to more frequent but potentially noisier signals, suitable for lower timeframes or scalping.
Analogy: Think of it like a zoom level on your market structure map. Higher values zoom out, showing only major mountain ranges. Lower values zoom in, showing every hill and bump.
bosConfType (BOS Confirmation Type):
What it does: This string input determines how a Break of Structure (BOS) is confirmed. You have two options:
'Candle Close': A breakout is confirmed only if a candle's closing price surpasses the previous swing high (for bullish) or swing low (for bearish).
'Wicks': A breakout is confirmed if any part of the candle (including its wick) surpasses the previous swing high or low.
Effect: 'Candle Close' provides stronger, more conservative confirmation, as it implies sustained price movement beyond the structure. 'Wicks' provides earlier, more aggressive signals, as it captures momentary breaches of the structure.
Analogy: Imagine a wall. 'Candle Close' means the whole person must get over the wall. 'Wicks' means even a finger touching over the top counts as a breach.
choch (Show CHoCH):
What it does: A boolean (true/false) input to enable or disable the display of "Change of Character" (CHoCH) labels. CHoCH indicates the first structural break against the current dominant trend.
Effect: When true, it helps identify early signs of a potential trend reversal, as it marks where the market's "character" (its tendency to make higher highs/lows or lower lows/highs) first changes.
BULL (Bullish Color) & BEAR (Bearish Color):
What they do: These color inputs allow you to customize the visual appearance of bullish and bearish signals and lines drawn by the Smart Money component.
Effect: Purely cosmetic, helps with visual identification on the chart.
sm_tp_sl_multiplier (SM TP/SL Multiplier (ATR)):
What it does: A float value that acts as a multiplier for the Average True Range (ATR) to calculate the Take Profit (TP) and Stop Loss (SL) levels specifically when you're in "Smart Money Only" mode. It uses the ATR calculated by the UT Bot's nLoss_ut as its base.
Effect: A higher multiplier creates wider TP/SL levels, potentially leading to fewer trades but larger wins/losses. A lower multiplier creates tighter TP/SL levels, potentially leading to more frequent but smaller wins/losses.
2. UT Bot Alerts Inputs
These parameters control the behavior and sensitivity of the UT Bot component.
a_ut (UT Key Value (Sensitivity)):
What it does: This integer value adjusts the sensitivity of the UT Bot.
Effect: A higher value makes the UT Bot less sensitive to price fluctuations, resulting in fewer and potentially more reliable signals. A lower value makes it more sensitive, generating more signals, which can include more false signals.
Analogy: Like a noise filter. Higher values filter out more noise, keeping only strong signals.
c_ut (UT ATR Period):
What it does: This integer sets the look-back period for the Average True Range (ATR) calculation used by the UT Bot. ATR measures market volatility.
Effect: This period directly influences the calculation of the nLoss_ut (which is a_ut * xATR_ut), thus defining the distance of the trailing stop loss and take profit levels. A longer period makes the ATR smoother and less reactive to sudden price spikes. A shorter period makes it more responsive.
h_ut (UT Signals from Heikin Ashi Candles):
What it does: A boolean (true/false) input to determine if the UT Bot calculations should use standard candlestick data or Heikin Ashi candlestick data.
Effect: Heikin Ashi candles smooth out price action, often making trends clearer and reducing noise. Using them for UT Bot signals can lead to smoother, potentially delayed signals that stay with a trend longer. Standard candles are more reactive to raw price changes.
3. Line Drawing Control Buttons
These crucial boolean inputs determine which type of signals will trigger the drawing of TP/SL/Entry lines and flags on your chart. They act as a priority system.
drawLinesUtOnly (Draw Lines: UT Only):
What it does: If checked (true), lines and flags will only be drawn when the UT Bot generates a buy/sell signal.
Effect: Isolates UT Bot signals for visual analysis.
drawLinesSmartMoneyOnly (Draw Lines: Smart Money Only):
What it does: If checked (true), lines and flags will only be drawn when the Smart Money Breakout logic generates a bullish/bearish breakout.
Effect: Overrides drawLinesUtOnly if both are checked. Isolates Smart Money signals.
drawLinesCombined (Draw Lines: UT & Smart Money (Combined)):
What it does: If checked (true), lines and flags will only be drawn when both a UT Bot signal AND a Smart Money Breakout signal occur on the same bar.
Effect: Overrides both drawLinesUtOnly and drawLinesSmartMoneyOnly if checked. Provides the strictest entry criteria for line drawing, looking for strong confluence.
Dashboard Metrics Explained
The dashboard provides performance statistics based on the lines drawing control button selected. For example, if "Draw Lines: UT Only" is active, the dashboard will show stats only for UT Bot signals.
Total Signals: The total number of buy or sell signals generated by the selected drawing mode.
TP1 Win Rate: The percentage of signals where the price reached Take Profit 1 (TP1) before hitting the Stop Loss.
TP2 Win Rate: The percentage of signals where the price reached Take Profit 2 (TP2) before hitting the Stop Loss.
TP3 Win Rate: The percentage of signals where the price reached Take Profit 3 (TP3) before hitting the Stop Loss. (Note: TP1, TP2, TP3 are in order of distance from entry, with TP3 being furthest.)
SL before any TP rate: This crucial metric shows the number of times the Stop Loss was hit / the percentage of total signals where the stop loss was triggered before any of the three Take Profit levels were reached. This gives you a clear picture of how often a trade resulted in a loss without ever moving into profit target territory.
Short Tutorial: How to Use the Indicator
Add to Chart: Open your TradingView chart, go to "Indicators," search for "Alpha - Combined Breakout," and add it to your chart.
Access Settings: Once added, click the gear icon next to the indicator name on your chart to open its settings.
Choose Your Signal Mode:
For UT Bot only: Uncheck "Draw Lines: Smart Money Only" and "Draw Lines: UT & Smart Money (Combined)". Ensure "Draw Lines: UT Only" is checked.
For Smart Money only: Uncheck "Draw Lines: UT Only" and "Draw Lines: UT & Smart Money (Combined)". Ensure "Draw Lines: Smart Money Only" is checked.
For Combined Signals: Check "Draw Lines: UT & Smart Money (Combined)". This will override the other two.
Adjust Parameters:
Start with default settings. Observe how the signals appear on your chosen asset and timeframe.
Refine Smart Money: If you see too many "noisy" market structure breaks, increase swingSize. If you want earlier breakouts, try "Wicks" for bosConfType.
Refine UT Bot: Adjust a_ut (Sensitivity) to get more or fewer UT Bot signals. Change c_ut (ATR Period) if you want larger or smaller TP/SL distances. Experiment with h_ut to see if Heikin Ashi smoothing suits your trading style.
Adjust TP/SL Multiplier: If using "Smart Money Only" mode, fine-tune sm_tp_sl_multiplier to set appropriate risk/reward levels.
Interpret Signals & Lines:
Buy/Sell Flags: These indicate the presence of a signal based on your selected drawing mode.
Entry Line (Blue Solid): This is where the signal was generated (usually the close price of the signal candle).
SL Line (Red/Green Solid): Your calculated stop loss level.
TP Lines (Dashed): Your three calculated take profit levels (TP1, TP2, TP3, where TP3 is the furthest target).
Smart Money Lines (BOS/CHoCH): These lines indicate horizontal levels where market structure breaks occurred. CHoCH labels might appear at the first structural break against the prior trend.
Monitor Dashboard: Pay attention to the dashboard in the top right corner. This dynamically updates to show the win rates for each TP and, crucially, the "SL before any TP rate." Use these statistics to evaluate the effectiveness of the indicator's signals under your current settings and chosen mode.
*
Set Alerts (Optional): You can set up alerts for any of the specific signals (UT Bot Long/Short, Smart Money Bullish/Bearish, or the "Line Draw" combined signals) to notify you when they occur, even if you're not actively watching the chart.
By following this tutorial, you'll be able to effectively use and customize the "Alpha - Combined Breakout" indicator to suit your trading strategy.

Volume Impulse Order Blocks | InvrsROBINHOODWhat the Indicator Does
The Volume Impulse Order Blocks indicator is designed to automatically identify and highlight key price zones where significant trading activity occurs, particularly after the market has made a potential bottom. Its primary goal is to visually distinguish between the initial, often institutional-driven market moves ("Smart Money") and the subsequent reactions from the broader market ("Retail").
The indicator watches for two specific volume patterns:
Paired Impulses: After identifying a significant swing low in price, the indicator looks for the first major spike in volume. It marks this as a "Smart Money" zone. It then watches for the next volume spike, which it labels as a "Retail" zone.
Singular Impulses: Sometimes, a single, powerful volume spike occurs on a candle that is the opposite color of the bars immediately surrounding it. The indicator identifies this as a standalone "Smart Money" event, suggesting a strong, isolated market action.
How to Use It in Trading
This indicator provides visual cues that can be interpreted as potential areas of future support or resistance.
Identifying Key Zones (The Boxes):
Smart Money Box (White/Black): This is the most important signal. It highlights a price range where large players may have initiated positions. A white box marks a bullish (up) candle, and a black box marks a bearish (down) candle. Traders often watch these zones closely, as price may react strongly if it returns to test them in the future.
Retail Box (Red): This box shows where the general market likely followed the initial smart money move. While still significant, it represents a secondary reaction.
Extending Boxes: All boxes automatically extend to the right and will only disappear once the price has traded completely through them. This allows you to see which zones have been "respected" and which have been "broken."
Confirmation Signals:
Blue Vertical Line: This thin blue line is a simple pointer that marks the exact candle of the initial "Smart Money" impulse, helping you pinpoint the event in time.
Trend Reversals: The appearance of a Smart Money box after a prolonged downtrend and a pivot low can be an early signal that the trend may be losing momentum and that significant buyers are entering the market.
In practice, a trader might use these boxes as high-probability zones to look for entries, exits, or to simply understand the underlying market dynamics. As with any tool, it is most effective when used in conjunction with other forms of analysis, such as market structure and trend analysis.

Volume Data Table (Real-time & Historical Volume Analysis)Volume Data Table (Real-time & Historical Volume Analysis)
Overview:
The Volume Data Table indicator is a powerful tool designed to provide concise, real-time, and historical volume insights directly on your chart. It aggregates critical volume metrics into an organized, customizable table, making it incredibly easy to identify unusual volume activity, sudden surges, or sustained interest in a particular asset.
This indicator is perfect for traders who rely on volume analysis to confirm price movements, spot potential reversals, or gauge market conviction.
Key Features & How It Works:
Real-time Volume Metrics:
The table prominently displays the volume data for the current (last) candle, including:
Time: The precise time of the current candle's close, formatted in IST (Indian Standard Time - UTC+5:30) for your convenience.
Volume: The total volume for the current candle, smartly formatted in K (Thousands) or M (Millions) for readability.
Change % (Chg%): The percentage change in volume compared to the immediately preceding candle. This helps you quickly spot sudden increases or decreases in trading activity.
Vs 4-Avg % (vs4Avg%): The percentage change in volume compared to the average volume of the last 4 preceding candles. This is crucial for identifying volume surges or drops relative to recent historical activity, which can signal significant market events.
Configurable Historical Data:
Beyond the current candle, you can customize how many previous candles' volume data you wish to display. A simple input setting allows you to choose from 1 to 20 historical rows, giving you flexibility to review recent volume trends. Each historical row also provides its own "Change %" and "Vs 4-Avg %" for detailed analysis of past candle activity.
Intuitive Color-Coding:
Percentage change values are intuitively color-coded for instant visual cues:
Green: Indicates a positive (increase) in volume percentage.
Red: Indicates a negative (decrease) in volume percentage.
Clean & Organized Table Display:
The indicator presents all this data in a neat, easy-to-read table positioned at the top-right of your chart. The table automatically adjusts its height based on the number of historical rows you choose, ensuring a compact and efficient use of screen space.
Ideal Use Cases:
Volume Confirmation: Quickly confirm the conviction behind price movements. A strong price move on high "Vs 4-Avg %" volume often indicates higher reliability.
Spotting Abnormal Volume: Identify candles with unusually high or low volume compared to their recent average, which can precede or accompany significant price action.
Momentum Analysis: Understand if buying/selling pressure is increasing or decreasing over recent periods.
Scalping & Day Trading: The real-time updates and concise format make it highly effective for fast-paced short-term decision-making.
Complements Other Indicators: Use it alongside price action, candlestick patterns, or other technical indicators for a more robust analysis.
Customization Options:
Number of Historical Rows: Adjust Number of Historical Rows from 1 to 20 to tailor the depth of your historical volume review.
Important Disclaimer:
This indicator is a technical analysis tool and should be used as part of a comprehensive trading strategy. It is not financial advice. Trading in financial markets involves substantial risk, and you could lose money. Always perform your own research and risk management.

Normalized Volume IndexIn the realm of technical analysis, volume is more than just a measure of market activity—it’s a window into trader psychology. Two classic indicators that harness this insight are the Positive Volume Index (PVI) and Negative Volume Index (NVI). Developed in the early 20th century by Paul L. Dysart and later refined by Norman G. Fosback in 1976, these tools aim to distinguish between the behavior of the so-called “smart money” and the broader market crowd.
- Positive Volume Index (PVI) tracks price changes only on days when trading volume increases. It assumes that rising volume reflects the actions of less-informed retail traders—those who follow the herd.
- Negative Volume Index (NVI), on the other hand, focuses on days when volume decreases, under the premise that institutional investors (the “smart money”) are more active when the market is quiet.
This dichotomy allows traders to interpret market sentiment through the lens of volume behavior. For example, a rising NVI during a price uptrend may suggest that institutional investors are quietly accumulating positions—often a bullish signal.
Traders use PVI and NVI to:
- Confirm trends: If NVI is above its moving average, it often signals a strong underlying trend supported by smart money.
- Spot reversals: Divergences between price and either index can hint at weakening momentum or upcoming reversals.
- Gauge participation: PVI rising faster than price may indicate overenthusiastic retail buying—potentially a contrarian signal.
These indicators are often paired with moving averages (e.g., 255-day EMA) to generate actionable signals. Fosback’s research suggested that when NVI is above its one-year EMA, there’s a high probability of a bull market.
While PVI and NVI are cumulative indices, normalizing them—for example, by rebasing to 100 or converting to percentage changes—offers several benefits:
- Comparability: Normalized indices can be compared across different assets or timeframes.
- Clarity: It becomes easier to visualize relative strength or weakness.
- Backtesting: Normalized values are more suitable for algorithmic strategies and statistical analysis.
Normalization also helps when combining PVI/NVI with other indicators in multi-factor models, ensuring no single metric dominates due to scale differences
In essence, PVI and NVI offer a nuanced view of market dynamics by separating the noise of volume surges from the quiet confidence of institutional moves. When normalized and interpreted correctly, they become powerful allies in a trader’s decision-making toolkit.
How to use this (Educational material):
For instance, on average, when the Negative Volume Index (NVI) remains above its midline, the market tends to trend positively, reflecting consistent institutional participation. However, when the NVI dips and stays below the midline, it often signals a negative trend, indicating that smart money is stepping away or reducing exposure.
Another telling scenario occurs when the Positive Volume Index (PVI) drops below the NVI. While this might coincide with a brief price dip, institutions often interpret this as an opportunity to buy the dip, quietly accumulating positions while retail participants exit in panic. The result? A market recovery driven by smart money.
Conversely, when the PVI consistently remains above the NVI, it may point to retail enthusiasm outpacing institutional support. This imbalance can flag a tired or overextended trend, where the smart money has already positioned itself defensively. When this pattern persists, there's a high likelihood that institutions will pull the plug, leading to a pronounced trend reversal.

ICT Setup 04 [TradingFinder] SFP Sweep Liquidity Fake CHoCH/BOS🔵 Introduction
In smart money and ICT based trading, liquidity is never random. Some of the most meaningful market moves begin with a liquidity sweep where price intentionally hunts a previous swing high or swing low to trigger stop loss orders and absorb volume.
This manipulation is often followed by a sharp reversal from a reaction zone, creating ideal conditions for a high probability entry. This indicator is built to detect exactly that. It identifies a valid swing point and defines a reaction zone where price is likely to react.
For short setups, the zone lies between the swing high and the maximum of the candle’s open or close. For long setups, it’s drawn from the swing low to the minimum of the open or close.
When price returns to this zone and forms a qualified confirmation candle typically a doji or a small bodied candle that closes inside the zone while sweeping the liquidity this is a potential sign of reversal.
The candle must show both the sweep and the inability to hold above or below the key level, signaling a fake breakout or failed move. By combining elements of liquidity hunt, reaction zone rejection, and candle based entry confirmation, this tool highlights sniper entry points used by smart money to trap retail traders and reverse the trend. It helps filter out noise and enhances timing, making it ideal for trading in alignment with institutional order flow.
Long Position :
Short Position :
🔵 How to Use
This indicator is designed to highlight precise moments where price sweeps liquidity and reacts within a high probability reversal zone. By identifying clean swing highs and lows and defining a smart reaction zone around them, it filters out weak fakeouts and focuses only on setups with strong institutional footprints.
The tool works best when combined with market structure analysis and is suitable for both scalping and intraday trading. Below is a breakdown of how to interpret the signals for long and short positions based on the visual setups provided.
🟣 Long Setup
In a long setup, the indicator first detects a valid swing low where liquidity has likely accumulated below. A reaction zone is then drawn between the swing low and the minimum of the open or close of the swing candle.
When price returns to this zone, it must sweep the previous low and form a precise confirmation candle, such as a doji or a small bodied candle, that closes inside the zone. This candle must also reject the lower level, showing failure to continue downward.
As shown in the chart, once the liquidity grab is complete and the confirmation candle forms, a clean long signal is issued, indicating a potential bullish reversal backed by smart money behavior.
🟣 Short Setup
In a short setup, the indicator identifies a swing high where buy-side liquidity is resting. It then constructs a reaction zone between the high and the maximum of the open or close of the swing candle. Price must return to this zone, sweep the swing high, and form a bearish confirmation candle inside the zone.
A classic example is a doji or rejection candle that traps breakout buyers and fails to hold above the previous high. In the provided chart, the price aggressively hunts the liquidity above the swing high, but the close within the reaction zone signals exhaustion, prompting a short signal with high reversal probability.
These setups represent moments where price action, liquidity behavior, and candle structure align to offer strong entries. By focusing on clean sweeps and reactive confirmations, the indicator helps traders stay on the side of smart money and avoid common breakout traps.
🔵 Settings
🟣 Logical settings
Swing period : You can set the swing detection period.
Max Swing Back Method : It is in two modes "All" and "Custom". If it is in "All" mode, it will check all swings, and if it is in "Custom" mode, it will check the swings to the extent you determine.
Max Swing Back : You can set the number of swings that will go back for checking.
Maximum Distance Between Swing and Signal :The maximum number of candles allowed between the swing point and the potential signal. The default value is 50, ensuring that only recent and relevant price reactions are considered valid.
🟣 Display settings
Displaying or not displaying swings and setting the color of labels and lines.
🟣 Alert Settings
Alert SFP : Enables alerts for Swing Failure Pattern.
Message Frequency : Determines the frequency of alerts. Options include 'All' (every function call), 'Once Per Bar' (first call within the bar), and 'Once Per Bar Close' (final script execution of the real-time bar). Default is 'Once per Bar'.
Show Alert Time by Time Zone : Configures the time zone for alert messages. Default is 'UTC'.
🔵 Conclusion
This indicator is built for traders who rely on liquidity driven setups and smart money principles. By combining swing structure analysis with precision reaction zones and strict entry confirmation, it isolates the exact moments where price sweeps liquidity and fails to continue. These are high value points where institutional activity often reveals itself, and retail traps unfold.
Unlike generic breakout tools, this script focuses on quality over quantity by requiring both a sweep of a swing high or low and a confirmed rejection candle that closes inside a predefined zone. With customizable swing depth, proximity filters, visual highlights, and alert functions, it offers a complete framework for identifying and acting on fake breakouts with confidence. Whether you trade forex, crypto, or indices, this tool enhances your ability to align with true order flow and take entries where liquidity is most likely to shift.

True Market Structure [Advanced Liquidity Hunter] v1True Market Structure v1
📌 Table of Contents
1. Introduction
2. Core Concepts
3. Indicator Components
4. Configuration
5. Signal Interpretation
6. Trading Strategies
7. Risk Management
8. FAQ
________________________________________
🎯 Introduction
What is True Market Structure?
True Market Structure is an advanced technical analysis indicator that reveals hidden market mechanisms. Based on Smart Money Concepts (SMC) and ICT (Inner Circle Trader) methodology, it identifies where large financial institutions hunt retail traders' stop losses.
Who is this indicator for?
• ✅ Beginners - Intuitive visualizations and clear signals
• ✅ Intermediate - Deeper market structure analysis
• ✅ Advanced - Full parameter control and advanced strategies
Key Benefits
• 🔍 Sees the invisible - Hidden liquidity levels
• 🎯 Precise signals - Based on real data
• ⚡ Real-time - Instant analysis
• 🛡️ Capital protection - Warns against traps
💡 Pro Tip: Start with 15M timeframe! That's where most action happens - stop hunts every few candles, retail traps, liquidity battles. It's the best "microscope" to understand how the market really works.
________________________________________
📚 Core Concepts
Smart Money vs Retail Money
Smart Money:
• Banks, hedge funds, large institutions
• Create market moves, don't follow them
• Exploit retail predictability
Retail Money:
• Individual traders
• Often act emotionally
• Place stop losses at predictable levels
Liquidity
Liquidity refers to areas where many orders are waiting:
• Stop losses above highs (shorts)
• Stop losses below lows (longs)
• Orders at round numbers
Key principle: Smart Money needs liquidity to enter/exit large positions. That's why they "hunt" stop losses first, then make the real move.
________________________________________
🔧 Indicator Components
1. 💧 Liquidity Pools
What is it?
• Price levels tested multiple times
• Stop loss accumulation areas
• Displayed as blue horizontal lines
How to read?
• LIQ HIGH x15 = Level tested 15 times from above
• LIQ LOW x8 = Level tested 8 times from below
• Higher number = stronger zone
Significance:
• Price magnet
• High probability of reaction
• Smart Money target
2. 🎣 Stop Hunts
What is it?
• Candles with long wicks
• Brief penetrations of important levels
• Marked with purple labels
Types:
• STOP HUNT ⬆ - Upward hunt (shorts' stop losses)
• STOP HUNT ⬇ - Downward hunt (longs' stop losses)
Characteristics:
• Long wick (minimum 2x larger than body)
• Wick must also be larger than 0.5 ATR (default)
• Breaks recent high/low from lookback period
• Quick price return
3. 🪤 Trapped Traders
What is it?
• Areas where retail got trapped
• Failed breakouts that didn't hold
• Colored rectangles on chart
Trap types:
• 🔴 TRAPPED LONGS - Buyers caught at top
• 🟢 TRAPPED SHORTS - Sellers caught at bottom
Mechanism:
1. Important level break
2. Retail enters breakout direction
3. Price returns leaving them at loss
4. Stop losses get activated
4. 🎪 Inducement Levels
What is it?
• "Too obvious" support/resistance
• Levels respected minimum 3 times
• Orange dashed lines
Why is it a trap?
• Look like perfect trading spots
• Attract retail traders' attention
• Smart Money uses them to collect liquidity
Example:
• 100,000 level on BTC - round number
• 3 bounces = "strong support"
• Retail buys, Smart Money sells to them
5. ⏰ Kill Zones
What is it?
• Highest Smart Money activity periods
• Red background on chart
• Maximum manipulation time
Default Kill Zones:
• 🌆 London Open (08:00-09:00 UTC)
• 🏙️ NY Open (13:00-14:00 UTC)
• 🌃 Midnight (00:00-01:00 UTC)
Trading Sessions (chart background):
• 🌏 Asian (00:00-08:00 UTC) - Gray background
• 🇬🇧 London (08:00-16:00 UTC) - Blue background
• 🇺🇸 New York (13:00-21:00 UTC) - Orange background
Note: London and New York sessions overlap (13:00-16:00 UTC) - this is the highest liquidity period!
6. 🎯 Smart Money Signals
What is it?
• Potential institutional entry points
• Large labels with 🎯 emoji
• Appear after stop hunts
Conditions:
1. Stop hunt in one direction
2. High volume (2x average)
3. In Kill Zone
4. Direction reversal
7. 📊 Market Analysis Table
The table displays 9 rows with key information:
1. Session - Current trading session (ASIA/LONDON/NEW YORK/CLOSED)
2. Kill Zone - Zone status (🔴 ACTIVE / ✅ SAFE)
3. Liquidity Pools - Number of liquidity zones found
4. Inducement Levels - Number of bait levels
5. Traps (50 bars) - Number of traps in last 50 bars
6. Market Bias - Market direction:
o BULLISH 📈 (close > SMA50 and EMA21)
o BEARISH 📉 (close < SMA50 and EMA21)
o NEUTRAL ➡️ (other cases)
7. Volume - Volume status:
o 🔥 EXTREME (>2x average)
o ⬆️ HIGH (>1.5x average)
o NORMAL (>average)
o ⬇️ LOW (3 traps)
o ⚠️ CHOPPY (>5 traps)
o 👀 WATCH LIQUIDITY (>3 liquidity zones)
o ✓ NORMAL (other)
________________________________________
⚙️ Configuration
Step 1: Basic Configuration
Where to find settings:
• Method 1: Click the ⚙️ (gear) icon next to indicator name on chart
• Method 2: Double-click any indicator line/label
• Method 3: Right-click → "Settings" on indicator name
🌍 Timezone Setting
UTC Offset: Your timezone
Examples:
- London: 0 (winter) or +1 (summer)
- New York: -5 (winter) or -4 (summer)
- Tokyo: +9
🎚️ Sensitivity Adjustment
For beginners - Default settings:
• Lookback Period: 30
• Detection Sensitivity: 0.3
• Min. Touches: 2
For different timeframes:
• 15M: Sensitivity 0.2-0.3, Lookback 20-30
• 1H: Sensitivity 0.3-0.4, Lookback 30-40
• 4H: Sensitivity 0.4-0.5, Lookback 40-50
For different instruments:
• Forex Majors (EUR/USD): Sensitivity 0.1-0.2
• Indices (S&P500;): Sensitivity 0.2-0.4
• Crypto (BTC): Sensitivity 0.4-0.8
• Stocks: Sensitivity 0.3-0.5
Step 2: Advanced Configuration
🔧 Liquidity Zones Parameters
• Min. Touches (1-5): Less = more signals
• Lookback (20-200): More = further levels
• Max Zones (1-10): Display quantity control
🎣 Stop Hunt Parameters
• Wick/Body Ratio (1-5): Lower = more signals
• Min. Wick Size (0.1-2 ATR): Filters small wicks
🎯 Smart Money Analysis
• Require Kill Zone: Enable for fewer signals
• Volume Multiplier: Higher = only big moves
________________________________________
📖 Signal Interpretation
Note: Most examples are shown on 15M timeframe, because that's where you can best see all market manipulations in action!
Signal Importance Hierarchy
1. 🎯 Smart Money Signal - Strongest signal
2. 🪤 Trapped Traders - High reliability
3. 🎣 Stop Hunt - Medium reliability
4. 💧 Liquidity Touch - Needs confirmation
Interpretation Examples
Scenario 1: "Liquidity Grab"
You see: LIQ HIGH x20 at 100,000
+ Stop Hunt ⬆
+ Volume spike
= Likely decline
Scenario 2: "Trap and Reverse"
You see: TRAPPED LONGS
+ Kill Zone Active
+ SM SHORT 🎯
= Strong short signal
Scenario 3: "Inducement Break"
You see: Inducement Level break
+ No volume
+ Status: NORMAL
= Likely trap, wait
Colors and Their Meaning
• 🔵 Blue - Liquidity (neutral)
• 🟠 Orange - Caution, possible trap
• 🔴 Red - Negative signal / long trap
• 🟢 Green - Positive signal / short trap
• 🟣 Purple - Stop hunt (neutral, wait for reaction)
________________________________________
💡 Trading Strategies
Strategy 1: "Liquidity Sweep" (For Beginners)
Assumptions:
• Trade only with trend
• Wait for liquidity collection
• Enter on return
Best timeframe for learning: 15M - you'll see all manipulation stages in real-time!
Steps:
1. Identify trend (Market Bias in table)
2. Find nearest liquidity zone aligned with trend
3. Wait for price to touch and bounce
4. Enter after confirming candle
5. Stop loss beyond liquidity zone
6. Take profit at next zone
Example:
• Trend: BULLISH
• Liquidity at 100,000 (support)
• Price drops to 99,950 (stop hunt)
• Returns above 100,000
• LONG with SL 99,900, TP 101,000
Strategy 2: "Kill Zone Hunter" (Intermediate)
Assumptions:
• Trade only in Kill Zones
• Exploit stop hunts
• Aggressive entries
Ideal timeframe: 15M - in Kill Zones on 15M you'll see exactly every Smart Money move!
Steps:
1. Wait for Kill Zone (red background)
2. Watch first 15-30 minutes
3. Look for stop hunt
4. Enter immediately after stop hunt
5. Tight stop loss (0.5 ATR)
6. Scale position with profit
Tips:
• London Open - often stop hunt down, then rise
• NY Open - often tests Asian High/Low
• Midnight - position resets, false moves
Strategy 3: "Smart Money Follow" (Advanced)
Assumptions:
• Ignore minor signals
• Wait only for SM signals
• Larger positions, fewer trades
Steps:
1. Status must show HIGH RISK or WATCH LIQUIDITY
2. Wait for stop hunt series (minimum 2)
3. Watch Trapped Traders
4. Enter only on SM signal 🎯
5. Stop loss beyond last extreme
6. Hold position until opposite SM signal
Position Management:
• 1/3 position at signal
• 1/3 after direction confirmation
• 1/3 after breaking last high/low
________________________________________
🛡️ Risk Management
Basic Rules
1. Never place stop loss at obvious level
o Add 5-10 pips buffer
o Avoid round numbers
o Check where Liquidity Pools are
2. Reduce position in Kill Zones
o 50% of normal size
o Or wait until they end
3. Avoid trading at HIGH RISK status
o Unless experienced
o Then reverse logic - look for traps
Stop Loss - Where to Place?
❌ Bad places:
• Exactly below/above candle
• At Inducement Levels
• At round numbers
• Where Liquidity Pools visible
✅ Good places:
• Beyond last stop hunt
• Behind Trapped Traders zone
• Minimum 1.5 ATR from entry
• Where SM would lose significantly
Position Sizing
Safe position formula:
Risk per trade = 1-2% of capital
Position size = Risk / (Stop Loss in pips × Pip value)
Modifiers:
• Kill Zone active: × 0.5
• After SM signal: × 1.5
• HIGH RISK status: × 0.3
• With trend: × 1.2
________________________________________
❓ FAQ
General Questions
Q: Indicator shows nothing, what to do? A: Check in settings:
1. Reduce "Min. Touches" to 1
2. Increase "Detection Sensitivity"
3. Enable "Debug Mode" to see statistics
4. Ensure proper timeframe (15M+)
5. On 15M sometimes wait a few candles for first signal
Tip for 15M: If you don't see signals on 15M, enable Debug Mode. If it shows Liq=0, reduce "Min. Touches" to 1 and increase "Liquidity Lookback" to 100.
Q: Too many signals, I'm lost A:
1. Increase requirements (min. touches, respects)
2. Disable some components
3. Trade only strongest signals (SM 🎯)
Q: Which timeframe is best? A:
• 15M - PERFECT FOR LEARNING! Many signals, shows all manipulations, great for beginners
• 30M - Good balance, less noise than 15M
• 1H - Medium-term trading, clear setups
• 4H - Fewer signals but bigger moves, for patient traders
• 1D - Only major levels, position trading
💡 For beginners: Start with 15M! That's where you'll see how the market really works - stop hunts, traps, false breakouts. Only after understanding the mechanics, move to higher timeframes.
Technical Questions
Q: What does "x15" mean at LIQ? A: Number of level touches. Higher = stronger level.
Q: Why are Kill Zones red? A: High risk periods - most manipulation.
Q: What does Debug Mode show? A: When "Show Debug Info" is enabled, a label appears above the last candle with:
• Liq=X - number of Liquidity Pools found
• Ind=X - number of Inducement Levels found
• HighLvl=X - number of highs stored in memory
• LowLvl=X - number of lows stored in memory
This helps understand why sometimes no signals appear (e.g., when Liq=0).
Trading Questions
Q: Can I use only this indicator? A: Yes, but better combined with:
• Trend analysis
• Support/resistance
• Volume
Q: Does it work on all markets? A: Best on liquid ones:
• ✅ Major Forex pairs
• ✅ Main indices
• ✅ BTC, ETH
• ⚠️ Less liquid altcoins
• ❌ Exotic pairs, small caps
Q: How to remove indicator from chart? A:
• Method 1: Click X next to indicator name
• Method 2: Right-click on name → "Remove"
• Method 3: In indicators panel (left side) find and click trash icon
Q: Can I use multiple copies of the indicator? A: Yes! You can add the indicator multiple times with different settings (e.g., one for liquidity, another for stop hunts only).
Q: How much can I earn? A: Indicator doesn't guarantee profit. It's an analysis tool, not a trading system. Your results depend on:
• Discipline
• Risk management
• Experience
• Market conditions
________________________________________
🎯 Quick Start - Checklist
Pro Tip: After adding the indicator, click the star ⭐ to add to favorites - you'll have quick access in the future!
For Beginners:
• After adding indicator, set your UTC offset in settings
• Start on 15M timeframe (where you'll see the most action!)
• Observe for a week without trading
• Learn to recognize each signal type
• Practice on 15M, then try 1H
• Start with "Liquidity Sweep" strategy
• Max 1% risk per trade
• Keep trading journal
First Steps:
1. Days 1-3: Observe and learn signals
2. Days 4-7: Mark potential entries (no trading)
3. Week 2: Demo trading with small positions
4. Week 3+: Real trading with strict risk management
________________________________________
💬 Support
• Questions & Suggestions: Comments section under the indicator
• Bug Reports: Describe issue in comments with timeframe and instrument
• Updates: Click "Follow" to receive notifications
• Examples: Regular trading idea publications with usage examples
💡 Community: Share your setups in comments - let's help each other!
________________________________________
⚖️ Disclaimer
This indicator is an educational and analytical tool. It does not constitute investment advice. Trading involves risk of capital loss. Always conduct your own analysis and apply appropriate risk management. Historical results do not guarantee future profits.

OA - SMESSmart Money Entry Signals (SMES)
The SMES indicator is developed to identify potential turning points in market behavior by analyzing internal price dynamics, rather than relying on external volume or sentiment data. It leverages normalized price movement, directional volatility, and smoothing algorithms to detect potential areas of accumulation or distribution by market participants.
Core Concepts
Smart Money Flow calculation based on normalized price positioning
Directional VHF (Vertical Horizontal Filter) used to enhance signal directionality
Overbought and Oversold regions defined with optional glow visualization
Entry and Exit signals based on dynamic crossovers
Highly customizable input parameters for precision control
Key Inputs
Smart Money Flow Period
Smoothing Period
Price Analysis Length
Fibonacci Lookback Length
Visual toggle options (zones, glow effects, signal display)
Usage
This tool plots the smoothed smart money flow as a standalone oscillator, designed to help traders identify potential momentum shifts or extremes in market sentiment. Entry signals are generated through crossover logic, while optional filters based on price behavior can refine those signals. Exit signals are shown when the smart money line exits extreme regions.
Important Notes
This indicator does not repaint
Works on all timeframes and instruments
Best used as a confirmation tool with other technical frameworks
All calculations are based strictly on price data
Disclaimer
This script is intended for educational purposes only. It does not provide financial advice or guarantee performance. Please do your own research and apply appropriate risk management before making any trading decisions.

Enhanced TEMA with Decimal PeriodsImagine you have a special type of moving average line called a TEMA (Triple
Moving Average). A TEMA is designed to be even quicker to react to price changes than a regular EMA (Exponential Moving Average), helping traders spot trends faster.
What this script does:
Super-Precise TEMA Length:
Normally, when you set the "length" or "period" for a moving average, you use whole numbers (like 10 days, 20 days).
This script lets you be more precise and use decimal numbers for the TEMA's length (like 26.0 days, or even 26.7 days). This allows for very fine-tuning.
How it gets the "Decimal" EMA part (if you choose to use it):
If you want a TEMA with a length of, say, 26.7:
The script first needs to calculate EMAs with a length of 26.7.
To do this, it cleverly calculates two regular EMAs: one with a length of 26 and another with a length of 27 (the whole numbers just below and above 26.7).
Then, it blends these two EMAs. Since 26.7 is closer to 27, it takes more from the "27-period EMA" and a bit less from the "26-period EMA." This mix gives you an EMA that acts like it has a 26.7 period.
Building the TEMA:
A TEMA isn't just one EMA. It's made by taking an EMA of an EMA, and then an EMA of that. It's like smoothing the line multiple times, but in a special mathematical way to make it faster.
So, this script:
-Calculates the first "decimal EMA" (e.g., for 26.7).
-Calculates another "decimal EMA" of that first EMA line (again, using 26.7).
-Calculates a third "decimal EMA" of the second EMA line (still using 26.7).
Finally, it combines these three EMAs using a special TEMA formula to get the final, quick-reacting TEMA line.
Option to Switch Off Decimals:
There's a setting ("Use Decimal Periods"). If you turn this off, the script will just use regular whole-number EMAs to build the TEMA (it will round down your decimal input, so 26.7 would become 26).
Plotting:
The final "Enhanced TEMA" line is drawn on your price chart.
In Simple Terms:
This script gives you a TEMA (a fast-moving average) that you can set up with very precise decimal lengths (like 26.7 instead of just 26 or 27).
It does this "decimal magic" by smartly blending two regular EMAs. You can also choose to use it like a normal TEMA with whole numbers if you prefer. The goal is to give traders a very responsive trend-following line that can be fine-tuned to a high degree of precision.
Power Block Consolidation with Volume @MaxMaserati 2.0Power Block Consolidation with Volume @MaxMaserati 2.0
Overview
Price action hinges on consolidation, the foundation of market moves. The "Power Block Consolidation with Volume @MaxMaserati 2.0" (MMPB) indicator uses a proprietary, ingenious system to identify high-probability consolidation zones—termed "power blocks"—where smart money drives accumulation or distribution. By leveraging a unique limitorphe closing candle system, to plots volume to signal price direction: significant volume at the high price indicates bullish continuation, while volume at the low price suggests bearish momentum. This tool empowers traders to exploit bullish and bearish trends with precision.
Key Features
Consolidation Detection: Pinpoints power blocks using a secret system, marking zones of smart money activity.
Volume Analysis: A proprietary limitrophe closing candle system splits volume into buying (high price) and selling (low price), revealing accumulation (buying pressure) or distribution (selling pressure).
Trend Visualization:
Bullish Trends: Green boxes and lines highlight consolidation zones with high volume at the high price, signaling upward continuation.
Bearish Trends: Red boxes and lines mark zones with high volume at the low price, indicating downward momentum.
NB: The volume matter more than the color of the box.
Example
High volume up at the box vs low volume at the low we expect an up move
Even we had a bearish Body close below the box price reconfirmed the up move
Price make the bullish upside move
Price retest the box and reject it strongly
Breakout and Retest: Captures breakouts from power blocks, with price often retesting the zone before resuming the trend.
Volume Labels: Displays buying (green) and selling (red) volume on lines for clear pressure analysis.
Breakout Alerts: Triggers alerts for bullish ("BuBC") and bearish ("BeBC") breakouts, with optional visual markers (triangles).
Strategy
MMPB is designed to capture smart money behavior in consolidation zones, where markets prepare for significant moves. Key principles:
Volume-Driven Direction: High volume at the high price within a power block signals strong bullish continuation; high volume at the low price indicates bearish potential.
Accumulation/Distribution: Buying volume reflects accumulation, priming bullish trends; selling volume signals distribution, fueling bearish trends.
Breakout and Retest: Price often breaks out from power blocks and retests the zone, offering low-risk entry points.
Consolidation as Precursor: Markets require consolidation to build momentum, making power blocks critical for trend prediction.
Traders can:
Enter on breakouts with strong volume confirmation.
Target retests of power blocks for high-probability setups.
Use volume labels to assess trend strength.
Use Cases
Trend Trading: Ride bullish or bearish trends post-breakout from high-volume power blocks.
Swing Trading: Use power blocks as dynamic support/resistance for entries and exits.
Smart Money Analysis: Identify accumulation (bullish) or distribution (bearish) zones.
Risk Management: Place stops at power block edges during retests.
Conclusion
The MMPB indicator, powered by a proprietary system, transforms consolidation analysis by identifying power blocks where smart money operates. Its limitrophe closing candle system highlights volume-driven trends, enabling traders to capitalize on bullish and bearish moves with confidence. Ideal for trend and swing traders, MMPB shines in markets where consolidation precedes significant trends, offering clear signals for breakouts and retests.
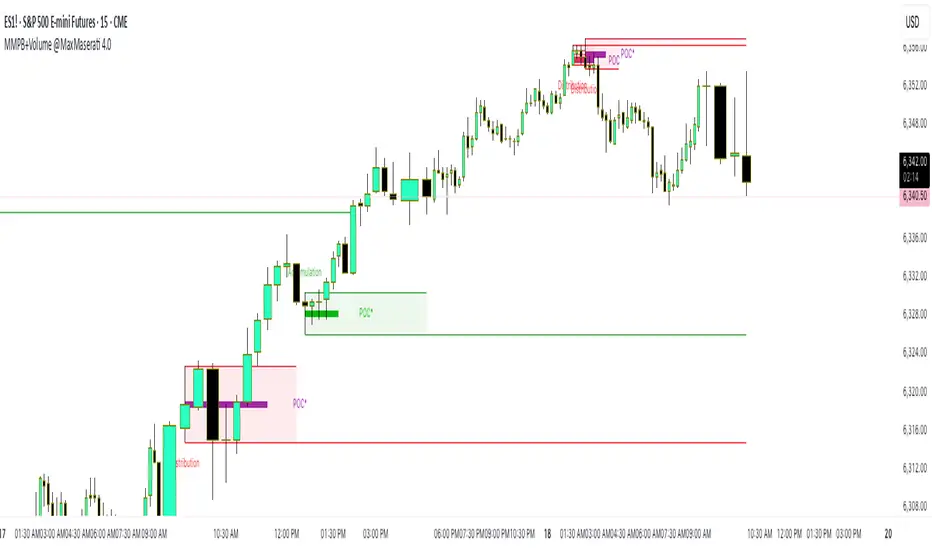
Quarterly Theory ICT 05 [TradingFinder] Doubling Theory Signals🔵 Introduction
Doubling Theory is an advanced approach to price action and market structure analysis that uniquely combines time-based analysis with key Smart Money concepts such as SMT (Smart Money Technique), SSMT (Sequential SMT), Liquidity Sweep, and the Quarterly Theory ICT.
By leveraging fractal time structures and precisely identifying liquidity zones, this method aims to reveal institutional activity specifically smart money entry and exit points hidden within price movements.
At its core, the market is divided into two structural phases: Doubling 1 and Doubling 2. Each phase contains four quarters (Q1 through Q4), which follow the logic of the Quarterly Theory: Accumulation, Manipulation (Judas Swing), Distribution, and Continuation/Reversal.
These segments are anchored by the True Open, allowing for precise alignment with cyclical market behavior and providing a deeper structural interpretation of price action.
During Doubling 1, a Sequential SMT (SSMT) Divergence typically forms between two correlated assets. This time-structured divergence occurs between two swing points positioned in separate quarters (e.g., Q1 and Q2), where one asset breaks a significant low or high, while the second asset fails to confirm it. This lack of confirmation—especially when aligned with the Manipulation and Accumulation phases—often signals early smart money involvement.
Following this, the highest and lowest price points from Doubling 1 are designated as liquidity zones. As the market transitions into Doubling 2, it commonly returns to these zones in a calculated move known as a Liquidity Sweep—a sharp, engineered spike intended to trigger stop orders and pending positions. This sweep, often orchestrated by institutional players, facilitates entry into large positions with minimal slippage.
Bullish :
Bearish :
🔵 How to Use
Applying Doubling Theory requires a simultaneous understanding of temporal structure and inter-asset behavioral divergence. The method unfolds over two main phases—Doubling 1 and Doubling 2—each divided into four quarters (Q1 to Q4).
The first phase focuses on identifying a Sequential SMT (SSMT) divergence, which forms when two correlated assets (e.g., EURUSD and GBPUSD, or NQ and ES) react differently to key price levels across distinct quarters. For example, one asset may break a previous low while the other maintains structure. This misalignment—especially in Q2, the Manipulation phase—often indicates early smart money accumulation or distribution.
Once this divergence is observed, the extreme highs and lows of Doubling 1 are marked as liquidity zones. In Doubling 2, the market gravitates back toward these zones, executing a Liquidity Sweep.
This move is deliberate—designed to activate clustered stop-loss and pending orders and to exploit pockets of resting liquidity. These sweeps are typically driven by institutional forces looking to absorb liquidity and position themselves ahead of the next major price move.
The key to execution lies in the fact that, during the sweep in Doubling 2, a classic SMT divergence should also appear between the two assets. This indicates a weakening of the previous trend and adds an extra layer of confirmation.
🟣 Bullish Doubling Theory
In the bullish scenario, Doubling 1 begins with a bullish SSMT divergence, where one asset forms a lower low while the other maintains its structure. This divergence signals weakening bearish momentum and possible smart money accumulation. In Doubling 2, the market returns to the previous low and sweeps the liquidity zone—breaking below it on one asset, while the second fails to confirm, forming a bullish SMT divergence.
f this move is followed by a bullish PSP and a clear market structure break (MSB), a long entry is triggered. The stop-loss is placed just below the swept liquidity zone, while the target is set in the premium zone, anticipating a move driven by institutional buyers.
🟣 Bearish Doubling Theory
The bearish scenario follows the same structure in reverse. In Doubling 1, a bearish SSMT divergence occurs when one asset prints a higher high while the other fails to do so. This suggests distribution and weakening buying pressure. Then, in Doubling 2, the market returns to the previous high and executes a liquidity sweep, targeting trapped buyers.
A bearish SMT divergence appears, confirming the move, followed by a bearish PSP on the lower timeframe. A short position is initiated after a confirmed MSB, with the stop-loss placed
🔵 Settings
⚙️ Logical Settings
Quarterly Cycles Type : Select the time segmentation method for SMT analysis.
Available modes include : Yearly, Monthly, Weekly, Daily, 90 Minute, and Micro.
These define how the indicator divides market time into Q1–Q4 cycles.
Symbol : Choose the secondary asset to compare with the main chart asset (e.g., XAUUSD, US100, GBPUSD).
Pivot Period : Sets the sensitivity of the pivot detection algorithm. A smaller value increases responsiveness to price swings.
Pivot Sync Threshold : The maximum allowed difference (in bars) between pivots of the two assets for them to be compared.
Validity Pivot Length : Defines the time window (in bars) during which a divergence remains valid before it's considered outdated.
🎨 Display Settings
Show Cycle :Toggles the visual display of the current Quarter (Q1 to Q4) based on the selected time segmentation
Show Cycle Label : Shows the name (e.g., "Q2") of each detected Quarter on the chart.
Show Labels : Displays dynamic labels (e.g., “Q2”, “Bullish SMT”, “Sweep”) at relevant points.
Show Lines : Draws connection lines between key pivot or divergence points.
Color Settings : Allows customization of colors for bullish and bearish elements (lines, labels, and shapes)
🔔 Alert Settings
Alert Name : Custom name for the alert messages (used in TradingView’s alert system).
Message Frequenc y:
All : Every signal triggers an alert.
Once Per Bar : Alerts once per bar regardless of how many signals occur.
Per Bar Close : Only triggers when the bar closes and the signal still exists.
Time Zone Display : Choose the time zone in which alert timestamps are displayed (e.g., UTC).
Bullish SMT Divergence Alert : Enable/disable alerts specifically for bullish signals.
Bearish SMT Divergence Alert : Enable/disable alerts specifically for bearish signals
🔵 Conclusion
Doubling Theory is a powerful and structured framework within the realm of Smart Money Concepts and ICT methodology, enabling traders to detect high-probability reversal points with precision. By integrating SSMT, SMT, Liquidity Sweeps, and the Quarterly Theory into a unified system, this approach shifts the focus from reactive trading to anticipatory analysis—anchored in time, structure, and liquidity.
What makes Doubling Theory stand out is its logical synergy of time cycles, behavioral divergence, liquidity targeting, and institutional confirmation. In both bullish and bearish scenarios, it provides clearly defined entry and exit strategies, allowing traders to engage the market with confidence, controlled risk, and deeper insight into the mechanics of price manipulation and smart money footprints.

Volume Intelligence Suite (VIS) v2📊 Volume Intelligence Suite – Smart Volume, Smart Trading
The Volume Intelligence Suite is a powerful, all-in-one TradingView indicator designed to give traders deeper insight into market activity by visualizing volume behavior with price action context. Whether you're a scalper, day trader, or swing trader, this tool helps uncover hidden momentum, institutional activity, and potential reversals with precision.
🔍 Key Features:
Dynamic Volume Zones – Highlights high and low volume areas to spot accumulation/distribution ranges.
Volume Spikes Detector – Automatically marks abnormal volume bars signaling potential breakout or trap setups.
Smart Delta Highlighting – Compares bullish vs bearish volume in real time to reveal buyer/seller strength shifts.
Session-Based Volume Profiling – Breaks volume into key trading sessions (e.g., London, New York) for clearer context.
Volume Heatmap Overlay – Optional heatmap to show intensity and velocity of volume flow per candle.
Custom Alerts – Built-in alerts for volume surges, divergences, and exhaustion signals.
Optimized for Kill Zone Analysis – Pairs perfectly with ICT-style session strategies and Waqar Asim’s trading methods.
🧠 Why Use Volume Intelligence?
Most traders overlook the story behind each candle. Volume Intelligence Suite helps you "see the why behind the move" — exposing key areas of interest where smart money may be active. Instead of reacting late, this tool puts you in position to anticipate.
Use it to:
Validate breakouts
Detect fakeouts and liquidity grabs
Confirm bias during kill zones
Analyze volume divergence with price swings
⚙️ Fully Customizable:
From volume thresholds to visual styles and session timings, everything is user-adjustable to fit your market, timeframe, and strategy.
✅ Best For:
ICT/Smart Money Concepts (SMC) traders
Breakout & reversal traders
Kill zone session scalpers
Institutional footprint followers

ICT Macro Zone Boxes w/ Individual H/L Tracking v3.1ICT Macro Zones (Grey Box Version
This indicator dynamically highlights key intraday time-based macro sessions using a clean, minimalistic grey box overlay, helping traders align with institutional trading cycles. Inspired by ICT (Inner Circle Trader) concepts, it tracks real-time highs and lows for each session and optionally extends the zone box after the session ends — making it a precision tool for intraday setups, order flow analysis, and macro-level liquidity sweeps.
### 🔍 **What It Does**
- Plots **six predefined macro sessions** used in Smart Money Concepts:
- AM Macro (09:50–10:10)
- London Close (10:50–11:10)
- Lunch Macro (11:30–13:30)
- PM Macro (14:50–15:10)
- London SB (03:00–04:00)
- PM SB (15:00–16:00)
- Each zone:
- **Tracks high and low dynamically** throughout the session.
- **Draws a consistent grey shaded box** to visualize price boundaries.
- **Displays a label** at the first bar of the session (optional).
- **Optionally extends** the box to the right after the session closes.
### 🧠 **How It Works**
- Uses Pine Script arrays to define each session’s time window, label, and color.
- Detects session entry using `time()` within a New York timezone context.
- High/Low values are updated per bar inside the session window.
- Once a session ends, the box is optionally closed and fixed in place.
- All visual zones use a standardized grey tone for clarity and consistency across charts.
### 🛠️ **Settings**
- **Shade Zone High→Low:** Enable/disable the grey macro box.
- **Extend Box After Session:** Keep the zone visible after it ends.
- **Show Entry Label:** Display a label at the start of each session.
### 🎯 **Why This Script is Unique**
Unlike basic session markers or colored backgrounds, this tool:
- Focuses on **macro moments of liquidity and reversal**, not just open/close times.
- Uses **per-session logic** to individually track price behavior inside key time windows.
- Supports **real-time high/low tracking and clean zone drawing**, ideal for Smart Money and ICT-style strategies.
Perfect — based on your list, here's a **bundle-style description** that not only explains the function of each script but also shows how they **work together** in a Smart Money/ICT workflow. This kind of cross-script explanation is exactly what TradingView wants to see to justify closed-source mashups or interdependent tools.
---
📚 ICT SMC Toolkit — Script Integration Guide
This set of advanced Smart Money Concept (SMC) tools is designed for traders who follow ICT-based methodologies, combining liquidity theory, time-based precision, and engineered confluences for high-probability trades. Each indicator is optimized to work both independently and synergistically, forming a comprehensive trading framework.
---
First FVG Custom Time Range
**Purpose:**
Plots the **first Fair Value Gap (FVG)** that appears within a defined session (e.g., NY Kill Zone, Custom range). Includes optional retest alerts.
**Best Used With:**
- Use with **ICT Macro Zones (Grey Box Version)** to isolate FVGs during high-probability times like AM Macro or PM SB.
- Combine with **Liquidity Levels** to assess whether FVGs form near swing points or liquidity voids.
---
ICT SMC Liquidity Grabs and OB s
**Purpose:**
Detects **liquidity grabs** (stop hunts above/below swing highs/lows) and **bullish/bearish order blocks**. Includes optional Fibonacci OTE levels for sniper entries.
**Best Used With:**
- Use with **ICT Turtle Soup (Reversal)** for confirmation after a liquidity grab.
- Combine with **Macro Zones** to catch order blocks forming inside timed macro windows.
- Match with **Smart Swing Levels** to confirm structure breaks before entry.
ICT SMC Liquidity Levels (Smart Swing Lows)
**Purpose:**
Automatically marks swing highs/lows based on user-defined lookbacks. Tracks whether those levels have been breached or respected.
**Best Used With:**
- Combine with **Turtle Soup** to detect if a swing level was swept, then reversed.
- Use with **Liquidity Grabs** to confirm a grab occurred at a meaningful structural point.
- Align with **Macro Zones** to understand when liquidity events occur within macro session timing.
ICT Turtle Soup (Liquidity Reversal)
**Purpose:**
Implements the classic ICT Turtle Soup model. Looks for swing failure and quick reversals after a liquidity sweep — ideal for catching traps.
Best Used With:
- Confirm with **Liquidity Grabs + OBs** to identify institutional activity at the reversal point.
- Use **Liquidity Levels** to ensure the reversal is happening at valid previous swing highs/lows.
- Amplify probability when pattern appears during **Macro Zones** or near the **First FVG**.
ICT Turtle Soup Ultimate V2
**Purpose:**
An enhanced, multi-layer version of the Turtle Soup setup that includes built-in liquidity checks, OTE levels, structure validation, and customizable visual output.
**Best Used With:**
- Use as an **entry signal generator** when other indicators (e.g., OBs, liquidity grabs) are aligned.
- Pair with **Macro Zones** for high-precision timing.
- Combine with **First FVG** to anticipate price rebalancing before explosive moves.
---
## 🧠 Workflow Example:
1. **Start with Macro Zones** to focus only on institutional trading windows.
2. Look for **Liquidity Grabs or Swing Sweeps** around key highs/lows.
3. Check for a **Turtle Soup Reversal** or **Order Block Reaction** near that level.
4. Confirm confluence with a **Fair Value Gap**.
5. Execute using the **OTE level** from the Liquidity Grabs + OB script.
---
Let me know which script you want to publish first — I’ll tailor its **individual TradingView description** and flag its ideal **“Best Used With” partners** to help users see the value in your ecosystem.
