Advanced Correlation Monitor📊 Advanced Correlation Monitor - Pine Script v6
🎯 What does this indicator do?
Monitors real-time correlations between 13 different asset pairs and alerts you when historically strong correlations break, indicating potential trading opportunities or changes in market dynamics.
🚀 Key Features
✨ Multi-Market Monitoring
7 Forex Pairs (GBPUSD/DXY, EURUSD/GBPUSD, etc.)
6 Index/Stock Pairs (SPY/S&P500, DAX/NASDAQ, TSLA/NVDA, etc.)
Fully configurable - change any pair from inputs
📈 Dual Correlation Analysis
Long Period (90 bars): Identifies historically strong correlations
Short Period (6 bars): Detects recent breakdowns
Pearson Correlation using Pine Script v6 native functions
🎨 Intuitive Visualization
Real-time table with 6 information columns
Color coding: Green (correlated), Red (broken), Gray (normal)
Visual states: 🟢 OK, 🔴 BROKEN, ⚫ NORMAL
🚨 Smart Alert System
Only alerts previously correlated pairs (>80% historical)
Detects breakdowns when short correlation <80%
Consolidated alert with all affected pairs
🛠️ Flexible Configuration
Adjustable Parameters:
📅 Periods: Long (30-500), Short (2-50)
🎯 Threshold: 50%-99% (default 80%)
🎨 Table: Configurable position and size
📊 Symbols: All pairs are configurable
Default Pairs:
FOREX: INDICES/STOCKS:
- GBPUSD vs DXY • SPY vs S&P500
- EURUSD vs GBPUSD • DAX vs S&P500
- EURUSD vs DXY • DAX vs NASDAQ
- USDCHF vs DXY • TSLA vs NVDA
- GBPUSD vs USDCHF • MSFT vs NVDA
- EURUSD vs USDCHF • AAPL vs NVDA
- EURUSD vs EURCAD
💡 Practical Use Cases
🔄 Pairs Trading
Detects when strong correlations break for:
Statistical arbitrage
Mean reversion trading
Divergence opportunities
🛡️ Risk Management
Identifies when "safe" assets start moving independently:
Portfolio diversification
Smart hedging
Regime change detection
📊 Market Analysis
Understand underlying market structure:
Forex/DXY correlations
Tech sector rotation
Regional market disconnection
🎓 Results Interpretation
Reading Example:
EURUSD vs DXY: -98.57% → -98.27% | 🟢 OK
└─ Perfect negative correlation maintained (EUR rises when DXY falls)
TSLA vs NVDA: 78.12% → 0% | ⚫ NORMAL
└─ Lost tech correlation (divergence opportunity)
Trading Signals:
🟢 → 🔴: Broken correlation = Possible opportunity
Large difference: Indicates correlation tension
Multiple breaks: Market regime change
在腳本中搜尋"smart"

Rally/Drop Market Structure (Multi-Timeframe)Rally/Drop Market Structure
Supply and Demand Zones from Bullish/Bearish Breaks
Overview:
The Rally/Drop Market Structure indicator is a powerful price action tool that identifies key structural turning points in the market by detecting bullish and bearish breaks . After each confirmed break, it plots either a demand zone (following a bullish break or rally) or a supply zone (following a bearish break or drop). These zones represent institutional footprints — areas where price is likely to react due to imbalance or unfilled orders.
The indicator is based on synthetic higher timeframe (HTF) candles to provide a more stable and smoothed structural map, improving clarity and signal quality over raw candles.
How It Works:
- A bullish break is defined when price makes a higher high and a higher low (or closes above the previous high depending on your selected mode).
- A bearish break is defined when price makes a lower high and a lower low (or closes below the previous low).
- After a bullish break, the indicator plots a demand zone based on the low and high of the most recent bearish candle — representing where demand stepped in.
- After a bearish break, the indicator plots a supply zone from the most recent bullish candle — indicating where supply took control.
- Optional mitigation logic marks zones as mitigated (or deletes them) once price trades into the opposing side.
- Internal shift detection highlights swing highs and lows , labels structural points (HH, HL, LH, LL), and identifies potential liquidity sweeps .
Features:
- Dynamic plotting of rally-based demand zones and drop-based supply zones
- Toggle to use Highs/Lows or Close-based breaks for structure
- Support for LTF, MTF, and HTF analysis (with selectable timeframe)
- Zone mitigation logic with optional automatic cleanup
- Labeling of key swing points: HH , HL , LH , LL , and LS (Liquidity Sweep)
- Zigzag visualization for structure flow
- Alert-ready for internal shifts, BoS, and zone creation
- Separate styling options for BoS lines, internal shift shapes, and zone colors
How to Use:
- Set your desired HTF candle source (e.g., 1H or 4H) depending on your trading style.
- Use Highs/Lows mode for pure price action structure or Close mode for more conservative signals.
- Observe when a bullish break occurs — a demand zone will form where price previously dropped before rallying. Look for long opportunities if price revisits this zone.
- After a bearish break , a supply zone forms where the rally failed — use this to scout short entries on retests.
- Use BoS lines to confirm structure shifts and validate entry triggers or trend direction.
- Monitor mitigated zones for reduced reliability or avoid them completely by enabling automatic deletion.
- Use alerts to stay notified about key changes without watching the chart constantly.
Recommended Strategies:
- Smart money or ICT-style trading : identify institutional footprints and mitigation setups
- Reversal trading : catch price rejecting off unmitigated zones after structure break
- Trend continuation : enter in the direction of internal structure after pullbacks into zones
- Liquidity sweep confirmation : filter out false breaks using HH/LL with LS detection
Tips:
- Combine this indicator with a higher timeframe bias tool (e.g., moving average, higher timeframe market structure).
- For scalping, use tighter HTFs and reduce the zone duration.
- For swing trading, use larger HTFs (1H, 4H, Daily) and increase zone persistence.
Summary:
The Rally/Drop Market Structure indicator gives you an actionable framework for understanding price structure, market intent, and supply/demand imbalances. Whether you're looking for precision entries, trend confirmation, or smart money concepts, this tool helps simplify complex price behavior into clean, usable structure and zones.

Intelligent Top & Bottom Finder v9.8 Keyvankh📈 Intelligent Top & Bottom Finder v9.8 Keyvankh
A next-generation all-in-one trading system for precise tops, bottoms, and reversals across all timeframes.
---
🟢 Overview
This indicator is a powerful and intelligent solution for detecting market tops and bottoms, key reversals, and S/R zones with institutional-grade accuracy. Designed for traders seeking an edge in any market (crypto, forex, stocks), it combines advanced candlestick recognition, multi-indicator confirmation, smart support/resistance clustering, and strict signal filtering into one seamless tool.
---
🔎 How Does It Work?
1. Advanced Support & Resistance Clustering
Automatically detects and draws high-probability support and resistance zones using dynamic ATR-based pivot clustering.
Highlights breakouts and retest (flip) zones in real-time, adapting to changing market structure.
2. Full Candlestick Pattern Recognition
Scans for 15+ classic and advanced patterns: Engulfing, Pin Bar, Doji, Three Bar, Marubozu, Hammer, Shooting Star, Three White Soldiers, Three Black Crows, Tweezer, Morning/Evening Star, Kicker, Belt Hold, and more.
Scores each pattern’s strength based on location (S/R zone, retest, breakout), volume context, and confirmation signals.
3. Multi-Indicator Confirmation Engine**
Integrates and scores confirmation from up to five additional sources:
RSI Games 1.2** (smoothed LTF momentum shifts)
MACD Divergence** (bullish/bearish momentum reversal)
QQE+ v7 Advanced** (dynamic volatility filter)
OBV Trend Filter** (volume-backed trend validation)
Volume Game** (net volume spike and reversal detection)
Each module can be enabled or disabled to fit your personal trading style.
4. Institutional S/R and Retest Logic
Real-time recognition of major trendline breaks, retest zones, and price flips.
Automatic labeling and coloring of S/R zones, retest boxes, and confirmation candles.
5. Smart Buy & Sell Signal Generation**
Combines all scoring modules with strict logical filters and “failsafe override” logic (guaranteeing signal on confirmed hammers, engulfings, etc. even if other filters disagree).
Plots clear “BUY” and “SELL” labels only when a strong, multi-factor signal appears—minimizing noise and maximizing reliability.
Built-in fallback logic (optional) for edge cases.
6. Alerts & Automation Ready
TradingView alerts for all BUY, SELL, or ANY signal conditions—perfect for auto-trading or notification setups.
---
*⚙️ Customizable Inputs
Enable/Disable any module (RSI Games, MACD, OBV, QQE+, Candlestick Scanner, Volume Game)
Minimum Confirmations** required for a signal (1–10)
Pivot/Zone Sensitivity:** ATR multiplier, pivots per cluster, retest bar duration
LTF (Lower Timeframe) Confirmation:** Fully configurable
---
📊 How To Use**
Apply on any timeframe and symbol**—crypto, stocks, forex, indices.
Use as a **standalone reversal/entry tool** or to confirm your own technical setups.
Combine with your favorite momentum, trend, or volume indicators for advanced confluence.
Set up **TradingView alerts** for auto-trading, Telegram/email notifications, or trade journaling.
---
🟢 What Makes This Unique?
All-in-one multi-indicator fusion:** No more juggling a dozen scripts.
Institutional logic:** Goes beyond basic signals with true S/R, retest, and volume logic.
Full transparency:** Source code is clear and commented (if published open-source).
Fast and reliable:** Optimized for minimal lag and maximum accuracy.
---
⚠️ Disclaimer**
This indicator is a tool to assist with trade timing and risk management. **No system is 100% accurate.** Always use in conjunction with your own analysis and risk management practices.
---
📚 Credits & License**
Created by Keyvan Khodakhah.
You may use, modify, or share this script under the (mozilla.org).
Please credit the original author if you fork or reuse in public.
---
Questions, feedback, or collaboration? Contact: Keyvankh
---
Precision in technical analysis comes from layers of confluence and discipline. This tool brings that precision to your chart.

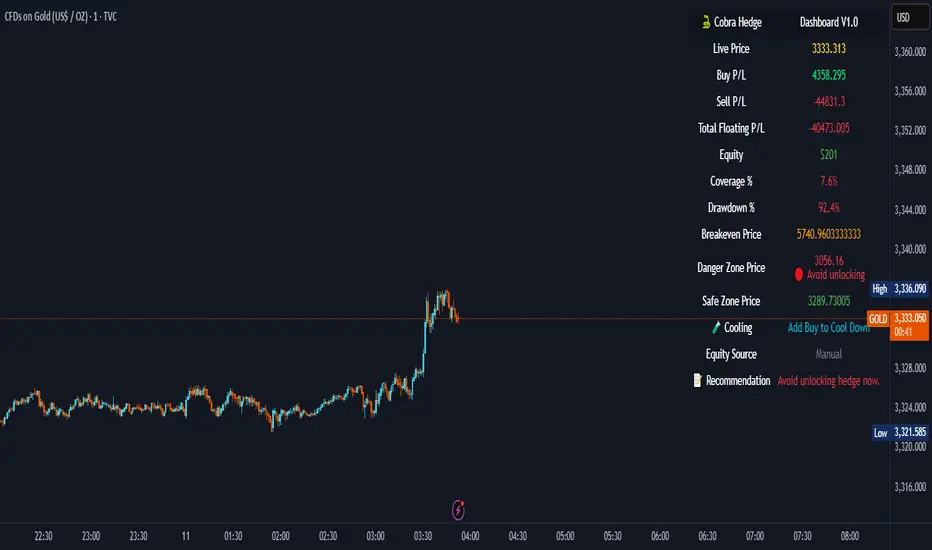
Cobra Hedge Dashboard – V1.0 Final Master🧠 Cobra Hedge Dashboard – V1.0 Final Master
V1.0 | Smart Risk Filter for Open Hedge Positions
📝 (Description):
Cobra Hedge Dashboard is built specifically for traders managing open hedge positions. It provides a real-time view of directional pressure, smart zones, and price behavior to help make informed decisions such as:
When to partially close hedge orders
When to reverse positions based on flow & exhaustion
Which side (Buy or Sell) currently has momentum
Detecting price reaching critical zones (Supply/Demand)
Measuring volume strength to avoid fake exits
🔍 Ideal for traders already in the market — this dashboard is not an entry signal system, but a tool to manage hedge exits and exposure.
Built-in calculations include:
VWAP and EMA cross-pressure
Directional flow meter
Auto Supply & Demand Zones
Volume spikes and breakout strength
Best used on 1m–15m charts.
Open-source for transparency and improvement.
Fibonacci Retracement Engine (DFRE) [PhenLabs]📊 Fibonacci Retracement Engine (DFRE)
Version: PineScript™ v6
📌 Description
Dynamic Fibonacci Retracement Engine (DFRE) is a sophisticated technical analysis tool that automatically detects important swing points and draws precise Fibonacci retracement levels on various timeframes. The intelligent indicator eliminates the subjectivity of manual Fibonacci drawing using intelligent swing detection algorithms combined with multi timeframe confluence analysis.
Built for professional traders who demand accuracy and consistency, DFRE provides real time Fibonacci levels that adapt to modifications in market structure without sacrificing accuracy in changing market conditions. The indicator excels at identifying key support and resistance levels where price action is more likely to react, giving traders a potent edge in entry and exit timing.
🚀 Points of Innovation
Intelligent Swing Detection Algorithm : Advanced pivot detection with customizable confirmation bars and minimum swing percentage thresholds
Multi-Timeframe Confluence Engine : Simultaneous analysis across three timeframes to identify high-probability zones
Dynamic Level Management : Automatically updates and manages multiple Fibonacci sets while maintaining chart clarity
Adaptive Visualization System : Smart labeling that shows only the most relevant levels based on user preferences
Real-Time Confluence Detection : Identifies zones where multiple Fibonacci levels from different timeframes converge
Automated Alert System : Comprehensive notifications for level breakouts and confluence zone formations
🔧 Core Components
Swing Point Detection Engine : Uses pivot high/low calculations with strength confirmation to identify significant market turns
Fibonacci Calculator : Automatically computes standard retracement levels (0.236, 0.382, 0.5, 0.618, 0.786, 0.886) plus extensions (1.272, 1.618)
Multi-Timeframe Security Function : Safely retrieves Fibonacci data from higher timeframes without repainting
Confluence Analysis Module : Mathematically identifies zones where multiple levels cluster within specified thresholds
Dynamic Drawing Management : Efficiently handles line and label creation, updates, and deletion to maintain performance
🔥 Key Features
Customizable Swing Detection : Adjust swing length (3-50 bars) and strength confirmation (1-10 bars) to match your trading style
Selective Level Display : Choose which Fibonacci levels to show, from core levels to full extensions
Multi-Timeframe Analysis : Analyze up to 3 different timeframes simultaneously for confluence identification
Intelligent Labeling System : Options to show main levels only or all levels, with latest-set-only functionality
Visual Customization : Adjustable line width, colors, and extension options for optimal chart clarity
Performance Optimization : Limit maximum Fibonacci sets (1-5) to maintain smooth chart performance
Comprehensive Alerting : Get notified on level breakouts and confluence zone formations
🎨 Visualization
Dynamic Fibonacci Lines : Color-coded lines (green for uptrends, red for downtrends) with customizable width and extension
Smart Level Labels : Precise level identification with both ratio and price values displayed
Confluence Zone Highlighting : Visual emphasis on areas where multiple timeframe levels converge
Clean Chart Management : Automatic cleanup of old drawing objects to prevent chart clutter
Responsive Design : All visual elements adapt to different chart sizes and timeframes
📖 Usage Guidelines
Swing Detection Settings
Swing Detection Length - Default: 25 | Range: 3-50 | Controls the lookback period for identifying pivot points. Lower values detect more frequent swings but may include noise, while higher values focus on major market turns.
Swing Strength (Confirmation Bars) - Default: 2 | Range: 1-10 | Number of bars required to confirm a swing point. Higher values reduce false signals but increase lag.
Minimum Swing % Change - Default: 1.0% | Range: 0.1-10.0% | Minimum percentage change required to register a valid swing. Filters out insignificant price movements.
Fibonacci Level Settings
Individual Level Toggles : Enable/disable specific Fibonacci levels (0.236, 0.382, 0.5, 0.618, 0.786, 0.886)
Extensions : Show projection levels (1.272, 1.618) for target identification
Multi-Timeframe Settings
Timeframe Selection : Choose three higher timeframes for confluence analysis
Confluence Threshold : Percentage tolerance for level clustering (0.5-5.0%)
✅ Best Use Cases
Swing Trading : Identify optimal entry and exit points at key retracement levels
Confluence Trading : Focus on high-probability zones where multiple timeframe levels align
Support/Resistance Trading : Use dynamic levels that adapt to changing market structure
Breakout Trading : Monitor level breaks for momentum continuation signals
Target Setting : Utilize extension levels for profit target placement
⚠️ Limitations
Lagging Nature : Requires confirmed swing points, which means levels appear after significant moves
Market Condition Dependency : Works best in trending markets; less effective in extremely choppy conditions
Multiple Signal Complexity : Multiple timeframe analysis may produce conflicting signals requiring experience to interpret
Performance Considerations : Multiple Fibonacci sets and MTF analysis may impact indicator loading time on slower devices
💡 What Makes This Unique
Automated Precision : Eliminates manual drawing errors and subjective level placement
Multi-Timeframe Intelligence : Combines analysis from multiple timeframes for superior confluence detection
Adaptive Management : Automatically updates and manages multiple Fibonacci sets as market structure evolves
Professional-Grade Alerts : Comprehensive notification system for all significant level interactions
🔬 How It Works
Step 1 - Swing Point Identification : Scans price action using pivot high/low calculations with specified lookback periods, applies confirmation logic to eliminate false signals, and calculates swing strength based on surrounding price action for quality assessment.
Step 2 - Fibonacci Level Calculation : Automatically computes retracement and extension levels between confirmed swing points, creates dynamic level sets that update as new swing points are identified, and maintains multiple active Fibonacci sets for comprehensive market analysis.
Step 3 - Multi-Timeframe Confluence : Retrieves Fibonacci data from higher timeframes using secure request functions, analyzes level clustering across different timeframes within specified thresholds, and identifies high-probability zones where multiple levels converge.
💡 Note: This indicator works best when combined with other technical analysis tools and proper risk management. The multi-timeframe confluence feature provides the highest probability setups, but always confirm signals with additional analysis before entering trades.

Fair Value Gap [Custom]📌 FVG Indicator – Smart Money Concepts Tool
This script is based on Smart Money Concepts (SMC) and automatically detects and marks Fair Value Gaps (FVG) on the chart, helping traders identify unbalanced price areas left behind by institutional moves.
🧠 What is an FVG?
An FVG (Fair Value Gap) is the price gap formed when the market moves rapidly, leaving behind a candle range where no trading occurred — typically between Candle 1’s high and Candle 3’s low (in a three-candle pattern). These gaps often signal imbalance, created during structural breaks or liquidity grabs, and may act as retrace zones or entry points.
🛠 Features:
✅ Automatically detects and highlights FVG zones (high-low range)
✅ Differentiates between open (unfilled) and closed (filled) FVGs
✅ Adjustable timeframe settings (works best on 1H–4H charts)
✅ Option to toggle display of filled FVGs
✅ Great for identifying pullback entries, continuation zones, or reversal setups
💡 Recommended Use:
After BOS/CHoCH, watch for price to return to the FVG for entry
Combine with Order Blocks and liquidity zones for higher accuracy
Best used as part of an ICT or SMC-based trading system

Chaithanya Tattva Volume Zones📜 "Chaitanya Tattva" Volume Zones:-
A Sacred Framework of Supply, Demand & Market Energy
In the world of financial markets, price is said to reflect all information. But the true pulse of the market — its life force, its intent, and its moment of truth — is most vividly expressed not in price itself, but in volume.
Chaitanya Tattva Volume Zones is a spiritually inspired volume-based tool that transforms your chart into a canvas of market consciousness, revealing moments where supply and demand engage in visible energetic spikes. These moments are often disguised as ordinary candles, but with this tool, you uncover zones of intent — footprints left by the market’s deeper intelligence.
🌟 Why “Chaitanya Tattva”?
Chaitanya (चैतन्य) is a Sanskrit word meaning consciousness, awareness, or the spark of life energy. It is that which animates — the subtle intelligence behind all movement.
Tattva (तत्त्व) refers to essence, truth, or the underlying principle of a thing. In classical yogic philosophy, the tattvas are the elemental building blocks of reality.
Together, Chaitanya Tattva represents the conscious essence — the living pulse that animates the market through volume surges and imbalances.
This tool is not just a technical indicator — it is a spiritual observation device that aligns with the rhythm of volume and price action. It doesn't predict the market. It reveals when the market has already spoken — loudly, clearly, and energetically.
📈 What Does the Tool Do?
Chaitanya Tattva Volume Zones identifies exceptional volume spikes within the recent price history and visually marks the areas where market intent has been most active.
Specifically, the tool:
Scans for volume spikes that exceed all the volume of the last N bars (default is 20)
Confirms whether the spike happened on a bullish candle (close > open) or bearish candle (close < open)
For a bullish spike, it marks a Supply Zone — the area between the high and close of the candle
For a bearish spike, it marks a Demand Zone — the area between the low and close
Visually paints these zones with soft translucent boxes (red for supply, green for demand) that extend forward across multiple bars
🧘♂️ The Spiritual Framework
🔴 Supply = "Agni" — The Fire of Expansion
When a bullish candle erupts with historically high volume, it symbolizes the fire (Agni) of market optimism and upward expansion. It means that buyers have absorbed available supply at that level and established dominance — but such fire may also signal exhaustion, making it a potential supply barrier if price returns.
These Supply Zones are areas where:
Sellers are likely to re-engage
Smart money may be unloading
Future resistance can be anticipated
But unlike traditional indicators, this tool doesn’t guess. It reacts only to a clear volume-based event — when market energy surges — and locks in that awareness through zone marking.
🟢 Demand = "Prithvi" — The Grounding of Price
On the other hand, a bearish candle with extremely high volume represents the Earth (Prithvi) — grounding the price with firm hands. A strong volume drop often means buyers are stepping in, absorbing the selling pressure.
These Demand Zones are areas where:
Buying interest is proven
Market memory is stored
Future support can be expected
By respecting these zones, you're aligning your trading with natural market boundaries — not theoretical ones.
🧠 How Is It Different from Regular Volume Tools?
While most volume indicators show bars on a lower panel, they leave interpretation up to the trader. “High” or “low” becomes subjective.
Chaitanya Tattva Volume Zones is different:
It quantifies "spike": a bar must exceed all previous N volumes
It qualifies the intent: was the spike bullish or bearish?
It marks zones on the price chart: no need to guess levels
It preserves market memory: the zones persist visually for easy reference
In essence, this tool doesn’t just report volume — it interprets volume’s context and visually encodes it into the chart.
🧘 How to Use
1. Support/Resistance Mapping
Use the tool to understand where volume proved itself. If price revisits a red zone, expect possible rejection (resistance). If price revisits a green zone, expect possible absorption (support).
2. Entry Triggers
You may enter:
Long near demand zones if bullish confirmation appears
Short near supply zones if bearish confirmation appears
3. Stop Placement
Stops can be placed just beyond the zone boundary to align with areas where smart money historically defended.
4. Breakout Confidence
When price breaks through one of these zones with momentum, it often signals a new energetic wave — the old balance has been overcome.
🔔 Key Features
Volume spike detection across any timeframe
Clear visual zones — no clutter, no lag
Highly customizable: zone width, volume lookback, colors
Philosophy-aligned with supply and demand theory, Wyckoff, and Order Flow
🌌 A Metaphysical View of Volume
In yogic science, volume is akin to Prana — life-force energy. A market is not moved by price alone but by intent, force, and participation — all encoded in volume.
Just as a human body pulses with blood when action intensifies, the market pulses with volume when institutional decisions are made.
These pulses become sacred footprints — and Chaitanya Tattva Volume Zones helps you walk mindfully among them.
🔮 Final Thoughts
In a sea of indicators that shout at you with every tick, Chaitanya Tattva is calm. It speaks only when energy concentrates, only when the market sends a signal born of intent.
It doesn’t predict.
It doesn’t repaint.
It simply shows the truth, when the truth becomes undeniable.
Like a sage that speaks only when needed, it waits for volume to prove itself — then draws a memory into space, a zone where traders can re-align their actions with what the market has already honored.
Use it not just to trade —
But to listen.
To observe.
To follow the Chaitanya — the conscious pulse of the market’s own breath.

Chaikin Money Flow (CMF) [ParadoxAlgo]OVERVIEW
This indicator implements the Chaikin Money Flow oscillator as an overlay on the price chart, designed to help traders identify institutional money flow patterns. The Chaikin Money Flow combines price and volume data to measure the flow of money into and out of a security, making it particularly useful for detecting accumulation and distribution phases.
WHAT IS CHAIKIN MONEY FLOW?
Chaikin Money Flow was developed by Marc Chaikin and measures the amount of Money Flow Volume over a specific period. The indicator oscillates between +1 and -1, where:
Positive values indicate money flowing into the security (accumulation)
Negative values indicate money flowing out of the security (distribution)
Values near zero suggest equilibrium between buying and selling pressure
CALCULATION METHOD
Money Flow Multiplier = ((Close - Low) - (High - Close)) / (High - Low)
Money Flow Volume = Money Flow Multiplier × Volume
CMF = Sum of Money Flow Volume over N periods / Sum of Volume over N periods
KEY FEATURES
Big Money Detection:
Identifies significant institutional activity when CMF exceeds user-defined thresholds
Requires volume confirmation (volume above average) to validate signals
Uses battery icon (🔋) for institutional buying and lightning icon (⚡) for institutional selling
Visual Elements:
Background coloring based on money flow direction
Support and resistance levels calculated using Average True Range
Real-time dashboard showing current CMF value, volume strength, and signal status
Customizable Parameters:
CMF Period: Calculation period for the money flow (default: 20)
Signal Smoothing: EMA smoothing applied to reduce noise (default: 5)
Big Money Threshold: CMF level required to trigger institutional signals (default: 0.15)
Volume Threshold: Volume multiplier required for signal confirmation (default: 1.5x)
INTERPRETATION
Signal Types:
🔋 (Battery): Indicates strong institutional buying when CMF > threshold with high volume
⚡ (Lightning): Indicates strong institutional selling when CMF < -threshold with high volume
Background color: Green tint for positive money flow, red tint for negative money flow
Dashboard Information:
CMF Value: Current Chaikin Money Flow reading
Volume: Current volume as a multiple of 20-period average
Big Money: Status of institutional activity (BUYING/SELLING/QUIET)
Signal: Strength assessment (STRONG/MEDIUM/WEAK)
TRADING APPLICATIONS
Trend Confirmation: Use CMF direction to confirm price trends
Divergence Analysis: Look for divergences between price and money flow
Volume Validation: Confirm breakouts with corresponding money flow
Accumulation/Distribution: Identify phases of institutional activity
PARAMETER RECOMMENDATIONS
Day Trading: CMF Period 14-21, higher sensitivity settings
Swing Trading: CMF Period 20-30, moderate sensitivity
Position Trading: CMF Period 30-50, lower sensitivity for major trends
ALERTS
Optional alert system notifies users when:
Big money buying is detected (CMF above threshold with volume confirmation)
Big money selling is detected (CMF below negative threshold with volume confirmation)
LIMITATIONS
May generate false signals in low-volume conditions
Best used in conjunction with other technical analysis tools
Effectiveness varies across different market conditions and timeframes
EDUCATIONAL PURPOSE
This open-source indicator is provided for educational purposes to help traders understand money flow analysis. It demonstrates the practical application of the Chaikin Money Flow concept with visual enhancements for easier interpretation.
TECHNICAL SPECIFICATIONS
Overlay indicator (displays on price chart)
No repainting - all calculations are based on closed bar data
Suitable for all timeframes and asset classes
Minimal resource usage for optimal performance
DISCLAIMER
This indicator is for educational and informational purposes only. Past performance does not guarantee future results. Always conduct your own analysis and consider risk management before making trading decisions.

TPO[Fixed Range, Anchored, Bars Back]TPO Bars Back, Fixed Range and Anchored
Overview
The TPO Profile (Time Price Opportunity Profile) is a powerful market profile indicator that displays the amount of time price spent at different levels during a specified period. Unlike traditional volume profile indicators that show volume distribution, TPO Profile shows time distribution , providing insights into where price has spent the most time and identifying key support and resistance levels.
Key Advantages Over TradingView's Built-in TPO
Simplified Composite Creation : Automatically creates TPO profiles for any time range without manual split/merge operations
Instant Value Area Calculation : Immediately shows Value Area, POC, VAH, and VAL for your selected period
No Manual Assembly Required : TradingView's native TPO requires you to manually split sessions and merge them to create composites - this indicator does it automatically
Flexible Time Ranges : Create composites for any custom time period (multiple days, weeks, specific events) with a few clicks
Real-time Composite Updates : Anchor mode creates live composites that update as new data arrives
Multiple Composite Analysis : Easily compare different time periods without the tedious manual process
Key Features
Core Functionality
Time-Based Analysis : Shows time spent at each price level rather than volume
Configurable Time Blocks : Use any timeframe for TPO counting (30min, 1H, 4H, etc.)
Multiple Price Levels : Adjustable from 5 to 200 levels for granular analysis
Point of Control (POC) : Automatically identifies the price level with highest time activity
Value Area Calculation : Shows the price range containing 70% (configurable) of time activity
Automatic Composite Generation : Creates multi-session composites without manual intervention
Three Operating Modes
1. Bars Back Mode
Analyzes the last N bars from the current bar
Perfect for recent market activity analysis
Range: 10-500 bars
Use Case : Intraday analysis, recent session review
2. Fixed Range Mode
Analyzes a specific time period between start and end times
Ideal for historical analysis of specific events
Creates perfect composites for multi-day periods
Use Case : Earnings periods, news events, specific trading sessions, weekly/monthly composites
3. Anchor Mode (NEW)
Starts from a specific time and extends to the current bar
Dynamically updates as new bars form
Perfect for building live composites from any starting point
Use Case : Live session monitoring, event-based analysis from a specific point, growing composites
Visual Elements
TPO Bars
Horizontal bars showing time distribution at each price level
Longer bars = more time spent at that level
Color-coded to distinguish Value Area from outlying levels
Point of Control (POC)
Red line marking the price level with highest time activity
Most significant support/resistance level
Configurable line style (Solid/Dashed/Dotted) and width
Value Area High/Low (VAH/VAL)
Green and Orange lines marking the boundaries of the Value Area
Shows the price range containing the specified percentage of time activity
Optional display with customizable line styles
Single Print Detection
Identifies price levels touched by only one time block
Display options: Lines or Boxes
Purple color highlighting these significant levels
Often act as strong support/resistance in future trading
Customization Options
Time Block Configuration
Block Time : Choose timeframe for TPO counting (30min, 1H, 4H, etc.)
Allows analysis at different time granularities
Higher timeframes = broader perspective, Lower timeframes = finer detail
Visual Styling
Line Styles : Solid, Dashed, or Dotted for all line elements
Line Widths : 1-5 pixels for POC, VAH, and VAL lines
Colors : Fully customizable colors for all elements
Transparency : Adjustable transparency for better chart readability
Label Management
Show/Hide Labels : Toggle POC, VAH, VAL labels
Font Sizes : Tiny, Small, Normal, Large, Huge
Label Positioning : 8 different position options relative to lines
Offset Controls : Fine-tune label positioning
Line Extension
Level Offset Right : Controls how far lines extend
Smart extension logic:
Value ≤ 0: Infinite extension (extend.right)
Value ≥ 1: Extends exactly N bars ahead
Trading Applications
Support & Resistance
POC often acts as strong support/resistance
Value Area boundaries provide key levels
Single prints frequently become significant levels
Market Structure Analysis
Identify areas of price acceptance (thick TPO bars)
Spot areas of price rejection (thin TPO bars)
Understand where market participants are comfortable trading
Composite Profile Analysis
Create multi-day, weekly, or monthly composites instantly
Compare different composite periods without manual work
Analyze longer-term price acceptance levels
Build composites around specific events or announcements
Session Analysis
Monitor intraday session development in real-time
Compare different sessions (London, New York, Asia)
Track how profiles change throughout the trading day
Build live composites across multiple sessions
Event Analysis
Use Fixed Range mode for earnings, news events
Use Anchor mode to track price development from specific events
Compare pre/post event price acceptance levels
Create event-based composites automatically
Input Parameters
Mode Selection
Mode : Bars Back | Fixed Range | Anchor
Bars Back : Number of bars to analyze (10-500)
Start Time : Beginning time for Fixed Range and Anchor modes
End Time : Ending time for Fixed Range mode only
Analysis Configuration
Block Time : Timeframe for TPO blocks (e.g., "30" for 30-minute blocks)
TPO Levels : Number of price levels (5-200)
Value Area % : Percentage for Value Area calculation (50-95%)
Display Options
Show POC : Display Point of Control line
Show Value Area : Display Value Area box
Show VAH/VAL Lines : Display Value Area boundary lines
Show Single Prints : Display single print detection
Single Print Style : Lines or Boxes
Styling Controls
Colors : TPO, POC, Value Area, VAH, VAL, Single Print colors
Line Styles : POC, VAH, VAL line styles
Line Widths : POC, VAH, VAL line widths
Labels : Show/hide, font size, position, offset controls
Technical Details
Calculation Method
Divides the price range into equal levels based on TPO Levels setting
For each time block, determines which price levels it crosses
Adds +1 count to each crossed level
Identifies POC as the level with highest count
Calculates Value Area by expanding from POC until target percentage is reached
Performance Considerations
Historical data limited to prevent buffer overflow errors
Smart bounds checking for different timeframes
Optimized cleanup routines to prevent drawing object accumulation
Pine Script Version
Built on Pine Script v6
Uses modern Pine Script best practices
Efficient array handling and drawing object management
Best Practices
Timeframe Selection
Block Time = Chart Timeframe : Traditional TPO approach
Block Time > Chart Timeframe : Smoother, broader perspective
Block Time < Chart Timeframe : More granular, detailed analysis
Level Count Guidelines
Low levels (10-20) : Better for swing trading, major levels
High levels (50-100) : Better for scalping, precise entries
Very high levels (100+) : For very detailed analysis
Mode Selection
Bars Back : Daily analysis, recent activity
Fixed Range : Historical events, specific periods, manual composites
Anchor : Live monitoring, event-based analysis, growing composites
Composite Creation Workflow
Select Fixed Range or Anchor mode
Set your desired start time (and end time for Fixed Range)
Adjust TPO Levels for desired granularity
Enable VAH/VAL lines to see Value Area boundaries
The composite profile generates automatically with all key levels
This indicator eliminates the tedious manual process of creating composite TPO profiles in TradingView. Instead of splitting sessions and manually merging them, you get instant composite analysis with automatic Value Area calculation, POC identification, and single print detection. The combination of time-based analysis, multiple operating modes, and extensive customization options makes it a powerful tool for understanding market structure and price acceptance levels across any time period.

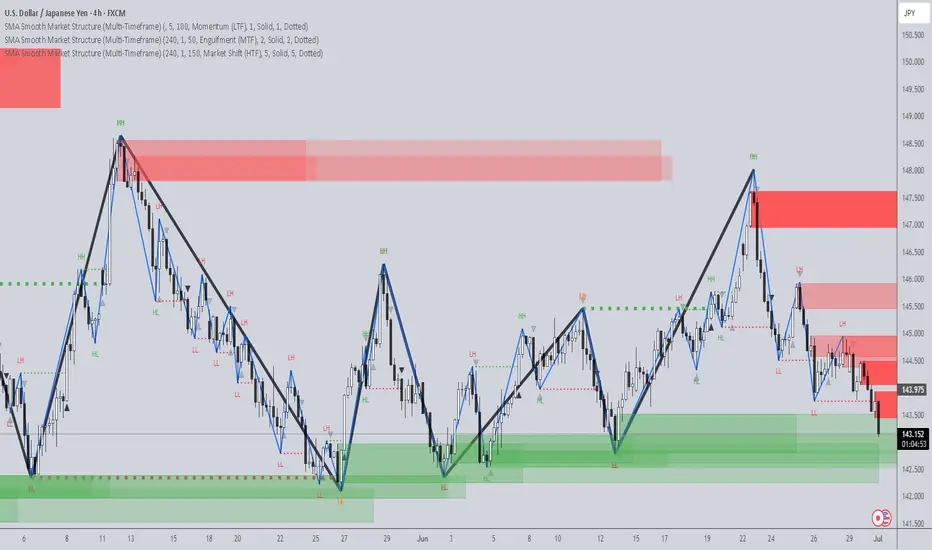
SMA Smooth Market Structure (Multi-Timeframe)SMA Market Structure (Multi-Timeframe) is a powerful tool for tracking structural price action, using simple moving averages across any higher timeframe (HTF). It blends Smart Money Concepts with clean swing logic to reveal trend shifts, breaks of structure, and supply/demand zones.
This indicator highlights key structure features:
• Break of Structure (BOS) – Automatic detection of bullish or bearish swing breaks
• Internal Shifts – Early clues that the market is building toward a reversal
• Liquidity Sweeps (LS) – Detects swing failures that may trap traders
• Zigzag Swing Lines – Cleanly connects swing highs and lows
• Dynamic Zones – Demand (green) and supply (red) blocks drawn from engulfing breakouts
How to Use:
• Set your preferred HTF (e.g. 1H on a 15m chart) to view structure in proper context and
adjust SMA to smooth out market structure for directional consistency
• Watch BOS lines and swing labels like HH, HL, LH, LL for directional clarity
• Use the MS (Market Shift) label to identify full reversals after internal shifts + BOS
• Demand/Supply zones mark areas of previous strength and will update or mitigate automatically
• Alerts notify you of every BOS, MS, HH, LL, and LS event — no need to monitor manually
Customization Features:
• Toggle visibility of market shift markers, internal shifts, and zones
• Choose how internal shifts are calculated (High/Low or Open)
• Customize line style, width, and colors for BOS and zigzag lines
• Control zone duration and how mitigated zones behave (fade or delete)
• Built-in safety for Pine Script’s history limits using smart offset caps
Best Use Tips:
• Combine with price action patterns or volume for confirmation
• MS + BOS + zone tap often marks a high-probability reversal setup
• Use it to align lower timeframe entries with higher timeframe structure
For traders who want structure clarity without clutter, this tool is built to keep your chart actionable and adaptive.
The Sequences of FibonacciThe Sequences of Fibonacci - Advanced Multi-Timeframe Confluence Analysis System
THEORETICAL FOUNDATION & MATHEMATICAL INNOVATION
The Sequences of Fibonacci represents a revolutionary approach to market analysis that synthesizes classical Fibonacci mathematics with modern adaptive signal processing. This indicator transcends traditional Fibonacci retracement tools by implementing a sophisticated multi-dimensional confluence detection system that reveals hidden market structure through mathematical precision.
Core Mathematical Framework
Dynamic Fibonacci Grid System:
Unlike static Fibonacci tools, this system calculates highest highs and lowest lows across true Fibonacci sequence periods (8, 13, 21, 34, 55 bars) creating a dynamic grid of mathematical support and resistance levels that adapt to market structure in real-time.
Multi-Dimensional Confluence Detection:
The engine employs advanced mathematical clustering algorithms to identify areas where multiple derived Fibonacci retracement levels (0.382, 0.500, 0.618) from different timeframe perspectives converge. These "Confluence Zones" are mathematically classified by strength:
- CRITICAL Zones: 8+ converging Fibonacci levels
- HIGH Zones: 6-7 converging levels
- MEDIUM Zones: 4-5 converging levels
- LOW Zones: 3+ converging levels
Adaptive Signal Processing Architecture:
The system implements adaptive Stochastic RSI calculations with dynamic overbought/oversold levels that adjust to recent market volatility rather than using fixed thresholds. This prevents false signals during changing market conditions.
COMPREHENSIVE FEATURE ARCHITECTURE
Quantum Field Visualization System
Dynamic Price Field Mathematics:
The Quantum Field creates adaptive price channels based on EMA center points and ATR-based amplitude calculations, influenced by the Unified Field metric. This visualization system helps traders understand:
- Expected price volatility ranges
- Potential overextension zones
- Mathematical pressure points in market structure
- Dynamic support/resistance boundaries
Field Amplitude Calculation:
Field Amplitude = ATR × (1 + |Unified Field| / 10)
The system generates three quantum levels:
- Q⁰ Level: 0.618 × Field Amplitude (Primary channel)
- Q¹ Level: 1.0 × Field Amplitude (Secondary boundary)
- Q² Level: 1.618 × Field Amplitude (Extreme extension)
Advanced Market Analysis Dashboard
Unified Field Analysis:
A composite metric combining:
- Price momentum (40% weighting)
- Volume momentum (30% weighting)
- Trend strength (30% weighting)
Market Resonance Calculation:
Measures price-volume correlation over 14 periods to identify harmony between price action and volume participation.
Signal Quality Assessment:
Synthesizes Unified Field, Market Resonance, and RSI positioning to provide real-time evaluation of setup potential.
Tiered Signal Generation Logic
Tier 1 Signals (Highest Conviction):
Require ALL conditions:
- Adaptive StochRSI setup (exiting dynamic OB/OS levels)
- Classic StochRSI divergence confirmation
- Strong reversal bar pattern (adaptive ATR-based sizing)
- Level rejection from Confluence Zone or Fibonacci level
- Supportive Unified Field context
Tier 2 Signals (Enhanced Opportunity Detection):
Generated when Tier 1 conditions aren't met but exceptional circumstances exist:
- Divergence candidate patterns (relaxed divergence requirements)
- Exceptionally strong reversal bars at critical levels
- Enhanced level rejection criteria
- Maintained context filtering
Intelligent Visualization Features
Fractal Matrix Grid:
Multi-layer visualization system displaying:
- Shadow Layer: Foundational support (width 5)
- Glow Layer: Core identification (width 3, white)
- Quantum Layer: Mathematical overlay (width 1, dotted)
Smart Labeling System:
Prevents overlap using ATR-based minimum spacing while providing:
- Fibonacci period identification
- Topological complexity classification (0, I, II, III)
- Exact price levels
- Strength indicators (○ ◐ ● ⚡)
Wick Pressure Analysis:
Dynamic visualization showing momentum direction through:
- Multi-beam projection lines
- Particle density effects
- Progressive transparency for natural flow
- Strength-based sizing adaptation
PRACTICAL TRADING IMPLEMENTATION
Signal Interpretation Framework
Entry Protocol:
1. Confluence Zone Approach: Monitor price approaching High/Critical confluence zones
2. Adaptive Setup Confirmation: Wait for StochRSI to exit adaptive OB/OS levels
3. Divergence Verification: Confirm classic or candidate divergence patterns
4. Reversal Bar Assessment: Validate strong rejection using adaptive ATR criteria
5. Context Evaluation: Ensure Unified Field provides supportive environment
Risk Management Integration:
- Stop Placement: Beyond rejected confluence zone or Fibonacci level
- Position Sizing: Based on signal tier and confluence strength
- Profit Targets: Next significant confluence zone or quantum field boundary
Adaptive Parameter System
Dynamic StochRSI Levels:
Unlike fixed 80/20 levels, the system calculates adaptive OB/OS based on recent StochRSI range:
- Adaptive OB: Recent minimum + (range × OB percentile)
- Adaptive OS: Recent minimum + (range × OS percentile)
- Lookback Period: Configurable 20-100 bars for range calculation
Intelligent ATR Adaptation:
Bar size requirements adjust to market volatility:
- High Volatility: Reduced multiplier (bars naturally larger)
- Low Volatility: Increased multiplier (ensuring significance)
- Base Multiplier: 0.6× ATR with adaptive scaling
Optimization Guidelines
Timeframe-Specific Settings:
Scalping (1-5 minutes):
- Fibonacci Rejection Sensitivity: 0.3-0.8
- Confluence Threshold: 2-3 levels
- StochRSI Lookback: 20-30 bars
Day Trading (15min-1H):
- Fibonacci Rejection Sensitivity: 0.5-1.2
- Confluence Threshold: 3-4 levels
- StochRSI Lookback: 40-60 bars
Swing Trading (4H-1D):
- Fibonacci Rejection Sensitivity: 1.0-2.0
- Confluence Threshold: 4-5 levels
- StochRSI Lookback: 60-80 bars
Asset-Specific Optimization:
Cryptocurrency:
- Higher rejection sensitivity (1.0-2.5) for volatile conditions
- Enable Tier 2 signals for increased opportunity detection
- Shorter adaptive lookbacks for rapid market changes
Forex Major Pairs:
- Moderate sensitivity (0.8-1.5) for stable trending
- Focus on Higher/Critical confluence zones
- Longer lookbacks for institutional flow detection
Stock Indices:
- Conservative sensitivity (0.5-1.0) for institutional participation
- Standard confluence thresholds
- Balanced adaptive parameters
IMPORTANT USAGE CONSIDERATIONS
Realistic Performance Expectations
This indicator provides probabilistic advantages based on mathematical confluence analysis, not guaranteed outcomes. Signal quality varies with market conditions, and proper risk management remains essential regardless of signal tier.
Understanding Adaptive Features:
- Adaptive parameters react to historical data, not future market conditions
- Dynamic levels adjust to past volatility patterns
- Signal quality reflects mathematical alignment probability, not certainty
Market Context Awareness:
- Strong trending markets may produce fewer reversal signals
- Range-bound conditions typically generate more confluence opportunities
- News events and fundamental factors can override technical analysis
Educational Value
Mathematical Concepts Introduced:
- Multi-dimensional confluence analysis
- Adaptive signal processing techniques
- Dynamic parameter optimization
- Mathematical field theory applications in trading
- Advanced Fibonacci sequence applications
Skill Development Benefits:
- Understanding market structure through mathematical lens
- Recognition of multi-timeframe confluence principles
- Appreciation for adaptive vs. static analysis methods
- Integration of classical Fibonacci with modern signal processing
UNIQUE INNOVATIONS
First-Ever Implementations
1. True Fibonacci Sequence Periods: First indicator using authentic Fibonacci numbers (8,13,21,34,55) for timeframe analysis
2. Mathematical Confluence Clustering: Advanced algorithm identifying true Fibonacci level convergence
3. Adaptive StochRSI Boundaries: Dynamic OB/OS levels replacing fixed thresholds
4. Tiered Signal Architecture: Democratic signal weighting with quality classification
5. Quantum Field Price Visualization: Mathematical field representation of price dynamics
Visualization Breakthroughs
- Multi-Layer Fibonacci Grid: Three-layer rendering with intelligent spacing
- Dynamic Confluence Zones: Strength-based color coding and sizing
- Adaptive Parameter Display: Real-time visualization of dynamic calculations
- Mathematical Field Effects: Quantum-inspired price channel visualization
- Progressive Transparency Systems: Natural visual flow without chart clutter
COMPREHENSIVE DASHBOARD SYSTEM
Multi-Size Display Options
Small Dashboard: Core metrics for mobile/limited screen space
Normal Dashboard: Balanced information density for standard desktop use
Large Dashboard: Complete analysis suite including adaptive parameter values
Real-Time Metrics Tracking
Market Analysis Section:
- Unified Field strength with visual meter
- Market Resonance percentage
- Signal Quality assessment with emoji indicators
- Market Bias classification (Bullish/Bearish/Neutral)
Confluence Intelligence:
- Total active zones count
- High/Critical zone identification
- Nearest zone distance and strength
- Price-to-zone ATR measurement
Adaptive Parameters (Large Dashboard):
- Current StochRSI OB/OS levels
- Active ATR multiplier for bar sizing
- Volatility ratio for adaptive scaling
- Real-time StochRSI positioning
TECHNICAL SPECIFICATIONS
Pine Script Version: v5 (Latest)
Calculation Method: Real-time with confirmed bar processing
Maximum Objects: 500 boxes, 500 lines, 500 labels
Dashboard Positions: 4 corner options with size selection
Visual Themes: Quantum, Holographic, Crystalline, Plasma
Alert Integration: Complete alert system for all signal types
Performance Optimizations:
- Efficient confluence zone calculation using advanced clustering
- Smart label spacing prevents overlap
- Progressive transparency for visual clarity
- Memory-optimized array management
EDUCATIONAL FRAMEWORK
Learning Progression
Beginner Level:
- Understanding Fibonacci sequence applications
- Recognition of confluence zone concepts
- Basic signal interpretation
- Dashboard metric comprehension
Intermediate Level:
- Adaptive parameter optimization
- Multi-timeframe confluence analysis
- Signal quality assessment techniques
- Risk management integration
Advanced Level:
- Mathematical field theory applications
- Custom parameter optimization strategies
- Market regime adaptation techniques
- Professional trading system integration
DEVELOPMENT ACKNOWLEDGMENT
Special acknowledgment to @AlgoTrader90 - the foundational concepts of this system came from him and we developed it through a collaborative discussions about multi-timeframe Fibonacci analysis. While the original framework came from AlgoTrader90's innovative approach, this implementation represents a complete evolution of the logic with enhanced mathematical precision, adaptive parameters, and sophisticated signal filtering to deliver meaningful, actionable trading signals.
CONCLUSION
The Sequences of Fibonacci represents a quantum leap in technical analysis, successfully merging classical Fibonacci mathematics with cutting-edge adaptive signal processing. Through sophisticated confluence detection, intelligent parameter adaptation, and comprehensive market analysis, this system provides traders with unprecedented insight into market structure and potential reversal points.
The mathematical foundation ensures lasting relevance while the adaptive features maintain effectiveness across changing market conditions. From the dynamic Fibonacci grid to the quantum field visualization, every component reflects a commitment to mathematical precision, visual elegance, and practical utility.
Whether you're a beginner seeking to understand market confluence or an advanced trader requiring sophisticated analytical tools, this system provides the mathematical framework for informed decision-making based on time-tested Fibonacci principles enhanced with modern computational techniques.
Trade with mathematical precision. Trade with the power of confluence. Trade with The Sequences of Fibonacci.
"Mathematics is the language with which God has written the universe. In markets, Fibonacci sequences reveal the hidden harmonies that govern price movement, and those who understand these mathematical relationships hold the key to anticipating market behavior."
* Galileo Galilei (adapted for modern markets)
— Dskyz, Trade with insight. Trade with anticipation.

Watermark Clarity V33🌟 Introducing Watermark Clarity V33 – Banner 🌟
Watermark Clarity V33 is a visual utility tool designed to enhance chart awareness, focus, and clean aesthetics without adding market noise. Unlike traditional indicators, this script does not generate buy/sell signals or perform technical analysis. Instead, it provides a customizable on-chart watermark banner that clearly communicates your current mindset, risk awareness, or trading bias directly on the chart — helping traders stay aligned with their pre-defined plans and reducing impulsive behavior.
Whether you’re a discretionary trader, scalper, or swing trader, Watermark Clarity V33 offers an adaptive display that blends clarity with minimalism, keeping your chart clean while remaining informative.
🛠 Customizable Parameters
• Dual Text Banners: Configure two independent headers to reflect trading goals, risk posture, or emotional cues.
• Smart Animation Toggle: Optionally animate between messages to help reinforce shifting market awareness or draw attention during high-alert periods.
• Size, Color & Positioning: Adjust the info box’s text size, banner dimensions, background color, transparency, and placement (top/middle/bottom – left/center/right).
• Transparent Mode: Switch to semi-transparent mode for cleaner overlays during live sessions or screen recording.
🚀 New Feature – Custom Alerts & Smart Animation Control
• Market-Aware Animation Logic:
When Enable Animation is turned on and both Heading 1 and Heading 2 are filled:
• 📈 During Market Hours → The banner alternates smoothly between both headings, helping maintain awareness and visual engagement.
• 💤 Outside Market Hours → The banner remains fixed on Heading 1. This acts as a subtle visual cue that markets are currently closed — giving you peace of mind and a cleaner screen.
✨ Visual Utility Use Cases
• Accountability Layer: Keep yourself accountable to your trading rules or session checklist.
• Mindset Anchor: Display motivational or tactical reminders that guide your trading behavior.
• Multi-Timeframe Syncing: Use different watermarks across charts to stay aligned across timeframes or instruments.
📘 How to Use
1. Add the Indicator: Apply “Watermark Clarity V33 – Banner” to your chart.
2. Configure Inputs: Adjust the banner texts, size, color scheme, and screen position to your liking.
4. Focus & Trade: Let the visual cue support your decision-making environment without interfering with price action.
❗ Important Notes
• This indicator does not analyze price data or generate signals. It is designed solely for visual clarity and trader discipline support.
• All display logic runs in real-time and responds to your settings only, no repainting or lookahead bias.

ICT SMT Divergence Lines - EnhancedThis indicator identifies and highlights Smart Money Technique (SMT) divergence between two user-selected symbols across any timeframe. It compares the last two completed candles of both symbols and marks potential SMT signals only when market context aligns with smart money principles.
⚡ Key Features
✅ SMT Bullish Signal
Symbol 1 forms a lower low compared to its prior candle.
Symbol 2 forms a higher low compared to its prior candle.
The previous candle on the chart was bearish (close < open).
✅ SMT Bearish Signal
Symbol 1 forms a higher high compared to its prior candle.
Symbol 2 forms a lower high compared to its prior candle.
The previous candle on the chart was bullish (close > open).
✅ Visual Representation
Draws a clean, subtle line between the two SMT candles — green for bullish SMT and red for bearish SMT — making divergence easy to spot.
Optional small triangle markers above or below the bar where SMT is detected.
Old lines are automatically removed to keep the chart uncluttered.
✅ Multi-timeframe compatible
Works on any chart timeframe.
Compares the last two completed candles in the current chart timeframe, or can be adapted for a fixed higher timeframe.

Trend Flow Trail [AlgoAlpha]OVERVIEW
This script overlays a custom hybrid indicator called the Money Flow Trail which combines a volatility-based trend-following trail with a volume-weighted momentum oscillator. It’s built around two core components: the AlphaTrail—a dynamic band system influenced by Hull MA and volatility—and a smoothed Money Flow Index (MFI) that provides insights into buying or selling pressure. Together, these tools are used to color bars, generate potential reversal markers, and assist traders in identifying trend continuation or exhaustion phases in any market or timeframe.
CONCEPTS
The AlphaTrail calculates a volatility-adjusted channel around price using the Hull Moving Average as the base and an EMA of range as the spread. It adaptively shifts based on price interaction to capture trend reversals while avoiding whipsaws. The direction (bullish or bearish) determines both the band being tracked and how the trail locks in. The Money Flow Index (MFI) is derived from hlc3 and volume, measuring buying vs selling pressure, and is further smoothed with a short Hull MA to reduce noise while preserving structure. These two systems work in tandem: AlphaTrail governs directional context, while MFI refines the timing.
FEATURES
Dynamic AlphaTrail line with regime switching logic that controls directional bias and bar coloring.
Smoothed MFI with gradient coloring to visually communicate pressure and exhaustion levels.
Overbought/oversold thresholds (80/20), mid-level (50), and custom extreme zones (90/10) for deeper signal granularity.
Built-in take-profit signal logic: crossover of MFI into overbought with bullish AlphaTrail, or into oversold with bearish AlphaTrail.
Visual fills between price and AlphaTrail for clearer confirmation during trend phases.
Alerts for regime shifts, MFI crossovers, trail interactions, and bar color regime changes.
USAGE
Add the indicator to any chart. Use the AlphaTrail plot to define trend context: bullish (trailing below price) or bearish (trailing above). MFI values give supporting confirmation—favor long setups when MFI is rising and above 50 in a bullish regime, and shorts when MFI is falling and below 50 in a bearish regime. The colored fills help visually track strength; sharp changes in MFI crossing 80/20 or 90/10 zones often precede pullbacks or reversals. Use the plotted circles as optional take-profit signals when MFI and trend are extended. Adjust AlphaTrail length/multiplier and MFI smoothing to better match the asset’s volatility profile.

PriceLevels GBGoldbach Price Levels – Identify Algorithmic Key Zones
This open-source indicator is designed to help traders identify potential algorithmic key zones by highlighting price levels ending with specific numbers such as 03, 11, 29, 35, 65, and 71. These levels may act as inflection points or hesitation areas based on observed behavioral patterns in price movement.
What It Does:
📌 Scans and plots horizontal price levels where the price ends with one of the selected number combinations
🎯 Toggle on/off visibility for each number ending
🎨 Customize color and thickness for each level
🏷️ Shows price labels at the end of each line
🌗 Label styles (color/transparency) are adjustable for both dark and light chart themes
🧠 Why Use It:
This tool is ideal for discretionary traders who study market structure through static price anchors. It provides a visual reference for recurring numerical levels that may be used in algorithmic trading models or serve as psychological price zones.
⚠️ Disclaimer:
This script is open-source and intended for educational and analytical purposes only. No trading signals or performance guarantees are provided. Please use your own judgment when applying this tool in a trading context.

[Smith] VWAP Deviation + VWAP Deviation +
Short Description:
Advanced VWAP indicator with deviation bands, smart signal filtering, and session-based performance tracking. Features log-space scaling, RSI confirmation, volume filters, and market regime detection.
Full Description:
The VWAP Deviation + is a comprehensive trading indicator that combines Volume Weighted Average Price (VWAP) analysis with advanced signal filtering to identify high-probability trade opportunities. This indicator goes beyond basic VWAP by incorporating multiple confirmation layers and intelligent market analysis.
🎯 Key Features
Core VWAP Analysis:
- Custom volume-weighted mean calculation with deviation bands (2σ and 3σ)
- Optional log-space scaling for proportional price movements
- Real-time VWAP line with customizable visibility
Smart Signal Detection:
- RSI confirmation for all trade signals
- Volume filter requiring above-average trading activity
- Market regime detection (trending vs ranging markets)
- Optional RSI divergence analysis
Advanced Filtering:
- Multi-condition signal validation
- Session-based performance tracking (Asian, London, NY)
- Real-time win rate calculation
- Strong vs regular signal classification
Visual Features:
- Clean, professional interface with customizable colors
- Optional signal shapes and annotations
- Performance statistics table
- Filled deviation bands for easy visualization
📊 How It Works
The indicator identifies trade opportunities when:
1. Price touches VWAP deviation bands (2σ or 3σ)
2. RSI confirms oversold/overbought conditions
3. Volume exceeds the specified threshold
4. Market regime conditions are favorable
Signal Types:
- LONG : Price at lower bands + RSI oversold + volume confirmation
- SHORT : Price at upper bands + RSI overbought + volume confirmation
- STRONG : Same conditions but at 3σ bands for higher conviction trades
⚙️ Customization Options
Core Settings:
- VWAP length and source selection
- Adjustable deviation multipliers
- Log-space scaling toggle
Signal Filters:
- RSI length and threshold levels
- Volume filter with customizable multiplier
- Market type filtering options
Advanced Features:
- Session statistics tracking
- RSI divergence detection
- Market regime analysis
Visual Controls:
- Show/hide individual components
- Custom color schemes
- Signal display toggles
🔔 Alert System
Built-in alerts for:
- Long and short trade opportunities
- Strong signal confirmations
- RSI divergence signals
💡 Best Practices
- Use higher timeframes (15m+) for more reliable signals
- Combine with additional confirmation indicators
- Pay attention to session statistics for timing optimization
- Monitor market regime indicators for context
This indicator is suitable for day traders, swing traders, and anyone looking to improve their VWAP-based trading strategies with advanced filtering and market analysis.

SPX Weekly Expected Moves# SPX Weekly Expected Moves Indicator
A professional Pine Script indicator for TradingView that displays weekly expected move levels for SPX based on real options data, with integrated Fibonacci retracement analysis and intelligent alerting system.
## Overview
This indicator helps options and equity traders visualize weekly expected move ranges for the S&P 500 Index (SPX) by plotting historical and current week expected move boundaries derived from weekly options pricing. Unlike theoretical volatility calculations, this indicator uses actual market-based expected move data that you provide from options platforms.
## Key Features
### 📈 **Expected Move Visualization**
- **Historical Lines**: Display past weeks' expected moves with configurable history (10, 26, or 52 weeks)
- **Current Week Focus**: Highlighted current week with extended lines to present time
- **Friday Close Reference**: Orange baseline showing the previous Friday's close price
- **Timeframe Independent**: Works consistently across all chart timeframes (1m to 1D)
### 🎯 **Fibonacci Integration**
- **Five Fibonacci Levels**: 23.6%, 38.2%, 50%, 61.8%, 76.4% between Friday close and expected move boundaries
- **Color-Coded Levels**:
- Red: 23.6% & 76.4% (outer levels)
- Blue: 38.2% & 61.8% (golden ratio levels)
- Black: 50% (midpoint - most critical level)
- **Current Week Only**: Fibonacci levels shown only for active trading week to reduce clutter
### 📊 **Real-Time Information Table**
- **Current SPX Price**: Live market price
- **Expected Move**: ±EM value for current week
- **Previous Close**: Friday close price (baseline for calculations)
- **100% EM Levels**: Exact upper and lower boundary prices
- **Current Location**: Real-time position within the EM structure (e.g., "Above 38.2% Fib (upper zone)")
### 🚨 **Intelligent Alert System**
- **Zone-Aware Alerts**: Separate alerts for upper and lower zones
- **Key Level Breaches**: Alerts for 23.6% and 76.4% Fibonacci level crossings
- **Bar Close Based**: Alerts trigger on confirmed bar closes, not tick-by-tick
- **Customizable**: Enable/disable alerts through settings
## How It Works
### Data Input Method
The indicator uses a **manual data entry approach** where you input actual expected move values obtained from options platforms:
```pinescript
// Add entries using the options expiration Friday date
map.put(expected_moves, 20250613, 91.244) // Week ending June 13, 2025
map.put(expected_moves, 20250620, 95.150) // Week ending June 20, 2025
```
### Weekly Structure
- **Monday 9:30 AM ET**: Week begins
- **Friday 4:00 PM ET**: Week ends
- **Lines Extend**: From Monday open to Friday close (historical) or current time + 5 bars (current week)
- **Timezone Handling**: Uses "America/New_York" for proper DST handling
### Calculation Logic
1. **Base Price**: Previous Friday's SPX close price
2. **Expected Move**: Market-derived ±EM value from weekly options
3. **Upper Boundary**: Friday Close + Expected Move
4. **Lower Boundary**: Friday Close - Expected Move
5. **Fibonacci Levels**: Proportional levels between Friday close and EM boundaries
## Setup Instructions
### 1. Data Collection
Obtain weekly expected move values from options platforms such as:
- **ThinkOrSwim**: Use thinkBack feature to look up weekly expected moves
- **Tastyworks**: Check weekly options expected move data
- **CBOE**: Reference SPX weekly options data
- **Manual Calculation**: (ATM Call Premium + ATM Put Premium) × 0.85
### 2. Data Entry
After each Friday close, update the indicator with the next week's expected move:
```pinescript
// Example: On Friday June 7, 2025, add data for week ending June 13
map.put(expected_moves, 20250613, 91.244) // Actual EM value from your platform
```
### 3. Configuration
Customize the indicator through the settings panel:
#### Visual Settings
- **Show Current Week EM**: Toggle current week display
- **Show Past Weeks**: Toggle historical weeks display
- **Max Weeks History**: Choose 10, 26, or 52 weeks of history
- **Show Fibonacci Levels**: Toggle Fibonacci retracement levels
- **Label Controls**: Customize which labels to display
#### Colors
- **Current Week EM**: Default yellow for active week
- **Past Weeks EM**: Default gray for historical weeks
- **Friday Close**: Default orange for baseline
- **Fibonacci Levels**: Customizable colors for each level type
#### Alerts
- **Enable EM Breach Alerts**: Master toggle for all alerts
- **Specific Alerts**: Four alert types for Fibonacci level breaches
## Trading Applications
### Options Trading
- **Straddle/Strangle Positioning**: Visualize breakeven levels for neutral strategies
- **Directional Plays**: Assess probability of reaching target levels
- **Earnings Plays**: Compare actual vs. expected move outcomes
### Equity Trading
- **Support/Resistance**: Use EM boundaries and Fibonacci levels as key levels
- **Breakout Trading**: Monitor for moves beyond expected ranges
- **Mean Reversion**: Look for reversals at extreme Fibonacci levels
### Risk Management
- **Position Sizing**: Gauge likely price ranges for the week
- **Stop Placement**: Use Fibonacci levels for logical stop locations
- **Profit Targets**: Set targets based on EM structure probabilities
## Technical Implementation
### Performance Features
- **Memory Managed**: Configurable history limits prevent memory issues
- **Timeframe Independent**: Uses timestamp-based calculations for consistency
- **Object Management**: Automatic cleanup of drawing objects prevents duplicates
- **Error Handling**: Robust bounds checking and NA value handling
### Pine Script Best Practices
- **v6 Compliance**: Uses latest Pine Script version features
- **User Defined Types**: Structured data management with WeeklyEM type
- **Efficient Drawing**: Smart line/label creation and deletion
- **Professional Standards**: Clean code organization and comprehensive documentation
## Customization Guide
### Adding New Weeks
```pinescript
// Add after market close each Friday
map.put(expected_moves, YYYYMMDD, EM_VALUE)
```
### Color Schemes
Customize colors for different trading styles:
- **Dark Theme**: Use bright colors for visibility
- **Light Theme**: Use contrasting dark colors
- **Minimalist**: Use single color with transparency
### Label Management
Control label density:
- **Show Current Week Labels Only**: Reduce clutter for active trading
- **Show All Labels**: Full information for analysis
- **Selective Display**: Choose specific label types
## Troubleshooting
### Common Issues
1. **No Lines Appearing**: Check that expected move data is entered for current/recent weeks
2. **Wrong Time Display**: Ensure "America/New_York" timezone is properly handled
3. **Duplicate Lines**: Restart indicator if drawing objects appear duplicated
4. **Missing Fibonacci Levels**: Verify "Show Fibonacci Levels" is enabled
### Data Validation
- **Expected Move Format**: Use positive numbers (e.g., 91.244, not ±91.244)
- **Date Format**: Use YYYYMMDD format (e.g., 20250613)
- **Reasonable Values**: Verify EM values are realistic (typically 50-200 for SPX)
## Version History
### Current Version
- **Pine Script v6**: Latest version compatibility
- **Fibonacci Integration**: Five-level retracement analysis
- **Zone-Aware Alerts**: Upper/lower zone differentiation
- **Dynamic Line Management**: Smart current week extension
- **Professional UI**: Comprehensive information table
### Future Enhancements
- **Multiple Symbols**: Extend beyond SPX to other indices
- **Automated Data**: Integration with options data APIs
- **Statistical Analysis**: Success rate tracking for EM predictions
- **Additional Levels**: Custom percentage levels beyond Fibonacci
## License & Usage
This indicator is designed for educational and trading purposes. Users are responsible for:
- **Data Accuracy**: Ensuring correct expected move values
- **Risk Management**: Proper position sizing and risk controls
- **Market Understanding**: Comprehending options-based expected move concepts
## Support
For questions, issues, or feature requests related to this indicator, please refer to the code comments and documentation within the Pine Script file.
---
**Disclaimer**: This indicator is for informational purposes only. Trading involves substantial risk of loss and is not suitable for all investors. Past performance does not guarantee future results.

BSL & SSL - Liquidity Zones
BSL & SSL - Liquidity Zones
Indicator Description (for TradingView)
Concept
The BSL & SSL - Liquidity Zones indicator is a simple yet powerful visual tool that helps traders identify key liquidity zones in the market by tracking prominent highs and lows on the chart.
It is based on the concept that the Highest High (Buy Side Liquidity - BSL) and Lowest Low (Sell Side Liquidity - SSL) represent zones where stop-loss orders and pending orders accumulate — often attracting future price movements.
Purpose
This indicator helps traders spot hidden liquidity levels which may act as targets or potential reversal points. It is especially useful for traders who apply Smart Money Concepts (SMC) or institutional trading models.
Great for detecting potential stop hunts and understanding market structure shifts.
How It Works
The indicator calculates the Highest High and Lowest Low over a user-defined period (default: 20 candles).
When a new Higher High forms, it marks a new BSL.
When a new Lower Low forms, it marks a new SSL.
These zones are likely to attract price in the future — either as targets or traps.
Visualization
The indicator draws static horizontal lines (Stepline style) at BSL and SSL levels.
These lines remain in place until broken or a new level is formed.
Visual Labels enhance clarity:
🟢 Green Label → BSL
🔴 Red Label → SSL
Trading Insights / Practical Use
When price approaches a BSL or SSL zone, ask yourself:
✅ Will price break the level to grab liquidity?
✅ Will there be a reversal after liquidity is taken?
The indicator does not provide signals by itself — it serves as a valuable confirmation tool when combined with:
Price Action
Support & Resistance
Momentum Indicators
SMC Tools
Key Benefits
✅ Easy to use
✅ Enhances liquidity analysis
✅ Highlights zones targeted by institutional players
✅ Simple calculation — no complex formulas
Limitations
🚫 Does NOT generate buy/sell signals
🚫 Should be used as part of a complete trading framework
Conclusion
BSL & SSL - Liquidity Zones is a versatile and intuitive tool for any trader looking to better understand where liquidity is positioned on the chart.
It works across all timeframes and complements any trading strategy, especially Smart Money-based approaches.

Levels Of Interest------------------------------------------------------------------------------------
LEVELS OF INTEREST (LOI)
TRADING INDICATOR GUIDE
------------------------------------------------------------------------------------
Table of Contents:
1. Indicator Overview & Core Functionality
2. VWAP Foundation & Historical Context
3. Multi-Timeframe VWAP Analysis
4. Moving Average Integration System
5. Trend Direction Signal Detection
6. Visual Design & Display Features
7. Custom Level Integration
8. Repaint Protection Technology
9. Practical Trading Applications
10. Setup & Configuration Recommendations
------------------------------------------------------------------------------------
1. INDICATOR OVERVIEW & CORE FUNCTIONALITY
------------------------------------------------------------------------------------
The LOI indicator combines multiple VWAP calculations with moving averages across different timeframes. It's designed to show where institutional money is flowing and help identify key support and resistance levels that actually matter in today's markets.
Primary Functions:
- Multi-timeframe VWAP analysis (Daily, Weekly, Monthly, Yearly)
- Advanced moving average integration (EMA, SMA, HMA)
- Real-time trend direction detection
- Institutional flow analysis
- Dynamic support/resistance identification
Target Users: Day traders, swing traders, position traders, and institutional analysts seeking comprehensive market structure analysis.
------------------------------------------------------------------------------------
2. VWAP FOUNDATION & HISTORICAL CONTEXT
------------------------------------------------------------------------------------
Historical Development: VWAP started in the 1980s when big institutional traders needed a way to measure if they were getting good fills on their massive orders. Unlike regular price averages, VWAP weighs each price by the volume traded at that level. This makes it incredibly useful because it shows you where most of the real money changed hands.
Mathematical Foundation: The basic math is simple: you take each price, multiply it by the volume at that price, add them all up, then divide by total volume. What you get is the true "average" price that reflects actual trading activity, not just random price movements.
Formula: VWAP = Σ(Price × Volume) / Σ(Volume)
Where typical price = (High + Low + Close) / 3
Institutional Behavior Patterns:
- When price trades above VWAP, institutions often look to sell
- When it's below, they're usually buying
- Creates natural support and resistance that you can actually trade against
- Serves as benchmark for execution quality assessment
------------------------------------------------------------------------------------
3. MULTI-TIMEFRAME VWAP ANALYSIS
------------------------------------------------------------------------------------
Core Innovation: Here's where LOI gets interesting. Instead of just showing daily VWAP like most indicators, it displays four different timeframes simultaneously:
**Daily VWAP Implementation**:
- Resets every morning at market open
- Provides clearest picture of intraday institutional sentiment
- Primary tool for day trading strategies
- Most responsive to immediate market conditions
**Weekly VWAP System**:
- Resets each Monday (or first trading day)
- Smooths out daily noise and volatility
- Perfect for swing trades lasting several days to weeks
- Captures weekly institutional positioning
**Monthly VWAP Analysis**:
- Resets at beginning of each calendar month
- Captures bigger institutional rebalancing at month-end
- Fund managers often operate on monthly mandates
- Significant weight in intermediate-term analysis
**Yearly VWAP Perspective**:
- Resets annually for full-year institutional view
- Shows long-term institutional positioning
- Where pension funds and sovereign wealth funds operate
- Critical for major trend identification
Confluence Zone Theory: The magic happens when multiple VWAP levels cluster together. These confluence zones often become major turning points because different types of institutional money all see value at the same price.
------------------------------------------------------------------------------------
4. MOVING AVERAGE INTEGRATION SYSTEM
------------------------------------------------------------------------------------
Multi-Type Implementation: The indicator includes three types of moving averages, each with its own personality and application:
**Exponential Moving Averages (EMAs)**:
- React quickly to recent price changes
- Displayed as solid lines for easy identification
- Optimal performance in trending market conditions
- Higher sensitivity to current price action
**Simple Moving Averages (SMAs)**:
- Treat all historical data points equally
- Appear as dashed lines in visual display
- Slower response but more reliable in choppy conditions
- Traditional approach favored by institutional traders
**Hull Moving Averages (HMAs)**:
- Newest addition to the system (dotted line display)
- Created by Alan Hull in 2005
- Solves classic moving average dilemma: speed vs. accuracy
- Manages to be both responsive and smooth simultaneously
Technical Innovation: Alan Hull's solution addresses the fundamental problem where moving averages are either too slow (missing moves) or too fast (generating false signals). HMAs achieve optimal balance through weighted calculation methodology.
Period Configuration:
- 5-period: Short-term momentum assessment
- 50-period: Intermediate trend identification
- 200-period: Long-term directional confirmation
------------------------------------------------------------------------------------
5. TREND DIRECTION SIGNAL DETECTION
------------------------------------------------------------------------------------
Real-Time Momentum Analysis: One of LOI's best features is its real-time trend detection system. Next to each moving average, visual symbols provide immediate trend assessment:
Symbol System:
- ▲ Rising average (bullish momentum confirmation)
- ▼ Falling average (bearish momentum indication)
- ► Flat average (consolidation or indecision period)
Update Frequency: These signals update in real-time with each new price tick and function across all configured timeframes. Traders can quickly scan daily and weekly trends to assess alignment or conflicting signals.
Multi-Timeframe Trend Analysis:
- Simultaneous daily and weekly trend comparison
- Immediate identification of trend alignment
- Early warning system for potential reversals
- Momentum confirmation for entry decisions
------------------------------------------------------------------------------------
6. VISUAL DESIGN & DISPLAY FEATURES
------------------------------------------------------------------------------------
Color Psychology Framework: The color scheme isn't random but based on psychological associations and trading conventions:
- **Blue Tones**: Institutional neutrality (VWAP levels)
- **Green Spectrum**: Growth and stability (weekly timeframes)
- **Purple Range**: Longer-term sophistication (monthly analysis)
- **Orange Hues**: Importance and attention (yearly perspective)
- **Red Tones**: User-defined significance (custom levels)
Adaptive Display Technology: The indicator automatically adjusts decimal places based on the instrument you're trading. High-priced stocks show 2 decimals, while penny stocks might show 8. This keeps the display incredibly clean regardless of what you're analyzing - no cluttered charts or overwhelming information overload.
Smart Labeling System: Advanced positioning algorithm automatically spaces all elements to prevent overlap, even during extreme zoom levels or multiple timeframe analysis. Every level stays clearly readable without any visual chaos disrupting your analysis.
------------------------------------------------------------------------------------
7. CUSTOM LEVEL INTEGRATION
------------------------------------------------------------------------------------
User-Defined Level System: Beyond the calculated VWAP and moving average levels, traders can add custom horizontal lines at any price point for personalized analysis.
Strategic Applications:
- **Psychological Levels**: Round numbers, previous significant highs/lows
- **Technical Levels**: Fibonacci retracements, pivot points
- **Fundamental Targets**: Analyst price targets, earnings estimates
- **Risk Management**: Stop-loss and take-profit zones
Integration Features:
- Seamless incorporation with smart labeling system
- Custom color selection for visual organization
- Extension capabilities across all chart timeframes
- Maintains display clarity with existing indicators
------------------------------------------------------------------------------------
8. REPAINT PROTECTION TECHNOLOGY
------------------------------------------------------------------------------------
Critical Trading Feature: This addresses one of the most significant issues in live trading applications. Most multi-timeframe indicators "repaint," meaning they display different signals when viewing historical data versus real-time analysis.
Protection Benefits:
- Ensures every displayed signal could have been traded when it appeared
- Eliminates discrepancies between historical and live analysis
- Provides realistic performance expectations
- Maintains signal integrity across chart refreshes
Configuration Options:
- **Protection Enabled**: Default setting for live trading
- **Protection Disabled**: Available for backtesting analysis
- User-selectable toggle based on analysis requirements
- Applies to all multi-timeframe calculations
Implementation Note: With protection enabled, signals may appear one bar later than without protection, but this ensures all signals represent actionable opportunities that could have been executed in real-time market conditions.
------------------------------------------------------------------------------------
9. PRACTICAL TRADING APPLICATIONS
------------------------------------------------------------------------------------
**Day Trading Strategy**:
Focus on daily VWAP with 5-period moving averages. Look for bounces off VWAP or breaks through it with volume. Short-term momentum signals provide entry and exit timing.
**Swing Trading Approach**:
Weekly VWAP becomes your primary anchor point, with 50-period averages showing intermediate trends. Position sizing based on weekly VWAP distance.
**Position Trading Method**:
Monthly and yearly VWAP provide broad market context, while 200-period averages confirm long-term directional bias. Suitable for multi-week to multi-month holdings.
**Multi-Timeframe Confluence Strategy**:
The highest-probability setups occur when daily, weekly, and monthly VWAPs cluster together, especially when multiple moving averages confirm the same direction. These represent institutional consensus zones.
Risk Management Integration:
- VWAP levels serve as dynamic stop-loss references
- Multiple timeframe confirmation reduces false signals
- Institutional flow analysis improves position sizing decisions
- Trend direction signals optimize entry and exit timing
------------------------------------------------------------------------------------
10. SETUP & CONFIGURATION RECOMMENDATIONS
------------------------------------------------------------------------------------
Initial Configuration: Start with default settings and adjust based on individual trading style and market focus. Short-term traders should emphasize daily and weekly timeframes, while longer-term investors benefit from monthly and yearly level analysis.
Transparency Optimization: The transparency settings allow clear price action visibility while maintaining level reference points. Most traders find 70-80% transparency optimal - it provides a clean, unobstructed view of price movement while maintaining all critical reference levels needed for analysis.
Integration Strategy: Remember that no indicator functions effectively in isolation. LOI provides excellent context for institutional flow and trend direction analysis, but should be combined with complementary analysis tools for optimal results.
Performance Considerations:
- Multiple timeframe calculations may impact chart loading speed
- Adjust displayed timeframes based on trading frequency
- Customize color schemes for different market sessions
- Regular review and adjustment of custom levels
------------------------------------------------------------------------------------
FINAL ANALYSIS
------------------------------------------------------------------------------------
Competitive Advantage: What makes LOI different is its focus on where real money actually trades. By combining volume-weighted calculations with multiple timeframes and trend detection, it cuts through market noise to show you what institutions are really doing.
Key Success Factor: Understanding that different timeframes serve different purposes is essential. Use them together to build a complete picture of market structure, then execute trades accordingly.
The integration of institutional flow analysis with technical trend detection creates a comprehensive trading tool that addresses both short-term tactical decisions and longer-term strategic positioning.
------------------------------------------------------------------------------------
END OF DOCUMENTATION
------------------------------------------------------------------------------------

ICT Opening Range Projections (tristanlee85)ICT Opening Range Projections
This indicator visualizes key price levels based on ICT's (Inner Circle Trader) "Opening Range" concept. This 30-minute time interval establishes price levels that the algorithm will refer to throughout the session. The indicator displays these levels, including standard deviation projections, internal subdivisions (quadrants), and the opening price.
🟪 What It Does
The Opening Range is a crucial 30-minute window where market algorithms establish significant price levels. ICT theory suggests this range forms the basis for daily price movement.
This script helps you:
Mark the high, low, and opening price of each session.
Divide the range into quadrants (premium, discount, and midpoint/Consequent Encroachment).
Project potential price targets beyond the range using configurable standard deviation multiples .
🟪 How to Use It
This tool aids in time-based technical analysis rooted in ICT's Opening Range model, helping you observe price interaction with algorithmic levels.
Example uses include:
Identifying early structural boundaries.
Observing price behavior within premium/discount zones.
Visualizing initial displacement from the range to anticipate future moves.
Comparing price reactions at projected standard deviation levels.
Aligning price action with significant times like London or NY Open.
Note: This indicator provides a visual framework; it does not offer trade signals or interpretations.
🟪 Key Information
Time Zone: New York time (ET) is required on your chart.
Sessions: Supports multiple sessions, including NY midnight, NY AM, NY PM, and three custom timeframes.
Time Interval: Supports multi-timeframe up to 15 minutes. Best used on a 1-minute chart for accuracy.
🟪 Session Options
The Opening Range interval is configurable for up to 6 sessions:
Pre-defined ICT Sessions:
NY Midnight: 12:00 AM – 12:30 AM ET
NY AM: 9:30 AM – 10:00 AM ET
NY PM: 1:30 PM – 2:00 PM ET
Custom Sessions:
Three user-defined start/end time pairs.
This example shows a custom session from 03:30 - 04:00:
🟪 Understanding the Levels
The Opening Price is the open of the first 1-minute candle within the chosen session.
At session close, the Opening Range is calculated using its High and Low . An optional swing-based mode uses swing highs/lows for range boundaries.
The range is divided into quadrants by its midpoint ( Consequent Encroachment or CE):
Upper Quadrant: CE to high (premium).
Lower Quadrant: Low to CE (discount).
These subdivisions help visualize internal range dynamics, where price often reacts during algorithmic delivery.
🟪 Working with Ranges
By default, the range is determined by the highest high and lowest low of the 30-minute session:
A range can also be determined by the highest/lowest swing points:
Quadrants outline the premium and discount of a range that price will reference:
Small ranges still follow the same algorithmic logic, but may be deemed insignificant for one's trading. These can be filtered in the settings by specifying a minimum ticks limit. In this example, the range is 42 ticks (10.5 points) but the indicator is configured for 80 ticks (20 points). We can select which levels will plot if the range is below the limit. Here, only the 00:00 opening price is plotted:
You may opt to include the range high/low, quadrants, and projections as well. This will plot a red (configurable) range bracket to indicate it is below the limit while plotting the levels:
🟪 Price Projections
Projections extend beyond the Opening Range using standard deviations, framing the market beyond the initial session and identifying potential targets. You define the standard deviation multiples (e.g., 1.0, 1.5, 2.0).
Both positive and negative extensions are displayed, symmetrically projected from the range's high and low.
The Dynamic Levels option plots only the next projection level once price crosses the previous extreme. For example, only the 0.5 STDEV level plots until price reaches it, then the 1.0 level appears, and so on. This continues up to your defined maximum projections, or indefinitely if standard deviations are set to 0.
This example shows dynamic levels for a total of 6 sessions, only 1 of which meet a configured minimum limit of 50 ticks:
Small ranges followed by significant displacement are impacted the most with the number of levels plotted. You may hide projections when configuring the minimum ticks.
A fixed standard deviation will plot levels in both directions, regardless of the price range. Here, we plot up to 3.0 which hiding projections for small ranges:
🟪 Legal Disclaimer
This indicator is provided for informational and educational purposes only. It is not financial advice, and should not be construed as a recommendation to buy or sell any financial instrument. Trading involves substantial risk, and you could lose a significant amount of money. Past performance is not indicative of future results. Always consult with a qualified financial professional before making any trading or investment decisions. The creators and distributors of this indicator assume no responsibility for your trading outcomes.

Range Progress TrackerRANGE PROGRESS TRACKER(RPT)
PURPOSE
This indicator helps traders visually and statistically understand how much of the typical price range (measured by ATR) has already been covered in the current period (Daily, Weekly, or Monthly). It includes key features to assist in trend exhaustion analysis, reversal spotting, and smart alerting.
CORE LOGIC
The indicator calculates the current range of the selected time frame (e.g., Daily), which is:
Current Range = High - Low
This is then compared to the ATR (Average True Range) of the same time frame, which represents the average price movement range over a defined period (default is 14).
The comparison is expressed as a percentage, calculated with this formula:
Range % = (Current Range / ATR) × 100
This percentage shows how much of the “average expected move” has already occurred.
WHY IT MATTERS
When the current range approaches or exceeds 100% of ATR, it means the price has already moved as much as it typically does in a full session.
This indicates a lower probability of continuing the trend with a new high or low, especially when the price is already near the session's high or low.
This setup can signal:
A possible consolidation phase
A reversal in trend
The market entering a corrective phase
SMART ALERTS
The indicator can alert you when:
A new high is made after the range percentage exceeds your set threshold.
A new low is made after the range percentage exceeds your set threshold.
You can adjust the Range % Alert Threshold in the settings to tailor it to your trading style.

Day of Week and HTF Period SeparatorDay of Week & HTF Period Separator
A minimalist Pine Script indicator that adds clear, time-based separators and labels to intraday charts for better structure and analysis.
Key Features
• Day Labels
• Displays abbreviated weekday names (MON, TUE, WED, etc.) at a user-defined hour
• Custom text color and position
• Limits display to the most recent 28 days for a clean view
• Time Separators
• Daily: Vertical line at 00:00 each trading day
• 4-Hour: Lines at 00:00, 04:00, 08:00, 12:00, 16:00, 20:00
• Hourly: Divisions at every hour for detailed timing
• Customization
• Individual color picker for each separator type
• Choose line style: Solid, Dashed or Dotted
• Enable or disable any separator or label independently
• Smart limits to avoid clutter on extended history
• Smart Behavior
• Active only on intraday timeframes
• Projects upcoming separators into the future for planning
• Automatically caps historical plotting for performance
• Lines extend across full visible price range
Perfect for traders who need distinct session breaks, precise time-based zoning and an organized chart layout.
Inputs
• Show Day Labels (true/false)
• Label Hour (0–23)
• Day Label Color
• Show Daily Separators (true/false)
• Show 4H Separators (true/false)
• Show 1H Separators (true/false)
• Daily Line Color, Style
• 4H Line Color, Style
• Hourly Line Color, Style
• Max Days to Display
Enhance your intraday analysis with clean, customizable time markers. 👁

StochRSI Context EngineThe StochRSI Context Engine is a premium, logic-driven indicator built to provide comprehensive intraday momentum context using multi-timeframe Stochastic RSI analysis. Rather than issuing direct buy or sell signals, the tool is designed to give traders enhanced clarity on trend posture, overbought/oversold conditions, volatility states, and potential momentum reversals. It combines multiple layers of signal processing to deliver an intelligent overview of market conditions in real time.
What it does:
The indicator performs a multi-timeframe evaluation of the Stochastic RSI, sampling values from four customizable timeframes (default: 5m, 15m, 1h, 4h). These values are blended and processed through a series of analytical engines to provide the following:
1. StochRSI Multi-Timeframe Engine
* Computes a smoothed Stochastic RSI value on each selected timeframe.
* Applies user-defined smoothing (SMA, EMA, RMA, or WMA).
* Aggregates these into an average (sRSIavg) for further analysis.
2. Trend and Volatility Engine
* Uses EMA stacking logic (8, 21, 50) to determine directional alignment.
* Calculates linear regression slope for directional bias.
* Assesses volatility using ATR relative to price.
* Derives a trendScore based on EMA alignment, price position, and slope strength.
3. Bias and Slope Analysis
* Measures fast/slow EMA slope differentials to detect bias direction and strength.
* Computes slope deltas and volatility-weighted stacking to score bias conditions.
* Outputs a classification such as strong bullish, moderate bearish, or neutral.
4. Dynamic OB/OS Zone Detection
* Adapts overbought and oversold thresholds based on volatility and trend regime.
* Adjusts the zone boundaries if in a trending or high-volatility environment.
5. Microzone Proximity Detection
* Tracks whether the average StochRSI is approaching key OB/OS thresholds.
* Flags conditions like “Near Overbought,” “Near Oversold,” or “Mid Range.”
6. Velocity and Acceleration Detection
* Measures how quickly StochRSI values are changing.
* Uses delta calculations to gauge the momentum’s thrust or decay.
* Classifies shifts in RSI movement (e.g., flat, slow, fast, or thrusting).
7. Range Expansion / Compression Engine
* Evaluates whether StochRSI values across timeframes are diverging or compressing.
* Identifies regime changes in momentum coherence.
8. Momentum Scoring System
* Calculates a composite score based on bias, slope strength, volatility, and range.
* Labels momentum phases from dormant to full-throttle.
9. Confluence Detection
* Tallies how many of the 4 timeframes are currently overbought or oversold.
* High confluence increases the probability of valid reversal or continuation zones.
10. Support and Resistance Zone Memory
* Tracks and plots previous areas where StochRSI bounced or rejected near zones.
* Stores and updates these zones over time, acting as momentum-based S/R levels.
* Includes a proximity check to cluster zones that are close in value.
11. Divergence Detection Engine
* Detects classic bullish or bearish divergence between price and the aggregated StochRSI.
* Draws lines to show divergence structure and triggers real-time alerts.
12. Smart Background Highlighting
* Shades the background based on whether current StochRSI is in an overbought, oversold, or
neutral zone.
13. Real-Time Dashboard
* Displays trend, bias, confluence count, velocity, divergence state, momentum score, and
more.
* Dynamically updates and is optimized for top-right screen positioning with compact
formatting.
14. Smart Alerts
* Issues alerts for divergence detection and high-confluence reversal conditions.
15. Real-Time Labels on Curves
* Shows the selected timeframes alongside each plotted StochRSI line to clarify source data.
What it’s based on:
* Stochastic RSI as the core input signal, providing normalized momentum across timeframes.
* EMA stacking logic, adapted from institutional trend-following models.
* Volatility normalization using ATR to adapt thresholds in high vs. low volatility environments.
* Slope forecasting using linear regression to infer directional conviction.
* Bias analysis modeled on a composite of EMA distance, alignment, and directional thrust.
* Support/resistance zone memory derived from repeated interaction with dynamic OB/OS thresholds.
* Divergence logic based on localized price and oscillator peaks/troughs.
* Multi-factor confidence scoring, aggregating up to 6 inputs to rate market clarity.
This script is for educational and informational purposes only. It does not generate trade signals or provide financial advice. It is not intended to be used as a standalone system for trading or investment decisions. Use at your own discretion. Always confirm with your broader strategy and risk management practices.
