SCTI-D1SCTI-D1 Indicator Introduction / 指标简介
The SCTI-D1 (Smart Composite Trading Indicator - Daily) is a comprehensive, multi-feature trading tool designed for serious traders who demand depth, flexibility, and clarity in their market analysis. This indicator combines several powerful concepts into one seamless workflow, including:
Multiple EMA Systems with customizable lengths and visibility
PMA (Projected Moving Average) with fill options between lines
VWAP with configurable anchors and deviation bands
Divergence Detection for MACD and Histogram
Volume Profile with node detection (peaks, troughs, highs, lows)
Smart Money Concepts including order blocks, fair value gaps, equal highs/lows, and market structure shifts
Whether you trade stocks, forex, or cryptocurrencies, the SCTI-D1 helps you identify key levels, track institutional activity, and spot high-probability reversal signals—all in one clean, customizable interface.
SCTI-D1 指标简介
SCTI-D1(智能综合交易指标 - 日线版)是一款功能全面的交易工具,专为需要深度、灵活性和清晰市场分析的专业交易者设计。该指标将多种强大概念融合在一个流畅的工作流程中,包括:
多组EMA系统,可自定义长度和显示
PMA(投影移动平均线),支持均线间填充色
VWAP,可配置锚定周期和偏差带
背离检测,支持MACD和柱状图
成交量分布,支持节点检测(峰值、谷值、最高、最低)
聪明钱概念,包括订单块、公允价值缺口、等高/等低和市场结构转换
无论您交易股票、外汇还是加密货币,SCTI-D1 都能帮助您识别关键水平、跟踪机构资金动向并发现高概率反转信号——所有功能均集成在一个清晰可定制的界面中。
在腳本中搜尋"smart"

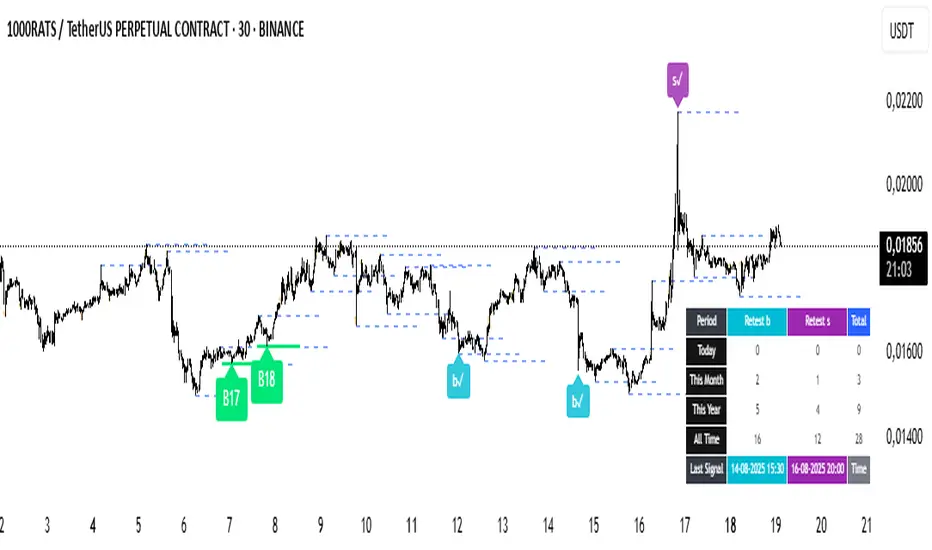
kriptoeth SPKriptoETH SP Indicator - Smart Money Analysis Tool
Main Function
This indicator identifies potential market reversal points based on Smart Money concepts. It analyzes liquidity sweeps and significant support/resistance breaks to generate trading signals.
Key Features
1. Swing Analysis
Identifies high and low levels based on specified swing length (default 15 bars)
These levels are considered potential liquidity zones
2. Liquidity Sweep Detection
Detects short-term violations of support and resistance levels as "sweeps"
Sweep tolerance (%) parameter allows sensitivity adjustment
3. Volume Confirmation
Requires volume spike for signal formation
Volume multiplier sets minimum volume threshold
4. Trend Filter
Analyzes overall trend direction using 50-period MA
Filters signals against the trend to improve success rate
5. Retest Capability
Tracks price return to main signal levels (B/S lines) after initial signals
Shows small confirmation signals when retests occur
Signal Types
B Signal: Potential buy opportunity (green label)
S Signal: Potential sell opportunity (red label)
b✓ / s✓: Retest confirmation signals (small labels)
Filtering System
Filters out too-rapid breaks
Controls for insufficient bar distance
Next bar confirmation option
Eliminates signals inconsistent with trend direction
Statistics Table
Daily, monthly, yearly retest counts
Last signal timestamps
Total signal statistics
Usage Guidelines
Combine signals with other technical analysis tools
Determine your risk-reward ratio in advance
Limit position size to 1-2% of your capital
Consider overall market conditions
Use proper stop-loss levels
Wait for confluence with other indicators
Parameters Explanation
Swing Length: Period for identifying swing highs/lows
Sweep Tolerance: Sensitivity for liquidity sweep detection
Volume Multiplier: Minimum volume increase requirement
Trend Filter: Enable/disable trend-based signal filtering
Retest Filters: Additional confirmation requirements for retest signals
How It Works
Algorithm identifies swing highs and lows as potential liquidity levels
Monitors for price sweeps beyond these levels with volume confirmation
Generates main signals (B/S) when criteria are met
Tracks subsequent retests of these signal levels
Applies multiple filters to reduce false signals
Best Practices
Use higher timeframes for trend confirmation
Combine with support/resistance analysis
Consider market structure context
Apply proper risk management rules
Backtest on historical data before live trading
IMPORTANT DISCLAIMER: This indicator is for educational and analysis purposes only. It does not constitute financial advice. Trading involves substantial risk of loss. Always conduct your own research and consider consulting with a qualified financial advisor before making investment decisions. Past performance does not guarantee future results.
Version Updates
Enhanced filtering system
Improved retest detection
Statistics tracking table
Trend-based signal validation
Multiple confirmation methods
SMC - OB/Breaker Block/Bos/ChoCh (DeadCat) Based on analyzing your Pine Script code, here are comprehensive descriptions that should comply with TradingView's house rules:
Script 1: "PO3 Liquidity w/ CISD (DeadCat)"
Description:
This indicator implements the Power of Three (PO3) liquidity concept combined with Change in State of Delivery (CISD) pattern recognition for Smart Money Concepts (SMC) trading. The script operates on multi-timeframe analysis using automated timeframe selection.
Core Methodology: The indicator identifies C2 liquidity sweeps by detecting when price breaks previous period highs/lows and then reverses back above/below those levels. It specifically looks for:
C2 Buy Setup: When current low breaks previous period low but closes back above it
C2 Sell Setup: When current high breaks previous period high but closes back below it
CISD Pattern Detection: The script implements sophisticated CISD (Change in State of Delivery) pattern recognition by:
Tracking the first break of previous HTF high/low levels
Identifying imbalance candles (gaps between consecutive candles)
Confirming CISD when price reclaims the imbalance level within 2 HTF periods
Validating setups only when both liquidity sweep AND CISD confirmation occur
Visual Components:
HTF Candles: Displays higher timeframe candle structure on current chart
Trading Zones: Shows zones between HTF open and equilibrium levels
CISD Lines: Marks confirmed change in state of delivery levels
C2/C4 Labels: Identifies liquidity sweep entry points and potential continuation setups
Market Structure: Optional HH/HL/LH/LL pivot markers
Unique Features:
Automatic timeframe calculation (15m→4H, 1H→1D, etc.)
Real-time HTF period countdown
Setup invalidation tracking when stops are hit
Progressive setup confirmation (C2→C4 evolution)
Bias filter for directional trading preferences
Usage: C2 setups provide initial entry opportunities after confirmed liquidity sweeps with CISD confirmation. C4 setups offer additional entries when HTF equilibrium conditions align favorably. The indicator helps traders identify institutional liquidity grabs followed by genuine directional moves.
Script 2: "SMC Toolkit (DeadCat)"
Description:
This comprehensive Smart Money Concepts toolkit provides institutional-level market structure analysis with automated Order Block (OB) and Breaker Block (BB) zone identification, plus Break of Structure (BOS) and Change of Character (ChoCh) detection.
Market Structure Algorithm: The indicator uses a sophisticated pivot-based algorithm to identify and track market structure progression:
Uptrend: HH→HL→HH sequence tracking
Downtrend: LL→LH→LL sequence tracking
Trend Changes: Automatic ChoCh detection when structure breaks occur
Order Block Logic:
Bullish OB Zones: Created at Higher Lows (HL) and Lower Lows (LL) during uptrends
Bearish OB Zones: Created at Lower Highs (LH) and Higher Highs (HH) during downtrends
Uses last bearish candle before bullish moves (and vice versa) to define precise zone boundaries
Breaker Block Logic:
Bullish BB Zones: Former resistance that becomes support after HH/LH breaks
Bearish BB Zones: Former support that becomes resistance after LL/HL breaks
Automatically transitions when structure points are breached
Zone Management: The script employs intelligent zone lifecycle management:
Creates new zones only at confirmed structure points
Makes previous zones transparent when new structure is confirmed
Maintains zone relevance through dynamic extension
Limits total zones to prevent chart clutter
BOS vs ChoCh Detection:
BOS (Break of Structure): Continuation patterns when trend highs/lows are exceeded
ChoCh (Change of Character): Reversal patterns when pullback levels are broken against trend
Requires 2-candle confirmation before finalizing structure changes
Visual Enhancements:
Color-coded zones with transparency controls
Directional arrows (▲/▼) in zone labels
Customizable line styles and text sizing
Clean market structure progression tracking
Originality: This toolkit combines traditional SMC concepts with enhanced zone boundary calculation using multi-candle analysis and intelligent zone lifecycle management, providing more precise entry/exit levels than standard implementations.

smc-vol ••• ahihi🚀 User Guide – SMC-Vol Optimized
📖 Overview
This indicator integrates Smart Money Concepts (SMC) with Volume Analysis to identify high-quality trade entries based on smart money flow behavior.
🎛️ BASIC SETTINGS
Enable/Disable Features
Inside Bar: Show inside/outside bars
PKV: Price-Volume Divergence patterns
HV Monitor: Track High Volume candles (MOST IMPORTANT!)
Color Settings
High Volume Candle: Yellow (default)
PKV: Purple
HV Break: Orange (when HV level is broken)
Daily Open: Blue
📊 HIGH VOLUME (HV) ANALYSIS
HV Settings:
Volume Ratio: 100 (lookback for highest volume)
SNR %: 46% (minimum body/range ratio)
Bars to Monitor: 5 bars (after HV candle appears)
How to Read HV:
Yellow = High Volume candle
Fuchsia = SNR (Supply & Demand Reversal)
🚨 "X" = Pattern breaking HV levels
HV Monitor Table (bottom left corner):
HV Monitor | Status | Details
Last HV | 3B ago | 1.2345/1.2300
Break Status | WATCHING | 3/5
Monitor | 5 Bars | After HV
🎯 TRADING STRATEGY
Step 1: Identify High Volume Candle
Wait for a yellow candle (HV confirmed)
Mark HV High & HV Low
Table shows status: "CURRENT"
Step 2: Track the Next 5 Bars
Table shows "WATCHING" with count (1/5, 2/5…)
Look for patterns:
SKU/SKD: Supply & Demand patterns
SNR_UP/SNR_DOWN: Reversal patterns
CHUOT_UP/CHUOT_DOWN: Hammer / Shooting Star
SK_MOM: Momentum patterns
Step 3: Entry on Pattern Break
🚨 Alert triggers when pattern breaks HV levels
BUY: Break above HV High
SELL: Break below HV Low
🔥 MAIN PATTERNS
SK (Supply/Demand)
SKU (▪️ below candle): Demand pattern, wait for HV Low break → BUY
SKD (▪️ above candle): Supply pattern, wait for HV High break → SELL
CHUOT (Mouse/Hammer)
CU (below): Hammer with long lower wick
CD (above): Shooting Star with long upper wick
SNR (Supply & Demand Reversal)
Small body candle (<46% of range) with low volume
↑ Break HV → Bullish reversal above HV High
↓ Break HV → Bearish reversal below HV Low
📈 MOVING AVERAGES
Three customizable MAs:
MA #1: EMA 21 (Yellow) – Short-term trend
MA #2: EMA 9 (White) – Entry timing
MA #3: EMA 50 (Green) – Long-term trend
Usage:
Bullish: Price > MA #3, MA #2 > MA #1
Entry when: Pattern break + price retest on MA
⏰ SESSION ANALYSIS
Session A (New York):
Range Box: NY Session (19:59–21:59)
Max/Min Lines: Draw session high/low
Custom Sessions:
Pre-Session (11:00–12:00): Blue Box
Main Session (12:00–13:00): Teal Box
Watch for breakout from these ranges
💰 COMPLETE TRADING SETUP
Entry Setup:
Identify HV (Yellow candle)
Wait for pattern (within 1–5 bars)
Confirm Break (🚨 alert + level break)
Enter in breakout direction
SL: Above/Below HV level (depending on direction)
TP: 1:2 or 1:3 Risk/Reward
Extra Filters:
Volume: Enter with increasing volume
MAs: Only trade in main trend direction
Sessions: Prefer entries during active sessions
🚨 ALERTS & NOTIFICATIONS
Two main alerts:
"Price breaks HV directly" → SNR break
"HV level broken" → Pattern break within 5 bars
Setup:
Right-click indicator → "Add Alert"
Select condition
Set notifications (email / Telegram / app)
🎯 TIPS & TRICKS
✅ DO:
Wait for HV confirmation before setup
Trade with trend (MA direction)
Use strict risk management (1–2% per trade)
Backtest before live trading
❌ DON’T:
Enter immediately on pattern (wait for confirmation)
Ignore volume (Volume is key!)
Chase price after breakout
Trade against major trend
💡 Pro Tips:
Combine with Price Action for better entries
Use Multi-Timeframe Analysis
Focus on major pairs in key sessions
Keep a Trading Journal to track performance
📞 SUPPORT & UPDATES
The indicator is continuously optimized to:
Reduce lag & increase accuracy
Add new features
Fix bugs & improve UX
Happy Trading! 🚀💰

Gestor DeFi Pools con CFBManual DeFi Strategy Manager
What does this indicator do?
It combines cryptocurrency trading with DeFi strategies:
Trading signals: When to buy/sell based on EMAs and momentum
AAVE management: When to switch collateral between ETH and USDC
Uniswap V3: Optimal ranges for liquidity pools
🚨 Indicator Signals (Quick Reference)
Symbol Meaning Action
▲E Lime Early ETH Start switching to ETH (aggressive)
▲C Green Confirm ETH Confirm switch to ETH (safe)
▲D Teal DCA ETH Scale ETH position (+10%)
▼E Orange Early USDC Start switching to USDC (aggressive)
▼C Red Confirm USDC Confirm switch to USDC (safe)
▼D Dark Red DCA USDC Scale USDC position (-10%)
❌ Dark Red EMERGENCY Repay loan NOW
LP+ Lime Create NEW LP Open liquidity pool
LP? Green LP Opportunity Similar pool available
LP- Orange Close LP Close liquidity pool
REB Yellow Rebalance Adjust pool ranges
WAIT Gray Pause Wait before acting
Graphic Elements
Element Color Description
Blue Line Blue Fast EMA (10)
Red Line Red Slow EMA (55)
Purple Lines Purple CFB Adaptive Bands
Colored Band Green/Yellow/Red LP range (color = risk)
Orange Background Orange Active squeeze
Blue Background Blue Trending market
Red Background Red Strong breakout
🚀 Installation and Basic Setup
Step 1: Installation (MANDATORY)
Open TradingView → Pine Editor
Create new indicator
Copy and paste the full code
Save as "DeFi Strategy Manager"
Add to ETHUSDC 1H chart
Step 2: Basic Configuration (MANDATORY)
Only two parameters need to be configured:
🎯 Strategy Mode:
🟢 Conservative (±20%): 0.05% daily, very low risk
🟡 Balanced (±10%): 0.2% daily, medium risk
🔴 Aggressive Day Trading (±5%): 0.5% daily, high risk
⚡ Ultra Scalper (±2%): 0.8% daily, extreme risk
⏰ Timeframe:
Scalping (minutes): 0.5x narrower ranges
Day Trading (hours): 0.8x narrower ranges
Swing (days): 1.2x wider ranges
Position (weeks): 1.8x wider ranges
✅ Ready to Use!
Once configured:
✅ Indicator calculates everything automatically
✅ CFB Adaptive is enabled by default (recommended)
✅ Machine Learning learns from your signals automatically
✅ Dashboard shows expected profits in real time
## 📊 Dashboard Explicado (TV makes me write this in English, but the dashboard is in Spanish, so...)
El tablero superior derecha muestra información esencial en tiempo real con 15 indicadores clave:
### Configuración y Setup:
- **Estrategia**: Tu modo seleccionado (Conservador/Balanceado/Agresivo/Scalper) + temporalidad
- **Rango Final**: El rango actual de Uniswap V3 después de todos los ajustes automáticos
- **ML Confidence**: Porcentaje de éxito de señales pasadas (70%+ = alta confianza)
- **Config Status**: Comparación con tu perfil base + recomendaciones de ajuste
### Estado del Mercado:
- **Market State**: Tipo de mercado (Tendencial/Lateral) + condiciones de squeeze + dirección
- **CFB Status**: Estado del sistema adaptativo CFB + posición del precio + rango dinámico
### Performance y Retornos:
- **Performance**: Tu retorno actual + ganancias proyectadas diarias/mensuales
- **Expected APY**: Retorno anual esperado con clasificación de riesgo
### Gestión de Pools:
- **Pool Status**: Estado actual de tu pool de liquidez + drift de precio + tiempo activo
- **Pool Ranges**: Rangos de precio específicos superior e inferior + distancias actuales
### Señales y Acciones:
- **Trend Progress**: En qué dirección optimiza la estrategia (ETH/USDC/ninguna)
- **Señal Activa**: Qué señal está ejecutándose ahora (Early/Confirm/DCA)
- **Acción Prioritaria**: Próxima acción recomendada con emoji de estado
### Monitoreo de Riesgo:
- **Risk Level**: Nivel de riesgo de Impermanent Loss + rango de volatilidad del mercado
- **Overall Status**: Estado general del sistema + puntuación para day trading
#### **🔧 Ejemplo de Dashboard Simplificado:**
```
📊 DEFI CFB SMART │ VALOR │ STATUS
─────────────────────┼───────────────────┼──────────────────
Estrategia │ Agresivo DT │ Day Trading
Rango Final │ ±5.8% │ 🟡 MEDIO
Confianza ML │ 67% │ MEDIA (12)
Estado Config │ +15% │ CONFIGURACIÓN OK
Estado Mercado │ Lateral-Release │ ↑BULL DÉBIL
Rendimiento │ 5.2% │ $50/día $1.5K/mes
APY Esperado │ 182% │ 🟡 ALTO
Estado CFB │ ACTIVO ↑$2,247 │ ±6.2%
Estado Pool │ ACTIVO │ 2.3% drift 4h
Rangos Pool │ $2,180-2,314 │ +3.1% / -4.2%
Progreso Trend │ ETH Trend │ DCA Ready
Señal Activa │ ETH DCA │ Scale Up
Acción Prioritaria │ Swap → ETH │ 🔄
Nivel Riesgo │ IL: 🟡 MEDIO │ Vol: 45%ile NORMAL
Estado General │ ✅ NORMAL │ ÓPTIMO DT (1.2x)
🎯 DeFi Context: AAVE Collateral Management
Triangle signals can be used for both traditional trading and AAVE collateral management:
🏦 What is AAVE?
AAVE is a lending protocol where you can:
Deposit collateral (ETH or USDC)
Borrow against that collateral
Switch collateral type to optimize your position
🔄 Two ways to use the signals:
💹 Traditional Trading:
▲ ETH Signal: Buy ETH with fiat
▼ USDC Signal: Sell ETH for fiat
Goal: Profit by buying low and selling high
🏦 AAVE Management (Recommended for DeFi):
▲ Swap → ETH: Switch your collateral from USDC to ETH (expecting ETH to rise)
▼ Swap → USDC: Switch your collateral from ETH to USDC (expecting ETH to fall)
Goal: Optimize collateral value without changing total amount
💡 Practical AAVE Example:
You have $10,000 in USDC as collateral in AAVE
↓
▲E Early ETH appears
↓
You switch your collateral: $10,000 USDC → $10,000 ETH
↓
If ETH rises 20%, your collateral is worth $12,000
↓
▼E Early USDC appears
↓
You switch back: $12,000 ETH → $12,000 USDC
↓
You gained $2,000 by optimizing your collateral
⚠️ Advantages of the AAVE approach:
No extra money needed – use existing collateral
Loan remains active – continue using borrowed USDC for LP
Lower taxes – collateral swaps vs buy/sell
Higher efficiency – optimize without changing main strategy
🎯 Strategies by Profile
🟢 Conservative – "Confirmations Only":
Follow only: ▲C/▼C (Confirmation signals)
Ignore: Early signals (too risky)
Strategy: Switch only when trend is confirmed
Result: Fewer changes, more safety
🟡 Balanced – "Gradual":
Early: ▲E/▼E (25% of position)
Confirm: ▲C/▼C (50% additional)
DCA: ▲D/▼D (remaining 25%)
Result: Balanced risk/optimization
🔴 Aggressive – "Full Cycle":
Early: ▲E/▼E (50% immediately)
Confirm: ▲C/▼C (30% additional)
Each DCA: ▲D/▼D (maintain full optimization)
Result: Maximum optimization, maximum risk
📈 Advanced Configuration (Optional)
🔬 CFB Adaptive MOGALEF (Enabled by Default)
CFB Adaptive Ranges: Smart system that adjusts ranges based on market volatility and momentum.
Enabled (default): Ranges adapt automatically
Disabled: Uses fixed ranges based on your setup
Manual Override: Full manual control if desired
🤖 Machine Learning: Learns from past signals (last 20) and improves accuracy automatically. If ML Signal Quality > 70%, signals are highly reliable.
💰 Yield Optimization: Suggests when to switch between conservative and aggressive for better returns:
"OPTIMAL": Your current setup is fine
"GO CONSERVATIVE": You could earn more with wider, safer ranges
"GO AGGRESSIVE": You could earn more with tighter ranges (more risk!)
📊 Portfolio Tracker: Tracks estimated P&L starting from $10,000. Includes LP and IL fees, excludes gas fees. Use as a trend indicator.
Manual Override (Experts Only)
To customize:
Enable "Override Manual" in Advanced Settings
Manually adjust your preferred range
To return to automatic: disable override
📝 Detailed Input Configuration (Advanced)
👤 Basic User Configuration
Strategy Mode: Select your base risk profile
Conservative (±20%): Prioritize safety over returns. Ideal for beginners or large capital (> $50K)
Balanced (±10%): Balance between safety and returns. Recommended for most users
Aggressive Day Trading (±5%): For active users who monitor frequently. Higher returns, more risk
Scalper Ultra (±2%): For professionals only. Requires constant monitoring
Timeframe: Adjust strategy frequency
Scalping (minutes): 50% narrower ranges. For very active trading
Day Trading (hours): 20% narrower ranges. For review every few hours
Swing (days): 20% wider ranges. For daily review
Position (weeks): 80% wider ranges. For weekly review
🔬 CFB Adaptive MOGALEF
CFB Length (8): Period for CFB filter. Lower = more sensitive
CFB Adaptive Length (20): Period for adaptive volatility. Affects band adjustment speed
CFB Band Multiplier (2.0): Band width. Higher = wider bands
CFB Smoothing (3): Volatility smoothing. Reduces noise
CFB Adaptive Ranges (true): Enable/disable adaptive system
CFB Sensitivity (1.0): Filter sensitivity. 0.3 = conservative, 3.0 = very aggressive
🎛️ Advanced Settings
Dynamic Ranges (true): Adjust ranges based on market conditions
Breakout Protection (true): Automatically widens ranges during breakouts
IL Alerts (true): Shows Impermanent Loss warnings
Manual Override (false): Disables automation, uses manual range
Manual Range % (5.0): Fixed range if override is enabled
📈 TradingLatino Core
Fast EMA (10): Fast moving average period. Lower = more sensitive
Slow EMA (55): Slow moving average period. Determines main trend
ADX Length (14): ADX calculation period. Industry standard
ADX Threshold (23): Minimum ADX to consider strong trend
🏊♂️ Pool Management
Pool Range Tolerance % (20.0): % of price movement considered valid for pool
Missed Opportunity Window (24): Bars to keep missed opportunity visible
Recommendation: Use default settings until familiar with the system. Values are optimized for balance between precision and usability.

Multi-Timeframe Bias DashboardTransform your trading with this comprehensive bias indicator that provides real-time directional insights across multiple timeframes simultaneously. Built for serious traders who demand precision and clarity in their market analysis.
What It Does
Smart Bias Detection: Automatically identifies market bias (Bullish, Bearish, or Neutral) using advanced price action analysis including:
High/Low sweeps for momentum confirmation
Candle close analysis (bullish/bearish closes)
Inside/Outside bar logic for context awareness
Real-time bias calculations that update with each new bar
Multi-Timeframe Coverage: Analyze market structure across 4 customizable timeframes from 1 minute to Monthly, giving you a complete view of market alignment and potential divergences.
⚡ Key Features
�� Fully Customizable Dashboard
Color Themes: Customize bullish, bearish, neutral, header, row, and border colors
Text Sizing: Choose Small, Normal, or Large text for optimal visibility
Panel Positioning: Place dashboard at Top/Bottom, Left/Right corners
Professional Styling: Clean, QuickBooks-style interface design
�� Smart Alert System
Individual Timeframe Alerts: Enable/disable alerts for specific timeframes
Bias Change Detection: Get notified only when bias actually changes
Custom Alert Messages: Personalize your alert notifications
Multiple Sound Options: Choose from Default, Bell, Chime, Alert, or Notification sounds
⏰ Flexible Timeframe Selection
Preset Options: 1M, 2M, 3M, 4M, 5M, 10M, 15M, 16M, 30M, 45M
Hourly Options: 1H, 1.5H, 2H, 3H, 4H, 6H
Daily Options: Daily, 2D, 3D
Extended Options: Weekly, Monthly
🚀 Trading Applications
Multi-Timeframe Analysis
Trend Alignment: Identify when multiple timeframes agree on direction
Divergence Detection: Spot potential reversal points with conflicting biases
Entry Confirmation: Use bias alignment for high-probability trade setups
Risk Management: Avoid trading against strong multi-timeframe bias
Real-Time Decision Making
Live Updates: Bias calculations update with each new bar
Visual Clarity: Color-coded results for instant recognition
Professional Layout: Clean, organized information display
Chart Integration: Overlay display for seamless chart analysis
�� Perfect For
Swing Traders: Daily and weekly bias analysis
Day Traders: Intraday timeframe combinations
Position Traders: Multi-timeframe trend confirmation
Technical Analysts: Price action and bia
Risk Managers: Multi-timeframe market structure analysis
�� How to Use
Select Timeframes: Choose 4 timeframes from the comprehensive dropdown menu
Enable Display: Use checkboxes to show/hide specific timeframes
Set Alerts: Enable alerts (🔔) for timeframes you want to monitor
Customize Colors: Create your perfect visual theme
Position Dashboard: Place it where it works best for your workflow
🔒 Professional Features
Protected Branding: Watermark cannot be removed or hidden
High Performance: Optimized for real-time trading
Clean Code: Professional Pine Script v6 implementation
User Support: Comprehensive customization options
📈 Why Choose This Indicator
Unlike traditional single-timeframe indicators, this dashboard provides a unified view of market bias across multiple timeframes simultaneously. This gives you a comprehensive understanding of market structure and helps identify high-probability trading opportunities with multiple timeframe confirmation.
Transform your trading from reactive to proactive with the Multi-Timeframe Bias Dashboard!

Fair Value Gap Suite Adrian V1.0.0Brief description
The “FVG Suite” identifies fair value gaps across multiple time units, evaluates them with a displacement score, optionally filters them according to market structure events (BOS/CHOCH), and provides context-based alerts for first touch, partial and full fills, and invalidation. The aim is to show only high-quality imbalances and trade them based on rules.
What makes the script unique (originality/added value)
Displacement score: Strength of the impulse movement as a combination of (body/ATR, range/ATR, volume Z-score).
MTF aggregator: FVGs from higher timeframes are collected, ranked, and displayed as zones on the active chart (including overlap clustering).
Structure context: Optionally, only FVGs after confirmed BOS/CHOCH in the trend direction, including premium/discount evaluation relative to the HTF range.
Adaptive invalidation: FVG expires after candles, opposing BOS or defined time (e.g., end of session).
Session/instrument filter: Time window (e.g., NY/LDN), minimum tick size, ATR-based minimum gap.
Smart fill logic: Distinguishes between first touch, partial fill (≥ %), full fill (100%); alarms per event.
Statistics overlay (optional): Hit rate/expectancy per TF & session for fine-tuning the filters.
How it works (conceptually)
FVG definition (3-candle pattern): Bullish if High < Low (bearish analog). Size = gap span in points.
Quality score:Score = w1*(|Body|/ATR) + w2*(Range/ATR) + w3*(Volume-Z), normalized to 0–100.
MTF scan: List of higher TFs: (customizable). Findings are merged, ranked, and displayed as zones with priority (color/opacity).
Context filter: Only FVGs that emerge after BOS/CHOCH in the direction of the current trend; optional exclusion in premium/discount areas.
Invalidation & alerts: A zone is considered active until the invalidation rule takes effect. Alerts are triggered upon: initial contact, partial/full filling, invalidation.
Important inputs
Min. FVG size: × ATRor ticks/points
Min. displacement score: (0–100)
MTF list:
BOS/CHOCH filter: On/Off (Lookback candles)
Session filter: NY/LDN/Asia (local time, weekend toggle)
Invalidation: maxBars = , Opposite BOS = On/Off, Session End = On/Off
Fill definitions: Partial fill ≥ % of the gap; Full fill = 100%
Overlay options: Zone color/transparency, HTF label, statistics overlay On/Off
Alerts (names & triggers)
FVG Suite – First Touch: Price touches an active FVG zone for the first time.
FVG Suite – Partial Fill: Partial fill ≥ configured threshold.
FVG Suite – Full Fill: Gap completely filled.
FVG Suite – Invalidated: Zone invalidated by rules. (Alert message contains: symbol, TF of the zone, direction, score, size, trigger rule.)
Use (best practices)
Trade in the trend direction with BOS/CHOCH filter; target counter-imbalances/liquidity pools.
Use session filters to avoid news spikes/illiquid periods.
Calibrate parameters for each market/TF (ATR/volume profiles differ).
Limitations
Structure labels can be reevaluated for new highs/lows (repainting of labels, not of FVG finds).
Spreads/news can generate “pseudo fills.”
Backtests/statistics are sample-dependent; no guarantee of results.
Changelog
v1.0 – First release (score model, MTF aggregator, BOS/CHOCH filter, fill alerts).
Credits
FVG concept: public ICT/SMC literature (general idea). Implementation/scoring, MTF ranking, smart fill logic: own development.
Note/disclaimer
No financial advice. For educational purposes only. Trading involves high risk; use stop losses and a fixed risk budget.
FX4M by fx4_livingFX4M Simplified by fx4_living
1. Previous Period Framework
Selectable Period: Prior Daily, Weekly, or Monthly.
Range Box: Full high-to-low span of the prior period, shaded by up/down close.
Body Box: Open-to-close section within the range box.
High/Low Lines: Horizontal lines at the previous period’s high/low.
Equilibrium Line: Midpoint between the previous high and low.
2. Intraday Opening Lines
Plots reference price lines for:
Daily Open
(00:00 New York) Midnight Open
09:30 AM Open
13:30 PM Open
Current-Hour Open; plus Weekly/Monthly Opens when Weekly/Monthly is selected.
Each line has its own color, style, and time/price label.
3. Intraday High/Low Tracking
Marks the current day’s highest and lowest prices.
“D-H” and “D-L” labels with time in tooltip.
4. Accumulation Range
Definition: First one-third of the selected reference period.
Shows full range (high-to-low) and body (open-to-close), shaded by up/down close.
After it ends, the Accumulation High/Low/EQ are drawn as horizontal lines.
Optional alerts mark the first time the Accumulation High or Low is reached.
5. Accumulation Range Deviation Levels
After the Accumulation period ends, horizontal levels are drawn at ±0.5, ±1.0, ±1.5 … ±3.5 of the Accumulation range size from its High/Low. Optional small labels show the level value.
Optional alerts mark the first time each deviation level is reached.
6. Previous Period Hit Detection
Marks the first time price reaches the prior period’s High, Low, or Equilibrium during the current period.
Optional alerts are possible.
7. Pre-Market Zone
Marks 05:00–06:59 New York time with a shaded box and dotted midline; color reflects up/down close. The midline can extend forward.
Displayed on intraday charts up to 15 minutes.
8. Status Table
Daily High (time & price)
Daily Equilibrium (current deviation % and price)
Daily Low (time & price)
MWD Institutional order flow (optional): shows Daily/Weekly/Monthly closes vs. their respective opens (directional arrows in colored cells).
Customizable Watermark (optional).
Enjoy
fx4_living
SmartTrade - ALMCorpHello everyone! I’d like to introduce my creation—the Smart Trade indicator. I’ve identified certain patterns and discovered that specific moving averages, at certain deviations, can have a strong impact on price. So, what does this indicator do?
It uses the daily timeframe as the basis for displaying levels. For each cryptocurrency, a unique deviation coefficient is calculated for each level. Essentially, we take two deviation zones—the buy zone and the sell zone—treating them as 0 and 1, respectively. From there, we can plot internal levels based on the Fibonacci sequence.
To summarize:
The indicator displays two main zones (buy/sell).
It also shows internal Fibonacci levels, which exert strong influence on price movements.
For convenience, each level is marked with its corresponding numerical value.
Key Levels for Altcoins: The 0.25–0.5 Range and Imbalance
For many altcoins, the most critical levels are 0.25 and 0.5. Prices tend to stay within this range most of the time—breaking beyond these levels signals a market imbalance, which is usually short-lived.
Example Scenario:
Normal Movement: Price moves between 0.25 (support) and 0.5 (resistance).
Downside Break (Imbalance): If price falls below 0.25 into the buy zone (green area), the failure to hold 0.25 creates a strong imbalance. This typically forces price back up into its usual range.
Upside Break (Imbalance): Similarly, if price breaks above 0.5 (e.g., reaching 0.75), this also creates imbalance, and price tends to revert back down into its standard range.
Conclusion:
Most altcoins trade primarily between 0.25 and 0.5.
A breakout in either direction usually results in a temporary imbalance, which the market quickly corrects.
By recognizing these patterns, we can make more informed trading decisions.
Visualizing Imbalances – From Small to Large
In the chart above, I’ve highlighted all imbalances, ranging from minor to major.
Why This Indicator is Perfect for Spot Trading
I’ve developed a trading strategy for this indicator that displays:
Buy signals (with entry zones)
Average entry price
Sell signals
How the Buy Signals Work:
BUY 1 – Triggered when price touches the upper boundary of the buy zone.
BUY 2 – Activated when price reaches the middle of the buy zone.
BUY 3 – Executed when price tests the lower boundary of the buy zone.
This structured approach ensures you capitalize on optimal entry points while managing risk.
Understanding the Average Entry Line & Profit-Taking System
You may have noticed an additional line on the chart above, displayed alongside the buy signals. This is the average entry line, which represents your mean entry price—calculated based on executing equal-sized purchases at each buy signal (BUY 1, BUY 2, BUY 3).
Where to Sell? Smart Profit-Taking Rules
While precise entries are critical, knowing when to exit is equally important. Here’s how the system works:
Primary Take-Profit Level (0.375)
Historically, this level offers the optimal balance for quick profit-taking.
Adaptive Exit Strategy
If the position is unprofitable by the time of closure, the system automatically shifts the exit to the next higher level (0.5).
This ensures you lock in greater gains when the market favors your trade.
Advanced Performance Tracking & Asset Selection
The indicator provides comprehensive trade analytics, displayed in the bottom-right information panel:
Trade count tracking (total number of executed trades)
Cumulative profitability (combined returns across all trades)
Average profitability per trade (total returns ÷ trade count)
How to Leverage This Data
These metrics allow you to:
Identify high-potential assets
Example: Asset A shows 5% average profit/trade vs. Asset B with 40% → prioritize Asset B for spot trading.
Filter for optimal volatility
Higher average profitability often correlates with stronger momentum/volatility.
Multi-Market Utility
While designed for spot trading, the indicator’s imbalance detection (described earlier) also works for:
Futures market analysis
Entry point identification
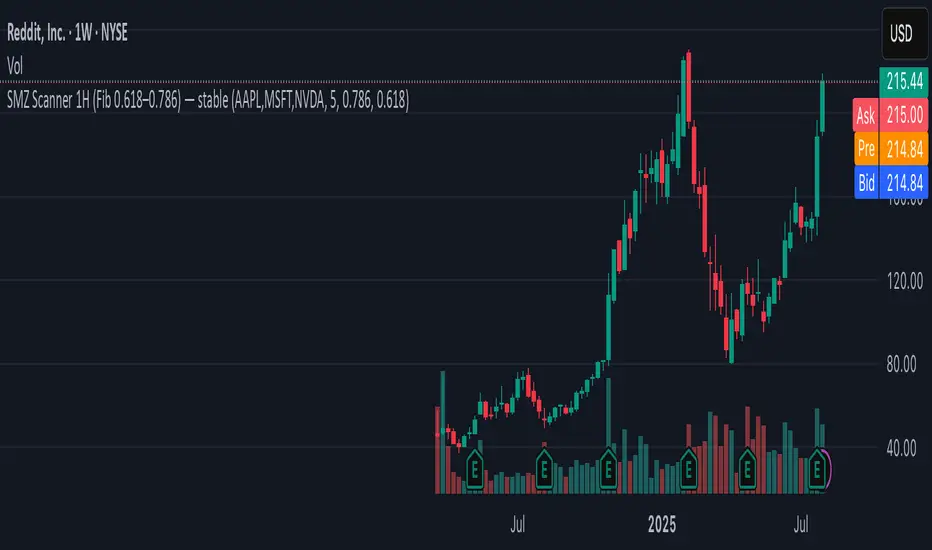
SMZ Scanner 1H (Fib 0.618–0.786) — stableQuickly spot when your watchlist tickers enter high-probability Smart Money Zones. This scanner checks up to 40 symbols on 1-hour candles, using the 0.618–0.786 Fibonacci retracement of the latest impulse leg (based on swing highs/lows).
What it does:
• Scans your custom list of tickers (up to 40 at once).
• Identifies fresh bullish or bearish impulses.
• Marks when price enters the key Fib retracement zone.
• Sends one clean alert per bar with all tickers that just hit.
Perfect for:
Swing traders and intraday traders tracking Smart Money Zone re-entries without flipping through dozens of charts.
Angle Market Structure [BigBeluga]🔵 OVERVIEW
Angle Market Structure is a smart pivot-based tool that dynamically adapts to price action by accelerating breakout and breakdown detection. It draws market structure levels based on pivot highs/lows and gradually adjusts those levels closer to price using an angle threshold. Upon breakout, the indicator projects deviation zones with labeled levels (+1, +2, +3 or −1, −2, −3) to track price extension beyond structure.
🔵 CONCEPTS
Adaptive Market Structure: Uses pivots to define structure levels, which dynamically angle closer to price over time to capture breakouts sooner.
Breakout Acceleration: Pivot high levels decrease and pivot low levels increase each bar using a user-defined angle (based on ATR), improving reactivity.
Deviation Zones: Once a breakout or breakdown occurs, 3 deviation levels are projected to show how far price extends beyond the breakout point.
Count Labels: Each successful structure break is numbered sequentially, giving traders insight into momentum and trend persistence.
Visual Clarity: The script uses colored pivot points, trend lines, and extension labels for easy structural interpretation.
🔵 FEATURES
Calculates pivot highs and lows using a customizable length.
Applies an angle modifier (ATR-based) to gradually pull levels closer to price.
Plots breakout and breakdown lines in distinct colors with automatic extension.
Shows deviation zones (+1, +2, +3 or −1, −2, −3) after breakout with customizable size.
Color-coded labels for trend break count (bullish or bearish).
Dynamic label sizing and theme-aware colors.
Smart label positioning to avoid chart clutter.
Built-in limit for deviation zones to maintain clarity and performance.
🔵 HOW TO USE
Use pivot-based market structure to identify breakout and breakdown zones.
Watch for crossover (up) or crossunder (down) events as trend continuation or reversal signals.
Observe +1/+2/+3 or -1/-2/-3 levels for overextension opportunities or trailing stop ideas.
Use breakout count as a proxy for trend strength—multiple counts suggest momentum.
Combine with volume or order flow tools for higher confidence entries at breakout points.
Adjust the angle setting to fine-tune sensitivity based on market volatility.
🔵 CONCLUSION
Angle Market Structure enhances traditional pivot-based analysis by introducing breakout acceleration and structured deviation tracking. It’s a powerful tool for traders seeking a cleaner, faster read on market structure and momentum strength—especially during impulsive price moves or structural transitions.

Sniper NAS100 Swiss Knife IndicatorSniper Trading System – Master Indicator
Description:
“Trade with the precision of the market makers themselves.”
The Sniper Trading System – Master Indicator is the crown jewel of institutional-level trading tools, engineered for those who demand perfect timing, deadly accuracy, and surgical execution in any market.
Designed by a 3× ASCAP Award-winning, multi–funded prop firm trader, this system fuses algorithmic precision with battle-tested price action logic, delivering an unmatched trading edge across Forex, Futures, Indices, and Crypto.
Core Features
Dealer Range Mapping – Auto-detects the hidden accumulation/distribution zones that drive market direction.
Multi-Standard Deviation Targets – Projected with gradient precision (+1 to +4 / -1 to -4) for scalps or swing holds.
12 AM Bias Candle Logic – Reveals the true daily directional bias before the herd even wakes up.
Liquidity Sweep Detection – Spots equal highs/lows & engineered stop hunts before the main move.
Kill Zone Time Windows – Pre-programmed with the London Session Sniper Hours & New York Precision Plays.
Multi-Timeframe RSI Filter – Filters false signals & highlights exhaustion points for sniper entries.
Dynamic Alerts – Fire real-time push, email, or webhook notifications for entry, exit, and confluence events.
How It Works
Identify Bias – Use the 12 AM candle + DXY/RSI overlays to confirm bullish or bearish control.
Wait for Liquidity Sweep – Let the market makers hunt stops; your job is to wait.
Execute at Kill Zones – Follow the preloaded precision entry times for God-tier sniper plays.
Ride to Target Zones – Exit at projected standard deviation levels for mathematically consistent profits.
Ideal For
Day Traders looking for clean entries and exits.

ADVANCED EMA RIBBON SUITE PRO [Multi-Timeframe + Alerts + Dash]🎯 ADVANCED EMA RIBBON SUITE PRO
📊 DESCRIPTION:
The most comprehensive EMA Ribbon indicator on TradingView, featuring 14 customizable
EMAs (5-200), multi-timeframe analysis, gradient ribbon visualization, smart alerts,
and a real-time dashboard. Perfect for trend following, scalping, and swing trading.
🔥 KEY FEATURES:
• 14 EMAs with Fibonacci sequence option (5, 8, 13, 21, 34, 55, 89, 144, 200)
• Multi-Timeframe (MTF) analysis - see higher timeframe trends
• Dynamic gradient ribbon with trend-based coloring
• Golden Cross & Death Cross detection with alerts
• Professional themes (Dark/Light) with 6 visual styles
• Real-time information dashboard
• Customizable transparency and colors
• Trend strength visualization
• Price position analysis
• Smart alert system for all major crossovers
📈 USE CASES:
• Trend Identification: Ribbon expansion/contraction shows trend strength
• Entry/Exit Signals: EMA crossovers provide clear trade signals
• Support/Resistance: EMAs act as dynamic S/R levels
• Multi-Timeframe Confluence: Combine timeframes for higher probability trades
• Scalping: Use faster EMAs (5-20) for quick trades
• Swing Trading: Focus on 50/200 EMAs for position trades
🎯 TRADING STRATEGIES:
1. Ribbon Squeeze: Trade breakouts when ribbon contracts
2. Golden/Death Cross: Major trend reversals at 50/200 crosses
3. Price Above/Below: Long when price above most EMAs, short when below
4. MTF Confluence: Trade when multiple timeframes align
5. Dynamic S/R: Use EMAs as trailing stop levels
⚡ OPTIMAL SETTINGS:
• Scalping: 5, 8, 13, 21 EMAs on 1-5 min charts
• Day Trading: Full ribbon on 15-60 min charts
• Swing Trading: Focus on 50, 100, 200 EMAs on daily charts
• Position Trading: Use weekly timeframe with monthly MTF
📌 KEYWORDS:
EMA, Exponential Moving Average, Ribbon, Multi-Timeframe, MTF, Golden Cross,
Death Cross, Trend Following, Scalping, Swing Trading, Dashboard, Alerts,
Support Resistance, Fibonacci, Professional, Advanced, Suite, Indicator
*Created using PineCraft AI (Link in Bio)

XAUUSD 1H – FVG Buy/Sell Signals XAUUSD 1H – Fair Value Gap (FVG) Buy/Sell Signals (No Boxes)
What it is:
A clean, signal-only indicator for Gold on the 1-hour chart. It detects 3-bar Fair Value Gaps, waits for a deep retest, then confirms with strong candle structure + trend + ADX before printing a BUY/SELL arrow. No rectangles or clutter—just selective, high-quality signals.
Why it works:
Instead of chasing breakouts, the script hunts for imbalances (FVGs) where price often returns to “fair value.” It only fires when:
price revisits the gap by a configurable depth,
the candle closes beyond the far edge with a small buffer,
the candle body is ≥ ATR × K (confirms intent),
the broader trend (EMA-50/EMA-200) agrees, and
ADX (Wilder, manual) shows sufficient strength.
Key features
✅ Signal-only: arrows/labels—no boxes on chart.
✅ Deep retest logic (percentage of zone), not just a touch.
✅ Strong close filter (edge + buffer) + ATR body filter.
✅ Trend filter (EMA-50 vs EMA-200) to keep trades with the regime.
✅ ADX strength to avoid chop.
✅ One signal per zone (optional “delete on use”).
✅ Alerts for both BUY and SELL.
✅ Built for Pine v6, non-repainting logic on bar close.
Inputs you can tune
Min FVG size (pts) – ignore tiny gaps.
Retest depth (%) – how deep price must come back into the gap.
Close buffer (pts) – extra confirmation beyond zone edge.
Min body ≥ ATR× – candle strength requirement.
Min ADX – trend strength threshold.
Expire after X bars – keep zones fresh.
Delete zone after signal – true = one-shot signals.
How I use it
Apply to XAUUSD 1H.
Keep default filters for selective signals.
For more setups, lower Min FVG size or ADX and reduce retest depth; for stricter signals, do the opposite.
Combine with S/R or session timing (London/NY) for added confluence.
Notes
Signals are generated on bar close.
Designed for clarity and discipline—fewer, cleaner arrows over constant noise.
Works on other symbols/timeframes, but tuned for Gold 1H.
Tags: #XAUUSD #Gold #FVG #SmartMoney #1H #TrendFollowing #ADX #ATR #PineV6 #TradingView

Josh SMCAn advanced Smart Money Concepts (SMC) indicator that automatically detects and visualizes:
✅ Market Structure: BOS (Break of Structure) & CHoCH (Change of Character) for both Swing and Internal structures
✅ Order Blocks: Bullish & Bearish (Swing & Internal) with breaker block detection and mitigation logic
✅ Fair Value Gaps (FVG): Automatic bullish/bearish FVG detection with extension options
✅ Liquidity Levels: Equal Highs/Lows with strong/weak level identification
✅ Premium/Discount Zones: Dynamic zones based on real-time price extremes
✅ Multi-Timeframe Levels: Daily, Weekly, Monthly high/low levels with customizable styles
🔹 Designed for traders who follow ICT / Smart Money principles
🔹 Perfect for identifying high-probability setups in Forex, Indices, Gold, and Crypto markets
🔹 Protected Access: Requires owner approval before use – for VIP members and authorized users only
📈 How to Use:
Wait for structure shift confirmation (BOS/CHoCH)
Identify confluence with Order Block + FVG + Liquidity levels
Enter trades in line with the higher-timeframe bias for maximum accuracy

Clean Multi-Indicator Alignment System
Overview
A sophisticated multi-indicator alignment system designed for 24/7 trading across all markets, with pure signal-based exits and no time restrictions. Perfect for futures, forex, and crypto markets that operate around the clock.
Key Features
🎯 Multi-Indicator Confluence System
EMA Cross Strategy: Fast EMA (5) and Slow EMA (10) for precise trend direction
VWAP Integration: Institution-level price positioning analysis
RSI Momentum: 7-period RSI for momentum confirmation and reversal detection
MACD Signals: Optimized 8/17/5 configuration for scalping responsiveness
Volume Confirmation: Customizable volume multiplier (default 1.6x) for signal validation
🚀 Advanced Entry Logic
Initial Full Alignment: Requires all 5 indicators + volume confirmation
Smart Continuation Entries: EMA9 pullback entries when trend momentum remains intact
Flexible Time Controls: Optional session filtering or 24/7 operation
🎪 Pure Signal-Based Exits
No Forced Closes: Positions exit only on technical signal reversals
Dual Exit Conditions: EMA9 breakdown + RSI flip OR MACD cross + EMA20 breakdown
Trend Following: Allows profitable trends to run their full course
Perfect for Swing Scalping: Ideal for multi-session position holding
📊 Visual Interface
Real-Time Status Dashboard: Live alignment monitoring for all indicators
Color-Coded Candles: Instant visual confirmation of entry/exit signals
Clean Chart Display: Toggle-able EMAs and VWAP with professional styling
Signal Differentiation: Clear labels for entries, X-crosses for exits
🔔 Alert System
Entry Notifications: Separate alerts for buy/sell signals
Exit Warnings: Technical breakdown alerts for position management
Mobile Ready: Push notifications to TradingView mobile app
Market Applications
Perfect For:
Gold Futures (GC): 24-hour precious metals trading
NASDAQ Futures (NQ): High-volatility index scalping
Forex Markets: Currency pairs with continuous operation
Crypto Trading: 24/7 cryptocurrency momentum plays
Energy Futures: Oil, gas, and commodity swing trades
Optimal Timeframes:
1-5 Minutes: Ultra-fast scalping during high volatility
5-15 Minutes: Balanced approach for most markets
15-30 Minutes: Swing scalping for trend following
🧠 Smart Position Management
Tracks implied position direction
Prevents conflicting signals
Allows trend continuation entries
State-aware exit logic
⚡ Scalping Optimized
Fast-reacting indicators with shorter periods
Volume-based confirmation reduces false signals
Clean entry/exit visualization
Minimal lag for time-sensitive trades
Configuration Options
All parameters fully customizable:
EMA Lengths: Adjustable from 1-30 periods
RSI Period: 1-14 range for different market conditions
MACD Settings: Fast (1-15), Slow (1-30), Signal (1-10)
Volume Confirmation: 0.5-5.0x multiplier range
Visual Preferences: Colors, displays, and table options
Risk Management Features
Clear visual exit signals prevent emotion-based decisions
Volume confirmation reduces false breakouts
Multi-indicator confluence improves signal quality
Optional time filtering for session-specific strategies
Best Use Cases
Futures Scalping: NQ, ES, GC during active sessions
Forex Swing Trading: Major pairs during overlap periods
Crypto Momentum: Bitcoin, Ethereum trend following
24/7 Automated Systems: Algorithmic trading implementation
Multi-Market Scanning: Portfolio-wide signal monitoring

VHX EMA 135/315📈 EMA 135/315 Cross Strategy – Your Trend Compass with Smart Confirmations
🔍 Core Idea
The EMA 135/315 Cross strategy is a trend-following system.
It tracks two moving averages:
EMA 135 → the “fast” line that reacts to short-term price moves
EMA 315 → the “slow” line that reacts to the bigger trend
When the fast EMA crosses above the slow EMA → market momentum is turning up → BUY signal 🟢
When the fast EMA crosses below the slow EMA → momentum is turning down → SELL signal 🔴
This gives you a clear entry trigger — no guessing, no overcomplication.
✨ On Your Chart
BUY/SELL Arrows
🟢 Green arrow = bullish cross → trend turning up
🔴 Red arrow = bearish cross → trend turning down
Trend Info Panel (Top Left)
Current Trend: BUY / SELL / Neutral
Last Cross: how many bars ago it happened
EMA Gap in %: measures the strength of the trend
Status: “Approaching” if EMAs are getting close → possible cross soon
Automatic TP/SL Levels
📈 TP line (+2% from entry)
📉 SL line (–0.5% from entry)
Saves time — you instantly see your target and protection
EMA Distance Meter
Big % gap = strong trend momentum 🚀
Small % gap = weak or sideways market ⚠️
Real-Time Alerts
You get notified when a cross happens, even if you’re away from the screen
🧠 The Logic Behind It
The EMA 135 reacts faster → it reflects short-term momentum
The EMA 315 moves slower → it reflects the main trend
When the fast EMA overtakes the slow EMA: short-term strength now aligns with the long-term trend → higher probability of a sustained move
The gap % tells you how strong the alignment is — large gap = cleaner moves, small gap = market in transition
“Approaching” status warns that the EMAs are converging, which often happens before a reversal
📊 Boosting the Strategy with Volume Analysis
The EMA cross is a strong trigger, but volume confirms the quality of the move:
High Volume + Cross → more reliable signal, as strong market participation is pushing the trend
Low Volume + Cross → caution, the move might be weak or a false breakout
💡 Tip:
Check the volume histogram or a volume-based indicator (e.g., Volume Profile, OBV).
On a BUY signal: volume should spike above the recent average.
On a SELL signal: watch for strong selling volume bars.
📍 Adding Support & Resistance for Precision
Support and resistance levels help filter out bad trades and optimize entries:
Best BUY setups:
EMA 135 crosses above EMA 315 near a known support zone
Bonus if volume confirms the move
Avoid buying directly into a strong resistance
Best SELL setups:
EMA 135 crosses below EMA 315 near a known resistance zone
Bonus if selling volume is strong
Avoid selling directly into a major support
💡 Use tools like horizontal lines, previous highs/lows, and Volume Profile nodes to spot these zones.
📈 Best Usage Practices
Timeframes
Lower timeframes (1m–5m) → more signals, but more noise → best for scalping with extra filters
Always Combine With Confirmation
EMA Cross = Trigger
Volume spike = Confirmation
S/R zone in your favor = High-probability setup
Manage Risk
Start with the built-in TP/SL
Adjust SL if volatility is higher than usual
Consider trailing stop once price moves in your favor
Avoid Sideways Markets
If EMA gap % is very small and crosses happen often → stand aside until a clear direction forms
Use Alerts
Set alerts for BUY & SELL crosses so you never miss a setup
In short:
This isn’t just an EMA cross indicator — it’s a trend system with built-in risk management, strength measurement, and pre-trade preparation. Combine it with volume confirmation and smart use of support/resistance, and you turn a simple signal into a high-probability trading edge.

Zero Lag Liquidity [AlgoAlpha]🟠 OVERVIEW
This script plots liquidity zones with zero lag using lower-timeframe wick profiles and high-volume wicks to mark key price reactions. It’s called Zero Lag Liquidity because it captures significant liquidity imbalances in real time by processing lower-TF price-volume distributions directly inside the wick of abnormal candles. The tool builds a volume histogram inside long upper/lower wicks, then calculates a local Point of Control (POC) to mark the price where most volume occurred. These levels act as visual liquidity zones, which can trigger labels, break signals, and trend detection depending on price interaction.
🟠 CONCEPTS
The core concept relies on identifying high-volume candles with unusually long wicks—often a sign of opposing liquidity. When a large upper or lower wick appears with a strong volume spike, the script builds a histogram of lower-timeframe closes and volumes inside that wick. It bins the wick into segments, sums volume per bin, and finds the POC. This POC becomes the liquidity level. The script then dynamically tracks whether price breaks above or rejects off these levels, adjusts the active trend regime accordingly, and highlights bars to help users spot continuation or reversal behavior. The logic avoids repainting or subjective interpretation by using fixed thresholds and lower-TF price action.
🟠 FEATURES
Dynamic liquidity levels rendered at POC of significant wicks, colored by bullish/bearish direction.
Break detection that removes levels once price decisively crosses them twice in the same direction.
Rejection detection that plots ▲/▼ markers when price bounces off levels intrabar.
Volume labels for each level, shown either as raw volume or percentage of total level volume.
Candle coloring based on trend direction (break-dominant).
🟠 USAGE
Use this indicator to track where liquidity has most likely entered the market via abnormal wick events. When a long wick forms with high volume, the script looks inside it (using your chosen lower timeframe) and marks the most traded price within it. These levels can serve as expected reversal or breakout zones. Rejections are marked with small arrows, while breaks trigger trend shifts and remove the level. You can toggle trend coloring to see directional bias after a breakout. Use the wick multiplier to control how selective the detector is (higher = stricter). Alerts and label modes help customize the signal for different asset types and chart styles.

Universal Futures Signals Pro – Next-Gen Day Trading IndicatorThe Universal Futures Signals Pro is a powerful, all-in-one day trading toolkit designed for futures traders seeking precision, confidence, and consistency. Whether you're trading ES, MES, NQ, MNQ, or other popular futures contracts, this indicator delivers real-time signals and advanced analytics tailored for high-performance intraday trading.
🔍 Key Features:
Smart Buy/Sell Signals based on multi-factor confluence (trend, momentum, volume, volatility).
EMA, VWAP, RSI, MACD & Order Block integration for accurate signal generation.
Signal Clustering Detector to identify high-probability trade zones.
Dynamic Risk Management: Helps define stop loss and target areas for funded evaluations.
Session Filters (RTH, ETH) and Smart Money Concepts for cleaner setups.
Professional Dashboard showing trend state, trade status, and signal count.
Alerts for trade entries, exits, signal clusters, and trend shifts.
Customizable Settings: Tailor everything from sensitivity to color schemes.
Who is it for?
Prop firm traders looking to pass evaluation accounts.
Futures scalpers and intraday traders who value precision.
Traders seeking a structured edge in volatile markets.
Works Best On:
Instruments: ES, MES, NQ, MNQ, RTY, YM, CL, GC, etc.
Timeframes: 1m to 15m (optimized for intraday precision)

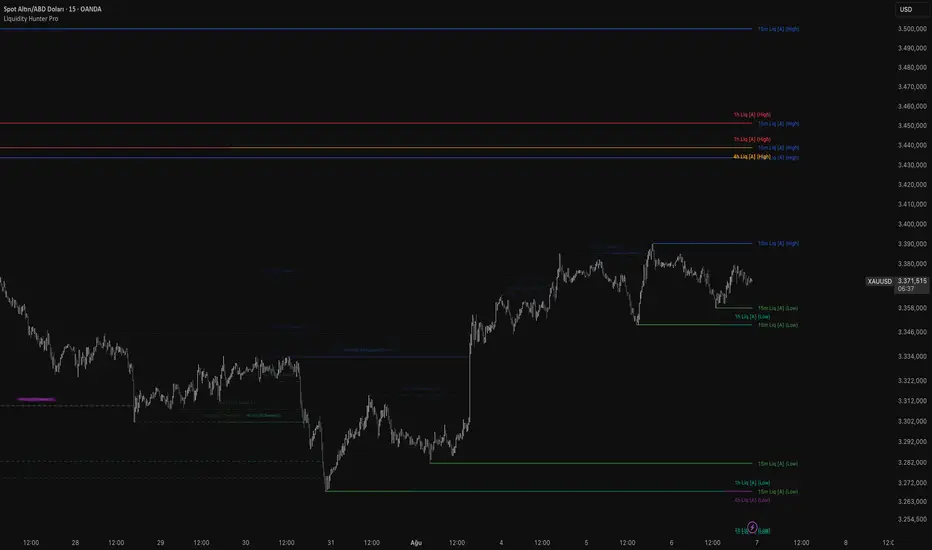
Liquidity Hunter Pro iDea TradeAutomatically detects and visualizes key liquidity levels across multiple timeframes.
Features include:
Multi-timeframe high/low liquidity mapping
Automatic and manual timeframe options
Real-time “sweep” and “touch” detection
Customizable colors and labels
Alerts for liquidity touches and sweeps
Option to display mitigated (swept) liquidity as dashed lines
How to use:
Enable the desired timeframes and alerts, adjust colors or labels to fit your style, and monitor the chart for liquidity sweeps and reactions. Use as a technical tool to spot potential support/resistance or sweep zones.
Note:
This script does not provide trading signals or financial advice. For technical analysis and educational purposes only. Always manage your risk.
Protected script. Source code is hidden but free for all TradingView users.
Gold Killzone Bias Suite🟡 Gold Killzone Bias Suite
The Gold Killzone Bias Suite is an advanced institutional-grade tool designed to generate high-confidence directional bias for XAU/USD (Gold) during the London and New York killzones.
Built for traders using a structured, confluence-driven approach, this tool blends price action, smart money principles, momentum, and volume into a real-time bias engine with a clean, easy-to-read dashboard.
🔧 Key Features
🕰️ Session-Based Bias (London / New York)
Independent bias calculation per session
Killzone times customizable with timezone support
Background highlighting (blue/red) for each session
📊 VWAP Engine
Reclaim & rejection detection
VWAP deviation alerts
Daily HTF VWAP integration
Score impact based on VWAP behaviour
📉 Market Structure (CHoCH / BOS)
Detects swing highs/lows
Labels bullish/bearish CHoCHs
Structure score contributes to session bias
💧 Liquidity Grabs
Detects stop hunts above highs / below lows
Confirms with candle rejection (body % filter)
Plots labels and adds to bias scoring
⚡ Momentum Filters
RSI: Bullish >55, Bearish <45
MACD: Histogram + Signal Line crossovers
Combined momentum score used in bias
🧠 Smart Money Proximity
Optional FVG/OB score toggle (placeholder for custom logic)
Adds static confluence for proximity-based setups
⏫ Higher Time Frame Context
Daily VWAP comparison
4H high/low structure breaks
Adds trend score to current session bias
🧠 How Bias Works
The suite uses a scoring model. Each confluence adds or subtracts points:
VWAP reclaim/reject: ±30
CHoCH/BOS: ±30
Liquidity grab: ±20
RSI/MACD: ±10
FVG/OB Proximity: +10
Daily VWAP trend: ±10
H4 Trend Break: ±10
Final Bias:
Bullish if score ≥ +20
Bearish if score ≤ -20
Neutral if between -19 and +19
A confidence % (capped at 100) is also shown, along with the contributing confluences (VWAP, Structure, Liquidity, etc.).
📋 Dashboard
A real-time dashboard shows for each session:
Session name and time
Bias (Bullish / Bearish / Neutral)
Confidence (%)
Confluences used
Position can be moved (Top Left, Top Right, etc.). Designed to be unobtrusive yet informative.
🧪 Best Practices
Use on 15m / 5m charts for intraday setups
Confirm with D1 or H4 structure for directional context
Combine with OB/FVG zones or SMT for entries
Use Trading View alerts for bias flips or liquidity grabs (custom logic can be added)
Bar Replay compatible for back testing and journaling bias shifts
🔐 Notes
Does not generate trade signals or alerts by default
Focused on bias generation and confluence stacking
Compatible with funded account trading models
📈 Built for traders who want a systematic, score-based approach to identifying directional edge in high-volume gold sessions.

FVG Pro - Advanced Multi-Timeframe iDea TradeFVG Pro – Advanced Multi-Timeframe
This indicator automatically detects and visualizes Fair Value Gaps (FVGs) across two different timeframes. Features include:
Dual-timeframe FVG detection (bullish & bearish)
Customizable display: boxes, lines, or both
Optional Fibonacci levels inside gaps (25%, 50%, 75%)
Touch tracking & “respected” status
Adjustable quality scoring and filtering
Automatic removal of filled gaps (configurable)
You can easily tailor colors, label size, and visibility for your needs.
How to use:
Enable the timeframes you want, set your visual preferences, and use the quality filter if you wish to highlight only the strongest imbalances. FVGs can be used as potential support/resistance or reaction zones—combine with your own trading strategy.
Note:
This script does not provide buy/sell signals. It is for technical analysis only and should not be considered financial advice. Please use proper risk management.
Protected script. Source code is hidden but free for all TradingView users.
