RTI Shifting Band Oscillator | QuantMAC📊 RTI Shifting Band Oscillator | QuantMAC - Revolutionary Adaptive Trading Indicator
🎯 Overview
The RTI Shifting Band Oscillator represents a breakthrough in adaptive technical analysis, combining the innovative Range Transition Index (RTI) with dynamic volatility bands to create an oscillator that automatically adjusts to changing market conditions. This cutting-edge indicator goes beyond traditional static approaches by using RTI to dynamically shift band width based on market volatility transitions, providing superior signal accuracy across different market regimes.
🔧 Key Features
Revolutionary RTI Technology : Proprietary Range Transition Index that measures volatility transitions in real-time
Dynamic Adaptive Bands : Self-adjusting volatility bands that expand and contract based on RTI readings
Dual Trading Modes : Flexible Long/Short or Long/Cash strategies for different trading preferences
Advanced Performance Analytics : Comprehensive metrics including Sharpe, Sortino, and Omega ratios
Smart Visual System : Dynamic color coding with 9 professional color schemes
Precision Backtesting : Date range filtering with detailed historical performance analysis
Real-time Signal Generation : Clear entry/exit signals with customizable threshold sensitivity
Position Sizing Intelligence : Half Kelly criterion for optimal risk management
📈 How The RTI Technology Works
The Range Transition Index (RTI) is the heart of this indicator's innovation. Unlike traditional volatility measures, RTI analyzes the transitions between different volatility states, providing early warning signals for market regime changes.
RTI Calculation Process:
Calculate True Range for each period using high, low, and previous close
Compute Average True Range over the RTI Length period
Sum absolute differences between consecutive True Range values
Normalize by dividing by ATR to create the raw RTI
Apply smoothing to reduce noise and create the final RTI value
Use RTI to dynamically adjust standard deviation multipliers
The genius of RTI lies in its ability to detect when markets are transitioning between calm and volatile periods before traditional indicators catch up. This provides traders with a significant edge in timing entries and exits.
⚙️ Comprehensive Parameter Control
RTI Settings:
RTI Length : Controls the lookback period for volatility analysis (default: 25)
RTI Smoothing : Reduces noise in RTI calculations (default: 12)
Base MA Length : Foundation moving average for band calculations (default: 40)
Source : Price input selection (close, open, high, low, etc.)
Oscillator Settings:
Standard Deviation Length : Period for volatility measurement (default: 27)
SD Multiplier : Base band width adjustment (default: 1.5)
Oscillator Multiplier : Scaling factor for oscillator values (default: 100)
Signal Thresholds:
Long Threshold : Bullish signal trigger level (default: 82)
Short Threshold : Bearish signal trigger level (default: 55)
🎨 Advanced Visual System
Main Chart Elements:
Dynamic Shifting Bands : Upper and lower bands that automatically adjust width based on RTI
Adaptive Fill Zone : Color-coded area between bands showing current market state
Basis Line : Moving average foundation displayed as subtle reference points
Smart Bar Coloring : Candles change color based on oscillator state for instant visual feedback
Oscillator Pane:
Normalized RTI Oscillator : Main signal line centered around zero with dynamic coloring
Threshold Lines : Horizontal reference lines for entry/exit levels
Zero Line : Central reference for oscillator neutrality
Color State Indication : Line colors change based on bullish/bearish conditions
📊 Professional Performance Metrics
The built-in analytics suite provides institutional-grade performance measurement:
Net Profit % : Total strategy return percentage
Maximum Drawdown % : Worst peak-to-trough decline
Win Rate % : Percentage of profitable trades
Profit Factor : Ratio of gross profits to gross losses
Sharpe Ratio : Risk-adjusted return measurement
Sortino Ratio : Downside-focused risk adjustment
Omega Ratio : Probability-weighted performance ratio
Half Kelly % : Optimal position sizing recommendation
Total Trades : Complete transaction count
🎯 Strategic Trading Applications
Long/Short Mode: ⚡
Maximizes profit potential by capturing both upward and downward price movements. The RTI technology helps identify when trends are strengthening or weakening, allowing for optimal position switches between long and short.
Long/Cash Mode: 🛡️
Conservative approach ideal for retirement accounts or risk-averse traders. The indicator's adaptive nature helps identify the best times to be invested versus sitting in cash, protecting capital during adverse market conditions.
🚀 Unique Advantages
Traditional Indicators vs RTI Shifting Bands:
Static vs Dynamic : While most indicators use fixed parameters, RTI bands adapt in real-time
Lagging vs Leading : RTI detects volatility transitions before they fully manifest
One-Size vs Adaptive : The same settings work across different market conditions
Simple vs Intelligent : Advanced volatility analysis provides superior market insight
💡 Professional Setup Guide
For Day Trading (Short-term):
RTI Length: 15-20
RTI Smoothing: 8-10
Base MA Length: 20-30
Thresholds: Long 80, Short 60
For Swing Trading (Medium-term):
RTI Length: 25-35 (default range)
RTI Smoothing: 12-15
Base MA Length: 40-50
Thresholds: Long 83, Short 55 (defaults)
For Position Trading (Long-term):
RTI Length: 40-50
RTI Smoothing: 15-20
Base MA Length: 60-80
Thresholds: Long 85, Short 50
🧠 Advanced Trading Techniques
RTI Divergence Analysis:
Watch for divergences between price action and RTI readings. When price makes new highs/lows but RTI doesn't confirm, it often signals upcoming reversals.
Band Width Interpretation:
Expanding Bands : Increasing volatility, expect larger price moves
Contracting Bands : Decreasing volatility, prepare for potential breakouts
Band Touches : Price touching outer bands often signals reversal opportunities
Multi-Timeframe Analysis:
Use RTI on higher timeframes for trend direction and lower timeframes for precise entry timing.
⚠️ Important Risk Disclaimers
Past performance is not indicative of future results. This indicator represents advanced technical analysis but should never be used as the sole basis for trading decisions.
Critical Risk Factors:
Market Conditions : No indicator performs equally well in all market environments
Backtesting Limitations : Historical performance may not reflect future market behavior
Volatility Risk : Adaptive indicators can be sensitive to extreme market conditions
Parameter Sensitivity : Different settings may produce significantly different results
Capital Risk : Always use appropriate position sizing and stop-loss protection
📚 Educational Benefits
This indicator provides exceptional learning opportunities for understanding:
Advanced volatility analysis and measurement techniques
Adaptive indicator design and implementation
The relationship between volatility transitions and price movements
Professional risk management using Kelly Criterion principles
Modern oscillator interpretation and signal generation
🔍 Market Applications
The RTI Shifting Band Oscillator works across various markets:
Forex : Excellent for currency pair volatility analysis
Stocks : Individual equity and index trading
Commodities : Adaptive to commodity market volatility cycles
Cryptocurrencies : Handles extreme volatility variations effectively
Futures : Professional derivatives trading applications
🔧 Technical Innovation
The RTI Shifting Band Oscillator represents years of research into adaptive technical analysis. The proprietary RTI calculation method has been optimized for:
Computational Efficiency : Fast calculation even on high-frequency data
Noise Reduction : Advanced smoothing without excessive lag
Market Adaptability : Automatic adjustment to changing conditions
Signal Clarity : Clear, actionable trading signals
🔔 Updates and Evolution
The RTI Shifting Band Oscillator | QuantMAC continues to evolve with regular updates incorporating the latest research in adaptive technical analysis. The code is thoroughly documented for transparency and educational purposes.
Trading Notice: Financial markets involve substantial risk of loss. The RTI Shifting Band Oscillator is a sophisticated technical analysis tool designed to assist in trading decisions but cannot guarantee profitable outcomes. Always conduct thorough testing, implement proper risk management, and consider seeking advice from qualified financial professionals. Only trade with capital you can afford to lose.
---
Master The Markets With Adaptive Intelligence! 🎯📈
在腳本中搜尋"smart"

Kijun Shifting Band Oscillator | QuantMAC🎯 Kijun Shifting Band Oscillator | QuantMAC
📊 **Revolutionary Technical Analysis Tool Combining Ancient Ichimoku Wisdom with Cutting-Edge Statistical Methods**
🌟 Overview
The Kijun Shifting Band Oscillator represents a sophisticated fusion of traditional Japanese technical analysis and modern statistical theory. Built upon the foundational concepts of the Ichimoku Kinko Hyo system, this indicator transforms the classic Kijun-sen (base line) into a dynamic, multi-dimensional analysis tool that provides traders with unprecedented market insights.
This advanced oscillator doesn't just show you where price has been – it reveals the underlying momentum dynamics and volatility patterns that drive market movements, giving you a statistical edge in your trading decisions.
🔥 Key Features & Innovations
Dual Trading Modes for Maximum Flexibility: 🚀
Long/Short Mode: Full bidirectional trading capability for aggressive traders seeking to capitalize on both bullish and bearish market conditions
Long/Cash Mode: Conservative approach perfect for risk-averse traders, taking long positions during uptrends and moving to cash during downtrends (avoiding short exposure)
Advanced Visual Intelligence: 🎨
9 Professional Color Schemes: From classic blue/navy to vibrant orange/purple combinations, each optimized for different chart backgrounds and personal preferences
Dynamic Gradient Histogram: Color intensity reflects oscillator strength, providing instant visual feedback on momentum magnitude
Intelligent Overlay Bands: Semi-transparent fills create clear visual boundaries without cluttering your chart
Smart Candle Coloring: Real-time color changes reflect current market state and trend direction
Customizable Threshold Lines: Clearly marked entry and exit levels with contrasting colors
Professional-Grade Analytics: 📊
Real-Time Performance Metrics: Live calculation of 9 key performance indicators
Risk-Adjusted Returns: Sharpe, Sortino, and Omega ratios for comprehensive performance evaluation
Position Sizing Guidance: Half-Kelly percentage for optimal risk management
Drawdown Analysis: Maximum drawdown tracking for risk assessment
📈 Deep Technical Foundation
Kijun-Based Mathematical Framework: 🧮
The indicator begins with the traditional Kijun-sen calculation but extends it significantly:
Statistical Enhancements: 📉
Adaptive Volatility: Bands expand and contract based on market volatility
Momentum Filtering: EMA smoothing of oscillator for trend confirmation
State Management: Intelligent signal filtering prevents whipsaws and false signals
Multi-Timeframe Compatibility: Optimized algorithms work across all timeframes
⚙️ Comprehensive Parameter Control
Kijun Core Settings: 🎛️
Kijun Length (Default: 30): Controls the lookback period for the base calculation. Shorter periods = more responsive, longer periods = smoother signals
Source Selection: Choose from Close, Open, High, Low, or HL2. Close price recommended for most applications
Calculation Method: Uses traditional Ichimoku methodology ensuring compatibility with classic analysis
Advanced Oscillator Configuration: 📊
Standard Deviation Length (Default: 36): Determines volatility measurement period. Affects band width and sensitivity
SD Multiplier (Default: 2.1): Fine-tune band distance from basis line. Higher values = wider bands, lower values = tighter bands
Oscillator Multiplier (Default: 100): Scales the final oscillator output. Useful for matching other indicators or personal preference
Smoothing Algorithm: Built-in EMA smoothing prevents noise while maintaining responsiveness
Signal Threshold Optimization: 🎯
Long Threshold (Default: 83): Oscillator level that triggers long entries. Higher values = fewer but stronger signals
Short Threshold (Default: 42): Oscillator level that triggers short entries. Lower values = fewer but stronger signals
Threshold Logic: Crossover-based system with state management prevents signal overlap
Customization Range: Fully adjustable to match your trading style and risk tolerance
Precision Date Control: 📅
Start Date/Month/Year: Precise backtesting control down to the day
Historical Analysis: Test strategies on specific market periods or events
Strategy Validation: Isolate performance during different market conditions
📊 Professional Metrics Dashboard
Risk Assessment Metrics: 💼
Maximum Drawdown %: Largest peak-to-trough decline in portfolio value. Critical for understanding worst-case scenarios and position sizing
Sortino Ratio: Risk-adjusted return measure focusing only on downside volatility. Superior to Sharpe ratio for asymmetric return distributions
Sharpe Ratio: Classic risk-adjusted performance metric. Values above 1.0 considered good, above 2.0 excellent
Omega Ratio: Probability-weighted ratio capturing all moments of return distribution. More comprehensive than Sharpe or Sortino
Performance Analytics: 📈
Profit Factor: Gross Profit ÷ Gross Loss. Values above 1.0 indicate profitability, above 2.0 considered excellent
Win Rate %: Percentage of profitable trades. Consider alongside average win/loss size for complete picture
Net Profit %: Total return on initial capital. Accounts for compounding effects
Total Trades: Sample size for statistical significance assessment
Advanced Position Sizing: 🎯
Half Kelly %: Optimal position size based on Kelly Criterion, reduced by 50% for safety margin
Risk Management: Helps determine appropriate position size relative to account equity
Mathematical Foundation: Based on win probability and profit factor calculations
Practical Application: Directly usable percentage for position sizing decisions
🎨 Advanced Display Options
Flexible Interface Design: 🖥️
6 Positioning Options: Top/Bottom/Middle × Left/Right combinations for optimal chart organization
Toggle Functionality: Show/hide metrics table for clean chart presentation during analysis
Color Coordination: Metrics table colors match selected oscillator color scheme
Professional Styling: Clean, readable format with proper spacing and alignment
Visual Hierarchy: 🎭
Oscillator Histogram: Primary focus with gradient intensity showing momentum strength
Threshold Lines: Clear horizontal references for entry/exit levels
Zero Line: Neutral reference point for trend bias determination
Background Bands: Subtle overlay context without chart clutter
🚀 Advanced Signal Generation System
Multi-Layer Signal Logic: ⚡
Primary Signal Generation: Oscillator crossover above Long Threshold (default 83) triggers long entries
Exit Signal Processing: Oscillator crossunder below Short Threshold (default 42) triggers position exits
State Management System: Prevents duplicate signals and ensures clean position transitions
Mode-Specific Logic: Different behavior for Long/Short vs Long/Cash modes
Date Range Filtering: Signals only generated within specified backtesting period
Confirmation Requirements: Bar confirmation prevents false signals from intrabar price spikes
Intelligent Position Management: 🧠
Entry Tracking: Precise entry price recording for accurate P&L calculations
Position State Monitoring: Continuous tracking of long/short/cash positions
Automatic Exit Logic: Seamless position closure and new position initiation
Performance Calculation: Real-time P&L tracking with compounding effects
📉📈 Comprehensive Band Interpretation Guide
Dynamic Band Analysis: 🔍
Upper Band Function: Represents dynamic resistance based on recent volatility. Price approaching upper band suggests potential reversal or breakout
Lower Band Function: Represents dynamic support with volatility adjustment. Price near lower band indicates oversold conditions or support testing
Middle Line (Basis): Trend direction indicator. Price above = bullish bias, price below = bearish bias
Band Width Interpretation: Wide bands = high volatility, narrow bands = low volatility/potential breakout setup
Band Slope Analysis: Rising bands = strengthening trend, falling bands = weakening trend
Oscillator Interpretation: 📊
Values Above 50: Price in upper half of recent range, bullish momentum
Values Below 50: Price in lower half of recent range, bearish momentum
Extreme Values (>80 or <20): Overbought/oversold conditions, potential reversal zones
Momentum Divergence: Oscillator direction vs price direction for early reversal signals
Trend Confirmation: Oscillator direction confirming or contradicting price trends
💡 Strategic Trading Applications
Primary Trading Strategies: 🎯
Trend Following: Use threshold crossovers to capture major directional moves. Best in trending markets with clear directional bias
Mean Reversion: Identify extreme oscillator readings for counter-trend opportunities. Effective in range-bound markets
Breakout Trading: Monitor band compressions followed by expansions for breakout signals
Swing Trading: Combine oscillator signals with band interactions for swing position entries/exits
Risk Management: Use metrics dashboard for position sizing and risk assessment
Market Condition Optimization: 🌊
Trending Markets: Increase threshold separation for fewer, stronger signals
Choppy Markets: Decrease threshold separation for more responsive signals
High Volatility: Increase SD multiplier for wider bands
Low Volatility: Decrease SD multiplier for tighter bands and earlier signals
⚙️ Advanced Configuration Tips
Parameter Optimization Guidelines: 🔧
Kijun Length Adjustment: Shorter periods (10-20) for faster signals, longer periods (50-100) for smoother trends
SD Length Tuning: Match to your trading timeframe - shorter for responsive, longer for stability
Threshold Calibration: Backtest different levels to find optimal entry/exit points for your market
Color Scheme Selection: Choose schemes that provide best contrast with your chart background and other indicators
Integration with Other Indicators: 🔗
Volume Indicators: Confirm oscillator signals with volume spikes
Support/Resistance: Use key levels to filter oscillator signals
Momentum Indicators: RSI, MACD confirmation for signal strength
Trend Indicators: Moving averages for overall trend bias confirmation
⚠️ Important Usage Notes & Limitations
Indicator Characteristics: ⚡
Lagging Nature: Based on historical price data - signals occur after moves have begun
Best Practice: Combine with leading indicators and price action analysis
Market Dependency: Performance varies across different market conditions and instruments
Backtesting Essential: Always validate parameters on historical data before live implementation
Optimization Recommendations: 🎯
Parameter Testing: Systematically test different combinations on your preferred instruments
Walk-Forward Analysis: Regularly re-optimize parameters to maintain effectiveness
Market Regime Awareness: Adjust parameters for different market conditions (trending vs ranging)
Risk Controls: Implement maximum drawdown limits and position size controls
🔧 Technical Specifications
Performance Optimization: ⚡
Efficient Algorithms: Optimized calculations for smooth real-time operation
Memory Management: Smart array handling for metrics calculations
Visual Optimization: Balanced detail vs performance for responsive charts
Multi-Symbol Ready: Consistent performance across different assets
---
The Kijun Shifting Band Oscillator represents the evolution of technical analysis, bridging the gap between traditional methods and modern quantitative approaches. This indicator provides traders with a comprehensive toolkit for market analysis, combining the intuitive wisdom of Japanese candlestick analysis with the precision of statistical mathematics.
🎯 Designed for serious traders who demand professional-grade analysis tools with institutional-quality metrics and risk management capabilities. Whether you're a discretionary trader seeking visual confirmation or a systematic trader building quantitative strategies, this indicator provides the foundation for informed trading decisions.
⚠️ IMPORTANT DISCLAIMER
Past Performance Warning: 📉⚠️
PAST PERFORMANCE IS NOT INDICATIVE OF FUTURE RESULTS. Historical backtesting results, while useful for strategy development and parameter optimization, do not guarantee similar performance in live trading conditions. Market conditions change continuously, and what worked in the past may not work in the future.
Remember: Successful trading requires discipline, continuous learning, and adaptation to changing market conditions. No indicator or strategy guarantees profits, and all trading involves substantial risk of loss.

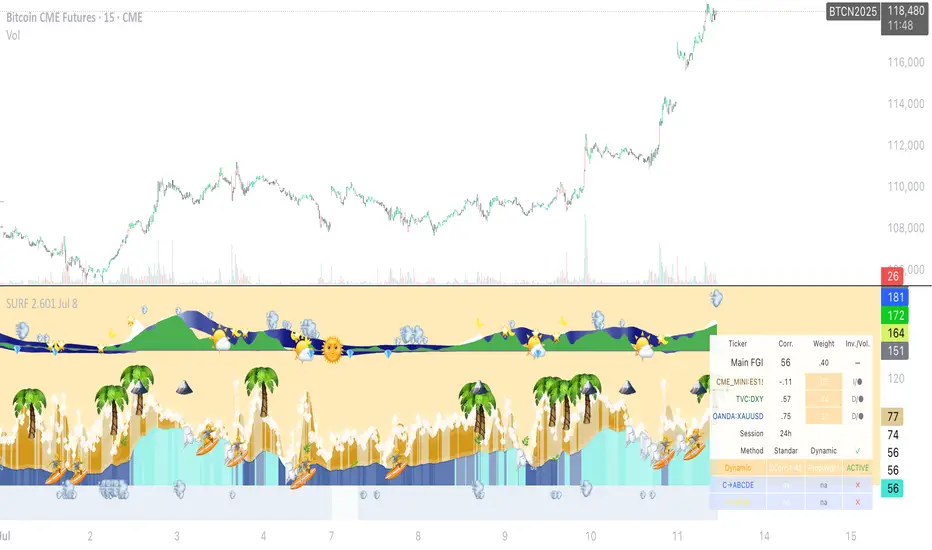
SURF (ex-mafgi) 2.5 4m design @VanyaKsenyaSURF
designed by my 2 older kids, idea by me.
Correlation long only indicator which is fun to use and easy to decipher (hopefully).
What it does, is you can pick up to 3 assets that correlate with the asset you study.
Then it calculates the fear and greed index for each of the assets, and assigns it a weight based on either of the 3 included correlation measuring methods - simple, volatility-based, time-shifted, and (not yet working as of now) - grander causality method.
When the correlated assets are in fear zone (for positively correlated assets) - it shows a surfer who is ready to surf the upcoming wave up.
However, be cautious and take your profit when you see a palm tree or the sea throws out some green seaweed.
Waves are deep back in the sea and dark blue, with a lot of wet sand on the beach - good entry points for longs.
Opposite - good for shorts. When waves are so high that they reach the dry sand.
Enjoy!
(don't forget to check and modify the list of the assets which you think might corellate with the asset you're studying or trading).
Multi Session LQ Tracker by DeadcatDisplays session ranges and identifies when price sweeps session highs/lows (liquidity) . Shows up to 5 sessions with customizable times.
Setup
Timezone - Must match your chart timezone
Sessions - 2 active by default (Asia and London), add up to 5 total
LQ Trigger Session - Time window for liquidity detection (default: 0800-1600), If LQ sweeps happen before this time, they will not be marked.
Key Features
Session Boxes: Visual range of each session high/low
Extended Lines: Continue until price breaks level
LQ Markers: Red "LQ" circles when session levels swept during trigger hours
Liquidity Toggle: Turn off to use as standard session indicator.
Customize it according to your needs. If LQ detection is off, it will function as a normal session indicator.
Very useful for ICT traders who often track session highs/lows to make trading decisions, or for someone who just wants to use a session indicator.

Range Progress TrackerRANGE PROGRESS TRACKER(RPT)
PURPOSE
This indicator helps traders visually and statistically understand how much of the typical price range (measured by ATR) has already been covered in the current period (Daily, Weekly, or Monthly). It includes key features to assist in trend exhaustion analysis, reversal spotting, and smart alerting.
CORE LOGIC
The indicator calculates the current range of the selected time frame (e.g., Daily), which is:
Current Range = High - Low
This is then compared to the ATR (Average True Range) of the same time frame, which represents the average price movement range over a defined period (default is 14).
The comparison is expressed as a percentage, calculated with this formula:
Range % = (Current Range / ATR) × 100
This percentage shows how much of the “average expected move” has already occurred.
WHY IT MATTERS
When the current range approaches or exceeds 100% of ATR, it means the price has already moved as much as it typically does in a full session.
This indicates a lower probability of continuing the trend with a new high or low, especially when the price is already near the session's high or low.
This setup can signal:
A possible consolidation phase
A reversal in trend
The market entering a corrective phase
SMART ALERTS
The indicator can alert you when:
A new high is made after the range percentage exceeds your set threshold.
A new low is made after the range percentage exceeds your set threshold.
You can adjust the Range % Alert Threshold in the settings to tailor it to your trading style.

ATS Net Volume V5.0ATS Net Volume V5.0
Smart Net Volume Analysis System
Overview
ATS Net Volume V5.0 is an advanced volume-based indicator designed for institutional-level capital flow analysis. By monitoring net buying/selling pressure, it identifies the movements of major market players. The system integrates large-order filtering and dynamic price-volume equilibrium algorithms to distinguish genuine demand from market noise, providing traders with clear signals for capital inflow/outflow.
Key Features
🔹 Net Volume Dynamics
Real-time calculation of the difference between buy-side vs. sell-side volume (units: millions/billions)
Positive values indicate capital inflow (green), negative values indicate outflow (red)
🔹 Large Order Detection
Automatically filters out retail-sized trades, focusing on institutional block orders (e.g., "60M" = 60 million, "05B" = 5 billion)
Evaluates accumulation/distribution behavior relative to price levels
🔹 Multi-Timeframe Compatibility
Supports analysis from tick data to daily charts
🔹 Visual Signals
Histogram + numerical labels for intuitive net volume strength display
Threshold-based alerts (e.g., extreme values trigger overbought/oversold signals)
Data Interpretation
Use Cases
✅ Trend Confirmation
Price rise + expanding net buys → Healthy trend
Price rise + net sells → Potential bull trap
✅ Reversal Warning
Price新高 + net volume divergence → Possible topping signal
✅ Institutional Activity
Sustained large net inflows → Smart money accumulation
Sudden massive outflows → Emergency liquidation event
Signal Classification
Net Volume Range Market Implication
Above +50M Strong inflow (bullish)
+10M to +50M Moderate buying
-10M to +10M Balanced market
-10M to -50M Moderate selling
Below -50M Extreme outflow (bearish)
Advantages
🚨 Filters False Breakouts: Responds only to large-order-driven price movements
📊 Price-Volume Synergy: Avoids "low-volume rally" traps
💡 Universal Applicability: Stocks/Futures/Cryptocurrencies
Note: Always combine with price structure (support/resistance). Not a standalone trading signal.

Day of Week and HTF Period SeparatorDay of Week & HTF Period Separator
A minimalist Pine Script indicator that adds clear, time-based separators and labels to intraday charts for better structure and analysis.
Key Features
• Day Labels
• Displays abbreviated weekday names (MON, TUE, WED, etc.) at a user-defined hour
• Custom text color and position
• Limits display to the most recent 28 days for a clean view
• Time Separators
• Daily: Vertical line at 00:00 each trading day
• 4-Hour: Lines at 00:00, 04:00, 08:00, 12:00, 16:00, 20:00
• Hourly: Divisions at every hour for detailed timing
• Customization
• Individual color picker for each separator type
• Choose line style: Solid, Dashed or Dotted
• Enable or disable any separator or label independently
• Smart limits to avoid clutter on extended history
• Smart Behavior
• Active only on intraday timeframes
• Projects upcoming separators into the future for planning
• Automatically caps historical plotting for performance
• Lines extend across full visible price range
Perfect for traders who need distinct session breaks, precise time-based zoning and an organized chart layout.
Inputs
• Show Day Labels (true/false)
• Label Hour (0–23)
• Day Label Color
• Show Daily Separators (true/false)
• Show 4H Separators (true/false)
• Show 1H Separators (true/false)
• Daily Line Color, Style
• 4H Line Color, Style
• Hourly Line Color, Style
• Max Days to Display
Enhance your intraday analysis with clean, customizable time markers. 👁

StochRSI Context EngineThe StochRSI Context Engine is a premium, logic-driven indicator built to provide comprehensive intraday momentum context using multi-timeframe Stochastic RSI analysis. Rather than issuing direct buy or sell signals, the tool is designed to give traders enhanced clarity on trend posture, overbought/oversold conditions, volatility states, and potential momentum reversals. It combines multiple layers of signal processing to deliver an intelligent overview of market conditions in real time.
What it does:
The indicator performs a multi-timeframe evaluation of the Stochastic RSI, sampling values from four customizable timeframes (default: 5m, 15m, 1h, 4h). These values are blended and processed through a series of analytical engines to provide the following:
1. StochRSI Multi-Timeframe Engine
* Computes a smoothed Stochastic RSI value on each selected timeframe.
* Applies user-defined smoothing (SMA, EMA, RMA, or WMA).
* Aggregates these into an average (sRSIavg) for further analysis.
2. Trend and Volatility Engine
* Uses EMA stacking logic (8, 21, 50) to determine directional alignment.
* Calculates linear regression slope for directional bias.
* Assesses volatility using ATR relative to price.
* Derives a trendScore based on EMA alignment, price position, and slope strength.
3. Bias and Slope Analysis
* Measures fast/slow EMA slope differentials to detect bias direction and strength.
* Computes slope deltas and volatility-weighted stacking to score bias conditions.
* Outputs a classification such as strong bullish, moderate bearish, or neutral.
4. Dynamic OB/OS Zone Detection
* Adapts overbought and oversold thresholds based on volatility and trend regime.
* Adjusts the zone boundaries if in a trending or high-volatility environment.
5. Microzone Proximity Detection
* Tracks whether the average StochRSI is approaching key OB/OS thresholds.
* Flags conditions like “Near Overbought,” “Near Oversold,” or “Mid Range.”
6. Velocity and Acceleration Detection
* Measures how quickly StochRSI values are changing.
* Uses delta calculations to gauge the momentum’s thrust or decay.
* Classifies shifts in RSI movement (e.g., flat, slow, fast, or thrusting).
7. Range Expansion / Compression Engine
* Evaluates whether StochRSI values across timeframes are diverging or compressing.
* Identifies regime changes in momentum coherence.
8. Momentum Scoring System
* Calculates a composite score based on bias, slope strength, volatility, and range.
* Labels momentum phases from dormant to full-throttle.
9. Confluence Detection
* Tallies how many of the 4 timeframes are currently overbought or oversold.
* High confluence increases the probability of valid reversal or continuation zones.
10. Support and Resistance Zone Memory
* Tracks and plots previous areas where StochRSI bounced or rejected near zones.
* Stores and updates these zones over time, acting as momentum-based S/R levels.
* Includes a proximity check to cluster zones that are close in value.
11. Divergence Detection Engine
* Detects classic bullish or bearish divergence between price and the aggregated StochRSI.
* Draws lines to show divergence structure and triggers real-time alerts.
12. Smart Background Highlighting
* Shades the background based on whether current StochRSI is in an overbought, oversold, or
neutral zone.
13. Real-Time Dashboard
* Displays trend, bias, confluence count, velocity, divergence state, momentum score, and
more.
* Dynamically updates and is optimized for top-right screen positioning with compact
formatting.
14. Smart Alerts
* Issues alerts for divergence detection and high-confluence reversal conditions.
15. Real-Time Labels on Curves
* Shows the selected timeframes alongside each plotted StochRSI line to clarify source data.
What it’s based on:
* Stochastic RSI as the core input signal, providing normalized momentum across timeframes.
* EMA stacking logic, adapted from institutional trend-following models.
* Volatility normalization using ATR to adapt thresholds in high vs. low volatility environments.
* Slope forecasting using linear regression to infer directional conviction.
* Bias analysis modeled on a composite of EMA distance, alignment, and directional thrust.
* Support/resistance zone memory derived from repeated interaction with dynamic OB/OS thresholds.
* Divergence logic based on localized price and oscillator peaks/troughs.
* Multi-factor confidence scoring, aggregating up to 6 inputs to rate market clarity.
This script is for educational and informational purposes only. It does not generate trade signals or provide financial advice. It is not intended to be used as a standalone system for trading or investment decisions. Use at your own discretion. Always confirm with your broader strategy and risk management practices.

Adaptive Pulsar Momentum | QuantEdgeB⚡ Adaptive Pulsar Momentum | QuantEdgeB
🔭 What is Adaptive Pulsar Momentum?
The Adaptive Pulsar Momentum (APM) is a high-performance, modular trading system designed to decode market momentum across a range of conditions. It combines multi-indicator adaptability (RSI, MFI, Z-Score, ROC, and a hybrid AVG mode) with dynamic signal generation using five advanced "modes" of signal logic: Impulse, Trend, Heikin-Ashi Candles, Statistical Deviation, and MACD.
💡 Think of APM as a scientific instrument, scanning, adapting, and broadcasting precision-tuned momentum data in real-time, helping traders eliminate noise, guesswork, and lag.
___________________________________
1.🔧 System Core: Customizability and Adaptation
📊 Indicator Modes
• 𝓡𝓢𝓘 (Relative Strength Index): Classic oscillator detecting overbought/oversold zones.
• 𝓩-𝓢𝓒𝓞𝓡𝓔: Normalized deviation from mean; ideal for statistical reversion plays.
• 𝓜𝓕𝓘 (Money Flow Index): Volume-weighted RSI-style metric.
• 𝓡𝓞𝓒 (Rate of Change): Measures the velocity of price change.
• 𝓐𝓥𝓖: Combines RSI, MFI, Z-Score, and ROC into a unified signal (normalized to 0–100 scale).
🧠 MA Engine (Smoothing)
Over a dozen moving average types:
• Includes ALMA, TEMA, JMA, SMMA, HMA, LSMA, VWMA, and more.
• Dynamic smoothing makes this system versatile across markets and timeframes.
___________________________________
2.🧨 SIGNAL MODES – THE ENGINE ROOM
Each mode turns the raw smoothed indicator into a powerful momentum signal with thresholds and logic specific to the use case.
1️⃣ 𝓘𝓶𝓹𝓾𝓵𝓼𝓮 Mode
🚀 Use case:
Best for detecting explosive, fast-moving momentum before the crowd catches on.
🔍 Logic:
• Thresholds can be Static, Percentile-based, or Standard Deviation derived.
• Dynamic signal: +1 for breakout, -1 for breakdown, 0 for neutral.
• Custom threshold percentiles enable precise tuning.
🎯 Ideal for:
• Scalping breakouts
• Event-driven spikes (e.g., CPI, FOMC)
• Early trend initiation
2️⃣ 𝓣𝓻𝓮𝓷𝓭 Mode
🧭 Use case:
Built to identify and follow trends with minimal noise. Stable, low-churn logic for riding moves.
🔍 Logic:
• Signal generated via cross above/below a calculated midline (either fixed or dynamic mean).
• Best paired with SMMA or TEMA smoothing.
🎯 Ideal for:
• Swing traders
• Momentum trend followers
• Portfolio rotation strategies
3️⃣ 𝓗𝓐 𝓒𝓪𝓷𝓭𝓵𝓮𝓼 Mode
🔥 Use case:
Filters volatility while capturing structural momentum shifts using Heikin-Ashi logic on smoothed indicators.
🔍 Logic:
• Converts the smoothed signal into Heikin-Ashi candles.
• Measures close vs open to determine trend direction.
• Thresholds again can be static, percentile, or SD-based.
🎯 Ideal for:
• Visual trend clarity
• Avoiding whipsaws in sideways markets
• Discretionary trading with cleaner structure
• Mean-Reverting
4️⃣ 𝓢𝓽𝓪𝓽𝓲𝓼𝓽𝓲𝓬𝓪𝓵 𝓓𝓮𝓿𝓲𝓪𝓽𝓲𝓸𝓷 Mode
🧪 Use case:
Detects high-volatility expansions before or during major directional surges.
🔍 Logic:
• Calculates absolute deviation using HA open vs close.
• Filters this with a moving average and overlays a volatility cloud.
• Breaks above/below the cloud signal directional surge.
🎯 Ideal for:
• Pre-breakout scanning
• Identifying regime shifts
• Options traders looking for volatility expansions
5️⃣ 𝓜𝓐𝓒𝓓 Mode
🧲 Use case:
Classic MACD principles adapted to smoothed momentum indicators—ideal for trend continuation or crossovers.
🔍 Logic:
• MACD line = Pulsar signal - EMA of signal.
• Thresholds (up/down) define bias.
• Optional extra filter to validate with midline crossing.
🎯 Ideal for:
• Trend confirmation
• Crossover-based entry strategies
• Confluence with higher timeframe bias
___________________________________
3.📊 System Sensor Table
Adaptive Pulsar Momentum includes a live multi-layered analytics table designed to give traders a complete pulse on current market behavior. Here's what each section reveals:
🔁 System Signal
At any given bar, the algorithm outputs one of three states:
• Long ⟹ Bullish conditions are active and sustained
• Short ⟹ Bearish momentum dominates
• Cash ⟹ Neutral zone — conditions lack a strong directional bias
This is dynamically adjusted based on the selected signal mode (Impulse, Trend, etc.) and adapts in real time to shifts in smoothed oscillator logic or candle structure.
📊 Strength: Conviction & Potential
Unlike binary signals, this table offers graded insights into how strong or fragile the signal actually is, a huge upgrade from traditional systems.
There are two distinct layers:
1. Conviction Strength –> shown when the system is in a full long or short signal.
- A value like “Long Strength: 84%” means there's high confidence in the continuation or follow-through of the current bias.
- It blends distance from threshold, momentum velocity (Rate of Change), and position in range to avoid false positives and overstretched signals.
2. Potential Strength –> shown during neutral (Cash) periods.
- Two bars appear: one for bullish potential, another for bearish potential.
- These answer: “If the market were to move soon, which side has the edge?”
- Example: "↗ 68% / ↘ 32%" means bulls have more pent-up energy or structure.
These bars provide pre-signal tension, helping traders anticipate breakouts or avoid traps during choppy periods.
🔸 HA Candle Phase (When Mode = HA Candles)
Instead of showing strength bars, this mode displays a phase label, interpreting the Heikin-Ashi candle structure in context of momentum and thresholds:
- Momentum Up / Down –> Strong impulse direction confirmed above or below dynamic bounds.
- Reversal Up / Down –> Early signs of potential reversals (price beyond bounds but opposite signal ).
- Continuation Up / Down –> Sustained movement after a signal confirmation (post-threshold cross).
- Chop –> Sideways indecisiveness, often signaling to reduce risk or await clarity.
- Neutral –> No active momentum or pattern signal.
This provides a narrative view of market behavior, ideal for discretionary traders who rely on visual rhythm and pattern recognition.
___________________________________
5. 🧠 Optional Smart Configuration
Enable “Use Recommended Settings” to auto-configure:
• Optimized lengths
• Best-suited moving averages
• Signal type filters
• Volatility lookbacks
Perfect for those wanting precision without manual tuning.
___________________________________
6.🧪 Use Cases by Mode Summary
🔹 Impulse Mode
Ideal for traders looking to capitalize on sharp breakouts or high-momentum reversals. This mode is built for speed and sensitivity, making it a go-to for scalping, reacting to news events, or identifying trends at their earliest inflection points.
🔹 Trend Mode
Engineered for longer-term positioning, this mode tracks sustained directional bias over time. Best suited for swing traders or those managing portfolio allocations, it's focused on the midline dynamics that define trend health and commitment.
🔹 HA Candles Mode
This mode filters out noise through smoothed Heikin-Ashi transformations, providing clean visual structure. It's perfect for discretionary traders, pattern recognizers, or those looking to enter pullbacks within broader trends. The phase system (e.g. Momentum, Reversal, Chop) adds narrative context to price action.
🔹 Statistical Deviation Mode
A quantitative engine for traders who thrive on volatility exploitation. By modeling deviations from mean behavior, it's particularly powerful in options strategies, regime detection, or scanning for expansion conditions. This mode excels when price breaks away from standard norms.
🔹 MACD Mode
The classic concept of momentum meets modern smoothing in this variant. Use this for confirmation, spotting divergences, or executing crossover-based strategies. MACD mode gives clarity in ambiguous zones, favoring structured continuation or reversal bias.
Each mode is uniquely crafted for a different style of trader and market environment, and switching between them transforms the entire engine’s behavior
___________________________________
🧭 Conclusion
Adaptive Pulsar Momentum isn’t just a signal tool, it’s a market intelligence system. Whether you’re scalping volatility, swinging trends, or navigating uncertain chop, APM dynamically adjusts to the rhythm of the market. With precision-tuned signal modes, a smart strength matrix, and plug-and-play configuration, it transforms raw momentum into actionable clarity.
📌 Trade with Statistical Precision | Powered by QuantEdgeB
🔹 Disclaimer: Past performance is not indicative of future results.
🔹 Strategic Advice: Always backtest, optimize, and align parameters with your trading objectives and risk tolerance before live trading.

Plyo Tap'n'Slap (TnS) by OutOfOptionsThe Model
This Strategy/Model takes advantage of the strongest trend signature in the market, which is also the most basic move in the market. This basic move is what most traders consider to be a staircase, or trendline. ICT traders call this setup a “unicorn” which is just another word for when an Order block overlaps with an FVG. The beauty of this model is that you don't need to know what ANY of these things are.
The entry comes when a candles High or Low overlaps with a FVG that is at least 3 points away from both edges of the FVG. If the candle is too close to the edge then the setups is invalid (see rules for more). TO find a candle that overlaps with the FVG it also can not cut through any other price action, for example, A potential entry cant cut through another wick to make it overlap with the FVG. (see rules for more)
TnS gets its TP by analyzing what is called the "OG TP" The OG TP is determined by looking for the first tapped into the FVG, then looking for an immediate High or Low to the left of the candle that first tapped the FVG. IF there is no immediate High or low next to the candle that first tapped the FVG, then target the candle itself (see rules for more). IF the "OG TP" has already been hit before TnS gets its entry, then look to the left of the TnS entry candle for the immediate High or Low next to it. If there is no immediate High or Low next to the TnS Entry candle, then target the Entry candles, High or Low (see rules for more)
Model Rules
Overlapping H/L MUST be at least 3 points away from both edges of the FVG,
Overlapping H/L cannot cut through PA to make it overlap with the FVG,
Entries can only be the highest overlapping high or the lowest overlapping low,
If TnS Has already played out within the FVG then it should no longer be used,
If the FVGs OG TP has already been hit then use the TnS entry to re-align for your target,
No using NWOGs/NDOGs for setups. A NWOG is NOT the same thing as an FVG so this example
V2 Rules
If its a Bullish FVG then you need a bearish candle H/L that overlaps for your entry
If its a Bearish FVG then you need a bullish candle H/L that overlaps for your entry
Indicator Functionality
The indicator uses specific logic to identify FVGs that match the requirements of the TnS model, ensuring at least one valid entry exists per the default V1 rules of the model, or the stricter V2 rules if configured via settings. If entries (up to 2 per model rules) are identified, the FVG is highlighted, and each entry and its stop loss is marked with a line. The line styles, colors, and FVG color, which can vary depending on whether the entry is bullish or bearish, are configurable via settings.
Once the FVG is tapped into, the indicator will highlight the take profit spot and list all applicable entries, stop losses, and take profits in a table, the position and presence of which can be controlled within the indicator settings. When price action hits either stop loss or take profit, all elements are removed from the chart to avoid clutter.
Additionally, the indicator allows filtering of entries based on Risk/Reward (R:R), filtering out entries where take profit is less than the model stop loss and entries for which the stop loss resides inside the FVG itself. To help visualize setups where the FVG is outside the current visual range, the indicator has options to extend the FVG box and lines by a configurable number of bars. Once the FVG is tapped, the indicator will automatically extend lines/FVG box to the bar that tapped the FVG plus the configured number of bars.

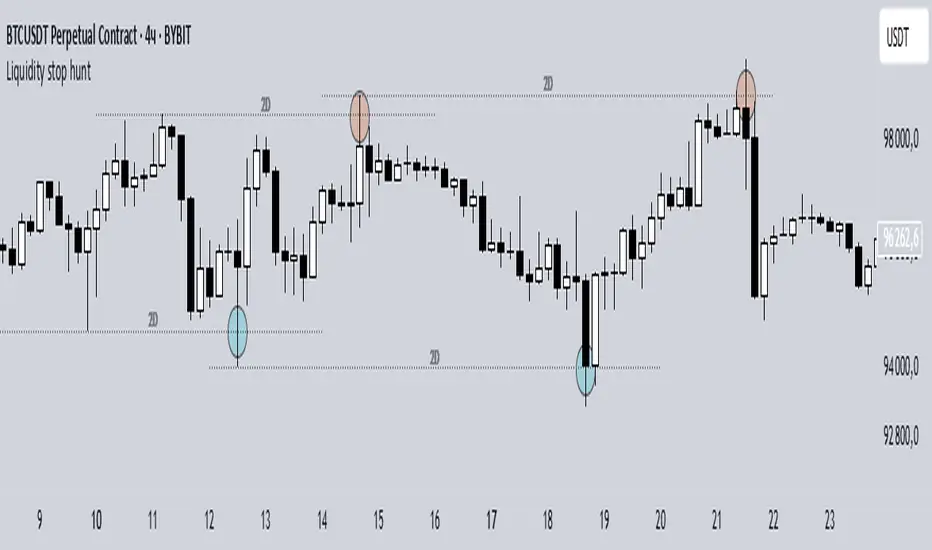
Liquidity stop huntThis tool identifies key liquidity zones where stop hunts are likely to occur.
**How it works:**
- Detects swing highs/lows on your selected timeframe.
- Marks levels where "liquidity sweeps" (fakeouts) often happen.
- Plots these zones as dotted lines for visual reference.
**How to use:**
1. Look for price rejections near marked levels.
2. Avoid placing stops too close to obvious liquidity zones.
3. Combine with price action for confirmation.
**Settings:**
- Timeframe: Choose the historical period for analysis (e.g., 1D, 1W).
- Sweep Type: "Wick Only" for precise tails, "Regular" for all breaks.
- Colors/Style: Customize appearance.
Note: Works best in trending markets. Not a standalone strategy — always confirm with additional analysis.
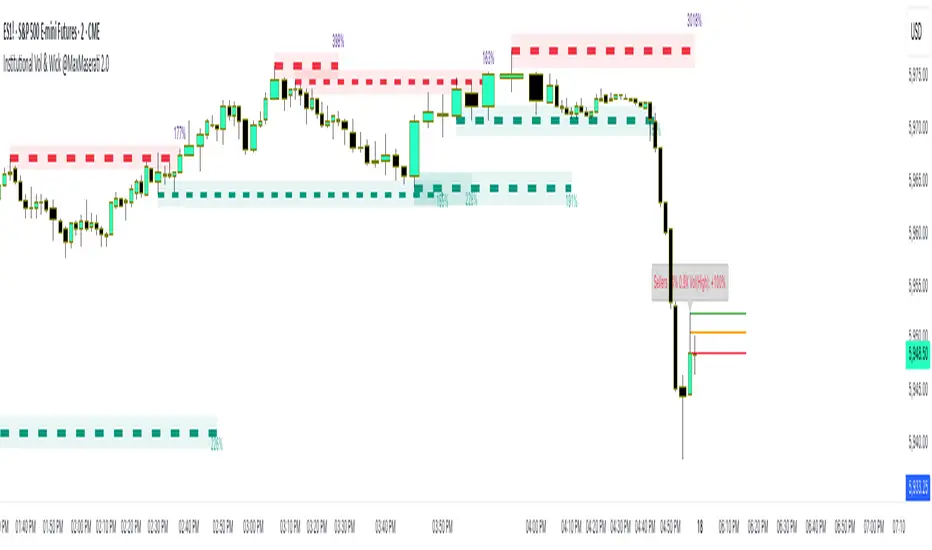
Institutional Volume Toolkit & Automatic Wick @ MaxMaserati 2.0Institutional Volume Toolkit with Automatic Wick Analyzer @ MaxMaserati 2.0
Overview
This advanced technical indicator combines institutional volume analysis with precise wick detection to reveal hidden market dynamics driving price action. Designed for serious traders who recognize that volume is the fuel behind meaningful price movements, this toolkit identifies key support/resistance zones created by significant institutional activity while simultaneously analyzing candlestick wicks to detect buyer/seller dominance.
Key Features
Volume Defense Levels
Institutional Support/Resistance Detection: Automatically identifies price levels where significant volume occurred during swing points
Dynamic Strength Visualization: Defense level thickness varies based on relative volume importance
Volume % Labels: Clearly shows the strength of each defense level relative to average volume
Adaptive Coloring: Green for buyer defense (support), red for seller defense (resistance)
Wick Analysis System
Smart Wick Detection: Analyzes upper and lower wicks to identify real-time buying and selling pressure
Automatic Dominance Calculation: Determines whether buyers or sellers are dominant at key price points
Multi-Line Analysis: Displays 3-line sets at critical wick areas for precise entry/exit signals
Volume-Enhanced Signals: Combines wick analysis with volume comparison for stronger signals
Trading Applications
Support/Resistance Trading: Identify high-probability bounce or reversal zones created by institutional volume
Break & Retest Strategies: Trade with confidence when price retests broken volume levels
Divergence Detection: Spot divergences between price action and institutional commitment
Swing Trading Setup: Perfect for identifying optimal swing trade entries with favorable risk/reward
Trend Confirmation: Validate trend strength by assessing institutional participation
Setup Guidelines
Volume Defense Levels: Customize volume lookback and threshold to match your timeframe
Wick Analysis: Set filters (wick-to-body ratio, volume percentage, dominance) to eliminate noise
Visual Settings: Adjust colors and label sizes to match your chart preferences
Combine Timeframes: Use on higher timeframes for strategic levels, lower timeframes for entries
This indicator combines sophisticated volume analysis with candlestick psychology, providing a complete toolkit for identifying institutional activity where smart money is actively defending price levels. By revealing the hidden forces driving market movements, it offers a significant edge for traders seeking to align their positions with institutional flow.
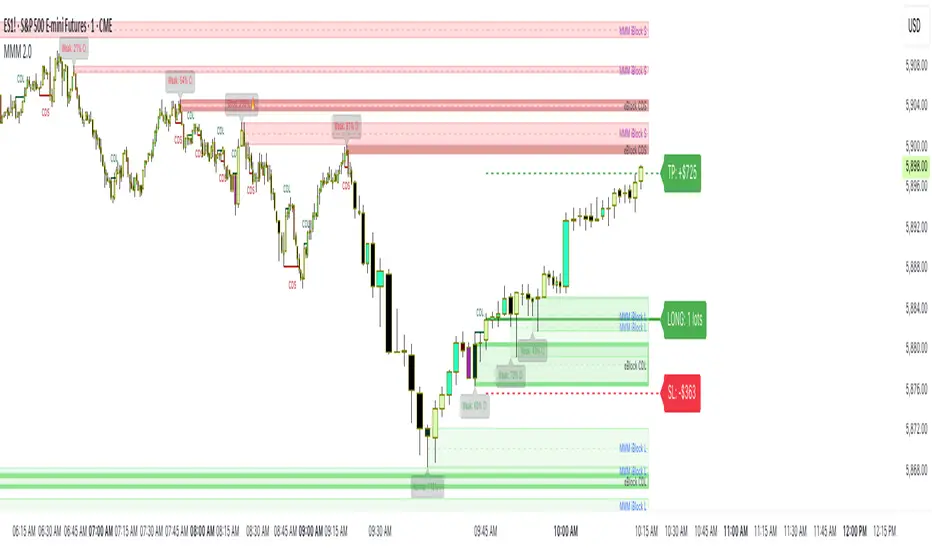
MMM @MaxMaserati 2.0MMM @MaxMaserati 2.0 - TradingView Indicator
The Backbone of the Max Maserati Method
The MMM @MaxMaserati 2.0 indicator is the core of the proprietary Max Maserati Method (MMM), a trading system designed to decode institutional price action. It integrates candle bias analysis, market structure identification, volume-based signals, and precise entry zones to align traders with smart money.
Core Components of the MMM System
1. Six Core Candle Classifications
Master these patterns to reveal institutional behavior:
Bullish Body Close: Closes above previous high, signaling strong buying.
Bearish Body Close: Closes below previous low, indicating intense selling.
Bullish Affinity: High tests previous low, closes within range, showing hidden bullish strength.
Bearish Affinity: Low tests previous high, closes within range, reflecting bearish pressure.
Seek & Destroy: Breaks both previous high/low, closes inside, direction depends on close.
Close Inside: High/low within previous range, bias based on close.
2. Plus/Minus Strength System
Quantifies candle conviction:
Bullish Strength: Low to close distance.
Bearish Strength: High to close distance.
Plus (+): Dominant strength signals strong follow-through.
Minus (-): Balanced strengths suggest caution.
3. PO4 Candles (Power of OHLC (4))
Analyzes OHLC for body-closed candles after swing high/low fractals:
C2: Body close above high/below low post fractal with strength conditions.
C3: Stronger body close with pronounced low/high breakouts.
C4: Body close which show strength and might trigger a BeB/BuB
Visualization: Green (bullish), purple (bearish) bars; triangle markers for fractals.
4. MC2 (High Volume Reversal Candles)
High buy/sell volume candles reversed by opposing volume:
Bullish MC2: Buy volume flipped by sell volume, signaling exhaustion.
Bearish MC2: Sell volume flipped by buy volume, indicating reversal.
Visualization: Dark green (bullish), dark red (bearish) bars.
5. MMM Blocks (eBlocks and iBlocks)
Marks institutional order blocks:
External Blocks (eBlocks): At market structure changes (MSC), labeled BuB/BeB.
Internal Blocks (iBlocks): Within trends, labeled L/S.
Volume: Normalized with indicators (🔥 high, ↑ above average, ↓ low).
Filters: Discount (0-50), premium (50-100), extreme (0-20, 80-100), mid-range (20-50, 50-80).
6. Entry Blocks - Specific Entry Areas
Entry Blocks are precise zones for framing trades based on the MMM system, triggered post-MSC to capitalize on institutional momentum:
Purpose: Pinpoint high-probability entry areas following a Market Structure Change (MSC), aligning with smart money direction.
Formation:
MMM Entry Block Long: Forms after a bullish MSC (BuB), typically at the swing low (e.g., lowerValueMSC) of the fractal pattern, marking a long entry zone.
MMM Entry Block Short: Forms after a bearish MSC (BeB), typically at the swing high (e.g., upperValueMSC), marking a short entry zone.
Styles :
Close-to-Swing High/Low: Box drawn from the candle’s close to the swing high/low level, emphasizing the fractal pivot.
High/Low-to-Close: Box drawn from the candle’s high/low to its close, capturing the full price action range.
Visualization:
Labeled “MMM Entry Block Long” (cyan background/border) or “Short” (pink background/border).
Includes a dashed midline for reference.
Volume displayed if enabled, normalized with markers (🔥 >150%, ⚡ >120%, ❄️ <70%).
Behavior:
Deletes when price touches the level (On Level Touch) or closes beyond it (On Candle Close)
Limited to a configurable number ( default 5) to avoid clutter.
Trade Framing:
Entry: Enter within the eBreak box, ideally on a pullback or confirmation candle aligning with MMM bias (e.g., Bullish Body Close or Affinity).
Stop-Loss: Placed below the eBreak low (bullish) or above the high (bearish), leveraging the swing level as support/resistance.
Take-Profit: Targets higher timeframe high (bullish) or low (bearish), with ratio (default 2.0) for risk-reward.
MMM Integration: Use candle bias (Plus/Minus), PO4 signals, and MMPD consensus to confirm entry direction and strength.
Significance: eBreaks frame trades by isolating institutional entry points post-MSC, reducing noise and enhancing precision.
7. Market Structure Change (MSC)
Tracks structure shifts:
Detection: Fractal highs/lows with adjustable candle count.
Visualization: Green (BuB), red (BeB) lines/labels; numbered breaks (Bub1/Beb1).
Counter: Tracks consecutive MSCs for trend strength.
8. MMPD (Market Momentum Price Delivery)
Analyzes momentum/trend:
Conditions: Red (bearish), Green (bullish), Pink (modifying bearish), Pale Green (modifying bullish).
Traps: Flags bullish/bearish traps when MMPD conflicts with body close.
Metrics: SuperMaxTrend, momentum (K/D), MMPD level.
Consensus: Rated signals (e.g., “Very Strong Buy ★★★★★”).
9. Trade and Risk Management
Disciplined trading:
Entry Visualization: Entry, stop-loss, take-profit lines/labels with customizable risk (riskAmount, default $50) and reward (ratio).
Behavior: Shows last/all entries, removes on MSC shift or breach.
Text Size: Tiny, Small, Normal.
NB: The Trade and risk management is to use with caution, it is not fully implemented yet.
10. Stats Table
Real-time dashboard:
Elements: Timeframe, symbol, candle bias, strength, MMPD, momentum, SuperMaxTrend, MMPD level, volume, consensus, divergence, delta MA, price delivery, note (“Analyze | Wait | Repeat”).
Customization: Position, size, element visibility.
Colors: Green (bullish), red (bearish), orange (warnings), gray (neutral).
11. Delta MA and Divergence
Monitors volume delta:
Delta MA: Smoothed delta with direction arrows (↗↘→).
Divergence: Flags MMPD-momentum divergences (⚠️).
Key Features
Automated Analysis: Detects PO4, MSC, blocks, MC2, Entry Block via OHLC.
Color-Coded Visualization: Bars, lines, table cells reflect bias/strength.
Dynamic Bias Lines: Higher timeframe high/low lines with labels.
Volume Analysis: Normalized volume across blocks, entries, MC2.
Flexible Filters: Tailors block/entry Block display to strategies.
Real-Time Metrics: Tracks strength, delta, trend points.
Trading Advantages
Institutional Insight: Decodes manipulation via OHLC and volume.
Early Reversals: Spots shifts via PO4, MC2, MSC, Entry Blocks.
Precise Entries: entry block frame high-probability trades.
Robust Risk Management: Stop-loss, take-profit, risk-reward.
Simplified Complexity: Actionable signals from complex action.
Profit Target Framework
Bullish: Higher timeframe high.
Bearish: Higher timeframe low.
Plus Strength: Direct move.
Minus Strength: Pullbacks expected.
Entry Blocks/MSC-Driven: Entry anchor entries to MSC targets.
Trader’s Mantra
“Analyze | Wait | Repeat” - Discipline drives profits.
The MMM @MaxMaserati 2.0 indicator, with Entry Blocks as specific trade-framing zones, offers a professional-grade framework for precise, institutional-aligned trading.
Note: Based on the proprietary Max Maserati Method for educational and analytical use.
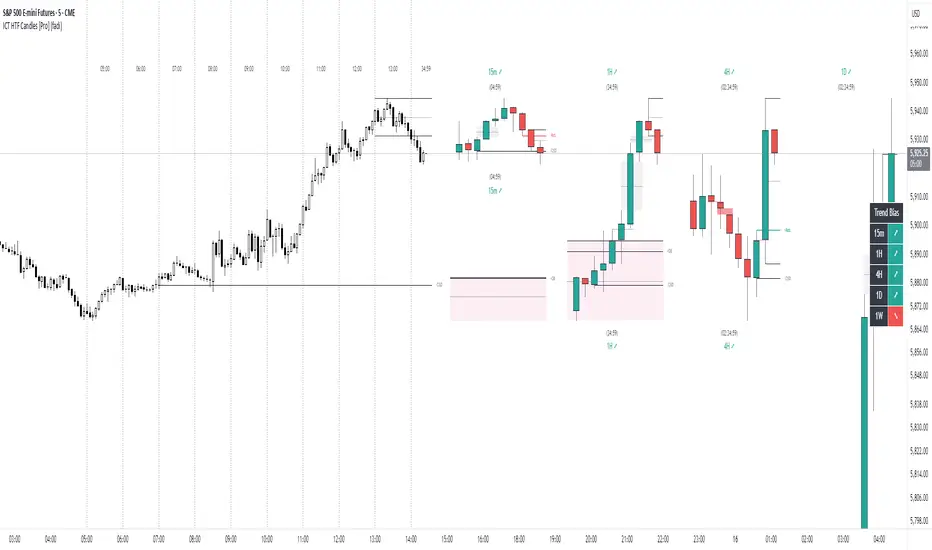
ICT HTF Candles [Pro] (fadi)The ICT HTF Candles shows you multi-timeframe price action by plotting up to six higher timeframe candles on your chart, scaled to real price levels. Set candle counts per timeframe or toggle them off for a clean view, saving you time switching between charts. This helps you spot trends and reversals quickly, align trades with the market’s direction, and time setups like sweeps or bounces better. From scalping on the 1m to swinging on the 4H, it simplifies ICT and Smart Money Concepts (SMC), revealing trend shifts and institutional moves clearly. Once you use it, trading without this clarity just won’t feel right.
Key Features:
In-Depth Price Action Levels
These levels track ICT PD arrays and confluences across timeframes, making it easy to see how price action flows from higher timeframes and what your setup faces. Is your 5m trade about to run into a 1H bearish order block? Did it bounce off a higher timeframe FVG and create an SMT with a correlated asset? They make your chart a clear roadmap to market structure, helping you find strong setups, save time, and align with institutional moves:
Change in State of Delivery (CISD): In ICT trading, CISD marks potential reversal levels on each timeframe by showing the open of the highest series of up (green) candles for a bullish shift or the open of the lowest series of down (red) candles for a bearish shift. These levels are set at the opening price of the first candle in those runs, highlighting where the market turns. The indicator makes these levels easy to spot across timeframes, so you can track reversal points clearly. You can set your own confirmation criteria—a close or wick above/below the CISD line (bearish/bullish) or a close or wick above/below the high/low—to verify the CISD level cross. When confirmed, there is a high probability that we have a change in trend, and a reversal order block forms. CISD helps you track these reversal levels and confirm market shifts, making multi-timeframe analysis straightforward.
Order Blocks: When a CISD level cross is confirmed, the price is now below a series of up (green) candles or above a series of down (red) candles, marking these candles as order blocks that usually support the new trend direction. The indicator shows these levels clearly across timeframes, making it easy to spot high-probability reversal or consolidation areas. Keep in mind that price may sometimes move to mitigate an imbalance, so use your best judgment based on your multi-timeframe analysis to confirm they meet your trading criteria.
Trend Bias: Traders often struggle figuring out market bias—guessing the trend wrong, losing on trades against the flow, or missing how lower and higher timeframes line up. The Trend Bias feature tracks order blocks and change in state of delivery, displaying bullish or bearish trends for each timeframe to help you choose trades that go with the market’s direction. The indicator shows these trends clearly across timeframes, so you can quickly see if the 5m matches the 1H or if you’re going against the bigger trend. This makes it easier to avoid bad trades and make decisions faster, keeping you on track with setups that follow the main trend.
Immediate Rebalance: When looking at price action, you’ll see the market doesn’t usually leave behind many Fair Value Gaps (FVGs). That’s because the market is efficient and always rebalancing any inefficiencies. When the market starts a strong move, the last candle will usually close above the previous candle high (for up moves) or below the low (for down moves). At this point, the market will do one of two things: immediately rebalance by retracing first, or have a small retracement but leave behind an FVG. The Immediate Rebalance feature tracks rebalance levels across multiple timeframes, clearly showing where price rebalances. This helps traders have a better expectation of how the market may need to retrace and anticipate Power of Three (PO3) setups by being ready for a Judas swing to rebalance the imbalance.
Fair Value Gaps and Volume Imbalances: If the market fails to immediately rebalance, it will usually attempt to come back and rebalance it at a later time. FVGs and VIs give you a clear area where the price might be heading if it starts breaking structure on lower timeframes. These inefficiencies—price gaps (FVGs) or aggressive moves (VIs)—show where the market’s working to fix imbalances. The Fair Value Gaps and Volume Imbalances feature tracks these levels across timeframes.
Previous Candle Levels: The Previous Candle Levels feature marks the high, low, and middle of the prior candle on each timeframe, helping you identify key price levels for sweeps, bounces, or breakouts. It tracks the candle’s high and low as its extremes and the middle as the 50% mark, which you can set to calculate using the high-to-low range or the open-to-close range. These levels can provide tradable setups on lower timeframes.
Smart Money Techniques (SMT): What’s an ICT indicator without an SMT feature to track cracks in correlated assets? The ICT HTF Candles monitors your chosen correlated assets, like EUR/USD and GBP/USD or SQ and NQ, for signs of strength or weakness to use as confluence with other features and build the case for A+ setups. The SMT feature spots divergences when one asset makes a higher high or lower low while the other doesn’t follow, hinting at potential reversals or market shifts. It tests SMT using two immediate candles, since higher timeframes (HTFs) create larger gaps on lower timeframes. Traders can easily see these divergence levels, like a 15m SMT lining up with a 1H order block or CISD, helping you confirm high-probability setups and strengthen trade entries with multi-timeframe confluence.
UNITED TRADING COMMUNITY WaterMarkWATER MARK indicator. Will allow you to improve the order of the entries you need on the chart.
1. Name and date for the traded instrument
2. Watermarks to protect your charts (in the center and around the perimeter of the chart)
3. The new "notes" option will allow you to keep focus on the factors that are important to you on the chart.
Very flexible settings for any notes, labels, watermarks on the chart that are important to you.
Индикатор WATER MARK . Даст возможность вам улучшить порядок нужных вам записей на графике.
1. Название и дата для торгуемого инструмента
2. Водные знаки для защиты ваших графиков ( в центре и по периметру графика)
3. Новая опция "заметки" позволит вам держать фокус на важных для вас факторах на графике.
Очень гибкая настройка , любых значимых для вас заметок , лейблов , вотермарк на графике.

ATR Volatility giua64ATR Volatility giua64 – Smart Signal + VIX Filter
📘 Script Explanation (in English)
Title: ATR Volatility giua64 – Smart Signal + VIX Filter
This script analyzes market volatility using the Average True Range (ATR) and compares it to its moving average to determine whether volatility is HIGH, MEDIUM, or LOW.
It includes:
✅ Custom or preset configurations for different asset classes (Forex, Indices, Gold, etc.).
✅ An optional external volatility index input (like the VIX) to refine directional bias.
✅ A directional signal (LONG, SHORT, FLAT) based on ATR strength, direction, and external volatility conditions.
✅ A clean visual table showing key values such as ATR, ATR average, ATR %, VIX level, current range, extended range, and final signal.
This tool is ideal for traders looking to:
Monitor the intensity of price movements
Filter trading strategies based on volatility conditions
Identify momentum acceleration or exhaustion
⚙️ Settings Guide
Here’s a breakdown of the user inputs:
🔹 ATR Settings
Setting Description
ATR Length Number of periods for ATR calculation (default: 14)
ATR Smoothing Type of moving average used (RMA, SMA, EMA, WMA)
ATR Average Length Period for the ATR moving average baseline
🔹 Asset Class Preset
Choose between:
Manual – Define your own point multiplier and thresholds
Forex (Pips) – Auto-set for FX markets (high precision)
Indices (0.1 Points) – For index instruments like DAX or S&P
Gold (USD) – Preset suitable for XAU/USD
If Manual is selected, configure:
Setting Description
Points Multiplier Multiplies raw price ranges into useful units (e.g., 10 for Gold)
Low Volatility Threshold Threshold to define "LOW" volatility
High Volatility Threshold Threshold to define "HIGH" volatility
🔹 Extended Range and VIX
Setting Description
Timeframe for Extended High/Low Used to compare larger price ranges (e.g., Daily or Weekly)
External Volatility Index (VIX) Symbol for a volatility index like "VIX" or "EUVI"
Low VIX Threshold Below this level, VIX is considered "low" (default: 20)
High VIX Threshold Above this level, VIX is considered "high" (default: 30)
🔹 Table Display
Setting Description
Table Position Where the visual table appears on the chart (e.g., bottom_center, top_left)
Show ATR Line on Chart Whether to display the ATR line directly on the chart
✅ Signal Logic Summary
The script determines the final signal based on:
ATR being above or below its average
ATR rising or falling
ATR percentage being significant (>2%)
VIX being high or low
Conditions Signal
ATR rising + high volatility + low VIX LONG
ATR falling + high volatility + high VIX SHORT
ATR flat or low volatility or low %ATR FLAT
