Commodity Pulse Matrix (CPM) [WavesUnchained] [Strategy]Commodity Pulse Matrix (CPM) - Strategy Version
⚠️ Development Status
ACTIVE DEVELOPMENT - This strategy is currently under heavy development and optimization. The risk management settings, entry/exit logic, and parameter tuning are still being refined and are NOT yet satisfactory for live trading.
Current development areas:
Stop-loss and take-profit optimization
Position sizing and risk management
Entry timing and signal filtering
Backtest validation across different market conditions
⚠️ Use for testing and backtesting only - NOT recommended for live trading yet!
For detailed information about the underlying indicator logic, signals, and analysis methods, please refer to the Commodity Pulse Matrix (CPM) indicator description.
Overview
The CPM Strategy is an automated trading system based on the Commodity Pulse Matrix indicator. It converts the indicator's multi-timeframe confluence signals into executable trades with dynamic ATR-based risk management.
Strategy Core Features
Signal Sources
The strategy trades based on:
Strong Buy/Sell signals from the CPM indicator
Multi-timeframe alignment (configurable: 3/3, 2/3, or score-only)
EMA-200 trend filter (prevents counter-trend entries)
Dynamic signal cooldown (5-8 bars)
Optional reversal zone signals (triple-confirmed)
Risk Management (ATR-Based)
Stop-Loss & Take-Profit
Stop-Loss: 2.5x ATR (default) - Dynamic distance based on volatility
Take-Profit: 4.0x ATR (default) - Risk/Reward ratio of 1.6:1
ATR Length: 14 periods (adjustable)
Both SL and TP adjust to current market volatility
Trailing Stop (Optional)
Enabled by default
Trails at 2.5x ATR distance
Protects profits in trending moves
Can be disabled for fixed SL/TP only
Position Management
Trade Direction Filter
Both Directions (default) - Trade both Long and Short
Long Only - Only enter long positions
Short Only - Only enter short positions
Cooldown After Exit
Default: 3 bars minimum after closing a position
Prevents immediate re-entry (whipsaw protection)
Adjustable from 0 (disabled) to any number of bars
Signal Filtering
Signal Mode (Timeframe Consensus)
Strict (3/3 TFs): All 3 timeframes must agree - Most conservative
Majority (2/3 TFs): At least 2 of 3 timeframes agree - Balanced (default)
Flexible (Score Only): Overall score threshold only - Most signals
Optional Filters
Min ABS(overallScore): Only trade when confluence score meets minimum (default: 0 = disabled)
Confirmed Bar Only: Wait for bar close before entry (prevents repainting) - Recommended ON
Strategy Settings Guide
For Conservative Trading (Lower Risk)
Signal Mode: "Strict (3/3 TFs)"
Stop-Loss: 3.0x ATR or higher
Take-Profit: 5.0x ATR or higher
Trailing Stop: Enabled
Cooldown: 5-10 bars
Min Score: 8.0 or higher
For Aggressive Trading (More Signals)
Signal Mode: "Flexible (Score Only)"
Stop-Loss: 2.0x ATR
Take-Profit: 3.0x ATR
Trailing Stop: Optional
Cooldown: 0-3 bars
Min Score: 4.0 or disabled
For Balanced Trading (Recommended Starting Point)
Signal Mode: "Majority (2/3 TFs)"
Stop-Loss: 2.5x ATR
Take-Profit: 4.0x ATR
Trailing Stop: Enabled
Cooldown: 3 bars
Min Score: 6.0-8.0
TradingView Strategy Tester Settings
Essential Settings to Configure:
Properties Tab
Initial Capital: Set to realistic account size
Order Size: Use "% of Equity" (e.g., 10-25% per trade)
Commission: Set realistic commission (e.g., 0.05% for crypto, 0.1% for stocks)
Slippage: Add realistic slippage (1-3 ticks for liquid markets)
Verify "Recalculate: On Every Tick" is DISABLED (for realistic backtests)
Inputs Tab
Adjust ATR multipliers for your market
Set appropriate cooldown period
Choose signal mode based on desired trade frequency
Enable/disable trailing stop
Configure directional filter if needed
Backtesting Recommendations
Before Using This Strategy:
Test across multiple markets - What works for one commodity may not work for another
Test different timeframes - Strategy behavior changes significantly with TF
Test different market conditions - Trending vs ranging markets
Validate performance metrics - Win rate, profit factor, max drawdown, Sharpe ratio
Forward test on paper account - Before risking real capital
Key Metrics to Monitor:
Win Rate (aim for >40% minimum)
Profit Factor (aim for >1.5)
Max Drawdown (should be acceptable for your risk tolerance)
Sharpe Ratio (higher is better, >1.0 is good)
Average Trade (should be positive after commissions/slippage)
Known Limitations
Range-bound markets: May produce more whipsaws despite filters
Low volatility: ATR-based stops may be too tight
High volatility: ATR-based stops may be too wide
News events: Strategy cannot account for fundamental shocks
Signal timing: Entry timing is still being optimized
Indicator vs Strategy
When to use the Indicator:
- Manual trading with discretion
- Confluence analysis and timing
- Multiple signal validation
- Learning market structure
When to use the Strategy:
- Automated backtesting
- System validation
- Parameter optimization
- Performance measurement
⚠️ The indicator provides richer information and context than the strategy can execute!
Technical Details
Pine Script v6
Non-repainting: Uses confirmed bars for HTF data
Strategy type: Long/Short with dynamic stops
Risk management: ATR-based (adaptive to volatility)
Position sizing: Configured in Strategy Tester
Pyramiding: Default 1 (no adding to positions)
Important Notes
⚠️ Strategy parameters are still under optimization - Current settings may not be optimal for all markets or timeframes
⚠️ Backtest thoroughly before live trading - Test across different market conditions and timeframes
⚠️ Risk management is critical - Use appropriate position sizing (1-2% risk per trade recommended)
⚠️ Market conditions change - A strategy that works in trending markets may fail in ranging markets
⚠️ Commission and slippage matter - Always include realistic costs in backtests
✅ Start with conservative settings and optimize gradually
✅ Paper trade before going live
✅ Monitor performance and adjust as needed
✅ Never risk more than you can afford to lose
Disclaimer
Educational and testing purposes only. Not financial advice.
This strategy is provided as-is for backtesting and educational purposes. Past performance is not indicative of future results. Trading involves substantial risk of loss. The developer is not responsible for any losses incurred from using this strategy. Always do your own research, backtest thoroughly, and consult with a qualified financial advisor before making trading decisions.
NEVER use this strategy with real money until:
You have thoroughly backtested it on your specific market and timeframe
You understand all parameters and their impact
You have forward tested it on a paper account
You are comfortable with the maximum drawdown and risk profile
The strategy has been marked as production-ready by the developer
Version
v1.2 - Strategy Adapter (Active Development)
Based on: Commodity Pulse Matrix v1.2 Indicator
Last Updated: 2025-10-10
For detailed indicator documentation, see the Commodity Pulse Matrix (CPM) indicator description.
在腳本中搜尋"stop loss"
Tight Entry Trend Engine Strategy═══════════════════════════════════════
TIGHT ENTRY TREND ENGINE
═══════════════════════════════════════
A breakout-based trend-following system designed to capture explosive
moves by entering at precise resistance/support breakouts with minimal
entry risk and massive profit potential.
⚠️ LOW WIN RATE, HIGH REWARD SYSTEM ⚠️
This is NOT a high win-rate strategy. Expect 25-35% winners, but
when it hits, winners are typically 10X+ larger than losers.
═══════════════════════════════════════
🎯 WHAT THIS SYSTEM DOES
═══════════════════════════════════════
The Tight Entry Trend Engine identifies powerful breakout opportunities
by detecting when price breaks through established trendlines with
confirmation from higher timeframe trends:
1. DYNAMIC TRENDLINE DETECTION (3 BANKS)
• Automatically draws support and resistance trendlines
• 3 separate "banks" capture short-term, medium-term, and long-term levels
• Each bank has configurable parameters (required pivot touch count,
angle limits, lengths)
2. BREAKOUT ENTRY TIMING
• Enters LONG when price breaks ABOVE resistance trendlines
• Enters SHORT when price breaks BELOW support trendlines
• Entry Alert occurs at the exact moment of breakout = "tight entry"
• Stop-loss placed just below/above the broken trendline (configurable)
3. HIGHER TIMEFRAME TREND FILTER
• Uses Hull Moving Average (HMA) on higher timeframe for trend following
• Auto-adjusts HTF based on your chart timeframe
• Optional filters prevent entries against major trend
• Optional "overextension" filter avoids buying parabolic moves
4. VOLATILITY-ADAPTIVE RISK MANAGEMENT
• Stop-loss calculated using Average True Range (ATR)
• Tighter stops = better R:R
• Profit targets adjust dynamically with volatility
• Breakeven stop moves automatically when in profit
• Extended profit targets when far from HTF trend
═══════════════════════════════════════
📊 HOW IT WORKS (METHODOLOGY)
═══════════════════════════════════════
STEP 1: TRENDLINE FORMATION
The system continuously scans for pivot highs and pivot lows to
construct trendlines. You control:
BANK 1 (Short-Term):
- Pivot Length: How many bars to look back for swing points
- Min Touches: How many pivots needed to form a line (default: 3)
- Max Length: How far back lines can reach (default: 180 bars)
- Angle Limits: Maximum steepness allowed for valid trendlines
- Tolerance: How close pivots must align to form horizontal lines
BANK 2 (Medium-Term):
- Slightly longer pivot periods for more significant levels
- Captures medium-term trend structure
- Default Max Length: 200 bars
BANK 3 (Long-Term):
- Focuses on major support/resistance zones
- Often uses horizontal levels (angled lines disabled by default)
- Default Max Length: 300 bars
The system draws RESISTANCE lines (red) above price and SUPPORT
lines (green) below price. These adapt in real-time as new pivots form.
STEP 2: BREAKOUT DETECTION
LONG SIGNALS:
- Price closes above a resistance trendline
- Higher timeframe trend is up (optional filter)
- Price not overextended from HTF trend (optional filter)
- No position currently open
SHORT SIGNALS:
- Price closes below a support trendline
- Higher timeframe trend is down (optional filter)
- Price not overextended from HTF trend (optional filter)
- No position currently open
The "tight" aspect: Because you're entering right at the trendline
break, your stop-loss can be placed very close (just below the
broken resistance for longs), creating exceptional risk/reward ratios.
STEP 3: POSITION SIZING
Choose between:
- Fixed $ Risk Per Trade: Risk same dollar amount every trade
- % Risk Per Trade: Risk percentage of current equity
Position size automatically calculated based on:
- Your risk amount
- Distance to stop-loss (ATR-based)
- Works with stocks, futures, crypto (auto-adjusts for contract multipliers)
STEP 4: EXIT MANAGEMENT
Multiple exit methods working together:
- PROFIT TARGET: Exits when profit reaches 100x your risk
- EXTENDED PROFIT: Earlier exit (80R) when very far from HTF trend
- STOP LOSS: Fixed ATR-based stop below entry
- HTF TREND EXIT: Exits when price crosses below HTF trend with profit
- BREAKEVEN PULLBACK: Exits if profit drops below 0.6R after reaching breakeven
- PARTIAL PROFITS: Optional - take partial profits at specified R-multiple
═══════════════════════════════════════
🔧 KEY COMPONENTS EXPLAINED
═══════════════════════════════════════
HULL MOVING AVERAGE (HMA)
A smoothed moving average that reduces lag compared to traditional
MAs. The system uses HMA on a higher timeframe to determine the
dominant trend direction. You can choose:
- Auto HTF: System picks appropriate HTF based on your chart timeframe
- Manual HTF: You specify the higher timeframe
AVERAGE TRUE RANGE (ATR)
Measures current market volatility. Used for:
- Stop-loss distance (tighter when volatility low)
- Profit targets (larger when volatility high)
- Position sizing (smaller positions in volatile conditions)
- Breakeven trigger distance
TRENDLINE ANGLE FILTERING
Each trendline bank has angle limits to ensure quality:
- Resistance lines: Max downward/upward slope allowed
- Support lines: Max downward/upward slope allowed
- Angles automatically adjust based on current volatility
- Prevents overly steep/unreliable trendlines
SENSITIVITY CONTROL
One master slider adjusts multiple parameters:
- Trendline detection sensitivity
- HTF MA length
- Exit timing
- Auto-adjusts for daily+ timeframes (60% increase)
═══════════════════════════════════════
⚙️ WHAT YOU SEE ON YOUR CHART
═══════════════════════════════════════
TRENDLINES:
✓ Red resistance lines above price
✓ Green support lines below price
✓ Orange broken lines (past breakouts)
✓ Lines extend to show current levels
HTF TREND:
✓ Thick colored line showing higher timeframe trend
✓ Color gradient: Red (bearish) → Orange → Yellow → Green (bullish)
✓ 250-bar smoothed curve for visual clarity
ENTRY/EXIT SIGNALS:
✓ Small green dot below bar = Long entry
✓ Small red dot above bar = Short entry
✓ Small red dot above = Long exit
✓ Small black dot below = Short exit
OPTIONAL DETAILED LABELS:
✓ Bank number that triggered entry (Bank 1, 2, or 3)
✓ Exit reason (Profit Target, Stop Loss, HTF Exit, etc.)
✓ Partial profit notifications
POSITION TRACKING:
✓ Yellow dashed line at entry price (extends right)
✓ Green/red fill showing current profit/loss zone
✓ Lime arrows at top = Currently in long position
✓ Red arrows at bottom = Currently in short position
✓ Gray background = No position (flat)
STATS TABLE (Top Right):
✓ Current position (LONG/SHORT/FLAT)
✓ Risk per trade ($ or %)
✓ Entry price
✓ Unrealized P/L in dollars
✓ P/L in R-multiples (how many R's profit/loss)
✓ Average winner/loser R ($ mode) OR CAGR (% mode)
═══════════════════════════════════════
📈 OPTIMAL USAGE
═══════════════════════════════════════
BEST ASSETS:
- NASDAQ:QQQ on 1-hour (reg) chart ⭐ (PRIMARY OPTIMIZATION)
- Strong trending stocks: NVDA, AAPL, TSLA, MSFT, GOOGL, AMZN
- High volatility tech stocks
- Crypto: BTC, ETH
- Any liquid asset with clear trends and momentum (GOLD)
AVOID:
- Low volatility stocks
- Ranging/choppy markets
- Penny stocks or illiquid assets
- Assets without clear directional movement
BEST TIMEFRAMES:
- PRIMARY: 1-hour charts (optimal for QQQ)
- ALSO EXCELLENT: 2H, 4H, 8H
- WORKS: 15min, 30min (only momentum leaders, more noise)
- WORKS WITH ADJUSTMENTS: 1D, 2D (decrease trendline pivot lengths)
═══════════════════════════════════════
📊 BACKTEST RESULTS (QQQ 1H (Reg hours), 1999-2024)
═══════════════════════════════════════
The system showed on NASDAQ:QQQ 1-hour timeframe (regular hours):
- Total Return: 1,100,000%+ over 24 years
- Total Trades: 500+
- Win Rate: ~20-24% (LOW - this is by design!)
- Average Winner: 8-15% gain
- Average Loser: 2-4% loss
- Win/Loss Ratio: 10:1 (winners much bigger than losers)
- Profit Factor: 3+
- Max Drawdown: 45-50%
- Risk per trade: 3% of capital
KEY INSIGHT: This is a LOW WIN RATE, HIGH REWARD system. You will
lose more trades than you win, but the few winners are so large
they more than compensate for many small losses.
IMPORTANT: These are backtested results using optimal parameters
on historical data. Real trading results will vary based on:
- Your execution and timing
- Slippage and commissions
- Your emotional discipline
- Market conditions during your trading period
═══════════════════════════════════════
🎓 WHO IS THIS FOR?
═══════════════════════════════════════
IDEAL FOR:
✓ Swing traders comfortable holding winners for longer period
✓ Part-time traders (1H = check 2-3x per day)
✓ Traders seeking exceptional risk/reward ratios
✓ Those comfortable with low win rates if winners are huge
✓ Technical analysis enthusiasts
✓ Breakout traders
✓ Trend followers
═══════════════════════════════════════
🚀 GETTING STARTED - STEP BY STEP
═══════════════════════════════════════
STEP 1: APPLY TO YOUR CHART
- Search "Tight Entry Trend Engine" in indicators
- Click to apply to your chart
- Trendlines and HTF line will appear immediately
STEP 2: CHOOSE YOUR SETTINGS
For BEGINNERS - Use These Settings First:
1. Trade Direction & Filters:
• ENABLE LONGS: ✓ ON
• ENABLE SHORTS: ✗ OFF (start with longs only)
• Sensitivity: 1.0 (default)
• HTF Trend Entry Filter: ✓ ON (safer entries)
• Block Entries When Overextended: ✓ ON (avoid parabolic tops)
2. Position Sizing & Risk:
• Position Sizing: "Per Risk"
• RISK Type: "$ Per Trade"
• Risk Amount: $200 (or 1-3% of your account)
3. Visual Settings:
• Show Support Lines: ✗ OFF (unless trading shorts)
• Show Detailed Entry/Exit Labels: ✓ ON
• Show Stats Table: ✓ ON
• Show Entry Line & P/L Fill: ✓ ON
4. Leave everything else at DEFAULT for now
STEP 3: UNDERSTAND WHAT YOU SEE
When trendlines appear:
- RED lines above = Resistance (watch for price breaking UP through these)
- GREEN lines below = Support (watch for price breaking DOWN)
- When price breaks a red line = Potential LONG entry
- When price breaks a green line = Potential SHORT entry
The HTF trend line (thick colored):
- Green/lime = Strong uptrend (favorable for longs)
- Red = Strong downtrend (favorable for shorts if enabled)
- Orange/yellow = Transitioning
STEP 4: OBSERVE SIGNALS
- Small GREEN dot below bar = System entered LONG
- Small RED dot above bar = System exited LONG
- Check the label to see which "Bank" triggered (Bank 1, 2, or 3)
- Watch the yellow entry line and colored fill show your P/L
STEP 5: PAPER TRADE FIRST
- Use TradingView's paper trading feature
- Watch how signals perform on YOUR chosen asset
- Understand the win rate will be LOW (20-35%)
- Verify that winners are indeed much larger than losers
- Test for at least 20-30 signals before going live
STEP 6: OPTIMIZE FOR YOUR ASSET (OPTIONAL)
If default settings aren't working well:
For FASTER signals (more trades):
- Reduce Pivot Length 1 to 3-4
- Reduce Max Length 1 to 120-150
- Increase Sensitivity to 1.2-1.5
For SLOWER signals (higher quality):
- Increase Pivot Length 1 to 7-10
- Increase Max Length 1 to 250+
- Decrease Sensitivity to 0.7-0.9
For DAILY timeframes:
- Increase all Pivot Lengths by 30-50%
- Increase all Max Lengths significantly
- Sensitivity: 0.6-0.8
═══════════════════════════════════════
⚙️ ADVANCED SETTINGS EXPLAINED
═══════════════════════════════════════
TRENDLINE BANK SETTINGS:
Each bank (1, 2, 3) has these parameters:
- Min Touches: Minimum pivots to form a line
- Lower (2) = More lines, earlier detection
- Higher (4+) = Fewer lines, higher quality
- Pivot Length: Lookback for swing points
- Lower (3-5) = Reacts to recent price action
- Higher (10+) = Only major swing points
- Max Length: How old a trendline can be
- Shorter (100-150) = Only recent lines
- Longer (300+) = Include historical levels
- Tolerance: Alignment strictness for horizontal lines
- Lower (3.0-3.5) = Very strict horizontal
- Higher (4.5+) = More forgiving alignment
- Allow Angled Lines: Enable diagonal trendlines
- ON = Catches sloped support/resistance
- OFF = Only horizontal levels
- Angle Limits: Maximum steepness allowed
- Lower (1-2) = Only gentle slopes
- Higher (4-6) = Accept steeper angles
- Automatically adjusts for volatility
ATR MULTIPLIERS:
- STOP LOSS ATR (0.6): Distance to stop-loss
- Lower (0.4-0.5) = Tighter stops, stopped out more
- Higher (0.8-1.0) = Wider stops, more room
- PROFIT TARGET ATR (100): Main profit target
- This is 100x your risk = 10,000% R:R
- Lower (50-80) = Take profits sooner
- Higher (120+) = Let winners run longer
- BREAKEVEN ATR (40): When to move stop to breakeven
- Lower (20-30) = Protect profits earlier
- Higher (60+) = Give more room before protecting
HIGHER TIMEFRAME:
- Auto HTF: Automatically selects appropriate HTF
- 5min chart → uses 2H
- 15-30min → uses 6H
- 1-4H → uses 2D
- Daily → uses 4D
- HTF MA Length (300): HMA period for trend
- Lower (150-250) = More responsive
- Higher (400-500) = Smoother, less whipsaw
- HTF Trend Following Exit: Exits when crossing HTF
- ON = Additional exit method
- OFF = Rely only on profit targets/stops
- HTF Trend Entry Filter: Only trade with HTF trend
- ON = Safer, fewer signals
- OFF = More aggressive, more signals
- Block Entries When Overextended: Prevents chasing
- ON = Avoids parabolic tops/bottoms
- OFF = Enter all breakouts regardless
═══════════════════════════════════════
💡 TRADING PHILOSOPHY & EXPECTATIONS
═══════════════════════════════════════
This system is built on one core principle:
"ACCEPT SMALL, FREQUENT LOSSES TO CAPTURE RARE, MASSIVE WINS"
What this means:
- You WILL lose 65%-75% of your trades
- Most losses will be small (1-2R)
- Some winners hit 80R+
- Over time, math works in your favour

Stochastic RSI with MTF TableShort Description of the Script
The provided Pine Script indicator, titled "Stochastic RSI with MTF Table," calculates and displays the Stochastic RSI for the current timeframe and multiple other timeframes (5m, 15m, 30m, 60m, 240m, and daily). The Stochastic RSI is a momentum indicator that blends the Relative Strength Index (RSI) and Stochastic Oscillator to identify overbought and oversold conditions, as well as potential trend reversals via K and D line crossovers.
Key features of the script include:
Inputs: Customizable parameters such as K smoothing (default 3), D smoothing (default 3), RSI length (default 14), Stochastic length (default 14), source price (default close), and overbought/oversold levels (default 80/20).
MTF Table: A table displays the Stochastic RSI status for each timeframe:
"OB" (overbought) if K > 80, "OS" (oversold) if K < 20, or "N" (neutral) otherwise.
Crossovers: "K↑D" for bullish (K crosses above D) and "K↓D" for bearish (K crosses below D).
Visualization: Plots the K and D lines for the current timeframe, with horizontal lines at 80 (overbought), 50 (middle), and 20 (oversold), plus a background fill for clarity.
Table Position: Configurable to appear in one of four chart corners (default: top-right).
This indicator helps traders assess momentum across multiple timeframes simultaneously, aiding in the identification of trend strength and potential entry/exit points.
Trading Strategy with 50EMA and 200EMA for Highest Winning Rate
To create a strategy with the best probability of a high winning rate using the Stochastic RSI MTF indicator alongside the 50-period Exponential Moving Average (50EMA) and 200-period Exponential Moving Average (200EMA), we can combine trend identification with momentum-based entry timing. The 50EMA and 200EMA are widely used to determine medium- and long-term trends, while the Stochastic RSI MTF table provides multi-timeframe momentum signals. Here’s the strategy:
1. Determine the Overall Trend
Bullish Trend: The 50EMA is above the 200EMA on the current timeframe (e.g., daily or 60m chart). This suggests an uptrend, often associated with a "Golden Cross."
Bearish Trend: The 50EMA is below the 200EMA on the current timeframe. This indicates a downtrend, often linked to a "Death Cross."
Implementation: Plot the 50EMA and 200EMA on your chart and visually confirm their relative positions.
2. Identify Entry Signals Using the Stochastic RSI MTF Table
In a Bullish Trend (50EMA > 200EMA):
Look for timeframes in the MTF table showing:
Oversold (OS): K < 20, indicating a potential pullback in the uptrend where price may rebound.
Bullish Crossover (K↑D): K crosses above D, signaling rising momentum and a potential entry point.
Example: If the 60m and 240m timeframes show "OS" or "K↑D," this could be a buy signal.
In a Bearish Trend (50EMA < 200EMA):
Look for timeframes in the MTF table showing:
Overbought (OB): K > 80, suggesting a rally in the downtrend where price may reverse downward.
Bearish Crossover (K↓D): K crosses below D, indicating declining momentum and a potential short entry.
Example: If the 30m and daily timeframes show "OB" or "K↓D," this could be a sell/short signal.
Current Timeframe Check: Use the plotted K and D lines on your trading timeframe for precise entry timing (e.g., confirm a K↑D crossover on a 60m chart for a long trade).
3. Confirm Signals Across Multiple Timeframes
Strengthen the Signal: A higher winning rate is more likely when multiple timeframes align with the trend and signal. For instance:
Bullish trend + "OS" or "K↑D" on 60m, 240m, and daily = strong buy signal.
Bearish trend + "OB" or "K↓D" on 15m, 60m, and 240m = strong sell signal.
Prioritize Higher Timeframes: Signals from the 240m or daily timeframe carry more weight due to their indication of broader trends, increasing reliability.
4. Set Stop-Loss and Take-Profit Levels
Long Trades (Bullish):
Stop-Loss: Place below the most recent swing low or below the 50EMA, whichever is closer, to protect against trend reversals.
Take-Profit: Target a key resistance level or use a risk-reward ratio (e.g., 2:1 or 3:1) based on the stop-loss distance.
Short Trades (Bearish):
Stop-Loss: Place above the most recent swing high or above the 50EMA, whichever is closer.
Take-Profit: Target a key support level or apply a similar risk-reward ratio.
Trailing Stop Option: As the trend progresses, trail the stop below the 50EMA (for longs) or above it (for shorts) to lock in profits.
5. Risk Management
Position Sizing: Risk no more than 1-2% of your trading capital per trade to minimize losses from false signals.
Volatility Consideration: Adjust stop-loss distances and position sizes based on the asset’s volatility (e.g., wider stops for volatile stocks or crypto).
Avoid Overtrading: Wait for clear alignment between the EMA trend and MTF signals to avoid low-probability setups.
Example Scenario
Chart: 60-minute timeframe.
Trend: 50EMA > 200EMA (bullish).
MTF Table: 60m shows "OS," 240m shows "K↑D," and daily is "N."
Action: Enter a long position when the 60m K line crosses above D, confirming the table signal.
Stop-Loss: Below the recent 60m swing low (e.g., 2% below entry).
Take-Profit: At the next resistance level or a 3:1 reward-to-risk ratio.
Outcome: High probability of success due to trend alignment and multi-timeframe confirmation.
Why This Strategy Works
Trend Following: Trading in the direction of the 50EMA/200EMA trend reduces the risk of fighting the market’s momentum.
Momentum Timing: The Stochastic RSI MTF table pinpoints pullbacks or reversals within the trend, improving entry timing.
Multi-Timeframe Confirmation: Alignment across timeframes filters out noise, increasing the win rate.
Risk Control: Defined stop-loss and position sizing protect against inevitable losses.
Caveats
No strategy guarantees a 100% win rate; false signals can occur, especially in choppy markets.
Test this strategy on historical data or a demo account to verify its effectiveness for your asset and timeframe.
This approach leverages the strengths of both trend-following (EMA) and momentum (Stochastic RSI) tools, aiming for a high-probability, disciplined trading system.

EMA Crossover Strategy with Take Profit and Candle HighlightingStrategy Overview:
This strategy is based on the Exponential Moving Averages (EMA), specifically the EMA 20 and EMA 50. It takes advantage of EMA crossovers to identify potential trend reversals and uses multiple take-profit levels and a stop-loss for risk management.
Key Components:
EMA Crossover Signals:
Buy Signal (Uptrend): A buy signal is generated when the EMA 20 crosses above the EMA 50, signaling the start of a potential uptrend.
Sell Signal (Downtrend): A sell signal is generated when the EMA 20 crosses below the EMA 50, signaling the start of a potential downtrend.
Take Profit Levels:
Once a buy or sell signal is triggered, the strategy calculates multiple take-profit levels based on the range of the previous candle. The user can define multipliers for each take-profit level.
Take Profit 1 (TP1): 50% of the previous candle's range above or below the entry price.
Take Profit 2 (TP2): 100% of the previous candle's range above or below the entry price.
Take Profit 3 (TP3): 150% of the previous candle's range above or below the entry price.
Take Profit 4 (TP4): 200% of the previous candle's range above or below the entry price.
These levels are adjusted dynamically based on the previous candle's high and low, so they adapt to changing market conditions.
Stop Loss:
A stop-loss is set to manage risk. The default stop-loss is 3% from the entry price, but this can be adjusted in the settings. The stop-loss is triggered if the price moves against the position by this amount.
Trend Direction Highlighting:
The strategy highlights the bars (candles) with colors:
Green bars indicate an uptrend (when EMA 20 crosses above EMA 50).
Red bars indicate a downtrend (when EMA 20 crosses below EMA 50).
These visual cues help users easily identify the market direction.
Strategy Entries and Exits:
Entries: The strategy enters a long (buy) position when the EMA 20 crosses above the EMA 50 and a short (sell) position when the EMA 20 crosses below the EMA 50.
Exits: The strategy exits the positions at any of the defined take-profit levels or the stop-loss. Multiple exit levels provide opportunities to take profit progressively as the price moves in the favorable direction.
Entry and Exit Conditions in Detail:
Buy Entry Condition (Uptrend):
A buy position is opened when EMA 20 crosses above EMA 50, signaling the start of an uptrend.
The strategy calculates take-profit levels above the entry price based on the previous bar's range (high-low) and the multipliers for TP1, TP2, TP3, and TP4.
Sell Entry Condition (Downtrend):
A sell position is opened when EMA 20 crosses below EMA 50, signaling the start of a downtrend.
The strategy calculates take-profit levels below the entry price, similarly based on the previous bar's range.
Exit Conditions:
Take Profit: The strategy attempts to exit the position at one of the take-profit levels (TP1, TP2, TP3, or TP4). If the price reaches any of these levels, the position is closed.
Stop Loss: The strategy also has a stop-loss set at a default value (3% below the entry for long trades, and 3% above for short trades). The stop-loss helps to protect the position from significant losses.
Backtesting and Performance Metrics:
The strategy can be backtested using TradingView's Strategy Tester. The results will show how the strategy would have performed historically, including key metrics like:
Net Profit
Max Drawdown
Win Rate
Profit Factor
Average Trade Duration
These performance metrics can help users assess the strategy's effectiveness over historical periods and optimize the input parameters (e.g., multipliers, stop-loss level).
Customization:
The strategy allows for the adjustment of several key input values via the settings panel:
Take Profit Multipliers: Users can customize the multipliers for each take-profit level (TP1, TP2, TP3, TP4).
Stop Loss Percentage: The user can also adjust the stop-loss percentage to a custom value.
EMA Periods: The default periods for the EMA 50 and EMA 20 are fixed, but they can be adjusted for different market conditions.
Pros of the Strategy:
EMA Crossover Strategy: A classic and well-known strategy used by traders to identify the start of new trends.
Multiple Take Profit Levels: By taking profits progressively at different levels, the strategy locks in gains as the price moves in favor of the position.
Clear Trend Identification: The use of green and red bars makes it visually easier to follow the market's direction.
Risk Management: The stop-loss and take-profit features help to manage risk and optimize profit-taking.
Cons of the Strategy:
Lagging Indicators: The strategy relies on EMAs, which are lagging indicators. This means that the strategy might enter trades after the trend has already started, leading to missed opportunities or less-than-ideal entry prices.
No Confirmation Indicators: The strategy purely depends on the crossover of two EMAs and does not use other confirming indicators (e.g., RSI, MACD), which might lead to false signals in volatile markets.
How to Use in Real-Time Trading:
Use for Backtesting: Initially, use this strategy in backtest mode to understand how it would have performed historically with your preferred settings.
Paper Trading: Once comfortable, you can use paper trading to test the strategy in real-time market conditions without risking real money.
Live Trading: After testing and optimizing the strategy, you can consider using it for live trading with proper risk management in place (e.g., starting with a small position size and adjusting parameters as needed).
Summary:
This strategy is designed to identify trend reversals using EMA crossovers, with customizable take-profit levels and a stop-loss to manage risk. It's well-suited for traders looking for a systematic way to enter and exit trades based on clear market signals, while also providing flexibility to adjust for different risk profiles and trading styles.

Filtered MACD with Backtest [UAlgo]The "Filtered MACD with Backtest " indicator is an advanced trading tool designed for the TradingView platform. It combines the Moving Average Convergence Divergence (MACD) with additional filters such as Moving Average (MA) and Average Directional Index (ADX) to enhance trading signals. This indicator aims to provide more reliable entry and exit points by filtering out noise and confirming trends. Additionally, it includes a comprehensive backtesting module to simulate trading strategies and assess their performance based on historical data. The visual backtest module allows traders to see potential trades directly on the chart, making it easier to evaluate the effectiveness of the strategy.
🔶 Customizable Parameters :
Price Source Selection: Users can choose their preferred price source for calculations, providing flexibility in analysis.
Filter Parameters:
MA Filter: Option to use a Moving Average filter with types such as EMA, SMA, WMA, RMA, and VWMA, and a customizable length.
ADX Filter: Option to use an ADX filter with adjustable length and threshold to determine trend strength.
MACD Parameters: Customizable fast length, slow length, and signal smoothing for the MACD indicator.
Backtest Module:
Entry Type: Supports "Buy and Sell", "Buy", and "Sell" strategies.
Stop Loss Types: Choose from ATR-based, fixed point, or X bar high/low stop loss methods.
Reward to Risk Ratio: Set the desired take profit level relative to the stop loss.
Backtest Visuals: Display entry, stop loss, and take profit levels directly on the chart with
colored backgrounds.
Alerts: Configurable alerts for buy and sell signals.
🔶 Filtered MACD : Understanding How Filters Work with ADX and MA
ADX Filter:
The Average Directional Index (ADX) measures the strength of a trend. The script calculates ADX using the user-defined length and applies a threshold value.
Trading Signals with ADX Filter:
Buy Signal: A regular MACD buy signal (crossover of MACD line above the signal line) is only considered valid if the ADX is above the set threshold. This suggests a stronger uptrend to potentially capitalize on.
Sell Signal: Conversely, a regular MACD sell signal (crossunder of MACD line below the signal line) is only considered valid if the ADX is above the threshold, indicating a stronger downtrend for potential shorting opportunities.
Benefits: The ADX filter helps avoid whipsaws or false signals that might occur during choppy market conditions with weak trends.
MA Filter:
You can choose from various Moving Average (MA) types (EMA, SMA, WMA, RMA, VWMA) for the filter. The script calculates the chosen MA based on the user-defined length.
Trading Signals with MA Filter:
Buy Signal: A regular MACD buy signal is only considered valid if the closing price is above the MA value. This suggests a potential uptrend confirmed by the price action staying above the moving average.
Sell Signal: Conversely, a regular MACD sell signal is only considered valid if the closing price is below the MA value. This suggests a potential downtrend confirmed by the price action staying below the moving average.
Benefits: The MA filter helps identify potential trend continuation opportunities by ensuring the price aligns with the chosen moving average direction.
Combining Filters:
You can choose to use either the ADX filter, the MA filter, or both depending on your strategy preference. Using both filters adds an extra layer of confirmation for your signals.
🔶 Backtesting Module
The backtesting module in this script allows you to visually assess how the filtered MACD strategy would have performed on historical data. Here's a deeper dive into its features:
Backtesting Type: You can choose to backtest for buy signals only, sell signals only, or both. This allows you to analyze the strategy's effectiveness in different market conditions.
Stop-Loss Types: You can define how stop-loss orders are placed:
ATR (Average True Range): This uses a volatility measure (ATR) multiplied by a user-defined factor to set the stop-loss level.
Fixed Point: This allows you to specify a fixed dollar amount or percentage value as the stop-loss.
X bar High/Low: This sets the stop-loss at a certain number of bars (defined by the user) above/below the bar's high (for long positions) or low (for short positions).
Reward-to-Risk Ratio: Define the desired ratio between your potential profit and potential loss on each trade. The backtesting module will calculate take-profit levels based on this ratio and the stop-loss placement.
🔶 Disclaimer:
Use with Caution: This indicator is provided for educational and informational purposes only and should not be considered as financial advice. Users should exercise caution and perform their own analysis before making trading decisions based on the indicator's signals.
Not Financial Advice: The information provided by this indicator does not constitute financial advice, and the creator (UAlgo) shall not be held responsible for any trading losses incurred as a result of using this indicator.
Backtesting Recommended: Traders are encouraged to backtest the indicator thoroughly on historical data before using it in live trading to assess its performance and suitability for their trading strategies.
Risk Management: Trading involves inherent risks, and users should implement proper risk management strategies, including but not limited to stop-loss orders and position sizing, to mitigate potential losses.
No Guarantees: The accuracy and reliability of the indicator's signals cannot be guaranteed, as they are based on historical price data and past performance may not be indicative of future results.

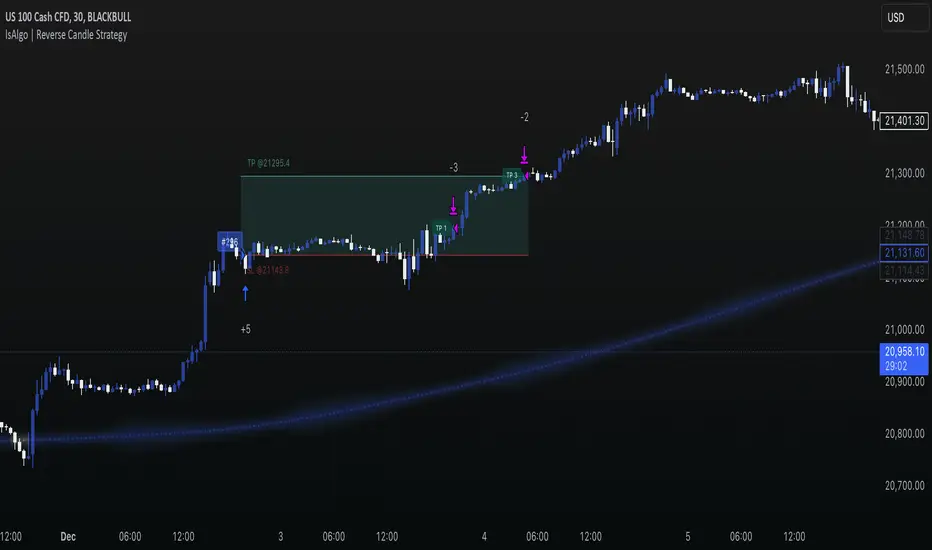
IsAlgo - Reverse Candle Strategy► Overview:
The Reverse Candle Strategy leverages a customizable moving average to identify the start of a trend. It utilizes the highest and lowest prices to define the trend and its corrections, executing trades based on custom candlestick patterns to capitalize on the main trend's continuation.
► Description:
The Reverse Candle Strategy is designed to effectively identify and trade market trends by combining moving averages and custom candlestick patterns. The core of the strategy is a single, customizable moving average, which helps determine the trend direction. When the market price crosses above the moving average, this signifies the beginning of an uptrend. The strategy then tracks the highest price reached during the uptrend and waits for a correction. A specific custom candlestick pattern signals the end of the correction, at which point the strategy executes a long trade.
In the case of a downtrend, the market price crossing below the moving average marks the trend’s start. The strategy monitors the lowest price during the downtrend and awaits a correction. The end of this correction is identified by another custom candlestick pattern, prompting the strategy to execute a short trade. This combination of a moving average with precise candlestick patterns ensures that trades are made at optimal moments, improving the likelihood of successful trades.
The integration of the moving average and candlestick patterns is critical. The moving average smooths out price data to highlight the trend direction, while the custom candlestick patterns provide specific entry signals after a correction, ensuring the trend’s resumption is genuine. This synergy enhances the strategy’s ability to filter out false signals and improve trade accuracy.
↑ Long Entry Example:
When the price is moving above the moving average and the highest price has been detected, the strategy will wait for the entry candle to execute the long trade.
↓ Short Entry Example:
When the price is moving below the moving average and the lowest price has been detected, the strategy will wait for the entry candle to execute the short trade.
✕ Exit Conditions:
To manage risk effectively, the strategy provides multiple stop-loss options. Traders can set stop-loss levels using fixed pips, ATR-based calculations, or the higher/lower price of past candles. Additionally, trades can be closed if a candle moves against the trade direction. Up to three take-profit levels can be set using fixed pips, ATR, or risk-to-reward ratios, allowing traders to secure profits at different stages. The trailing stop feature adjusts the stop loss as the trade moves into profit, locking in gains while allowing for continued potential upside. Furthermore, a break-even feature moves the stop loss to the entry price once a certain profit level is reached, protecting against losses. Trades can also be closed when the price crosses the moving average.
► Features & Settings:
⚙︎ Moving Average: Users can choose between various types of moving averages (e.g., SMA, EMA) to confirm the trend direction.
⚙︎ Trend & Corrections: Set minimum and maximum pips for trends and corrections, with an option to define correction percentages relative to the trend.
⚙︎ Entry Candle: Define the entry candle by specifying the minimum and maximum size of the candle's body and the ratio of the body to the entire candle size, ensuring significant breakouts trigger trades.
⚙︎ Trading Session: This feature allows users to define specific trading hours during which the strategy should operate, ensuring trades are executed only during preferred market periods.
⚙︎ Trading Days: Users can specify which days the strategy should be active, offering the flexibility to avoid trading on specific days of the week.
⚙︎ Backtesting: Enables a backtesting period during which the strategy can be tested over a selected start and end date. This feature can be deactivated if not needed.
⚙︎ Trades: Configure trade direction (long, short, or both), position sizing (fixed or percentage-based), maximum number of open trades, and daily trade limits.
⚙︎ Trades Exit: Various exit methods, such as setting profit or loss limits, trade duration, or closing trades on moving average crossings.
⚙︎ Stop Loss: Various stop-loss methods are available, including a fixed number of pips, ATR-based, or using the highest or lowest price points within a specified number of previous candles. Additionally, trades can be closed after a specific number of candles move in the opposite direction of the trade.
⚙︎ Break Even: This feature adjusts the stop loss to a break-even point once certain conditions are met, such as reaching predefined profit levels, to protect gains.
⚙︎ Trailing Stop: The trailing stop feature adjusts the stop loss as the trade moves into profit, securing gains while potentially capturing further upside.
⚙︎ Take Profit: up to three take-profit levels using fixed pips, ATR, or risk-to-reward ratios based on the stop loss. Alternatively, specify a set number of candles moving in the trade direction.
⚙︎ Alerts: The strategy includes a comprehensive alert system that informs the user of all significant actions, such as trade openings and closings. It supports placeholders for dynamic values like take-profit levels and stop-loss prices.
⚙︎ Dashboard: Visual display providing detailed information about ongoing and past trades on the chart, helping users monitor performance and make informed decisions.
► Backtesting Details:
Timeframe: 30-minute NAS100 chart
Initial Balance: $10,000
Order Size: 5 Units
Commission: $0.5 per contract
Slippage: 5 ticks
Stop Loss: MA Crossing or by break even
IsAlgo - Ultra Trend Strategy► Overview:
The Ultra Trend strategy is designed to identify trend lines based on average price movement and execute trades when the price crosses the middle line, confirmed by an entry candle. This strategy combines ATR, Moving Averages, and customizable candlestick patterns to provide a versatile and robust trading approach.
► Description:
The Ultra Trend strategy employs a multi-faceted approach to accurately gauge market trends and execute trades. It combines the Average True Range (ATR) with trendline analysis and Moving Averages, providing a comprehensive view of market conditions. The strategy uses ATR to measure market volatility and the average price movement, helping to set dynamic thresholds for trend detection and adapting to changing market conditions. The slope of the trend is calculated based on the angle of price movement, which aids in identifying the strength and direction of the trend.
Additionally, a Moving Average is used to filter trades, ensuring alignment with the broader market direction and reducing false signals, thereby enhancing trade accuracy.
Traders can configure the strategy to enter trades in the direction of the trend, against the trend, or both. This feature enhances the adaptability of the Ultra Trend strategy, making it suitable for various trading styles and market environments.
↑ Long Entry:
A long trade is executed when the entry candle crosses and closes above the trend line. This indicates a bullish market condition, signaling an opportunity to enter a buy position.
↓ Short Entry:
A short trade is executed when the entry candle crosses and closes below the trend line. This indicates a bearish market condition, signaling an opportunity to enter a sell position.
✕ Exit Conditions:
The strategy offers multiple stop-loss options to manage risk effectively. Traders can set stop-loss levels using fixed pips, ATR-based calculations, the higher/lower price of past candles, or close a trade if a candle moves against the trade direction.
Up to three take profit levels can be set using methods such as fixed pips, ATR, and risk-to-reward ratios. This allows traders to secure profits at various stages of the trade.
A trailing stop feature adjusts the stop loss as the trade moves into profit, locking in gains while allowing the trade to continue capturing potential upside. Additionally, a break-even feature moves the stop loss to the entry price once a certain profit level is reached, protecting against losses.
Trades can also be closed when a trend change is detected or when a candle closes outside a predefined channel, ensuring that positions are exited promptly in response to changing market conditions.
► Features and Settings:
⚙︎ Trend: Users can configure the trend direction, length, factor, and slope, allowing for precise control over how trends are identified and followed.
⚙︎ Moving Average: An Exponential Moving Average (EMA) can be employed to confirm the trend direction indicated by the trend lines. This provides further assurance that the trend line breakout is not a false signal. The EMA can be enabled or disabled based on user preference.
⚙︎ Entry Candle: The entry candle is the candle that breaks the trend line, signaling an entry opportunity. Users can specify the minimum and maximum size of the candle's body and the ratio of the body to the entire candle size. This ensures that only significant breakouts trigger trades.
⚙︎ Trading Session: This feature allows users to define specific trading hours during which the strategy should operate, ensuring trades are executed only during preferred market periods.
⚙︎ Trading Days: Users can specify which days the strategy should be active, offering the flexibility to avoid trading on specific days of the week.
⚙︎ Backtesting: Enables a backtesting period during which the strategy can be tested over a selected start and end date. This feature can be deactivated if not needed.
⚙︎ Trades: This includes configuring the direction of trades (long, short, or both), position sizing (fixed or percentage-based), the maximum number of open trades, and limitations on the number of trades per day or based on trend.
⚙︎ Trades Exit: The strategy offers various exit methods, such as setting profit or loss limits, specifying the duration a trade should remain open, or closing trades based on trend reversal.
⚙︎ Stop Loss: Various stop-loss methods are available, including a fixed number of pips, ATR-based, or using the highest or lowest price points within a specified number of previous candles. Additionally, trades can be closed after a specific number of candles move in the opposite direction of the trade.
⚙︎ Break Even: This feature adjusts the stop loss to a break-even point once certain conditions are met, such as reaching predefined profit levels, to protect gains.
⚙︎ Trailing Stop: The trailing stop feature adjusts the stop loss as the trade moves into profit, securing gains while potentially capturing further upside.
⚙︎ Take Profit: Up to three take-profit levels can be set using various methods, such as a fixed amount of pips, ATR, or risk-to-reward ratios based on the stop loss. Alternatively, users can specify a set number of candles moving in the direction of the trade.
⚙︎ Alerts: The strategy includes a comprehensive alert system that informs the user of all significant actions, such as trade openings and closings. It supports placeholders for dynamic values like take-profit levels and stop-loss prices.
⚙︎ Dashboard: A visual display provides detailed information about ongoing and past trades on the chart, helping users monitor the strategy's performance and make informed decisions.
► Backtesting Details:
Timeframe: 5-minute US30 chart
Initial Balance: $10,000
Order Size: 4% of equity per trade
Commission: $0.05 per contract
Slippage: 5 ticks
Stop Loss: ATR-based

IsAlgo - AI Trend Strategy► Overview:
The AI Trend Strategy employs a combination of technical indicators to guide trading decisions across various markets and timeframes. It uses a custom Super Trend indicator and an Exponential Moving Average (EMA) to analyze market trends and executes trades based on specific candlestick patterns. This strategy includes options for setting stop losses, take profit levels, and features an alert system for trade notifications.
► Description:
This strategy focuses on identifying the optimal "entry candle," which signals either a potential correction within the ongoing trend or the emergence of a new trend. The entry criteria for this candle are highly customizable, allowing traders to specify dimensions such as the candle's minimum and maximum size and body ratio. Additional settings include whether this candle should be the highest or lowest compared to recent candles and if a confirmation candle is necessary to validate the entry.
The Super Trend indicator is central to the strategy’s operation, dictating the direction of trades by identifying bullish or bearish trends. Traders have the option to configure trades to align with the direction of the trend identified by this indicator, or alternatively, to take positions counter to the trend for potential reversal strategies. This flexibility can be crucial during varying market conditions.
Additionally, the strategy incorporates an EMA alongside the Super Trend indicator to further analyze trend directions. This combined approach aims to reduce the occurrence of false signals and improve the strategy's overall trend analysis.
The learning algorithm is a standout feature of the AI Trend Strategy. After accumulating data from a predefined number of trades (e.g., after the first 100 trades), the algorithm begins to analyze past performances to identify patterns in wins and losses. It considers variables such as the distance from the current price to the trend line, the range between the highest and lowest prices during the trend, and the duration of the trend. This data informs the algorithm's predictions for future trades, aiming to improve accuracy and reduce losses by adapting to the evolving market conditions.
► Examples of Trade Execution:
1. In an Uptrend: The strategy might detect a suitable entry candle during a correction phase, which aligns with the continuing uptrend for a potential long trade.
2. In a Downtrend: Alternatively, the strategy might identify an entry candle at the end of a downtrend, suggesting a potential reversal or correction where a long trade could be initiated.
3. In an Uptrend: The strategy may also spot an entry candle at the end of an uptrend and execute a short trade, anticipating a reversal or significant pullback.
4. In a Downtrend: The strategy might find a suitable entry candle during a correction phase, indicating a continuation of the downtrend for a potential short trade.
These examples illustrate how the strategy identifies potential trading opportunities based on trend behavior and candlestick patterns.
► Features and Settings:
⚙︎ Trend: Utilizes a custom Super Trend indicator to identify the direction of the market trend. Users can configure the strategy to execute trades in alignment with this trend, take positions contrary to the trend, or completely ignore the trend information for their trading decisions.
⚙︎ Moving average: Employs an Exponential Moving Average (EMA) to further confirm the trend direction indicated by the Super Trend indicator. This setting can be used in conjunction with the Super Trend or disabled if preferred.
⚙︎ Entry candle: Defines the criteria for the candle that triggers a trade. Users can customize aspects such as the candle's size, body, and its relative position to previous candles to ensure it meets specific trading requirements before initiating a trade.
⚙︎ Learning algorithm: This component uses historical trade data to refine the strategy. It assesses various aspects of past trades, such as price trends and market conditions, to make more informed trading decisions in the future.
⚙︎ Trading session: Users can define specific trading hours during which the strategy should operate, allowing trades to be executed only during preferred market periods.
⚙︎ Trading days: This option enables users to specify which days the strategy should be active, providing the flexibility to avoid trading on certain days of the week if desired.
⚙︎ Backtesting: Enables a period during which the strategy can be tested over a selected start and end date, with an option to deactivate this feature if not needed.
⚙︎ Trades: Detailed configuration options include the direction of trades (long, short, or both), position sizing (fixed or percentage-based), the maximum number of open trades, and limitations on the number of trades per day or based on trend changes.
⚙︎ Trades Exit: Offers various strategies for exiting trades, such as setting limits on profits or losses, specifying the duration a trade should remain open, or closing trades based on trend reversal signals.
⚙︎ Stop loss: Various methods for setting stop losses are available, including fixed pips, based on Average True Range (ATR), or utilizing the highest or lowest price points within a designated number of previous candles. Another option allows for closing the trade after a specific number of candles moving in the opposite direction.
⚙︎ Break even: This feature adjusts the stop loss to a break-even point under certain conditions, such as reaching predefined profit levels, to protect gains.
⚙︎ Trailing stop: The trailing stop feature adjusts the stop loss as the trade moves into profit, aiming to secure gains while potentially capturing further upside.
⚙︎ Take profit: Up to three take profit levels can be established using various methods, such as a fixed amount of pips, risk-to-reward ratios based on the stop loss, ATR, or after a set number of candles that move in the direction of the trade.
⚙︎ Alerts: Includes a comprehensive alert system that informs the user of all significant actions taken by the strategy, such as trade openings and closings. It supports placeholders for dynamic values like take profit levels, stop loss prices, and more.
⚙︎ Dashboard: Provides a visual display of detailed information about ongoing and past trades on the chart, helping users monitor the strategy’s performance and make informed decisions.
► Backtesting Details:
Timeframe: 15-minute BTCUSD chart.
Initial Balance: $10,000.
Order Size: 4% of equity per trade.
Commission: 0.01%.
Slippage: 5 ticks.
Risk Management: Strategic stop loss settings are applied based on the most extreme price points within the last 18 candles.

Price Action Pattern Breakout Strategy: Wedge,Triangle,ChannelIntroducing the Price Action Pattern Breakout Strategy: Wedge,Triangle,Channel 💹🚀
The "Price Action Pattern Breakout Strategy: Wedge, Triangle, Channel" is a dynamic and automated trading strategy that excels in recognizing and capitalizing on breakout opportunities within the realm of powerful price action patterns. It is finely tuned to achieve exceptional precision in detecting three distinct pattern types: Wedge, Triangle, and Channel. This diversity equips you to confidently navigate a wide range of market scenarios and opportunities.
This strategy automates trade entries and exits upon confirmed pattern breakouts, this eliminates human errors in correctly recognizing patterns and prevents emotional decisions. This strategy is designed to work across different time frames, making it suitable for both short-term and long-term traders. Whether you're a day trader, swing trader, or investor, this strategy provides the flexibility you need to thrive in diverse market conditions.
💎 How it Works:
▶️ In this strategy, three price action patterns have been utilized, one of which is the "Wedge" pattern. The Wedge pattern has consistently demonstrated a high level of credibility, typically resulting in sharp and rapid price movements following a confirmed breakout from this pattern. This characteristic makes the Wedge pattern highly noteworthy in our strategy. The second pattern is the "Triangle" pattern, which, depending on its formation, whether ascending or descending, can indicate a strong continuation or reversal of the trend. The last pattern is the "Channel" pattern. The reason for using the Channel pattern is its versatility in various market conditions and its tendency to produce reliable results.
In the snapshot below, you can observe the types of patterns that this strategy is capable of identifying at a glance:
▶️ This strategy employs two types of targeting systems: Fixed Targets and Trailing Targets.
Fixed Targets is the default targeting system of the strategy, incorporating two primary targets: TP1 (Target Point 1) and TP2 (Target Point 2). These targets are thoughtfully adjusted in alignment with specific rules for each pattern. With Fixed Targets, you have the flexibility to designate the position size percentage for your exits at TP1 and TP2. For instance, should you opt to allocate 60% of your position size to TP1, as soon as the price triggers the first take profit level, 60% of your initial position is gracefully closed, leaving the remaining 40% to exit the trade upon reaching TP2.
Trailing Targets represent the strategy's alternative targeting system. With this system, the trailing stop becomes active once the price reaches the specified trigger point. The strategy then exits the trade based on the defined offset percentage and price retracement from the trailing limit.
▶️ This strategy relies on a single type of stop loss, determined by previous pivot points and adjusted based on the trade's direction, whether long or short, placing the stop loss above or below the prior pivot. This stop loss approach has demonstrated reliability when used alongside price action patterns.
In addition to this fixed stop loss, you can specify a percentage buffer, offering protection against potential stop hunting due to market fluctuations. This buffer helps protect your positions from sudden price swings. For example, selecting a 1% buffer means your stop loss will be positioned 1% higher or lower concerning the last pivot, depending on your trade's direction. This added layer of security ensures your trades remain resilient and less vulnerable to market volatility.
▶️ A practical feature of this strategy is the "Risk-Free" option. Once activated, it continuously monitors price movements, and as soon as the price progresses in the trade's direction and surpasses the designated Risk-Free Trigger Point in percentage, the stop loss is dynamically shifted from its initial position to the entry price, effectively making the trade "risk-free." This means that if the trade doesn't go as expected, we exit at the entry point, incurring neither profit nor loss from the trade.
Additionally, you have the flexibility to fine-tune the modified stop loss, positioning it slightly above or below the entry price through the configuration of a specified percentage. This allows for effective consideration of commission fees in your trading strategy.
▶️ Risk management is a crucial concept in trading, playing a significant role in a trader's long-term success. This strategy introduces a unique feature called "Fixed Loss Position Sizing", where upon activation, you can limit the risk exposure to a specified percentage of your capital per trade. Set your preferred risk percentage along with the intended leverage. The strategy independently considers your available capital and designated leverage, determining the position size before executing any trade.
In the case of a stop loss, your loss is limited to the specified risk percentage. For instance, with a $1000 account and a 1% risk set, the strategy adjusts each trade's size to ensure a maximum loss of $10 if the stop loss is triggered. Enabling this feature will ensure disciplined risk management, aligning potential losses precisely with your predetermined risk percentage, contingent upon your total available capital.
▶️ Another feature of this strategy is a sophisticated mechanism called "Loss Compensation". When enabled, Loss Compensation dynamically adjusts the position size after a loss, aiming to recover from previous losses in subsequent trades. This adaptive mechanism continually modifies the position size to mitigate the impact of consecutive losses until reaching a user-defined limit for consecutive loss compensations.
The feature's configurability allows users to set the maximum number of consecutive losses to compensate for and also includes an option to factor in trading fees from prior trades into the compensation calculation. Loss Compensation operates in conjunction with the 'Fixed Loss Position Sizing' setting, ensuring that once losses are sufficiently compensated, subsequent entries revert to the predefined configurations within the 'Fixed Loss Position Sizing' settings.
This advanced tool ensures a stable risk management approach by changing trade sizes dynamically according to past results during consecutive loss periods.
▶️ This strategy incorporates a feature known as the "Counter-Pattern Breakout", altering its approach to wedge, triangle, and channel pattern breakouts. Normally, the strategy relies on standard pattern signals to determine whether to enter long or short positions based on breakout directions.
For example, in an ascending channel or a rising wedge pattern, the strategy typically seeks a short position opportunity upon a confirmed breakout in the lower line, and breakouts from the upper line are disregarded by the strategy. But with this feature enabled, strategy disregards the conventional pattern signals, seizing breakouts from upper or lower lines to open corresponding positions. For instance, in the ascending channel or the rising wedge pattern example, the strategy might enter a long position if the upper line breaks or a short position if the lower line breaks.
This introduces a more adaptive and opportunistic trading style, allowing you to capitalize on price movements, irrespective of the typical signal direction indicated by the pattern.
▶️ This strategy is fully compatible with third-party trading bots, allowing for easy connectivity to popular trading platforms. By leveraging the TradingView webhook functionality, you can effortlessly link the strategy to your preferred bot and receive accurate signals for position entry and exit. The strategy provides all the necessary alert message fields, ensuring a smooth and user-friendly trading experience. With this integration, you can automate the execution of trades, saving time and effort while enjoying the benefits of this powerful strategy.
⚙️ How to Use & Configure User Settings:
To fully utilize the "Price Action Pattern Breakout Strategy: Wedge, Triangle, Channel," it's essential to consider and comprehend the following steps. They play a crucial role in enhancing its functionality and achieving its utmost potential outcomes:
1. General Strategy Settings:
Enable Dark Mode if using a dark TradingView theme for improved chart visibility.
Select the Strategy's Trade Direction: Long, Short, or Both.
Choose Pattern Recognition Accuracy: High for precise recognition but fewer positions, Low for more positions with slightly less accuracy.
Enable 'Prevent New Entry on Opposite Signal While In Position' to avoid new trades if the opposite signal occurs.
Switch to Indicator Mode if solely using the strategy as an indicator or in combination with other strategies.
2. Pattern and Pivot Configuration:
Consider configuring the Number of Patterns and Pivot Lookback Lengths. Here, you can personalize the pivot lookback lengths for wedge, triangle, and channel patterns across eight different settings on your chart. For lower time frames, consider larger lengths to reduce chart noise. Alternatively, to maintain clarity on your chart, you can disable multiple patterns with different lengths while ensuring at least one pattern remains enabled.
Note that enabling more patterns doesn't always equate to increased potential profit. Sometimes, fewer patterns result in greater profit potential, and vice versa. Experiment with lengths and the number of patterns to determine the most profitable and optimal outcome for your trading symbol and timeframe.
3. Targeting System Selection:
Choose between 'Fixed Targets' or 'Trailing Targets' for your targeting system.
'Fixed Targets' is the default setting, operational when 'Trailing Targets' are turned off.
Set the TP1 Position Size as a percentage, defining the size for TP1, and the rest exits at TP2.
Optionally activate 'Skip Entry if TP1 is Passed' to bypass entering positions if the price has exceeded TP1.
Alternatively, opt for the 'Trailing Target' for dynamic exits based on trigger points and offsets. Note that this option disables fixed targets.
4. Stop Loss Configuration:
Determine the number of candles to consider for stop loss placement based on the last pivot.
Optionally add a percentage to the stop loss to create a buffer against market fluctuations, guarding your positions from sudden price swings.
5. Risk Management Configuration:
You can activate the 'Risk-Free' feature, making your trades risk-free by moving the stop loss to the entry price upon reaching a specified trigger point.
You have the possibility to enable 'Fixed Loss Position Sizing' to limit risk to a percentage of total capital per trade, ensuring prudent risk management.
You can employ 'Use Real-Time Balance for Each Entry' to precisely calculate fixed loss position sizing according to the real-time balance for every entry.
The 'Loss Compensation' feature can be activated to automatically adjust trade sizes during consecutive losses and compensate for prior incurred losses.
Loss compensation continues adjusting trade sizes until it reaches the defined limit of consecutive losses specified in the 'Maximum Consecutive Losses To Compensate' field.
You can factor in commission fees by specifying a percentage in the 'Include Trading Fees in Compensation (%)' field, providing an option for more accurate loss compensation calculations.
You have the option to enable 'Limit Compensation to Real-Time Balance' to prevent consecutive loss compensation from exceeding your current real-time account balance.
It's important to note that for the 'Loss Compensation' feature to operate, the 'Fixed Loss Position Sizing' must be enabled.
6. Counter-Pattern Breakout Configuration:
In this section you have the option to enable the "Counter-Pattern Breakout" feature to adjust the strategy's approach to wedge, triangle, and channel pattern breakouts. Once enabled, the strategy disregards traditional pattern signals and capitalizes on breakouts from either the upper or lower lines, initiating corresponding positions accordingly.
Choose between 'Fixed Target' or 'Trailing Target' for your targeting system. If you opt for the 'Fixed Target', set a specific target point as a percentage, serving as the default target for counter-pattern breakouts. Alternatively, choose the 'Trailing Target' for dynamic exits based on trigger points and offsets. Do keep in mind that selecting the 'Trailing Target' option disables the fixed target setting.
Keep in mind that for standard, non-counter-pattern breakouts, the target point settings in their respective sections remain applicable, distinct from the settings configured for targeting within this section.
Note that the stop loss configurations are shared across standard pattern and counter-pattern breakouts and can be adjusted within the stop loss section.
7. Info Tables:
In the info tables section, you can show or hide different tables on the charts. This includes the backtest table, the current balance table displaying available funds, and a table showcasing Maximum Consecutive Wins or Losses. Choose which to display according to your preferences and specific needs.
8.Date & Time Range Filter:
Utilize the Date & Time Range filter feature to precisely select a start and end date, including time, to filter data within the chosen range.
When connecting this strategy to a trading bot for automated trades, ensure to set the start date and time to the intended initiation moment to avoid undesired outcomes as this directly affects the real-time balance calculations of the strategy.
8. Integration with Third-Party Bots:
To automate trading, leverage the strategy's compatibility with third-party trading bots. Seamlessly integrate the strategy into well-known trading platforms by using alert message fields to input commands from third-party trading bots, enabling automated trade execution for both long and short positions.
By furnishing these adjustable settings, the strategy empowers you to personalize it according to your unique requirements, thereby bolstering the adaptability and efficacy of your trading approach.
🔐 Source Code Protection:
The 'Price Action Pattern Breakout Strategy: Wedge, Triangle, Channel' source code is engineered for precision, reliability, and effectiveness. Its original and innovative design warrants protection and restricted access, preserving the strategy's exclusivity. Safeguarding the code maintains the strategy's integrity and distinctiveness, providing users with a competitive advantage in their trading endeavors.

Strategy Developer ToolSolar Strategies: Strategy Developer Tool Complete Guide
This guide provides full explanation of the intended purpose of our script along with individual explanation of each input and the logic behind them coupled with general knowledge which we find useful in using our tool regarding elements of risk and strategy. Use this information wisely and understand we are not providing financial advise, this is a learning tool meant to help advance traders knowledge of the markets and their strategies which are formed as such.
Basics
Before getting into the specifics of how to use our strategy developer tool, it's important to understand a few basic fundamental things about it. The purpose of the tool is to allow the user to optimize a strategy through back testing with our strategy tracker and 50+ user inputs. The way you optimize your strategy depends on a couple things:
The state of the current and recent previous market.
The timeframe you trade on.
The types of trades you prefer. (swings, scalps, etc.)
How much risk you are willing to take on.
Risk Basics:
Going off the last bullet point on the list above, risk plays a huge part in how you optimize your strategy, with that being said here are a few general rules of risk as they relate to trades:
The more trades you take on, the more risk you are opening your strategy up to.
If done correctly, more trades will often result in more profit with slightly lower accuracy, and more risk.
The less trades you take on, the easier it is to have higher accuracy because ideally by rooting out the losing trades, you are left with fewer overall trades but mostly winning trades.
Less trades with higher accuracy often result in less profit but will 100% be less risky than the opposite. (More trades, less accurate, more profit, MORE RISK)
Input Basics:
More trades, less trades, more risk, less risk, what does this all mean as it relates to our tool?
The 50+ user inputs that allow you to optimize and create your strategy all effect when the script takes a trade.
Many of the inputs are essentially conditions. By changing these inputs, what you are doing is changing how specific the conditions need to be in order to take a trade.
This is how the inputs tie into the bullet point list above regarding risk and the number of trades you take on. By raising or lowering certain inputs, you are making the conditions more or less specific on when to trade.
Making conditions more specific will allow for less trades to be taken and will often result in a higher win rate, and less associated risk.
Making conditions less specific will allow for more trades to be taken and depending on the state of the market, could result in more profit being realized, but at the same time opens you up to more risk because you are stating a more general set of conditions in order to take a trade.
How does it work?
Our strategy developer tool is based on two simple factors in order to identify specific areas in the market deemed good for trade. They are as follows:
Directional momentum to identify when a move might happen.
A confirmation of the desired move.
Indicators:
The tool gets its information on these two factors from two custom built indicators which are hard coded into the script. These two indicators and the inputs which affect them can be found labeled with Indicator 1 or Indicator 2 in the tool's settings.
When the conditions are met based on the factors of both indicators, it then decides your stop losses and take profits using pivot points.
Indicator 1 is the momentum indicator.
Indicator 2 looks for confirmation of the move.
Hedges:
Since nothing is ever certain when trading, our tool also aims to minimize potential loss before it can happen by incorporating hedges when a signal prints in the opposite direction of the trade you are currently in.
To identify when to hedge, the candles will appear with the opposite color of your original trade. Candles, while in a long trade, appear as green and candles while in a short trade appear as red. While in a long trade the only time red candles will appear is when a hedge occurs and vice versa for shorts.
Example: If you just took a long trade based on a long signal that the script gave off, but a short signal prints off while you are in the long, you are directed to sell half your long position and enter that half into a short position. Since there is now more uncertainty in the long because of the short signal, minimizing your position size and having a smaller position in the opposite direction allows you to cover your bases if the trade moves against you. If it doesn’t move against you and ends up going long as originally intended, you are not to lose any money, likely a small profit or break even when all is said and done.
In order to give the hedges a greater change of hitting, the take profits are smaller than a normal trade, this way even if your hedge wasn’t necessary and the original trade does not move against you, it's likely that your hedge will still win, and you can just consider it a small scalp to further your profits on the original trade.
Doubles:
Besides minimizing loss, we also aim to maximize the potential gain. When a second signal prints off in the direction of the trade you are currently already in, the tool directs you to double your position size.
The signal for doubling is a label with “2x” written inside.
The logic here is similar to hedging but in the opposite way. Just as a signal in the opposite direction creates uncertainty, a signal in the same direction indicates more certainty hence doubling your position size.
Example: If you are currently in a long position and you get a second long signal, you would then double your existing position since two long signals printing off before the first one has a chance to play out indicates a stronger chance of movement in the intended direction of your trade.
User Inputs
Upon opening the tools settings tab, you will find all the user inputs which can then be modified to fit your desired strategy. In this section of our guides, you will find individual explanations and use cases for each input so you can correctly use them to your best advantage.
Strategy Tracker Table:
By ticking this input on, the strategy tracker table will be visible to the user. (Default is on)
Indicator 1 Greater Than: Long:
By ticking this input on, you are adding a condition the script will then look for in order to take a long. (Default is on)
This condition is that an average of indicator 1, which searches for momentum, must fall above a certain level, which is determined in the next input.
The purpose of this is to ensure that the average momentum is not too low because this would indicate prolonged downwards movement on the timeframe of the market being observed, making a long position riskier.
Indicator 1 Greater Than Input: Long:
This input correlates to the previous input directly above.
If Indicator 1 Greater Than: Long is ticked on, then one of the conditions in order to take a long position will be that the average of indicator 1 must fall above the level which you set in this input.
max level 100, min level 0
Indicator 1 Less Than: Long
By ticking this input on, you are adding a condition the script will then look for in order to take a long position. (Default is on)
This condition is that an average of indicator 1, which searches for momentum, must fall below a certain level, which is determined in the next input.
The purpose of this is to ensure that the average momentum is not too high, because this would indicate a prior significant upwards movement or trend on the timeframe of the market being observed.
Taking a long position while the average momentum is at higher levels exposes the risk of longing as the market has started to pull back from a peak or when the market has just reached a peak.
Indicator 1 Less Than Input: Long
This input correlates to the previous input directly above.
If Indicator 1 Less Than: Long is ticked on, then one of the conditions in order to take a long position will be that the average of indicator 1 must fall below the level which you set in this input.
max level 100, min level 0
Indicator 1 Greater Than: Short
By ticking this input on, you are adding a condition the script will then look for in order to take a short. (Default is on)
This condition is that an average of indicator 1, which searches for momentum, must fall above a certain level, which is determined in the next input.
The purpose of this is to ensure that the average momentum is not too low because this would indicate prolonged downwards movement or trend on the timeframe of the market being observed.
Taking a short position while the average momentum is at lower levels exposes the risk of shorting as the market has started to recover from a bottom or when the market has just reached a bottom.
Indicator 1 Greater Than Input: Short
This input correlates to the previous input directly above.
If Indicator 1 Greater Than: Short is ticked on, then one of the conditions in order to take a short position will be that the average of indicator 1 must fall above the level which you set in this input.
max level 100, min level 0
Indicator 1 Less Than: Short
By ticking this input on, you are adding a condition the script will then look for in order to take a short position. (Default is on)
This condition is that an average of indicator 1, which searches for momentum, must fall below a certain level, which is determined in the next input.
The purpose of this is to ensure that the average momentum is not too high, because this would indicate a prior significant upwards movement or trend on the timeframe of the market being observed.
Taking a short position while the average momentum is at higher levels exposes the risk of shorting as the market is currently in a strong uptrend.
Indicator 1 Less Than: Short
This input correlates to the previous input directly above.
If Indicator 1 Less Than: Short is ticked on, then one of the conditions in order to take a short position will be that the average of indicator 1 must fall below the level which you set in this input.
max level 100, min level 0
Summary of Input Group: Indicator 1 Greater/Less Than Long/Short
This grouping of inputs is best used as a filter of sorts, much like many of the other inputs which are also essentially filters of the market to find areas ripe for trade. Specifically, however, this group of inputs is especially powerful because if used correctly, it can specify a range for the average momentum to fall in when looking for either long or short trades. Think of it like a sweet spot where the average is not too high nor too low. In combination with the numerous other inputs which will shortly be explained, this sweet spot can be a great indication. Keep in mind that once you find a working range, this will not last forever. Conditions in the market are ever changing and as such your inputs, in this case the range the average momentum must fall in, will also need to change with the market conditions.
Bars Since Crossover:
This input simply describes a crossover of the momentum indicator (indicator 1) and its average.
In the category How does it work? Two main factors are discussed, the first being directional momentum to determine when an upwards move might happen. The crossover correlated to this input is the directional momentum as mentioned earlier.
As also mentioned in How does it work? The second factor is a confirmation of the desired upwards move. This confirmation is a crossover of the current price and indicator 2 which will be further addressed later on.
What's important to understand about the two key factors at play in regard to Bars Since Crossover is that this input is determining a condition which looks for a certain number of bars prior to the confirmation of indicator 2 which the crossover of momentum and its average has happened on indicator 1.
Example: Bars Since Crossover input is set to 10. This means that the crossover of momentum and its average from indicator 1 must be within 10 bars prior to the confirmation from indicator 2. If this happens then this condition is met for a long position.
Bars Since Crossunder:
This input simply describes a crossunder of the momentum indicator (indicator 1) and its average.
In the category How does it work? Two main factors are discussed, the first being directional momentum to determine when a downwards move might happen. The crossunder correlated to this input is the directional momentum as mentioned earlier.
As also mentioned in How does it work? The second factor is a confirmation of the desired downwards move. This confirmation is a crossunder of the current price and indicator 2 which will be further addressed later on.
What's important to understand about the two key factors at play in regard to Bars Since Crossunder is that this input is determining a condition which looks for a certain number of bars prior to the confirmation of indicator 2 which the crossunder of momentum and its average has happened on indicator 1.
Example: Bars Since Crossunder input is set to 10. This means that the crossunder of momentum and its average from indicator 1 must be within 10 bars prior to the confirmation from indicator 2. If this happens then this condition is met for a short position.
Summary of Input Group: Bars Since Crossover/Crossunder
These two inputs can have a large effect on the types of trades being taken and the risk which your strategy opens up to. The idea is that in order for the two key factors described in How does it work? to be correlated and therefore indicate a strong directional move, the two events must happen within a somewhat small period of time. If the period of time between the two events taking place is too large, then it's riskier for your strategy due to a delay in directional momentum and the necessary confirmation. It's important to note that this “small period of time” is relative to the security you're trading and the timeframe its being trades on. Small could mean 5 bars in some cases or 20 bars in others, this is why our custom back tester exists. So that the process of optimization on different securities and different timeframes is smooth and only requires adjustments to inputs then your own analysis of the back test results.
Indicator 1 Input Long
Defines how strong the upwards momentum needs to be in order to take a long position.
When optimizing your strategy, this input is likely to have some of the most effect on when the script takes a long position.
The reasoning for this is because the level you set for this input is the level which indicator 1 must close above following the crossover of its average.
Example: Indicator 1 Input Long set to 50, this means that when the momentum crosses over its average from indicator 1, upon the close of this crossover the momentum must be above the level 50 in order for this condition to be met to take a long position.
The higher the level, the stronger the upwards momentum must be, and therefore by using higher levels for this input, the script will search for stronger directional moves leaving less chance for the trade to move against you.
Indicator 1 Input Short
Defines how strong the downwards momentum needs to be in order to take a short position.
When optimizing your strategy, this input is likely to have some of the most effect on when the script takes a short position.
The reasoning for this is because the level you set for this input is the level which indicator 1 must close below following the crossunder of its average.
Example: Indicator 1 Input Short set to 40, this means that when the momentum crosses under its average from indicator 1, upon the close of this crossunder the momentum must be below the level 40 in order for this condition to be met to take a short position.
The lower the level, the stronger the downwards momentum must be, and therefore by using lower levels for this input, the script will search for stronger directional moves leaving less chance for the trade to move against you.
Summary of Input Group: Indicator 1 Input Long/Short
These two inputs are so important to your strategy because at the end of the day no matter how you set it up, it's still a momentum-based strategy. With that being said the level of momentum or the strength needed in order to take trades is of course going to be a key decider in the successfulness of the strategy. When optimizing these two inputs make sure to take into account what the overall market conditions are, meaning if it’s a bull market maybe make the momentum needed to take a long slightly less comparatively to the amount needed to take a short, in other words make long conditions less specific and short conditions more specific. Slight variations of this input can have very big effects, even changing it by 1 or 2 can make a major difference. In might even be good to consider starting optimization with these inputs and then work the rest of the strategy out from there. A lot could be said about these inputs and more docs will be added in order to further explain more strategy approaches revolving around them, for now don’t hesitate to ask any questions.
Indicator 2 Red
This input is used as a sort of chop filter at its base level, however if used correctly it can be a much broader filter for what areas of the market you want to trade in.
Indicator 2 shows as either red or green and is used as a confirmation when price crosses over it following the crossover of momentum and its average from indicator 1 to take a long position.
If ticked on, Indicator 2 Red states a condition in order for the script to take a long position. (Default is on)
The condition is that upon the crossover of the current price and Indicator 2, 10 bars ago indicator 2 must have been red.
The reason for this input is because the current color of indicator 2 upon the crossover must also be red. However, this condition is hard coded in and cannot be changed by any input.
This is because the type of trade being targeted is that of a type of reversal or continuation.
If indicator 2 showed green 10 bars ago and is currently red this would indicate that a top was just reached, and price is reversing downwards making this not a good area to take a long.
Another scenario if indicator 2 showed green 10 bars ago and is currently red is that there is currently a sideways trend going on or otherwise known as chop, also not an ideal area to take a long
However, if 10 bars ago indicator 2 was red and it's currently red this would indicate a more prolonged pullback.
If all conditions are met and we know that price has been pulling back, now we can enter a long with more knowledge pointing to price reversing upwards from a downwards trend, or continuing its upwards trend after a pullback.
Indicator 2 Green
This input is used as a sort of chop filter at its base level, however if used correctly it can be a much broader filter for what areas of the market you want to trade in.
Indicator 2 shows as either red or green and is used as a confirmation when price crosses under it following the crossunder of momentum and its average from indicator 1 to take a short position.
If ticked on, Indicator 2 Green states a condition in order for the script to take a short position. (Default is on)
The condition is that upon the crossunder of the current price and Indicator 2, 10 bars ago indicator 2 must have been green.
The reason for this input is because the current color of indicator 2 upon the crossunder must also be green. However, this condition is hard coded in and cannot be changed by any input.
This is because the type of trade being targeted is that of a type of reversal or continuation.
If indicator 2 showed red 10 bars ago and is currently green this would indicate that a bottom was just reached, and price is reversing upwards making this not a good area to take a short.
Another scenario if indicator 2 showed red 10 bars ago and is currently green is that there is currently a sideways trend going on or otherwise known as chop, also not an ideal area to take a short.
However, if 10 bars ago indicator 2 was green and it's currently green this would indicate a more prolonged upwards movement.
If all conditions are met and we know that price has been moving up, now we can enter a short with more knowledge pointing to price reversing downwards from an upwards trend, or continuing its downwards trend after a bounce up.
Summary of Input Group: Indicator 2 Red/Green
Similar to Indicator 1 Greater/Less Than Long/Short, the goal of these inputs is to try to get a picture of what the previous recent market has been doing. By getting this picture it's easier to find different areas of the market more ideal for trades. Different from Indicator 1 Greater/Less Than Long/Short though, Indicator 2 Red/Green is directly correlated to the price action in the market rather than the momentum. By switching these on or off you are setting more or less specific conditions for taking trades. Some markets require this extra condition to lower your risk in your strategy, however others may not.
Pivot Low
This input is used to define the number of bars the script will look back to grab a pivot low when taking a long position.
This pivot low is then used to set the stop loss when entering a long position.
This input is very important and optimizing it correctly can be extremely crucial to your strategies success.
The Strategy Developer tool uses a 1:1 risk to reward ratio when setting your first take profit point, so when the script looks back to get a pivot low based on the input you set, it will then set your first take profit at an equal ratio to the stop loss found from the pivot low.
The goal in optimizing this input is to give enough lookback to find real pivot points where price has reversed off of, but not to give too much lookback where its grabbing previous pivot points unrelated to the current move of momentum the script is giving a long signal from.
Consider the type of trades you're looking for in your strategy and what timeframe you are trying to trade on.
Longer swing trades which aim to catch bigger moves in the market, possibly on higher time frames, may require a further lookback in order to get your take profits in the correct positioning to catch the desired move, and not exit early before the trade has fully played out.
Shorter scalp trades may aim to catch smaller moves and therefore you don’t want to allow for too much risk by having a large stop loss and large take profits as a result.
Pivot Low 2
Pivot low 2 can be thought of as a backup lookback in order to get the correct pivot low.
In an input which will be discussed shortly called Pivot Low Minimum, you can set a minimum percentage for your pivot low to be, if the pivot low does not meet the minimum then the script will look to Pivot Low 2’s input to use as a bar lookback in order to get the correct pivot low.
This input is used because you might find a Pivot Low input that works well for the majority of the trades in your back tested strategy, however, there will always be outliers and when this Pivot Low input falls short of getting the correct level to put your stop losses at, Pivot Low 2 is used.
Pivot Low 2’s input should always be higher than Pivot Low’s input, that way you can allow the script to look back further in time to find the correct level when the minimum is not met.
Pivot High
This input is used to define the number of bars the script will look back to grab a pivot high when taking a short position.
This pivot high is then used to set the stop loss when entering a short position.
This input is very important and optimizing it correctly can be extremely crucial to your strategies success.
The Strategy Developer tool uses a 1:1 risk to reward ratio when setting your first take profit point, so when the script looks back to get a pivot high based on the input you set, it will then set your first take profit at an equal ratio to the stop loss found from the pivot high.
The goal in optimizing this input is to give enough lookback to find real pivot points where price has reversed off of, but not to give too much lookback where its grabbing previous pivot points unrelated to the current move of momentum the script is giving a short signal from.
Consider the type of trades you're looking for in your strategy and what timeframe you are trying to trade on.
Longer swing trades which aim to catch bigger moves in the market, possibly on higher time frames, may require a further lookback in order to get your take profits in the correct positioning to catch the desired move, and not exit early before the trade has fully played out.
Shorter scalp trades may aim to catch smaller moves and therefore you don’t want to allow for too much risk by having a large stop loss and large take profits as a result.
Pivot High 2
Pivot high 2 can be thought of as a backup lookback in order to get the correct pivot high.
In an input which will be discussed shortly called Pivot High Minimum, you can set a minimum percentage for your pivot high to be, if the pivot high does not meet the minimum then the script will look to Pivot High 2’s input to use as a bar lookback in order to get the correct pivot high.
This input is used because you might find a Pivot High input that works well for the majority of the trades in your back tested strategy, however, there will always be outliers and when this Pivot High input falls short of getting the correct level to put your stop losses at, Pivot High 2 is used.
Pivot High 2’s input should always be higher than Pivot High’s input, that way you can allow the script to look back further in time to find the correct level when the minimum is not met.
Pivot Low Risk Tolerance
This input is very important in managing the risk associated with your strategy.
Pivot Low Risk Tolerance is defining a maximum percentage the pivot low can be away from your entry.
Since the pivot low that’s found is assigned to your stop loss and directly affects the placement of your take profits when taking a long position, making sure the pivot low isn’t too far down is crucial.
Depending on the types of trades you're aiming to take, the timeframe you choose to trade on, and the leverage you use in your strategy, you may want to assign a higher risk tolerance or a lower one.
Example: Pivot Low Risk Tolerance input set to 3, this means that when all other conditions are met in order to take a long position, when searching for the pivot low in order to set a stop loss, if the script finds the pivot low is greater than 3% away from the entry point, it will not take the trade.
Pivot High Risk Tolerance
This input is very important in managing the risk associated with your strategy.
Pivot High Risk Tolerance is defining a maximum percentage the pivot high can be away from your entry.
Since the pivot high that’s found is assigned to your stop loss and directly affects the placement of your take profits when taking a short position, making sure the pivot high isn’t too far up is crucial.
Depending on the types of trades you're aiming to take, the timeframe you choose to trade on, and the leverage you use in your strategy, you may want to assign a higher risk tolerance or a lower one.
Example: Pivot High Risk Tolerance input set to 3, this means that when all other conditions are met in order to take a short position, when searching for the pivot high in order to set a stop loss, if the script finds the pivot high is greater than 3% away from the entry point, it will not take the trade.
Pivot Low Minimum
Sometimes when searching for the pivot low, the script's defined lookback may not be enough to find the proper pivot point.
This can cause improper placement of stop losses and take profits and may cause trades to be exited early before they can fully play out in your favor.
Pivot Low Minimum is an input used to combat this problem, when the script finds a pivot low that does not meet the minimum percentage away from the entry point, it will then turn to Pivot Low 2 input in order to gain a further lookback and grab the correct pivot point to set your stop loss and take profits with.
When reading and setting this input, understand that setting it to 1 means there is no minimum, setting it to 0.9 would mean the minimum is a 10% difference between the pivot low and your entry point.
Think of it in terms of decimals and their equivalent percentage, 0.1 is equal to 10%, 0.01 is equal to 1%.
Whatever percentage you want to set for a minimum, convert it to a decimal, then simply subtract it from 1.
Example: Say you desire a 1.5% minimum pivot low and as a result an equivalent stop loss of 1.5% below your long entry and furthermore a take profit 1.5% above your long entry since the script uses a 1:1 ratio. Converting 1.5% to a decimal would give you 0.015, then subtracting it from 1 would give you 0.985, this would be the input assigned to Pivot Low Minimum.
Pivot High Minimum
Sometimes when searching for the pivot high, the script's defined lookback may not be enough to find the proper pivot point.
This can cause improper placement of stop losses and take profits and may cause trades to be exited early before they can fully play out in your favor.
Pivot High Minimum is an input used to combat this problem, when the script finds a pivot high that does not meet the minimum percentage away from the entry point, it will then turn to Pivot High 2 input in order to gain a further lookback and grab the correct pivot point to set your stop loss and take profits with.
When reading and setting this input, understand that setting it to 1 means there is no minimum, setting it to 0.9 would mean the minimum is a 10% difference between the pivot high and your entry point.
Think of it in terms of decimals and their equivalent percentage, 0.1 is equal to 10%, 0.01 is equal to 1%.
Whatever percentage you want to set for a minimum, convert it to a decimal, then simply subtract it from 1.
Example: Say you desire a 1.5% minimum pivot high and as a result an equivalent stop loss of 1.5% above your short entry and furthermore a take profit 1.5% below your short entry since the script uses a 1:1 ratio. Converting 1.5% to a decimal would give you 0.015, then subtracting it from 1 would give you 0.985, this would be the input assigned to Pivot High Minimum.
Summary of Input Group: Pivot Low/High - Pivot Low/High 2 – Pivot Low/High Risk Tolerance – Pivot Low/High Minimum
The first key takeaway from all these inputs is that your stop losses and take profits will be directly affected through optimizing any of them. The second key takeaway is that these inputs are crucial in managing the risk in your strategy, and while this has been said many times throughout the guide for various inputs, when it comes to stop losses and take profits it is especially true. Having a stop loss which is too high opens up the possibility for much bigger losses, and as a result your take profits will also be too high, minimizing the chance of any of them being hit. Having a stop loss which is too low increases the chance that your trade will get stopped out preemptively, before the trade can mature and move in your favor because remember that trades will not always move immediately in the intended direction, a good amount of patience is often involved in creating consistent successful trades and a successful strategy as such. On the same note, too low of a stop loss could also mean you are missing out on unrealized profit since your take profits are a direct result of the stop loss which is found. When optimizing your pivot low/high risk tolerance, think not about how much you are willing to lose on a single trade, but how much your portfolio can actually afford to lose not just on a single trade but multiple trades, sometimes even in a row. Obviously, the goal in creating a strategy is that you avoid losing trades and especially multiple in a row, however, there are many things that can’t be accounted for. The only way to manage this unaccounted risk is to use proper risk management and not open yourself up to big losses even in the worst most unlikely scenarios. Even if you don’t lose multiple trades in a row, ask yourself, could I afford to lose multiple trades with the risk tolerance I have set if everything were to go to $hit, (hopefully it would not), but in the off chance it did, instead of beating yourself up over what you did wrong, you’ll be patting yourself on the back for what you did right.
TP2-4 Long Placement
The first thing to understand about the take profit placement is that our system of stop losses and take profits uses a 1:1 risk to reward ratio for the first stop loss and first take profit.
This means that if your stop loss falls 2% below your long entry, your first take profit will be 2% above your long entry, hence 1:1.
As for take profits 2-4, they are just extensions of that ratio. This means that if TP2 Long Placement is set to 1.5, the ratio for your second take profit is 1:1.5.
Using the same percentage from the second bullet point being 2%, we can now gather that with a 1:1.5 ratio our second take profit would be at 3% above our long entry.
The same applies for the rest of the take profits, meaning whatever the take profit is set at regardless of which one, apply that number to the second placeholder of the ratio.
Example: First stop loss falls 2% below long entry. TP2 Long Placement input set to 1.5; risk to reward ratio is 1:1.5; corresponding percentage would be a 3% gain. TP3 Long Placement input set to 2; risk to reward ratio is 1:2; corresponding percentage would be a 4% gain. TP4 Long Placement input set to 2.5; risk to reward ratio is 1:2.5; corresponding percentage would be a 5% gain.
The next key thing to understand about the trailing take profits system is the position size being sold at each take profit and therefore how the strategy tracker calculates your strategy's profit.
At the first take profit, 50% of your position is being calculated as sold, locking in good profits off the bat.
At TP2, 20% of your position is being calculated as sold, leaving a remaining 30% open to gain more profit.
At TP3, another 20% of your position is being calculated as sold, leaving 10% to collect any additional possible gains.
At TP4 the remaining 10% of your position is sold and the trade will be fully closed out.
SL2-4 Long Placement
Our system of trailing stop losses is completely similar to that of our trailing take profits.
Just like the trailing take profits, the inputs for stop losses 2-4 are also used as the second placeholders in the risk to reward ratio.
This may be confusing since generally stop losses are associated with a loss on your position, however, the only stop loss which results in a loss on your position is the first one, not stop losses 2-4.
This is because once your first take profit is hit on your long, your stop loss will automatically move up to the price equivalent to the ratio which you set using these inputs that lies in profit.
Example: Since your first take profit will always be at a 1:1 risk to reward ratio with your stop loss, your second take profit could be at a 1:0.8 ratio. So, to clarify, once your first take profit is hit at a 1:1, your original first stop loss will now be moved up in profits to just below your first take profit at a 1:0.8 risk to reward ratio. This only happens AFTER the first take profit is hit.
For stop losses 3 and 4, the same logic is true, once TP2 is hit, your second stop loss will now be moved up to the placement of SL3 which will fall somewhere below TP2. Once TP3 is hit, your third stop loss will now be moved up to the placement of SL4 which will fall somewhere below TP3. If stop loss 4 does not get hit, then the only thing left to happen is for TP4 to hit and the trade will fully close out.
The one major difference between our system of trailing stop losses and take profits is that no matter what stop loss is hit, the entire remainder of your position will be calculated as sold.
So, if your first take profit hits and sells 50% of your long position, but the trade does not continue upwards and moves down to your second stop loss, the remaining 50% of your position will be calculated as sold.
The same applies to SL3 and SL4, so at SL3 the remaining 30% of your position will be calculated as sold, and at SL4 the remaining 10% will be calculated as sold.
Your trailing stop loss placement is dependent on what types of trades you desire. For shorter scalps on smaller timeframes, it's recommended to place each stop loss just below each corresponding take profit for long trades.
This way you leave just enough room for the trade to continue upwards if there is enough momentum, but you don’t open yourself up to losing your unrealized profit if it does not make this continuation.
If you desire longer swing trades on higher timeframes, it might be a good idea to leave more room in between the take profit and corresponding stop loss.
This way you leave more room for the trade to mature and move in your favor since when trading longer moves, often they will not shoot straight up but rather have a series of small pullbacks throughout the more general upwards trend.
Note that when a long trade is first entered the only stop loss and take profit in play are your original stop loss found by the pivot low which would result in a loss, and the first take profit at a 1:1 risk to reward ratio from that pivot low.
TP2-4 Short Placement
The first thing to understand about the take profit placement is that our system of stop losses and take profits uses a 1:1 risk to reward ratio for the first stop loss and first take profit.
This means that if your stop loss falls 2% above your short entry, your first take profit will be 2% below your short entry, hence, 1:1.
As for take profits 2-4, they are just extensions of that ratio. This means that if TP2 Short Placement is set to 1.5, the ratio for your second take profit is 1:1.5.
Using the same percentage from the second bullet point being 2%, we can now gather that with a 1:1.5 ratio our second take profit would be at 3% below our short entry.
The same applies for the rest of the take profits, meaning whatever the take profit is set at regardless of which one, apply that number to the second placeholder of the ratio.
Example: First stop loss falls 2% above short entry. TP2 Short Placement input set to 1.5; risk to reward ratio is 1:1.5; corresponding percentage would be a 3% gain. TP3 Short Placement input set to 2; risk to reward ratio is 1:2; corresponding percentage would be a 4% gain. TP4 Short Placement input set to 2.5; risk to reward ratio is 1:2.5; corresponding percentage would be a 5% gain.
The next key thing to understand about the trailing take profits system is the position size being sold at each take profit and therefore how the strategy tracker calculates your strategy's profit.
At the first take profit, 50% of your position is being calculated as sold, locking in good profits off the bat.
At TP2, 20% of your position is being calculated as sold, leaving a remaining 30% open to gain more profit.
At TP3, another 20% of your position is being calculated as sold, leaving 10% to collect any additional possible gains.
At TP4 the remaining 10% of your position is sold and the trade will be fully closed out.
SL2-4 Short Placement
Our system of trailing stop losses is completely similar to that of our trailing take profits.
Just like the trailing take profits, the inputs for stop losses 2-4 are also used as the second placeholders in the risk to reward ratio.
This may be confusing since generally stop losses are associated with a loss on your position, however, the only stop loss which results in a loss on your position is the first one, not stop losses 2-4.
This is because once your first take profit is hit on your short, your stop loss will automatically move down to the price equivalent to the ratio which you set using these inputs that lies in profit.
Example: Since your first take profit will always be at a 1:1 risk to reward ratio with your stop loss, your second take profit could be at a 1:0.8 ratio. So, to clarify, once your first take profit is hit at a 1:1, your original first stop loss will now be moved down in profits to just below your first take profit at a 1:0.8 risk to reward ratio. This only happens AFTER the first take profit is hit.
For stop losses 3 and 4, the same logic is true, once TP2 is hit, your second stop loss will now be moved down to the placement of SL3 which will fall somewhere above TP2. Once TP3 is hit, your third stop loss will now be moved down to the placement of SL4 which will fall somewhere above TP3. If stop loss 4 does not get hit, then the only thing left to happen is for TP4 to hit and the trade will fully close out.
The one major difference between our system of trailing stop losses and take profits is that no matter what stop loss is hit, the entire remainder of your position will be calculated as sold.
So, if your first take profit hits and sells 50% of your short position, but the trade does not continue downwards and moves up to your second stop loss, the remaining 50% of your position will be calculated as sold.
The same applies to SL3 and SL4, so at SL3 the remaining 30% of your position will be calculated as sold, and at SL4 the remaining 10% will be calculated as sold.
Your trailing stop loss placement is dependent on what types of trades you desire. For shorter scalps on smaller timeframes, it's recommended to place each stop loss just above each corresponding take profit for short trades.
This way you leave just enough room for the trade to continue downwards if there is enough momentum, but you don’t open yourself up to losing your unrealized profit if it does not make this continuation.
If you desire longer swing trades on higher timeframes, it might be a good idea to leave more room in between the take profit and corresponding stop loss.
This way you leave more room for the trade to mature and move in your favor since when trading longer moves, often they will not shoot straight down but rather have a series of small bounces throughout the more general downwards trend.
Note that when a short trade is first entered the only stop loss and take profit in play are your original stop loss found by the pivot high which would result in a loss, and the first take profit at a 1:1 risk to reward ratio from that pivot high.
Summary of Take Profit/Stop Loss Placement:
Correctly placed take profits and stop losses are essential in having a successful strategy and proper risk management. With that being said there are also many ways in which to use this system. Deciding how to set them up is really just a matter of determining the trading style you aim to succeed with. Once this has been determined, the placement of take profits and stop losses should be easier to configure. However, if there is any confusion on either of these topics as the ratios and corresponding TP/SL can get confusing, please do not hesitate to ask further questions in our discord!
Leverage Long
Leverage Long input simply defines the leverage used in your long positions, and is used in calculating the profit in Strategy Tracker
A rundown of risk associated with using leverage will not be given here since it should assume that if you're using leverage, you should already understand the risks.
If you are not using any leverage, then set Leverage Long input to 1.
Long Position Size
This input defines the position size you are using in your long trades.
This input is also used in calculating profit in Strategy Tracker.
Long Hedge Position Size
This input is used to define the position size of long hedge positions.
This input is also used in calculating profit in Strategy Tracker.
Important: Your Long Hedge Position Size should always be half of your Long Position Size for accurate profit calculation.
Double Long Position Size
This input is used to define the position size when in a double long.
This input is also used in calculating profit in Strategy Tracker
Important: Your Double Long Position Size should always be double your Long Position Size for accurate profit calculation.
Short Position Size
This input defines the position size you are using in your short trades.
This input is also used in calculating profit in Strategy Tracker.
Short Hedge Position Size
This input is used to define the position size of short hedge positions.
This input is also used in calculating profit in Strategy Tracker.
Important: Your Short Hedge Position Size should always be half of your Short Position Size for accurate profit calculation.
Double Short Position Size
This input is used to define the position size when in a double short.
This input is also used in calculating profit in Strategy Tracker
Important: Your Double Short Position Size should always be double your Short Position Size for accurate profit calculation.
A Message From the Developer PLEASE READ!!!
If you have made it this far in the guide, I applaud you and thank you for sticking with it as I know there is a lot of information here! This is not an exaggeration when I say there are hundreds of millions of possible variations that could be applied throughout all the inputs which is why I much prefer to call this a tool rather than an algorithm. Algorithm is a loaded word in my opinion as it comes with an implication of guarantee in the trades being made. This is not meant to discourage anybody from taking trades based off the tool which is also why I provided the option for automated alerts which through third party software can turn into automated trades; if you have the confidence in your strategy by all means I encourage you to trade it, automated or not. Just please understand that it's highly recommended to also apply your own knowledge and analysis before taking a trade as historical back testing data has its limitations and cannot always account for current market conditions. The real applicability does not fall in what the back tester window is saying you would have made or how accurate your strategy would have been, it's within the sheer number of markets and scenarios this tool can be used in and the information you can get which a human just can’t comprehend all at once; its literally endless. I urge all of you to be creative and think outside the box about what you can do with such a powerful tool at your fingertips. After all this is the reason why so many inputs were provided. Another main goal of this project was to give users a better understanding of risk management. It can be hard to manage your risk when it’s all kept in your head, but when you can modify your strategy to better manage your risk by simply optimizing a few inputs, it’s a lot easier to comprehend and actually apply when trading. The last thing I want to say is have fun working through the possible learning curve in using this tool, it may be a process but enjoy it because the one thing I can guarantee is that you will come out the other side a better trader than before!

Cracking Cryptocurrency - Bottom Feeder Strategy TesterBottom Feeder - Strategy Tester
The Bottom Feeder is designed to algorithmically detect significantly oversold conditions in price that represent profitable buying opportunities. Combining this with it’s unique Stop and Target System, the Bottom Feeder is designed to return consistent return with minimal draw down. Whether used as a Market Bottom Detector or as a system for executing safe, profitable mean reversion trades, the Bottom Feeder is a powerful tool in any trader’s arsenal.
Bottom Feeder was designed to be used on BTCUSD, however it is also effective on other USD/USDT pairs. One will have to check the individual pair they wish to trade with the Strategy Tester to simulate performance.
Strategy displayed is from 2018-2021 on **Conservative Mode** with Percent of Equity (30%) enabled.
Options
Let’s go through the input options one by one, so that you are able to comfortably navigate all that this indicator has to offer. The link below will display a picture of the layout of the settings for your convenience.
For the sake of simplicity, let’s note now that all settings marked **Conservative Mode** will not work in Aggressive Mode.
Mode : Determines how aggressively Bottom Feeder generates a buy signal. In Conservative Mode, trades can only be opened once per candle and the stop and target will update as new signals appear. In Aggressive Mode, a separate trade is opened each time Bottom Feeder signals, which may be multiple times within one Daily candle.
Position Sizing Strategy : Determines what Risk Management system you will deploy when trading Bottom Feeder. Your options are “Percent of Equity” and “Distance to Stop Loss”. If Percent of Equity is selected, a trade size will be equal to a percentage of your equity, pursuant to the value in the ‘Percent of Equity’ box. If Distance to Stop Loss is selected, then your Position Size will be determined based off the distance to your stop loss and the value in the ‘Risk Percentage’ box.
Percent Of Equity : Determines what percentage of your equity will be allocated to each trade when ‘Position Sizing Strategy’ is enabled.
Risk Percentage : Determines the size of each trade if ‘Distance to Stop Loss’ strategy is enabled. This value reflects what percent of your account you will lose per trade if the trade hits your stop loss.
Plot Target and Stop Loss : Toggles on/off the visualized take profit and stop losses on the chart.
**Conservative Mode** TP Multiplier : This is an input box, it requires a float value. That is, it can accept either a whole number integer or a number with a decimal. This number will determine your Take Profit target. It will take whatever number is entered into this box and multiply the Average True Range against it to determine your Take Profit.
**Conservative Mode** SL Multiplier : See above - this will modify your Stop Loss Value.
**Conservative Mode** Average or Median True Range : This is a drop-down option, the two options are Average True Range or Median True Range. If Average True Range is selected, then this indicator will use the Average True Range calculation, that is, the average of a historical set of True Range values to determine the Average True Range value for Target and Stop Loss calculation. If Median True Range is selected, it will not take an average and will instead take the Median value of your historical look back period.
**Conservative Mode** True Range Length : This is an input that requires an integer. This will represent your historical lookback period for Average/Median True Range calculation.
**Conservative Mode** True Range Smoothing : This is a drop-down with the following options: Exponential Moving Average ( EMA ), Simple Moving Average ( SMA ), Weighted Moving Average ( WMA ), Relative Moving Average (RMA). This will determine the smoothing type for calculating the Average True Range if it is selected. Note: if Median True Range is selected above, this option will not have any effect as there is no smoothing for a Median value.
**Conservative Mode** Custom True Range Value? : This is a true/false option that is false by default. If enabled, it will override the Average/Median True Range calculation in favor of a users custom True Range value to be input below.
**Conservative Mode** Custom True Range Value : This is an input box that requires a float value. If Custom True Range is enabled this is where a user will input their desired custom True Range value for Target and Stop Loss calculation.
From Month/Day/Year to Month/Day/Year : This sets the Time Frame of your backtest for the Bottom Feeder Strategy. It will run FROM the date selected TO the date selected.
Stop and Target Description
Because Bottom Feeder is designed only to scalp the various market bottoms that can appear over time in the market and not to identify trends or to trade ranges, it’s imperative that the indicator notify us not just to when to enter our trades, but when to exit! In the service of that, CC Bottom Feeder has a built in Stop and Target system that tracks and displays the stop loss and take profit levels of each individual open trade, whether in Aggressive or Conservative Mode.
Conservative Mode Targeting: In Conservative Mode, Bottom Feeder signals are aggregated into a compound trade. The signal will appear as a green label pointing up below a candle, and will appear upon a candle close. If Bottom Feeder then generates another signal the stop loss and target price will be updated. The process will continue until the aggregated trade completes in either direction. On a trade with multiple signals, a larger position is slowly entered into upon each buy signal.
Aggressive Mode Targeting: In Aggressive Mode, Bottom Feeder signals are individually displayed as they are generated, regardless of how many signals are generated on any single candle. If Bottom Feeder continues to signal, each individual open trade will have their own stop loss and target that will be displayed on the chart until the individual trade completes in either direction. As opposed to a large compound position, aggressive mode represents a higher number of independent signals with their own stop and target levels.
Stop losses and targets are designed to be hard, not soft. That is, they are intended to be stop market orders, not mental stop losses. If price wicks through the target or stop, it will activate.

Recovery StrategyDescription:
The Recovery Strategy is a long-only trading system designed to capitalize on significant price drops from recent highs. It enters a position when the price falls 10% or more from the highest high over a 6-month lookback period and adds positions on further 2% drops, up to a maximum of 5 positions. Each trade is held for 6 months before exiting, regardless of profit or loss. The strategy uses margin to amplify position sizes, with a default leverage of 5:1 (20% margin requirement). All key parameters are customizable via inputs, allowing flexibility for different assets and timeframes. Visual markers indicate recent highs for reference.
How It Works:
Entry: Buys when the closing price drops 10% or more from the recent high (highest high in the lookback period, default 126 bars ~6 months). If already in a position, additional buys occur on further 2% drops (e.g., 12%, 14%, 16%, 18%), up to 5 positions (pyramiding).
Exit: Each trade exits after its own holding period (default 126 bars ~6 months), regardless of profit or loss. No stop loss or take-profit is used.
Margin: Uses leverage to control larger positions (default 20% margin, 5:1 leverage). The order size is a percentage of equity (default 100%), adjustable via inputs.
Visualization: Displays blue markers (without text) at new recent highs to highlight reference levels.
Inputs:
Lookback Period for High Peak (bars): Number of bars to look back for the recent high (default: 126, ~6 months on daily charts).
Initial Drop Percentage to Buy (%): Percentage drop from recent high to trigger the first buy (default: 10.0%).
Additional Drop Percentage to Buy (%): Further drop percentage to add positions (default: 2.0%).
Holding Period (bars): Number of bars to hold each position before selling (default: 126, ~6 months).
Order Size (% of Equity): Percentage of equity used per trade (default: 100%).
Margin for Long Positions (%): Percentage of position value covered by equity (default: 20%, equivalent to 5:1 leverage).
Usage:
Timeframe: Designed for daily charts (126 bars ~6 months). Adjust Lookback Period and Holding Period for other timeframes (e.g., 1008 hours for hourly charts, assuming 8 trading hours/day).
Assets: Suitable for stocks, ETFs, or other assets with significant price volatility. Test thoroughly on your chosen asset.
Settings: Customize inputs in the strategy settings to match your risk tolerance and market conditions. For example, lower Margin for Long Positions (e.g., to 10% for 10:1 leverage) to increase position sizes, but beware of higher risk.
Backtesting: Use TradingView’s Strategy Tester to evaluate performance. Check the “List of Trades” for skipped trades due to insufficient equity or margin requirements.
Risks and Considerations:
No Stop Loss: The strategy holds trades for the full 6 months without a stop loss, exposing it to significant drawdowns in prolonged downtrends.
Margin Risk: Leverage (default 5:1) amplifies both profits and losses. Ensure sufficient equity to cover margin requirements to avoid skipped trades or simulated margin calls.
Pyramiding: Up to 5 positions can be open simultaneously, increasing exposure. Adjust pyramiding in the code if fewer positions are desired (e.g., change to pyramiding=3).
Market Conditions: Performance depends on price drops and recoveries. Test on historical data to assess effectiveness in your market.
Broker Emulator: TradingView’s paper trading simulates margin but does not execute real margin trading. Results may differ in live trading due to broker-specific margin rules.
How to Use:
Add the strategy to your chart in TradingView.
Adjust input parameters in the settings panel to suit your asset, timeframe, and risk preferences.
Run a backtest in the Strategy Tester to evaluate performance.
Monitor open positions and margin levels in the Trading Panel to manage risk.
For live trading, consult your broker’s margin requirements and leverage policies, as TradingView’s simulation may not match real-world conditions.
Disclaimer:
This strategy is for educational purposes only and does not constitute financial advice. Trading involves significant risk, especially with leverage and no stop loss. Always backtest thoroughly and consult a financial advisor before using any strategy in live trading.

Game Theory Trading StrategyGame Theory Trading Strategy: Explanation and Working Logic
This Pine Script (version 5) code implements a trading strategy named "Game Theory Trading Strategy" in TradingView. Unlike the previous indicator, this is a full-fledged strategy with automated entry/exit rules, risk management, and backtesting capabilities. It uses Game Theory principles to analyze market behavior, focusing on herd behavior, institutional flows, liquidity traps, and Nash equilibrium to generate buy (long) and sell (short) signals. Below, I'll explain the strategy's purpose, working logic, key components, and usage tips in detail.
1. General Description
Purpose: The strategy identifies high-probability trading opportunities by combining Game Theory concepts (herd behavior, contrarian signals, Nash equilibrium) with technical analysis (RSI, volume, momentum). It aims to exploit market inefficiencies caused by retail herd behavior, institutional flows, and liquidity traps. The strategy is designed for automated trading with defined risk management (stop-loss/take-profit) and position sizing based on market conditions.
Key Features:
Herd Behavior Detection: Identifies retail panic buying/selling using RSI and volume spikes.
Liquidity Traps: Detects stop-loss hunting zones where price breaks recent highs/lows but reverses.
Institutional Flow Analysis: Tracks high-volume institutional activity via Accumulation/Distribution and volume spikes.
Nash Equilibrium: Uses statistical price bands to assess whether the market is in equilibrium or deviated (overbought/oversold).
Risk Management: Configurable stop-loss (SL) and take-profit (TP) percentages, dynamic position sizing based on Game Theory (minimax principle).
Visualization: Displays Nash bands, signals, background colors, and two tables (Game Theory status and backtest results).
Backtesting: Tracks performance metrics like win rate, profit factor, max drawdown, and Sharpe ratio.
Strategy Settings:
Initial capital: $10,000.
Pyramiding: Up to 3 positions.
Position size: 10% of equity (default_qty_value=10).
Configurable inputs for RSI, volume, liquidity, institutional flow, Nash equilibrium, and risk management.
Warning: This is a strategy, not just an indicator. It executes trades automatically in TradingView's Strategy Tester. Always backtest thoroughly and use proper risk management before live trading.
2. Working Logic (Step by Step)
The strategy processes each bar (candle) to generate signals, manage positions, and update performance metrics. Here's how it works:
a. Input Parameters
The inputs are grouped for clarity:
Herd Behavior (🐑):
RSI Period (14): For overbought/oversold detection.
Volume MA Period (20): To calculate average volume for spike detection.
Herd Threshold (2.0): Volume multiplier for detecting herd activity.
Liquidity Analysis (💧):
Liquidity Lookback (50): Bars to check for recent highs/lows.
Liquidity Sensitivity (1.5): Volume multiplier for trap detection.
Institutional Flow (🏦):
Institutional Volume Multiplier (2.5): For detecting large volume spikes.
Institutional MA Period (21): For Accumulation/Distribution smoothing.
Nash Equilibrium (⚖️):
Nash Period (100): For calculating price mean and standard deviation.
Nash Deviation (0.02): Multiplier for equilibrium bands.
Risk Management (🛡️):
Use Stop-Loss (true): Enables SL at 2% below/above entry price.
Use Take-Profit (true): Enables TP at 5% above/below entry price.
b. Herd Behavior Detection
RSI (14): Checks for extreme conditions:
Overbought: RSI > 70 (potential herd buying).
Oversold: RSI < 30 (potential herd selling).
Volume Spike: Volume > SMA(20) x 2.0 (herd_threshold).
Momentum: Price change over 10 bars (close - close ) compared to its SMA(20).
Herd Signals:
Herd Buying: RSI > 70 + volume spike + positive momentum = Retail buying frenzy (red background).
Herd Selling: RSI < 30 + volume spike + negative momentum = Retail selling panic (green background).
c. Liquidity Trap Detection
Recent Highs/Lows: Calculated over 50 bars (liquidity_lookback).
Psychological Levels: Nearest round numbers (e.g., $100, $110) as potential stop-loss zones.
Trap Conditions:
Up Trap: Price breaks recent high, closes below it, with a volume spike (volume > SMA x 1.5).
Down Trap: Price breaks recent low, closes above it, with a volume spike.
Visualization: Traps are marked with small red/green crosses above/below bars.
d. Institutional Flow Analysis
Volume Check: Volume > SMA(20) x 2.5 (inst_volume_mult) = Institutional activity.
Accumulation/Distribution (AD):
Formula: ((close - low) - (high - close)) / (high - low) * volume, cumulated over time.
Smoothed with SMA(21) (inst_ma_length).
Accumulation: AD > MA + high volume = Institutions buying.
Distribution: AD < MA + high volume = Institutions selling.
Smart Money Index: (close - open) / (high - low) * volume, smoothed with SMA(20). Positive = Smart money buying.
e. Nash Equilibrium
Calculation:
Price mean: SMA(100) (nash_period).
Standard deviation: stdev(100).
Upper Nash: Mean + StdDev x 0.02 (nash_deviation).
Lower Nash: Mean - StdDev x 0.02.
Conditions:
Near Equilibrium: Price between upper and lower Nash bands (stable market).
Above Nash: Price > upper band (overbought, sell potential).
Below Nash: Price < lower band (oversold, buy potential).
Visualization: Orange line (mean), red/green lines (upper/lower bands).
f. Game Theory Signals
The strategy generates three types of signals, combined into long/short triggers:
Contrarian Signals:
Buy: Herd selling + (accumulation or down trap) = Go against retail panic.
Sell: Herd buying + (distribution or up trap).
Momentum Signals:
Buy: Below Nash + positive smart money + no herd buying.
Sell: Above Nash + negative smart money + no herd selling.
Nash Reversion Signals:
Buy: Below Nash + rising close (close > close ) + volume > MA.
Sell: Above Nash + falling close + volume > MA.
Final Signals:
Long Signal: Contrarian buy OR momentum buy OR Nash reversion buy.
Short Signal: Contrarian sell OR momentum sell OR Nash reversion sell.
g. Position Management
Position Sizing (Minimax Principle):
Default: 1.0 (10% of equity).
In Nash equilibrium: Reduced to 0.5 (conservative).
During institutional volume: Increased to 1.5 (aggressive).
Entries:
Long: If long_signal is true and no existing long position (strategy.position_size <= 0).
Short: If short_signal is true and no existing short position (strategy.position_size >= 0).
Exits:
Stop-Loss: If use_sl=true, set at 2% below/above entry price.
Take-Profit: If use_tp=true, set at 5% above/below entry price.
Pyramiding: Up to 3 concurrent positions allowed.
h. Visualization
Nash Bands: Orange (mean), red (upper), green (lower).
Background Colors:
Herd buying: Red (90% transparency).
Herd selling: Green.
Institutional volume: Blue.
Signals:
Contrarian buy/sell: Green/red triangles below/above bars.
Liquidity traps: Red/green crosses above/below bars.
Tables:
Game Theory Table (Top-Right):
Herd Behavior: Buying frenzy, selling panic, or normal.
Institutional Flow: Accumulation, distribution, or neutral.
Nash Equilibrium: In equilibrium, above, or below.
Liquidity Status: Trap detected or safe.
Position Suggestion: Long (green), Short (red), or Wait (gray).
Backtest Table (Bottom-Right):
Total Trades: Number of closed trades.
Win Rate: Percentage of winning trades.
Net Profit/Loss: In USD, colored green/red.
Profit Factor: Gross profit / gross loss.
Max Drawdown: Peak-to-trough equity drop (%).
Win/Loss Trades: Number of winning/losing trades.
Risk/Reward Ratio: Simplified Sharpe ratio (returns / drawdown).
Avg Win/Loss Ratio: Average win per trade / average loss per trade.
Last Update: Current time.
i. Backtesting Metrics
Tracks:
Total trades, winning/losing trades.
Win rate (%).
Net profit ($).
Profit factor (gross profit / gross loss).
Max drawdown (%).
Simplified Sharpe ratio (returns / drawdown).
Average win/loss ratio.
Updates metrics on each closed trade.
Displays a label on the last bar with backtest period, total trades, win rate, and net profit.
j. Alerts
No explicit alertconditions defined, but you can add them for long_signal and short_signal (e.g., alertcondition(long_signal, "GT Long Entry", "Long Signal Detected!")).
Use TradingView's alert system with Strategy Tester outputs.
3. Usage Tips
Timeframe: Best for H1-D1 timeframes. Shorter frames (M1-M15) may produce noisy signals.
Settings:
Risk Management: Adjust sl_percent (e.g., 1% for volatile markets) and tp_percent (e.g., 3% for scalping).
Herd Threshold: Increase to 2.5 for stricter herd detection in choppy markets.
Liquidity Lookback: Reduce to 20 for faster markets (e.g., crypto).
Nash Period: Increase to 200 for longer-term analysis.
Backtesting:
Use TradingView's Strategy Tester to evaluate performance.
Check win rate (>50%), profit factor (>1.5), and max drawdown (<20%) for viability.
Test on different assets/timeframes to ensure robustness.
Live Trading:
Start with a demo account.
Combine with other indicators (e.g., EMAs, support/resistance) for confirmation.
Monitor liquidity traps and institutional flow for context.
Risk Management:
Always use SL/TP to limit losses.
Adjust position_size for risk tolerance (e.g., 5% of equity for conservative trading).
Avoid over-leveraging (pyramiding=3 can amplify risk).
Troubleshooting:
If no trades are executed, check signal conditions (e.g., lower herd_threshold or liquidity_sensitivity).
Ensure sufficient historical data for Nash and liquidity calculations.
If tables overlap, adjust position.top_right/bottom_right coordinates.
4. Key Differences from the Previous Indicator
Indicator vs. Strategy: The previous code was an indicator (VP + Game Theory Integrated Strategy) focused on visualization and alerts. This is a strategy with automated entries/exits and backtesting.
Volume Profile: Absent in this strategy, making it lighter but less focused on high-volume zones.
Wick Analysis: Not included here, unlike the previous indicator's heavy reliance on wick patterns.
Backtesting: This strategy includes detailed performance metrics and a backtest table, absent in the indicator.
Simpler Signals: Focuses on Game Theory signals (contrarian, momentum, Nash reversion) without the "Power/Ultra Power" hierarchy.
Risk Management: Explicit SL/TP and dynamic position sizing, not present in the indicator.
5. Conclusion
The "Game Theory Trading Strategy" is a sophisticated system leveraging herd behavior, institutional flows, liquidity traps, and Nash equilibrium to trade market inefficiencies. It’s designed for traders who understand Game Theory principles and want automated execution with robust risk management. However, it requires thorough backtesting and parameter optimization for specific markets (e.g., forex, crypto, stocks). The backtest table and visual aids make it easy to monitor performance, but always combine with other analysis tools and proper capital management.
If you need help with backtesting, adding alerts, or optimizing parameters, let me know!

Portfolio Tracker ARJO (V-01)Portfolio Tracker ARJO (V-01)
This indicator is a user-friendly portfolio tracking tool designed for TradingView charts. It overlays a customizable table on your chart to monitor up to 15 stocks or symbols in your portfolio. It calculates real-time metrics like current market price (CMP), gains/losses, and stoploss breaches, helping you stay on top of your investments without switching between multiple charts. The table uses color-coding for quick visual insights: green for profits, red for losses, and highlights breached stoplosses in red for alerts. It also shows portfolio-wide totals for overall performance.
Key Features
Supports up to 15 Symbols: Enter stock tickers (e.g., NSE:RELIANCE or BSE:TCS) with details like buy price, date, units, and stoploss.
Symbol: The stock ticker and description.
Buy Date: When you purchased it.
Units: Number of shares/units held.
Buy Price: Your entry price.
Stop Loss: Your set stoploss level (highlighted in red if breached by CMP).
CMP: Current market price (fetched from the chart's timeframe).
% Gain/Loss: Percentage change from buy price (color-coded: green for positive, red for negative).
Gain/Loss: Total monetary gain/loss based on units.
Optional Timeframe Columns: Toggle to show % change over 1 Week (1W), 1 Month (1M), 3 Months (3M), and 6 Months (6M) for historical performance.
Portfolio Summary: At the top of the table, see total % gain/loss and absolute gain/loss for your entire portfolio.
Visual Customizations: Adjust table position (e.g., Top Right), size, colors for positive/negative values, and intensity cutoff for gradients.
Benchmark Index-Based Header: The title row's background color reflects NIFTY's weekly trend (green if above 10-week SMA, red if below) for market context.
Benchmark Index-Based Header: The title row's background color reflects NIFTY's weekly trend (green if above 10-week SMA, red if below) for market context.
How to Use It: Step-by-Step Guide
Add the Indicator to Your Chart: Search for "Portfolio Tracker ARJO (V-01)" in TradingView's indicator library and add it to any chart (preferably Daily timeframe for accuracy).
Input Your Portfolio Symbols:
Open the indicator settings (gear icon).
In the "Symbol 1" to "Symbol 15" groups, fill in:
Symbol: Enter the ticker (e.g., NSE:INFY).
Year/Month/Day: Select your buy date (e.g., 2024-07-01).
Buy Price: Your purchase price per unit.
Stoploss: Your exit price if things go south.
Units: How many shares you own.
Only fill what you need—leave extras blank. The table auto-adjusts to show only entered symbols.
Customize the Table (Optional):
In "Table settings":
Choose position (e.g., Top Right) and size (% of chart).
Toggle "Show Timeframe Columns" to add 1W/1M/3M/6M performance.
In "Color settings":
Pick colors for positive (green) and negative (red) cells.
Set "Color intensity cutoff (%)" to control how strong the colors get (e.g., 10% means changes above 10% max out the color).
Interpret the Table on Your Chart:
The table appears overlaid—scan rows for each symbol's stats.
Look at colors: Greener = better gains; redder = bigger losses.
Check CMP cell: Red means stoploss breached—consider selling!
Portfolio Gain/Loss at the top gives a quick overall health check.
For Best Results:
Use on a Daily chart to avoid CMP errors (the script will warn if on Weekly/Monthly).
Refresh the chart or wait for a new bar if data doesn't update immediately.
For Indian stocks, prefix with NSE: or BSE: (e.g., BSE:RELIANCE).
This is for tracking only—not trading signals. Combine with your strategy.
If no symbols show, ensure inputs are valid (e.g., buy price > 0, valid date).
Finally, this tool makes it quite easy for beginners to track their portfolios, while also giving advanced traders powerful and customizable insights. I'd love to hear your feedback—happy trading!

Neuracap Gap AnalysisThe Neuracap Gap Analysis indicator is a comprehensive tool designed to identify and track price gaps, special candlestick patterns, and high-volume breakout signals. It combines multiple trading strategies into one powerful indicator for gap trading, pattern recognition, and momentum analysis.
🎯 What This Indicator Does
1. Gap Detection & Tracking
Automatically identifies price gaps (up and down)
Tracks gap fills with visual boxes that extend until closed
Manages gap history with customizable limits
Color-coded visualization (Green = Gap Up, Red = Gap Down)
2. Upside Tasuki Gap Pattern
Identifies the bullish continuation pattern
Colors candles yellow when pattern is detected
Confirms trend continuation signals
3. Episodic Pivot Detection
High-volume breakout identification
EMA filter ensures signals only in uptrends
Strong momentum confirmation
Fuchsia-colored candles with arrow markers
🔍 How to Use for Trading
📈 Gap Trading Strategy
Gap Up Trading:
Wait for gap up (green box appears)
Check volume - Higher volume = stronger signal
Entry options:
Aggressive: Enter at market open
Conservative: Wait for pullback to gap level
Stop loss: Below the gap fill level
Target: Previous resistance or 2:1 risk/reward
Gap Down Trading:
Identify gap down (red box appears)
Look for bounce opportunities
Entry: When price shows reversal signs
Stop: Below recent lows
Target: Gap fill level
💫 Tasuki Gap Strategy
Yellow candle indicates bullish continuation
Confirms uptrend is likely to continue
Entry: On next candle after pattern
Stop: Below the gap low
Target: Next resistance level
🚀 Episodic Pivot Strategy
Fuchsia candle + arrow = High probability breakout
All conditions met:
Price above EMA 20, 50, 200
High volume (2x+ average)
Strong price move (4%+)
Entry: At close or next open
Stop: Below EMA 20 or recent swing low
Target: Measured move or next resistance
📊 Reading the Visual Signals
Gap Boxes
🟢 Green Box: Gap up - potential bullish continuation
🔴 Red Box: Gap down - potential bounce or bearish continuation
Box extends until gap is filled
Box disappears when gap closes
Candle Colors
🟡 Yellow: Tasuki gap pattern (bullish continuation)
🟪 Fuchsia: Episodic pivot (high-volume breakout)
⬜ Normal: No special pattern detected
Arrows & Markers
⬆️ Triangle Arrow: Episodic pivot confirmation
💡 Trading Tips & Best Practices
✅ Do's
Combine with trend analysis - Trade gaps in direction of trend
Check volume - Higher volume = more reliable signals
Use multiple timeframes - Confirm on higher timeframes
Risk management - Always set stop losses
Wait for confirmation - Don't chase, let signals develop
❌ Don'ts
Don't trade all gaps - Focus on high-quality setups
Avoid low volume - Weak volume = unreliable signals
Don't ignore trend - Counter-trend trading is risky
Don't overtrade - Quality over quantity
Don't ignore context - Consider market conditions
⚠️ Risk Management
Position sizing: Risk 1-2% per trade
Stop losses: Always define before entry
Target levels: Set realistic profit targets
Market conditions: Avoid trading in choppy markets
📈 Performance Optimization
For Conservative Traders:
Increase minimum gap size to 1%
Set volume multiplier to 3.0x
Only trade episodic pivots in strong uptrends
Wait for gap fill confirmation
For Aggressive Traders:
Decrease minimum gap size to 0.3%
Set volume multiplier to 1.5x
Trade both gap types
Enter on pattern confirmation
🚨 Alert Setup
The indicator provides alerts for:
Gap Up Detected
Gap Down Detected
Upside Tasuki Gap
Episodic Pivot
Recommended: Enable all alerts and filter manually based on your strategy.
📝 Summary
This indicator excels at identifying high-probability trading opportunities through gap analysis, pattern recognition, and momentum confirmation. Use it as part of a complete trading system with proper risk management for best results.

EMA 12/26 With ATR Volatility StoplossThe EMA 12/26 With ATR Volatility Stoploss
The EMA 12/26 With ATR Volatility Stoploss strategy is a meticulously designed systematic trading approach tailored for navigating financial markets through technical analysis. By integrating the Exponential Moving Average (EMA) and Average True Range (ATR) indicators, the strategy aims to identify optimal entry and exit points for trades while prioritizing disciplined risk management. At its core, it is a trend-following system that seeks to capitalize on price momentum, employing volatility-adjusted stop-loss mechanisms and dynamic position sizing to align with predefined risk parameters. Additionally, it offers traders the flexibility to manage profits either by compounding returns or preserving initial capital, making it adaptable to diverse trading philosophies. This essay provides a comprehensive exploration of the strategy’s underlying concepts, key components, strengths, limitations, and practical applications, without delving into its technical code.
=====
Core Philosophy and Objectives
The EMA 12/26 With ATR Volatility Stoploss strategy is built on the premise of capturing short- to medium-term price trends with a high degree of automation and consistency. It leverages the crossover of two EMAs—a fast EMA (12-period) and a slow EMA (26-period)—to generate buy and sell signals, which indicate potential trend reversals or continuations. To mitigate the inherent risks of trading, the strategy incorporates the ATR indicator to set stop-loss levels that adapt to market volatility, ensuring that losses remain within acceptable bounds. Furthermore, it calculates position sizes based on a user-defined risk percentage, safeguarding capital while optimizing trade exposure.
A distinctive feature of the strategy is its dual profit management modes:
SnowBall (Compound Profit): Profits from successful trades are reinvested into the capital base, allowing for progressively larger position sizes and potential exponential portfolio growth.
ZeroRisk (Fixed Equity): Profits are withdrawn, and trades are executed using only the initial capital, prioritizing capital preservation and minimizing exposure to market downturns.
This duality caters to both aggressive traders seeking growth and conservative traders focused on stability, positioning the strategy as a versatile tool for various market environments.
=====
Key Components of the Strategy
1. EMA-Based Signal Generation
The strategy’s trend-following mechanism hinges on the interaction between the Fast EMA (12-period) and Slow EMA (26-period). EMAs are preferred over simple moving averages because they assign greater weight to recent price data, enabling quicker responses to market shifts. The key signals are:
Buy Signal: Triggered when the Fast EMA crosses above the Slow EMA, suggesting the onset of an uptrend or bullish momentum.
Sell Signal: Occurs when the Fast EMA crosses below the Slow EMA, indicating a potential downtrend or the end of a bullish phase.
To enhance signal reliability, the strategy employs an Anchor Point EMA (AP EMA), a short-period EMA (e.g., 2 days) that smooths the input price data before calculating the primary EMAs. This preprocessing reduces noise from short-term price fluctuations, improving the accuracy of trend detection. Additionally, users can opt for a Consolidated EMA (e.g., 18-period) to display a single trend line instead of both EMAs, simplifying chart analysis while retaining trend insights.
=====
2. Volatility-Adjusted Risk Management with ATR
Risk management is a cornerstone of the strategy, achieved through the use of the Average True Range (ATR), which quantifies market volatility by measuring the average price range over a specified period (e.g., 10 days). The ATR informs the placement of stop-loss levels, which are set at a multiple of the ATR (e.g., 2x ATR) below the entry price for long positions. This approach ensures that stop losses are proportionate to current market conditions—wider during high volatility to avoid premature exits, and narrower during low volatility to protect profits.
For example, if a stock’s ATR is $1 and the multiplier is 2, the stop loss for a buy at $100 would be set at $98. This dynamic adjustment enhances the strategy’s adaptability, preventing stop-outs from normal market noise while capping potential losses.
=====
3. Dynamic Position Sizing
The strategy calculates position sizes to align with a user-defined Risk Per Trade, typically expressed as a percentage of capital (e.g., 2%). The position size is determined by:
The available capital, which varies depending on whether SnowBall or ZeroRisk mode is selected.
The distance between the entry price and the ATR-based stop-loss level, which represents the per-unit risk.
The desired risk percentage, ensuring that the maximum loss per trade does not exceed the specified threshold.
For instance, with a $1,000 capital, a 2% risk per trade ($20), and a stop-loss distance equivalent to 5% of the entry price, the strategy computes the number of units (shares or contracts) to ensure the total loss, if the stop loss is hit, equals $20. To prevent over-leveraging, the strategy includes checks to ensure that the position’s dollar value does not exceed available capital. If it does, the position size is scaled down to fit within the capital constraints, maintaining financial discipline.
=====
4. Flexible Capital Management
The strategy’s dual profit management modes—SnowBall and ZeroRisk—offer traders strategic flexibility:
SnowBall Mode: By compounding profits, traders can increase their capital base, leading to larger position sizes over time. This is ideal for those with a long-term growth mindset, as it harnesses the power of exponential returns.
ZeroRisk Mode: By withdrawing profits and trading solely with the initial capital, traders protect their gains and limit exposure to market volatility. This conservative approach suits those prioritizing stability over aggressive growth.
These options allow traders to tailor the strategy to their risk tolerance, financial goals, and market outlook, enhancing its applicability across different trading styles.
=====
5. Time-Based Trade Filtering
To optimize performance and relevance, the strategy includes an option to restrict trading to a specific time range (e.g., from 2018 onward). This feature enables traders to focus on periods with favorable market conditions, avoid historically volatile or unreliable data, or align the strategy with their backtesting objectives. By confining trades to a defined timeframe, the strategy ensures that performance metrics reflect the intended market context.
=====
Strengths of the Strategy
The EMA 12/26 With ATR Volatility Stoploss strategy offers several compelling advantages:
Systematic and Objective: By adhering to predefined rules, the strategy eliminates emotional biases, ensuring consistent execution across market conditions.
Robust Risk Controls: The combination of ATR-based stop losses and risk-based position sizing caps losses at user-defined levels, fostering capital preservation.
Customizability: Traders can adjust parameters such as EMA periods, ATR multipliers, and risk percentages, tailoring the strategy to specific markets or preferences.
Volatility Adaptation: Stop losses that scale with market volatility enhance the strategy’s resilience, accommodating both calm and turbulent market phases.
Enhanced Visualization: The use of color-coded EMAs (green for bullish, red for bearish) and background shading provides intuitive visual cues, simplifying trend and trade status identification.
=====
Limitations and Considerations
Despite its strengths, the strategy has inherent limitations that traders must address:
False Signals in Range-Bound Markets: EMA crossovers may generate misleading signals in sideways or choppy markets, leading to whipsaws and unprofitable trades.
Signal Lag: As lagging indicators, EMAs may delay entry or exit signals, causing traders to miss rapid trend shifts or enter trades late.
Overfitting Risk: Excessive optimization of parameters to fit historical data can impair the strategy’s performance in live markets, as past patterns may not persist.
Impact of High Volatility: In extremely volatile markets, wider stop losses may result in larger losses than anticipated, challenging risk management assumptions.
Data Reliability: The strategy’s effectiveness depends on accurate, continuous price data, and discrepancies or gaps can undermine signal accuracy.
=====
Practical Applications
The EMA 12/26 With ATR Volatility Stoploss strategy is versatile, applicable to diverse markets such as stocks, forex, commodities, and cryptocurrencies, particularly in trending environments. To maximize its potential, traders should adopt a rigorous implementation process:
Backtesting: Evaluate the strategy’s historical performance across various market conditions to assess its robustness and identify optimal parameter settings.
Forward Testing: Deploy the strategy in a demo account to validate its real-time performance, ensuring it aligns with live market dynamics before risking capital.
Ongoing Monitoring: Continuously track trade outcomes, analyze performance metrics, and refine parameters to adapt to evolving market conditions.
Additionally, traders should consider market-specific factors, such as liquidity and volatility, when applying the strategy. For instance, highly liquid markets like forex may require tighter ATR multipliers, while less liquid markets like small-cap stocks may benefit from wider stop losses.
=====
Conclusion
The EMA 12/26 With ATR Volatility Stoploss strategy is a sophisticated, systematic trading framework that blends trend-following precision with disciplined risk management. By leveraging EMA crossovers for signal generation, ATR-based stop losses for volatility adjustment, and dynamic position sizing for risk control, it offers a balanced approach to capturing market trends while safeguarding capital. Its flexibility—evident in customizable parameters and dual profit management modes—makes it suitable for traders with varying risk appetites and objectives. However, its limitations, such as susceptibility to false signals and signal lag, necessitate thorough testing and prudent application. Through rigorous backtesting, forward testing, and continuous refinement, traders can harness this strategy to achieve consistent, risk-adjusted returns in trending markets, establishing it as a valuable tool in the arsenal of systematic trading.

Sideways Scalper Peak and BottomUnderstanding the Indicator
This indicator is designed to identify potential peaks (tops) and bottoms (bottoms) within a market, which can be particularly useful in a sideways or range-bound market where price oscillates between support and resistance levels without a clear trend. Here's how it works:
RSI (Relative Strength Index): Measures the speed and change of price movements to identify overbought (above 70) and oversold (below 30) conditions. In a sideways market, RSI can help signal when the price might be due for a reversal within its range.
Moving Averages (MAs): The Fast MA and Slow MA provide a sense of the short-term and longer-term average price movements. In a sideways market, these can help confirm if the price is at the upper or lower extremes of its range.
Volume Spike: Looks for significant increases in trading volume, which might indicate a stronger move or a potential reversal point when combined with other conditions.
Divergence: RSI divergence occurs when the price makes a new high or low, but the RSI does not, suggesting momentum is weakening, which can be a precursor to a reversal.
How to Use in a Sideways Market
Identify the Range: First, visually identify the upper resistance and lower support levels of the sideways market on your chart. This indicator can help you spot these levels more precisely by signaling potential peaks and bottoms.
Peak Signal :
When to Look: When the price approaches the upper part of the range.
Conditions: The indicator will give a 'Peak' signal when:
RSI is over 70, indicating overbought conditions.
There's bearish divergence (price makes a higher high, but RSI doesn't).
Volume spikes, suggesting strong selling interest.
Price is above both Fast MA and Slow MA, indicating it's at a potentially high point in the range.
Action: This signal suggests that the price might be at or near the top of its range and could reverse downwards. A trader might consider selling or shorting here, expecting the price to move towards the lower part of the range.
Bottom Signal:
When to Look: When the price approaches the lower part of the range.
Conditions: The indicator will give a 'Bottom' signal when:
RSI is below 30, indicating oversold conditions.
There's bullish divergence (price makes a lower low, but RSI doesn't).
Volume spikes, suggesting strong buying interest.
Price is below both Fast MA and Slow MA, indicating it's at a potentially low point in the range.
Action: This signal suggests that the price might be at or near the bottom of its range and could reverse upwards. A trader might consider buying here, expecting the price to move towards the upper part of the range.
Confirmation: In a sideways market, false signals can occur due to the lack of a strong trend. Always look for confirmation:
Volume Confirmation: A significant volume spike can add confidence to the signal.
Price Action: Look for price action like candlestick patterns (e.g., doji, engulfing patterns) that confirm the reversal.
Time Frame: Consider using this indicator on multiple time frames. A signal on a shorter time frame (like 15m or 1h) might be confirmed by similar conditions on a longer time frame (4h or daily).
Risk Management: Since this is designed for scalping in a sideways market:
Set Tight Stop-Losses: Due to the quick nature of reversals in range-bound markets, place stop-losses close to your entry to minimize loss.
Take Profit Levels: Set profit targets near the opposite end of the range or use a trailing stop to capture as much of the move as possible before it reverses again.
Practice: Before trading with real money, practice with this indicator on historical data or in a paper trading environment to understand how it behaves in different sideways market scenarios.
Key Points for New Traders
Patience: Wait for all conditions to align before taking a trade. Sideways markets require patience as the price might hover around these levels for a while.
Not All Signals Are Equal: Sometimes, even with all conditions met, the market might not reverse immediately. Look for additional context or confirmation.
Continuous Learning: Understand that this indicator, like any tool, isn't foolproof. Learn from each trade, whether it's a win or a loss, and adjust your strategy accordingly.
By following these guidelines

Strategy: Candlestick Wick Analysis with Volume Conditions
This strategy focuses on analyzing the wicks (or shadows) of candlesticks to identify potential trading opportunities based on candlestick structure and volume. Based on these criteria, it places stop orders at the extremities of the wicks when certain conditions are met, thus increasing the chances of capturing significant price movements.
Trading Criteria
Volume Conditions:
The strategy checks if the volume of the current candle is higher than that of the previous three candles. This ensures that the observed price movement is supported by significant volume, increasing the probability that the price will continue in the same direction.
Wick Analysis:
Upper Wick:
If the upper wick of a candle represents more than 90% of its body size and is longer than the lower wick, this indicates that the price tested a resistance level before pulling back.
Order Placement: In this case, a Buy Stop order is placed at the upper extremity of the wick. This means that if the price rises back to this level, the order will be triggered, and the trader will take a buy position.
SL Management: A stop-loss is then placed below the lowest point of the same candle. This protects the trader by limiting losses if the price falls back after the order is triggered.
Lower Wick:
If the lower wick of a candle is longer than the upper wick and represents more than 90% of its body size, this indicates that the price tested a support level before rising.
Order Placement: In this case, a Sell Stop order is placed at the lower extremity of the wick. Thus, if the price drops back to this level, the order will be triggered, and the trader will take a sell position.
SL Management: A stop-loss is then placed above the highest point of the same candle. This ensures risk management by limiting losses if the price rebounds upward after the order is triggered.
Strategy Advantages
Responsiveness to Price Movements: The strategy is designed to detect significant price movements based on the market's reaction around support and resistance levels. By placing stop orders directly at the wick extremities, it allows capturing strong movements in the direction indicated by the candles.
Securing Positions: Using stop-losses positioned just above or below key levels (wicks) provides better risk management. If the market doesn't move as expected, the position is automatically closed with a limited loss.
Clear Visual Indicators: Symbols are displayed on the chart at the points where orders have been placed, making it easier to understand trading decisions. This helps to quickly identify the support or resistance levels tested by the price, as well as potential entry points.
Conclusion
The strategy is based on the idea that large wicks signal areas where buyers or sellers have tested significant price levels before temporarily retreating. By placing stop orders at the extremities of these wicks, the strategy allows capturing price movements when they confirm, while limiting risks through strategically placed stop-losses. It thus offers a balanced approach between capturing potential profit and managing risk.
This description emphasizes the idea of capturing significant market movements with stop orders while providing a clear explanation of the logic and risk management. It’s tailored for publication on TradingView and highlights the robustness of the strategy.

Pro V3 [SMRT Algo]SMRT Algo Suite is a versatile toolkit featuring advanced features designed to deliver valuable signals and insights, catering to every trader's technical analysis requirements with precise data.
The SMRT Algo V3 represents a groundbreaking, comprehensive solution built from the ground up for traders.
While SMRT Algo can complement other technical analysis methods, it is also designed to function effectively as a standalone indicator adaptable to any trading style. Each feature is designed with the understanding that not all technical indicators suit every market condition.
The optimal approach to leveraging this indicator is to explore its diverse features gradually, select a few that best match your trading style, and use them consistently to develop a personalized SMRT Algo strategy.
Features:
Buy & Sell Signals: Clear buy and sell signals displayed on the chart, with ‘+’ indicating strong signals and normal signals without ‘+’.
Candle Coloring: Blue and red candle colors to signify bullish and bearish trends, respectively.
Signal Sensitivity: Adjust the frequency of signals to match your trading preferences.
MA Filter: Customizable moving average filter to ensure trades align with the prevailing trend.
Dashboard: Multi-timeframe analysis with information on various timeframes, offering quick decision-making capabilities and a customizable dashboard size.
Trailing Stop Loss: Suggestions for trailing stop losses to maximize profits while minimizing risk.
Power MA: A custom moving average that closely follows price, highlighting short-term market trends.
ChoCh/Bos: Displays internal market structure, including changes of character and breaks of structure.
Market Structure: Shows external market structure, detailing changes of character, breaks of structure, and pivot points.
Support & Resistance: Key support and resistance zones plotted on the chart.
Reversals: Highlights areas with a high likelihood of reversal using diamond markers.
Reversal Bands: Zones where price is likely to reverse or correct.
Trend Lines: Auto-plotted trendlines for quick and easy analysis.
Retest Zones: Ideal for break-and-retest traders, identifying key retest zones for entries and re-entries
Take Profit & Stop Loss: Customizable take profit and stop loss points.
Full Any Alert() Function Call Conditions: Create custom alerts directly to your TradingView device for timely notifications.
Additional features: A set of toggles turning on/off these indicators.
SMRT Algo Pro V3 offers a comprehensive set of features designed to enhance your trading experience by providing actionable insights and customizable tools for all trading styles.
SMRT Algo Pro V3 Confirmation Signals and Candle Coloring
The signals in SMRT Algo Pro V3 can generate both normal and strong labels, with strong signals marked by the "+" symbol. These signals are closely linked to the candle coloring, providing a visual representation of trend development to help navigate various market conditions effectively.
Candle Coloring:
Blue Candles: Indicate bullish trends.
Red Candles: Indicate bearish trends.
Candles will turn blue when there is a buy signal, and turn red when there is a sell signal.
The candle coloring is especially useful when interpreting signals. For instance, a consistent series of blue candles alongside buy signals suggests a strong uptrend, reducing the likelihood of a fake-out. Conversely, a series of red candles with sell signals indicates a strong downtrend.
Dashboard for Multi-Timeframe Analysis
The dashboard provides a consolidated view of multiple timeframes, helping traders make quick decisions based on comprehensive data. This feature reduces the need to switch between charts, streamlining the analysis process.
The dashboard will show the trend of higher timeframes, based on signal calculation and the trend filter.
Note on the dashboard: To reduce memory load, it will only display information from the current timeframe and up.
Trailing Stop Loss
This component workw to maximize profits and manage risk. The Trailing Stop Loss feature provides dynamic stop loss levels. Traders can use this feature to place their stop loss in profit while price goes in favor of your direction, so that less profit is left on the table, should the trade reverse against you.
Green trailing stop loss ranges are shown for buy trades, while red lines are shown for sell trades. This can be used together with the buy & sell signals to trail the stop loss for those trades.
Power MA
The Power MA follows the price closely, indicating short-term market trends and potential exit points. Traders can use the Power MA to determine when to enter a trade. For example, if the Pro V3 prints a buy signal, but the power MA is red (indicating that the market is short term bearish), it can act as a confirmation to stay out of that trade. Conversely, if the power MA is blue, then it can be an added confirmation to enter the buy trade based on the signals.
Market Structure
The inclusion of ChoCh/Bos (Change of Character and Break of Structure) helps traders understand internal and external market shifts. The ChoCh/Bos shows internal market structure, while the Market Structure feature shows the external market structure. This feature is crucial for identifying key turning points and potential trend continuations, as well as ICT traders.
We recommend traders to use this as an added confirmation, for example, once a buy signal is printed, wait for an internal or external Choch/BOS, possibly indicating that the market is now in control of the bulls. From there traders an either enter off another signal from the V3 or wait for the retest from the Retest Zones feature of the V3.
Support & Resistance, Reversals, and Reversal Bands
These features highlight critical market levels and areas where price is likely to reverse or correct. They are essential for traders looking to capitalize on key support and resistance zones or potential reversal points.
They can be used together with the buy & sell signals. An example is when a sell signal appears, we can look for potential trade exits either at the S/R zones, the reversal diamonds that are printed on the candle, or when price touches the reversal bands.
Trend Lines
Auto-plotted trend lines and the trend ribbon provide insights into longer-term trends. They can be used together with the buy sell features of the V3, e.g. if a sell signal is printed, but price is in the lower half of the trend lines, we can assume that price is in an area of premium for our short trade. Traders can choose whether to wait for price to retrace back into an area of discount (top half of the trend line), where they can look to short.
Retest Zones
The Retest Zones feature identifies optimal entry and re-entry points for break-and-retest strategies. As mentioned earlier, this feature can be used together with other features to act as a re-entry or further confirmation before entering a trade.
Traders can wait for a signal to be printed by the V3, and wait for further confrirmation from the retest zones to enter at a better price. This feature can be used together with the signals, and the market structure features to create a simple break & retest strategy.
Take Profit Modes:
SMRT Algo Pro V3 includes a versatile Take Profit Mode designed to help traders optimize their exits:
Hybrid Mode: Displays Take Profit, entry, and stop loss lines on the chart for the current position. Additionally, small circles labeled TP1, TP2, and TP3 indicate the points where take profit levels were hit.
Minimal Mode: Only displays the small circles labeled TP1, TP2, and TP3, providing a cleaner chart view while still indicating take profit hits.
Traditional Mode Only: Displays only the lines for Take Profit, entry, and stop loss, without the small circles.
Take profits are based off of 1:1, 1:2 and 1:3 risk to reward ratio with respect to the stop loss.
These modes offer flexibility for traders to choose their preferred level of detail on the chart, helping them to manage their trades effectively and track their take profit levels clearly.
The features of SMRT Algo Pro V3 can significantly strengthen your market analysis by providing additional confluences. These features allow traders to cross-verify signals and trends, making their strategies more robust and reliable. Here's how you can leverage these features:
SMRT Algo Pro V3 offers a comprehensive suite of tools and features that extend beyond the capabilities of standard or open-source indicators, providing significant additional value to users.
Integrated System: Unlike basic or open-source tools that may require multiple installations and configurations, SMRT Algo Pro V3 combines all necessary indicators into a cohesive system.
Advanced Customization: The toolkit offers extensive customization options, including signal sensitivity adjustments, customizable MA Filters, and various Take Profit Modes. These features allow traders to tailor the system to their specific trading styles and risk tolerance, providing a level of personalization that free tools often lack.
Real-Time Market Adaptation: SMRT Algo Pro V3 includes features like a deep learning dashboard and real-time market data integration, which continuously update and adapt to changing market conditions. This ensures that users receive the most current and relevant signals, enhancing decision-making accuracy.
Educational Support: Alongside the tools, SMRT Algo provides comprehensive educational resources and tutorials, helping traders understand how to effectively use the system and develop robust trading strategies. This educational aspect adds significant value, especially for beginners looking to deepen their knowledge.
Comprehensive Analysis Tools: The inclusion of multi-timeframe analysis, a detailed dashboard, and advanced market structure indicators help traders make more informed decisions by offering a complete picture of market dynamics.
Support and Community: Subscribers to SMRT Algo Pro V3 gain access to dedicated 24/7 support and an active trading community. This support network can be invaluable for troubleshooting, strategy development, and gaining insights from other experienced traders.
SMRT Algo believe that there is no magic indicator that is able to print money. Indicator toolkits provide value via their convinience, adaptibility and uniqueness. Combining these items can help a trader make more educated; less messy, more planned trades and in turn hopefully help them succeed.
RISK DISCLAIMER
Trading involves significant risk, and most day traders lose money. All content, tools, scripts, articles, and educational materials provided by SMRT Algo are intended solely for informational and educational purposes. Past performance is not indicative of future results. Always conduct your own research and consult with a licensed financial advisor before making any trading decisions.

Volume Candle bollinger band By Anil ChawraHow Users Can Make Profit Using This Script:
1.Volume Representation: Each candle on the chart represents a specific time period (e.g., 1 minute, 1 hour, 1 day) and includes information about both price movement and trading volume during that period.
2.Candlestick Anatomy: A volume candle has the same components as a regular candlestick: the body (which represents the opening and closing prices) and the wicks or shadows (which indicate the highest and lowest prices reached during the period).
3.Volume Bars: Instead of just the candlestick itself, volume candles also include a bar or histogram representing the trading volume during that period. The height or length of the volume bar indicates the amount of trading activity.
4.Interpreting Volume: High volume candles typically indicate increased market interest or activity during that period. This could be due to significant buying or selling pressure.
5.Confirmation: Traders often look for confirmation from other technical indicators or price action to validate the significance of a high volume candle. For example, a high volume candle breaking through a key support or resistance level may signal a strong market move.
6.Trend Strength: Volume candles can provide insights into the strength of a trend. A series of high volume candles in the direction of the trend suggests strong momentum, while decreasing volume may indicate weakening momentum or a potential reversal.
7.Volume Patterns: Traders also analyze volume patterns, such as volume spikes or divergences, to identify potential trading opportunities or reversals.
8.Combination with Price Action: Volume analysis is often used in conjunction with price action analysis and other technical indicators to make more informed trading decisions.
9.Confirmation and Validation: It's important to confirm the significance of volume candles with other indicators or price action signals to avoid false signals.
10.Risk Management: As with any trading strategy, proper risk management is crucial when using volume candles to make trading decisions. Set stop-loss orders and adhere to risk management principles to protect your capital.
How the Script Works:
1.Identify High Volume Candles: Look for candles with significantly higher volume compared to the surrounding candles. These can indicate increased market interest or activity.
2.Wait for Confirmation: Once you identify a high volume candle, wait for confirmation from subsequent candles to ensure the momentum is sustained.
3.Enter the Trade: After confirmation, consider entering a trade in the direction indicated by the high volume candle. For example, if it's a bullish candle, consider buying.
4.Set Stop Loss: Always set a stop loss to limit potential losses in case the trade goes against you.
5.Take Profit: Set a target for taking profits. This could be based on technical analysis, such as a resistance level or a certain percentage gain.
6.Monitor Volume: Continuously monitor volume to gauge the strength of the trend. Decreasing volume may signal weakening momentum and could be a sign to exit the trade.
7.Risk Management: Manage risk carefully by adjusting position sizes according to your risk tolerance and the size of your trading account.
8.Review and Adapt: Regularly review your trades and adapt your strategy based on what's working and what's not.
Remember, no trading strategy guarantees profits, and it's essential to practice proper risk management and have realistic expectations. Additionally, consider combining volume analysis with other technical indicators for a more comprehensive approach to trading.
How Users Can Make Profit Using this script :
Bollinger Bands are a technical analysis tool that helps traders identify potential trends and volatility in the market. Here's a simple strategy using Bollinger Bands with a 10-point range:
1. *Understanding Bollinger Bands*: Bollinger Bands consist of a simple moving average (typically 20 periods) and two standard deviations plotted above and below the moving average. The bands widen during periods of high volatility and contract during periods of low volatility.
2. *Identify Price Range*: Look for a stock or asset that has been trading within a relatively narrow range (around 10 points) for some time. This indicates low volatility.
3. *Wait for Squeeze*: When the Bollinger Bands contract, it suggests that volatility is low and a breakout may be imminent. This is often referred to as a "squeeze."
4. *Plan Entry and Exit Points*: When the price breaks out of the narrow range and closes above the upper Bollinger Band, consider entering a long position. Conversely, if the price breaks below the lower band, consider entering a short position.
5. *Set Stop-Loss and Take-Profit*: Set stop-loss orders to limit potential losses if the trade goes against you. Take-profit orders can be set at a predetermined level or based on the width of the Bollinger Bands.
6. *Monitor and Adjust*: Continuously monitor the trade and adjust your stop-loss and take-profit levels as the price moves.
7. *Risk Management*: Only risk a small percentage of your trading capital on each trade. This helps to mitigate potential losses.
8. *Practice and Refinement*: Practice this strategy on a demo account or with small position sizes until you are comfortable with it. Refine your approach based on your experience and market conditions.
Remember, no trading strategy guarantees profits, and it's essential to combine technical analysis with fundamental analysis and risk management principles for successful trading. Additionally, always stay informed about market news and events that could impact your trades.
How does script works:
Bollinger Bands work by providing a visual representation of the volatility and potential price movements of a financial instrument. Here's how they work with a 10-point range:
1. *Calculation of Bollinger Bands*: The bands consist of three lines: the middle line is a simple moving average (SMA) of the asset's price (typically calculated over 20 periods), and the upper and lower bands are calculated by adding and subtracting a multiple of the standard deviation (usually 2) from the SMA.
2. *Interpretation of the Bands*: The upper and lower bands represent the potential extremes of price movements. In a 10-point range scenario, these bands are positioned 10 points above and below the SMA.
3. *Volatility Measurement*: When the price is experiencing high volatility, the bands widen, indicating a wider potential range of price movement. Conversely, during periods of low volatility, the bands contract, suggesting a narrower potential range.
4. *Mean Reversion and Breakout Signals*: Traders often use Bollinger Bands to identify potential mean reversion or breakout opportunities. When the price touches or crosses the upper band, it may indicate overbought conditions, suggesting a potential reversal to the downside. Conversely, when the price touches or crosses the lower band, it may indicate oversold conditions and a potential reversal to the upside.
5. *10-Point Range Application*: In a scenario where the price range is limited to 10 points, traders can look for opportunities when the price approaches either the upper or lower band. If the price consistently bounces between the bands, traders may consider buying near the lower band and selling near the upper band.
6. *Confirmation and Risk Management*: Traders often use other technical indicators or price action patterns to confirm signals generated by Bollinger Bands. Additionally, it's crucial to implement proper risk management techniques, such as setting stop-loss orders, to protect against adverse price movements.
Overall, Bollinger Bands provide traders with valuable insights into market volatility and potential price movements, helping them make informed trading decisions. However, like any technical indicator, they are not foolproof and should be used in conjunction with other analysis methods.

Turtle Trading Strategy@lihexieThe full implementation of the Turtle Trading Rules (as distinct from the various truncated versions circulating within the community) is now ready.
This trading strategy script distinguishes itself from all currently publicly available Turtle trading systems on Tradingview by comprehensively embodying the rules for entries, exits, position management, and profit and loss controls.
Market Selection:
Trade in highly liquid markets such as forex, commodity futures, and stock index futures.
Entry Strategies:
Model 1: Buy when the price breaks above the highest point of the last 20 trading days; Sell when the price drops below the lowest point of the last 20 trading days. When an entry opportunity arises, if the previous trade was profitable, skip the current breakout opportunity and refrain from entering.
Model 2: Buy when the price breaks above the highest point of the last 55 trading days; Sell when the price drops below the lowest point of the last 55 trading days.
Position Sizing:
Determine the size of each position based on the price volatility (ATR) to ensure that the risk of each trade does not exceed 2% of the account balance.
Exit Strategies:
1. Use a fixed stop-loss point to limit losses: Close long positions when the price falls below the lowest point of the last 10 trading days.
2. Trailing stop-loss: Once a position is profitable, adjust the stop-loss point to protect profits.
Pyramiding Rules:
Unit Doubling: Increase position size by one unit every time the price moves forward by n (default is 0.5) units of ATR, up to a maximum of 4 units, while also raising the stop-loss point to below the ATR value at the level of additional entries.
海龟交易法则的完整实现(区别于当前社区各种有阉割海龟交易系统代码)
本策略脚本区别于Tradingview目前公开的所有的海龟交易系统,完整的实现了海龟交易法则中入场、出场、仓位管理,止盈止损的规则。
市场选择:
选择流动性高的市场进行交易,如外汇、商品期货和股指期货等。
入市策略:
模式1:当价格突破过去20个交易日的高点时,买入;当价格跌破过去20个交易日的低点时,卖出。当出现入场机会时,如果上一笔交易是盈利的,那么跳过当前突破的机会,不进行入场。
模式2:当价格突破过去55个交易日的高点时,买入;当价格跌破过去55个交易日的低点时,卖出。
头寸规模:
根据价格波动性(ATR)来确定每个头寸的大小, 使每笔交易的风险不超过账户余额的2%。
退出策略:
1. 使用一个固定的止损点来限制损失:当多头头寸的价格跌破过去10个交易日的低点时,平仓止损。
2. 跟踪止损:一旦头寸盈利,移动止损点以保护利润。
加仓规则:
单位加倍:每当价格向前n(默认是0.5)个单位的ATR移动时,就增加一个单位的头寸大小(默认最大头寸数量是4个),同时将止损点提升至加仓点位的ATR值以下。

Rate of Change StrategyRate of Change Strategy :
INTRODUCTION :
This strategy is based on the Rate of Change indicator. It compares the current price with that of a user-defined period of time ago. This makes it easy to spot trends and even speculative bubbles. The strategy is long term and very risky, which is why we've added a Stop Loss. There's also a money management method that allows you to reinvest part of your profits or reduce the size of your orders in the event of substantial losses.
RATE OF CHANGE (ROC) :
As explained above, the ROC is used to situate the current price compared to that of a certain period of time ago. The formula for calculating ROC in relation to the previous year is as follows :
ROC (365) = (close/close (365) - 1) * 100
With this formula we can find out how many percent the change in the current price is compared with 365 days ago, and thus assess the trend.
PARAMETERS :
ROC Length : Length of the ROC to be calculated. The current price is compared with that of the selected length ago.
ROC Bubble Signal : ROC value indicating that we are in a bubble. This value varies enormously depending on the financial product. For example, in the equity market, a bubble exists when ROC = 40, whereas in cryptocurrencies, a bubble exists when ROC = 150.
Stop Loss (in %) : Stop Loss value in percentage. This is the maximum trade value percentage that can be lost in a single trade.
Fixed Ratio : This is the amount of gain or loss at which the order quantity is changed. The default is 400, which means that for each $400 gain or loss, the order size is increased or decreased by an amount chosen by the user.
Increasing Order Amount : This is the amount to be added to or subtracted from orders when the fixed ratio is reached. The default is $200, which means that for every $400 gain, $200 is reinvested in the strategy. On the other hand, for every $400 loss, the order size is reduced by $200.
Initial capital : $1000
Fees : Interactive Broker fees apply to this strategy. They are set at 0.18% of the trade value.
Slippage : 3 ticks or $0.03 per trade. Corresponds to the latency time between the moment the signal is received and the moment the order is executed by the broker.
Important : A bot has been used to test the different parameters and determine which ones maximize return while limiting drawdown. This strategy is the most optimal on BITSTAMP:BTCUSD in 1D timeframe with the following parameters :
ROC Length = 365
ROC Bubble Signal = 180
Stop Loss (in %) = 6
LONG CONDITION :
We are in a LONG position if ROC (365) > 0 for at least two days. This allows us to limit noise and irrelevant signals to ensure that the ROC remains positive.
SHORT CONDITION :
We are in a SHORT position if ROC (365) < 0 for at least two days. We also open a SHORT position when the speculative bubble is about to burst. If ROC (365) > 180, we're in a bubble. If the bubble has been in existence for at least a week and the ROC falls back below this threshold, we can expect the asset to return to reasonable prices, and thus a downward trend. So we're opening a SHORT position to take advantage of this upcoming decline.
EXIT RULES FOR WINNING TRADE :
The strategy is self-regulating. We don't exit a LONG trade until a SHORT signal has arrived, and vice versa. So, to exit a winning position, you have to wait for the entry signal of the opposite position.
RISK MANAGEMENT :
This strategy is very risky, and we can easily end up on the wrong side of the trade. That's why we're going to manage our risk with a Stop Loss, limiting our losses as a percentage of the trade's value. By default, this percentage is set at 6%. Each trade will therefore take a maximum loss of 6%.
If the SL has been triggered, it probably means we were on the wrong side. This is why we change the direction of the trade when a SL is triggered. For example, if we were SHORT and lost 6% of the trade value, the strategy will close this losing trade and open a long position without taking into account the ROC value. This allows us to be in position all the time and not miss the best opportunities.
MONEY MANAGEMENT :
The fixed ratio method was used to manage our gains and losses. For each gain of an amount equal to the value of the fixed ratio, we increase the order size by a value defined by the user in the "Increasing order amount" parameter. Similarly, each time we lose an amount equal to the value of the fixed ratio, we decrease the order size by the same user-defined value. This strategy increases both performance and drawdown.
NOTE :
Please note that the strategy is backtested from 2017-01-01. As the timeframe is 1D, this strategy is a medium/long-term strategy. That's why only 34 trades were closed. Be careful, as the test sample is small and performance may not necessarily reflect what may happen in the future.
Enjoy the strategy and don't forget to take the trade :)

Cracking Cryptocurrency - Bottom FeederThe Bottom Feeder
The Bottom Feeder is designed to algorithmically detect significantly oversold conditions in price that represent profitable buying opportunities. Combining this with it’s unique Stop and Target System, the Bottom Feeder is designed to return consistent return with minimal draw down. Whether used as a Market Bottom Detector or as a system for executing safe, profitable mean reversion trades, the Bottom Feeder is a powerful tool in any trader’s arsenal.
Bottom Feeder was designed to be used on BTCUSD , however it is also effective on other USD/USDT pairs. One will have to check the individual pair they wish to trade with the Strategy Tester to simulate performance.
Options
Let’s go through the input options one by one, so that you are able to comfortably navigate all that this indicator has to offer. The link below will display a picture of the layout of the settings for your convenience.
For the sake of simplicity, let’s note now that all settings marked **Conservative Mode** will not work in Aggressive Mode.
Mode: Determines how aggressively Bottom Feeder generates a buy signal. In Conservative Mode, trades can only be opened once per candle and the stop and target will update as new signals appear. In Aggressive Mode, a separate trade is opened each time Bottom Feeder signals, which may be multiple times within one Daily candle.
Plot Target and Stop Loss: Toggles on/off the visualized take profit and stop losses on the chart.
**Conservative Mode** TP Multiplier: This is an input box, it requires a float value. That is, it can accept either a whole number integer or a number with a decimal. This number will determine your Take Profit target. It will take whatever number is entered into this box and multiply the Average True Range against it to determine your Take Profit.
**Conservative Mode** SL Multiplier: See above - this will modify your Stop Loss Value.
**Conservative Mode** Average or Median True Range: This is a drop-down option, the two options are Average True Range or Median True Range. If Average True Range is selected, then this indicator will use the Average True Range calculation, that is, the average of a historical set of True Range values to determine the Average True Range value for Target and Stop Loss calculation. If Median True Range is selected, it will not take an average and will instead take the Median value of your historical look back period.
**Conservative Mode** True Range Length: This is an input that requires an integer. This will represent your historical look back period for Average/Median True Range calculation.
**Conservative Mode** True Range Smoothing: This is a drop-down with the following options: Exponential Moving Average ( EMA ), Simple Moving Average ( SMA ), Weighted Moving Average ( WMA ), Relative Moving Average (RMA). This will determine the smoothing type for calculating the Average True Range if it is selected. Note: if Median True Range is selected above, this option will not have any effect as there is no smoothing for a Median value.
**Conservative Mode** Custom True Range Value?: This is a true/false option that is false by default. If enabled, it will override the Average/Median True Range calculation in favor of a users custom True Range value to be input below.
**Conservative Mode** Custom True Range Value: This is an input box that requires a float value. If Custom True Range is enabled this is where a user will input their desired custom True Range value for Target and Stop Loss calculation.
Stop and Target Description
Because Bottom Feeder is designed only to scalp the various market bottoms that can appear over time in the market and not to identify trends or to trade ranges, it’s imperative that the indicator notify us not just to when to enter our trades, but when to exit! In the service of that, CC Bottom Feeder has a built in Stop and Target system that tracks and displays the stop loss and take profit levels of each individual open trade, whether in Aggressive or Conservative Mode.
Conservative Mode Targeting: In Conservative Mode, Bottom Feeder signals are aggregated into a compound trade. The signal will appear as a green label pointing up below a candle, and will appear upon a candle close. If Bottom Feeder then generates another signal the stop loss and target price will be updated. The process will continue until the aggregated trade completes in either direction. On a trade with multiple signals, a larger position is slowly entered into upon each buy signal.
Aggressive Mode Targeting: In Aggressive Mode, Bottom Feeder signals are individually displayed as they are generated, regardless of how many signals are generated on any single candle. If Bottom Feeder continues to signal, each individual open trade will have their own stop loss and target that will be displayed on the chart until the individual trade completes in either direction. As opposed to a large compound position, aggressive mode represents a higher number of independent signals with their own stop and target levels.
Stop losses and targets are designed to be hard, not soft. That is, they are intended to be stop market orders, not mental stop losses. If price wicks through the target or stop, it will activate.
