Multi-Timeframe Wolfe Wave StrategyThis invite-only strategy implements an advanced multi-timeframe Wolfe Wave pattern recognition system specifically designed for institutional-grade algorithmic trading environments.
**Core Mathematical Framework:**
The strategy employs sophisticated mathematical calculations across 10 distinct timeframes (377, 233, 144, 89, 55, 34, 21, 13, 8, 5 periods), utilizing Elliott Wave ratio theory combined with proprietary algorithmic enhancements. Unlike standard Wolfe Wave implementations that rely on visual pattern recognition, this system uses quantitative analysis to identify precise entry and exit points.
**Technical Implementation:**
• **Pattern Detection Algorithm:** Calculates price relationships using configurable ratio sets including Fibonacci sequences, Elliott Wave ratios, Golden Ratio, Harmonic Patterns, Pi-based calculations, and custom mathematical progressions
• **Multi-Timeframe Confluence:** Simultaneously analyzes patterns across all timeframes to ensure signal reliability and reduce false positives
• **Dynamic Target Calculation:** Employs advanced mathematical modeling to project optimal profit targets based on historical price behavior and pattern completion theory
• **Risk Management Engine:** Implements position-based stop losses calculated as percentages of target profits, with liquidation price monitoring for leveraged positions
**Originality and Innovation:**
This implementation differs significantly from traditional Wolfe Wave indicators through several key innovations:
1. **Algorithmic Pattern Validation:** Uses mathematical confirmation across multiple timeframes rather than subjective visual analysis
2. **Adaptive Ratio Selection:** Offers 24 different ratio calculation methods, allowing optimization for various market conditions
3. **Institutional Integration:** Features comprehensive webhook messaging for automated execution via external trading systems
4. **Advanced Position Management:** Includes sophisticated position sizing controls with maximum concurrent position limits
**Strategy Logic:**
For bullish conditions, the algorithm identifies when price action meets specific mathematical criteria:
- Point validation through ratio analysis between swing highs/lows
- Confluence confirmation across multiple timeframes
- Minimum profit threshold filtering to ensure trade quality
- Dynamic stop-loss positioning based on pattern geometry
The mathematical approach uses proprietary calculations that extend beyond traditional Fibonacci levels, incorporating elements from chaos theory, fractal geometry, and advanced statistical analysis.
**Risk Management Features:**
• Configurable stop-loss percentages relative to profit targets
• Maximum position limits to control portfolio exposure
• Liquidation price monitoring for margin trading
• Time-based filtering options for market session control
• Minimum profit threshold settings to filter low-quality signals
**Intended Markets and Conditions:**
Optimized for cryptocurrency markets with high volatility and sufficient liquidity. Works effectively in trending and ranging market conditions due to its multi-timeframe approach. Best suited for assets with clear swing structure and adequate price movement.
**Performance Characteristics:**
The strategy is designed for active trading with frequent position entries across multiple timeframes. Position holding periods vary from short-term scalping to medium-term swing trading depending on pattern completion timeframes.
**Technical Requirements:**
Requires understanding of advanced pattern recognition theory, risk management principles, and algorithmic trading concepts. Users should be familiar with Wolfe Wave methodology and Elliott Wave theory fundamentals.
在腳本中搜尋"stop loss"

Chaikin Momentum Scalper🎯 Overview
The Chaikin Momentum Scalper is a powerful trading strategy designed to identify momentum shifts in the market and ride the trend for maximum profits. This strategy is ideal for trading the USD/JPY currency pair on a 15-minute chart, making it perfect for high-frequency trading (HFT). Whether you’re starting with a small account of $1,000 or managing a larger portfolio, this strategy can scale to suit your needs.
________________________________________
🔑 How the Strategy Works
Here’s how the Chaikin Momentum Scalper identifies trade opportunities:
1️⃣ Momentum Detection
The core of this strategy is the Chaikin Oscillator, a tool that measures the flow of money into or out of a market. It helps us understand whether buyers (bulls) or sellers (bears) are in control.
• When the indicator crosses above zero, it signals that buying momentum is picking up – a buying opportunity.
• When the indicator crosses below zero, it signals that selling momentum is increasing – a selling opportunity.
2️⃣ Trend Confirmation
We don’t just jump into trades based on momentum alone. We also use a 200-period simple moving average (SMA) to confirm the overall trend.
• If the price is above the SMA, it confirms an uptrend, so we look for buy trades.
• If the price is below the SMA, it confirms a downtrend, so we look for sell trades.
This way, we align our trades with the broader market direction for higher success rates.
3️⃣ Volatility & Risk Management
We use a tool called the Average True Range (ATR) to measure market volatility. This helps us:
• Set a stop-loss (where we’ll exit the trade if the market moves against us) at a safe distance from our entry point.
• Set a take-profit (where we’ll lock in profits) at a target that’s larger than the stop-loss, ensuring a good reward-to-risk ratio.
This approach adapts to the market’s behavior, tightening stops in calmer conditions and widening them when volatility increases.
________________________________________
📈 Why This Strategy Works
✅ It combines momentum and trend-following principles, increasing the chances of trading in the right direction.
✅ It dynamically adjusts risk levels based on market volatility, keeping losses small and profits big.
✅ It’s scalable – perfect for both small accounts (like $1,000) and larger, corporate-sized portfolios.
✅ It has been deep-backtested on USD/JPY 15-minute charts, proving its consistency across different market conditions.
________________________________________
📝 Important Notes
📌 This strategy is best used for USD/JPY on a 15-minute chart, making it great for high-frequency trading while you continue to build and refine your trading system.
📌 It’s designed to work on both small ($1,000+) and large accounts, so it can grow with you as your capital increases.
📌 While it has passed deep backtesting on this pair and timeframe, remember that no strategy is perfect. It’s crucial to test it yourself, start with a demo account, and apply proper risk management before trading real money.
🌟 Final Thoughts
The Chaikin Momentum Scalper is a solid, adaptable trading approach combining momentum, trend direction, and volatility awareness. If you’re looking for a strategy to kick-start your trading journey—or to add to your existing system—it offers a strong foundation.

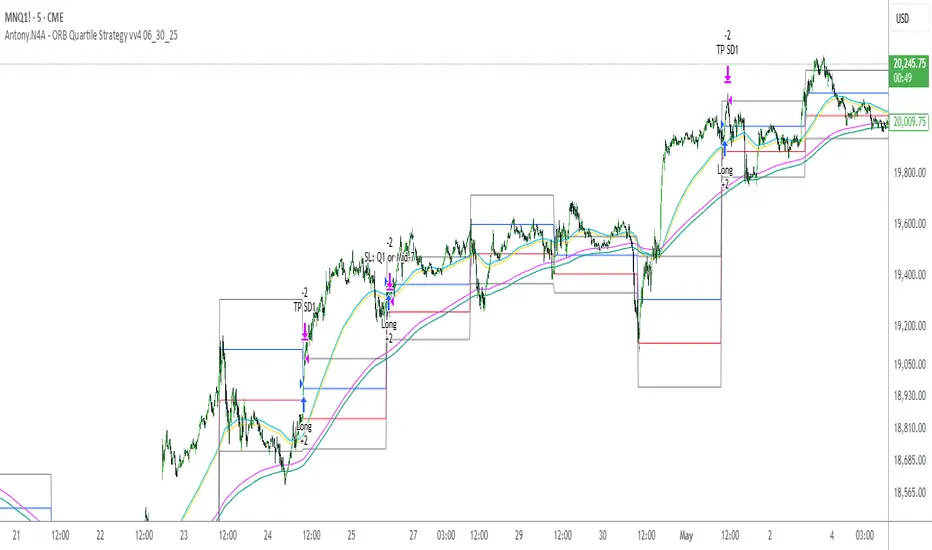
Antony.N4A - ORB Quartile Strategy vv4 06_30_25📌 Antony.N4A - ORB Quartile Strategy vv4
This script implements a fully automated Opening Range Breakout (ORB) trading strategy, engineered for precision execution within predefined market windows. It is compatible with both New York and London sessions, and integrates advanced internal logic including trend validation, breakout confirmation, position scaling, and risk-defined stop/target management.
🧠 Core Logic Overview:
ORB Range Calculation: Based on configurable session time (default: 09:30–09:45 EST)
Entry Window: Trade initiations are permitted only within a defined intraday range
Trend Validation Filters: Proprietary EMA-based mechanisms to confirm directional bias
Contract Sizing Engine: Dynamically adjusts trade size to respect a per-trade risk ceiling
Risk Parameters: Designed to cap maximum loss per trade at approximately $300–400
🎯 Trade Management Rules:
Entry:
Triggered at the close of a 5-minute candle that confirms a directional breakout of the ORB
Stop Loss:
Enforced via structural breakout invalidation levels (Quartile boundaries and mid-range buffer)
Profit Targeting:
- 75% of position is closed at the first standard deviation (SD1) level
- Remaining 25% is trailed to extended targets, with stop-loss adjusted to breakeven post-partial
No pyramiding, re-entries are limited by cooldown logic and session controls
📊 Backtest Performance (Oct 2024 – Apr 2025):
Total Trades: 36
Win Rate: 64%
Worst Losing Streak: 4 consecutive trades
Worst Month: January 2025 (-1.49R)
Net Performance: +21.5R
Strategy tested on NQ futures with NY session breakout configuration
This strategy is intended for disciplined intraday traders seeking a structured, semi-mechanical approach to volatility expansion. It is best used in high-liquidity markets and news-driven sessions.
Williams R Zone Scalper v1.0[BullByte]Originality & Usefulness
Unlike standard Williams R cross-over scripts, this strategy layers five dynamic filters—moving-average trend, Supertrend, Choppiness Index, Bollinger Band Width, and volume validation —and presents a real-time dashboard with equity, PnL, filter status, and key indicator values. No other public Pine script combines these elements with toggleable filters and a custom dashboard. In backtests (BTC/USD (Binance), 5 min, 24 Mar 2025 → 28 Apr 2025), adding these filters turned a –2.09 % standalone Williams R into a +5.05 % net winner while cutting maximum drawdown in half.
---
What This Script Does
- Monitors Williams R (length 14) for overbought/oversold reversals.
- Applies up to five dynamic filters to confirm trend strength and volatility direction:
- Moving average (SMA/EMA/WMA/HMA)
- Supertrend line
- Choppiness Index (CI)
- Bollinger Band Width (BBW)
- Volume vs. its 50-period MA
- Plots blue arrows for Long entries (R crosses above –80 + all filters green) and red arrows for Short entries (R crosses below –20 + all filters green).
- Optionally sets dynamic ATR-based stop-loss (1.5×ATR) and take-profit (2×ATR).
- Shows a dashboard box with current position, equity, PnL, filter status, and real-time Williams R / MA/volume values.
---
Backtest Summary (BTC/USD(Binance), 5 min, 24 Mar 2025 → 28 Apr 2025)
• Total P&L : +50.70 USD (+5.05 %)
• Max Drawdown : 31.93 USD (3.11 %)
• Total Trades : 198
• Win Rate : 55.05 % (109/89)
• Profit Factor : 1.288
• Commission : 0.01 % per trade
• Slippage : 0 ticks
Even in choppy March–April, this multi-filter approach nets +5 % with a robust risk profile, compared to –2.09 % and higher drawdown for Williams R alone.
---
Williams R Alone vs. Multi-Filter Version
• Total P&L :
– Williams R alone → –20.83 USD (–2.09 %)
– Multi-Filter → +50.70 USD (+5.05 %)
• Max Drawdown :
– Williams R alone → 62.13 USD (6.00 %)
– Multi-Filter → 31.93 USD (3.11 %)
• Total Trades : 543 vs. 198
• Win Rate : 60.22 % vs. 55.05 %
• Profit Factor : 0.943 vs. 1.288
---
Inputs & What They Control
- wrLen (14): Williams R look-back
- maType (EMA): Trend filter type (SMA, EMA, WMA, HMA)
- maLen (20): Moving-average period
- useChop (true): Toggle Choppiness Index filter
- ciLen (12): CI look-back length
- chopThr (38.2): CI threshold (below = trending)
- useVol (true): Toggle volume-above-average filter
- volMaLen (50): Volume MA period
- useBBW (false): Toggle Bollinger Band Width filter
- bbwMaLen (50): BBW MA period
- useST (false): Toggle Supertrend filter
- stAtrLen (10): Supertrend ATR length
- stFactor (3.0): Supertrend multiplier
- useSL (false): Toggle ATR-based SL/TP
- atrLen (14): ATR period for SL/TP
- slMult (1.5): SL = slMult × ATR
- tpMult (2.0): TP = tpMult × ATR
---
How to Read the Chart
- Blue arrow (Long): Williams R crosses above –80 + all enabled filters green
- Red arrow (Short) : Williams R crosses below –20 + all filters green
- Dashboard box:
- Top : position and equity
- Next : cumulative PnL in USD & %
- Middle : green/white dots for each filter (green=passing, white=disabled)
- Bottom : Williams R, MA, and volume current values
---
Usage Tips
- Add the script : Indicators → My Scripts → Williams R Zone Scalper v1.0 → Add to BTC/USD chart on 5 min.
- Defaults : Optimized for BTC/USD.
- Forex majors : Raise `chopThr` to ~42.
- Stocks/high-beta : Enable `useBBW`.
- Enable SL/TP : Toggle `useSL`; stop-loss = 1.5×ATR, take-profit = 2×ATR apply automatically.
---
Common Questions
- * Why not trade every Williams R reversal?*
Raw Williams R whipsaws in sideways markets. Choppiness and volume filters reduce false entries.
- *Can I use on 1 min or 15 min?*
Yes—adjust ATR length or thresholds accordingly. Defaults target 5 min scalping.
- *What if all filters are on?*
Fewer arrows, higher-quality signals. Expect ~10 % boost in average win size.
---
Disclaimer & License
Trading carries risk of loss. Use this script “as is” under the Mozilla Public License 2.0 (mozilla.org). Always backtest, paper-trade, and adjust risk settings to your own profile.
---
Credits & References
- Pine Script v6, using TradingView’s built-in `ta.supertrend()`.
- TradingView House Rules: www.tradingview.com
Goodluck!
BullByte

DI+/- Cross Strategy with ATR SL and 2% TPDI+/- Cross Strategy with ATR Stop Loss and 2% Take Profit
📝 Script Description for Publishing:
This strategy is based on the directional movement of the market using the Average Directional Index (ADX) components — DI+ and DI- — to generate entry signals, with clearly defined risk and reward targets using ATR-based Stop Loss and Fixed Percentage Take Profit.
🔍 How it works:
Buy Signal: When DI+ crosses above 40, signaling strong bullish momentum.
Sell Signal: When DI- crosses above 40, indicating strong bearish momentum.
Stop Loss: Dynamically calculated using ATR × 1.5, to account for market volatility.
Take Profit: Fixed at 2% above/below the entry price, for consistent reward targeting.
🧠 Why it’s useful:
Combines momentum breakout logic with volatility-based risk management.
Works well on trending assets, especially when combined with higher timeframe filters.
Clean BUY and SELL visual labels make it easy to interpret and backtest.
✅ Tips for Use:
Use on assets with clear trends (e.g., major forex pairs, trending stocks, crypto).
Best on 30m – 4H timeframes, but can be customized.
Consider combining with other filters (e.g., EMA trend direction or Bollinger Bands) for even better accuracy.

Dkoderweb repainting issue fix strategyHarmonic Pattern Recognition Trading Strategy
This TradingView strategy called "Dkoderweb repainting issue fix strategy" is designed to identify and trade harmonic price patterns with optimized entry and exit points using Fibonacci levels. The strategy implements various popular harmonic patterns including Bat, Butterfly, Gartley, Crab, Shark, ABCD, and their anti-patterns.
Key Features
Pattern Recognition: Identifies 17+ harmonic price patterns including standard and anti-patterns
Fibonacci-Based Entries and Exits: Uses customizable Fibonacci levels for precision entries, take profits, and stop losses
Alternative Timeframe Analysis: Option to use higher timeframes for pattern identification
Heiken Ashi Support: Optional use of Heiken Ashi candles instead of regular candlesticks
Visual Indicators:
Pattern visualization with ZigZag indicator
Buy/sell signal markers
Color-coded background to highlight active trade zones
Customizable Fibonacci level display
How It Works
The strategy uses a ZigZag-based pattern identification system to detect pivot points
When a valid harmonic pattern forms, the strategy calculates the optimal entry window using the specified Fibonacci level (default 0.382)
Entries trigger when price returns to the entry window after pattern completion
Take profit and stop loss levels are automatically set based on customizable Fibonacci ratios
Visual alerts notify you of entries and exits
The strategy tracks active trades and displays them with background color highlights
Customizable Settings
Trade size
Entry window Fibonacci level (default 0.382)
Take profit Fibonacci level (default 0.618)
Stop loss Fibonacci level (default -0.618)
Alert messages for entries and exits
Display options for specific Fibonacci levels
Alternative timeframe selection
This strategy is designed to fix repainting issues that are common in harmonic pattern strategies, ensuring more reliable signals and backtesting results.

ATM Option Selling StrategyATM Option Selling Strategy – Explained
This strategy is designed for intraday option selling based on the 9/15 EMA crossover, 50/80 MA trend filter, and RSI 50 level. It ensures that all trades are exited before market close (3:24 PM IST).
. Indicators Used:
9 EMA & 15 EMA → For short-term trend identification.
50 MA & 80 MA → To determine the overall trend.
RSI (14) → To confirm momentum (above or below 50 level).
2. Entry Conditions:
🔴 Sell ATM Call (CE) when:
Price is below 50 & 80 MA (Bearish trend).
9 EMA crosses below 15 EMA (Short-term trend turns bearish).
RSI is below 50 (Momentum confirms weakness).
🟢 Sell ATM Put (PE) when:
Price is above 50 & 80 MA (Bullish trend).
9 EMA crosses above 15 EMA (Short-term trend turns bullish).
RSI is above 50 (Momentum confirms strength).
3. Position Sizing & Risk Management:
Sell 375 quantity per trade (Lot size).
50-Point Stop Loss → If option premium moves against us by 50 points, exit.
50-Point Take Profit → If option premium moves in our favor by 50 points, book profit.
Exit all trades at 3:24 PM IST → No overnight positions.
4. Exit Conditions:
✅ Stop Loss or Take Profit Hits → Automatically exits based on a 50-point move.
✅ Time-Based Exit at 3:24 PM → Ensures no open positions at market close.
Why This Works?
✔ Trend Confirmation → 50/80 MA ensures we only sell options in the direction of the market trend.
✔ Momentum Confirmation → RSI prevents entering weak trades.
✔ Controlled Risk → SL and TP protect against large losses.
✔ No Overnight Risk → All trades close before market close.

VWAP StrategyVWAP and volatility filters for structured intraday trades.
How the Strategy Works
1. VWAP Anchored to Session
VWAP is calculated from the start of each trading day.
Standard deviations are used to create bands above/below the VWAP.
2. Entry Triggers: Al Brooks H1/H2 and L1/L2
H1/H2 (Long Entry): Opens below 2nd lower deviation, closes above it.
L1/L2 (Short Entry): Opens above 2nd upper deviation, closes below it.
3. Volatility Filter (ATR)
Skips trades when deviation bands are too tight (< 3 ATRs).
4. Stop Loss
Based on the signal bar’s high/low ± stop buffer.
Longs: signalBarLow - stopBuffer
Shorts: signalBarHigh + stopBuffer
5. Take Profit / Exit Target
Exit logic is customizable per side:
VWAP, Deviation Band, or None
6. Safety Exit
Exits early if X consecutive bars go against the trade.
Longs: X red bars
Shorts: X green bars
Explanation of Strategy Inputs
- Stop Buffer: Distance from signal bar for stop-loss.
- Long/Short Exit Rule: VWAP, Deviation Band, or None
- Long/Short Target Deviation: Standard deviation for target exit.
- Enable Safety Exit: Toggle emergency exit.
- Opposing Bars: Number of opposing candles before safety exit.
- Allow Long/Short Trades: Enable or disable entry side.
- Show VWAP/Entry Bands: Toggle visual aids.
- Highlight Low Vol Zones: Orange shading for low volatility skips.
Tuning Tips
- Stop buffer: Use 1–5 points.
- Target deviation: Start with VWAP. In strong trends use 2nd deviation and turn off the counter-trend entry.
- Safety exit: 3 bars recommended.
- Disable short/long side to focus on one type of reversal.
Backtest Setup Suggestions
- initial_capital = 2000
- default_qty_value = 1 (fixed contracts or percent-of-equity)

Supertrend + MACD CrossoverKey Elements of the Template:
Supertrend Settings:
supertrendFactor: Adjustable to control the sensitivity of the Supertrend.
supertrendATRLength: ATR length used for Supertrend calculation.
MACD Settings:
macdFastLength, macdSlowLength, macdSignalSmoothing: These settings allow you to fine-tune the MACD for better results.
Risk Management:
Stop-Loss: The stop-loss is based on the ATR (Average True Range), a volatility-based indicator.
Take-Profit: The take-profit is based on the risk-reward ratio (set to 3x by default).
Both stop-loss and take-profit are dynamic, based on ATR, which adjusts according to market volatility.
Buy and Sell Signals:
Buy Signal: Supertrend is bullish, and MACD line crosses above the Signal line.
Sell Signal: Supertrend is bearish, and MACD line crosses below the Signal line.
Visual Elements:
The Supertrend line is plotted in green (bullish) and red (bearish).
Buy and Sell signals are shown with green and red triangles on the chart.
Next Steps for Optimization:
Backtesting:
Run backtests on BTC in the 5-minute timeframe and adjust parameters (Supertrend factor, MACD settings, risk-reward ratio) to find the optimal configuration for the 60% win ratio.
Fine-Tuning Parameters:
Adjust supertrendFactor and macdFastLength to find more optimal values based on BTC's market behavior.
Tweak the risk-reward ratio to maximize profitability while maintaining a good win ratio.
Evaluate Market Conditions:
The performance of the strategy can vary based on market volatility. It may be helpful to evaluate performance in different market conditions or pair it with a filter like RSI or volume.
Let me know if you'd like further tweaks or explanations!

RSI Pro+ (Bear market, financial crisis and so on EditionIn markets defined by volatility, fear, and uncertainty – the battlegrounds of bear markets and financial crises – you need tools forged in resilience. Introducing RSI Pro+, a strategy built upon a legendary indicator born in 1978, yet engineered with modern visual clarity to remain devastatingly effective even in the chaotic financial landscapes of 3078.
This isn't about complex algorithms predicting the unpredictable. It's about harnessing the raw, time-tested power of the Relative Strength Index (RSI) to identify potential exhaustion points and capitalize on oversold conditions. RSI Pro+ cuts through the noise, providing clear, actionable signals when markets might be poised for a relief bounce or reversal.
Core Technology (The 1978 Engine):
RSI Crossover Entry: The strategy initiates a LONG position when the RSI (default period 11) crosses above a user-defined low threshold (default 30). This classic technique aims to enter when selling pressure may be waning, offering potential entry points during sharp downturns or periods of consolidation after a fall.
Modern Enhancements (The 3078 Cockpit):
RSI Pro+ isn't just about the signal; it's about providing a professional-grade visual experience directly on your chart:
Entry Bar Highlight: A subtle background flash on the chart signals the exact bar where the RSI crossover condition is met, alerting you to potential entry opportunities.
Trade Bar Coloring: Once a trade is active, the price bars are subtly colored, giving you immediate visual confirmation that the strategy is live in the market.
Entry Price Line: A clear, persistent line marks your exact average entry price for the duration of the trade, serving as a crucial visual anchor.
Take Profit Line: Your calculated Take Profit target is plotted as a distinct line, keeping your objective clearly in sight.
Custom Entry Marker: A precise shape (▲) appears below the bar where the trade entry was actually executed, pinpointing the start of the position.
On-Chart Info Table (HUD): A clean, customizable Heads-Up Display appears when a trade is active, showing vital information at a glance:
Entry Price: Your position's average cost basis.
TP Target: The calculated price level for your Take Profit exit.
Current PnL%: Real-time Profit/Loss percentage for the open trade.
Full Customization: Nearly every aspect is configurable via the settings menu:
RSI Period & Crossover Level
Take Profit Percentage
Toggle ALL visual enhancements on/off individually
Position the Info Table wherever you prefer on the chart.
How to Use RSI Pro+:
Add to Chart: Apply the "RSI Pro+ (Bear market...)" strategy to your TradingView chart. Ensure any previous versions are removed.
Access Settings: Click the cogwheel icon (⚙️) next to the strategy name on your chart.
Configure Inputs (Crucial Step):
RSI Crossover Level: This is key. The default (30) targets standard oversold conditions. In severe downturns, you might experiment with lower levels (e.g., 25, 20) or higher ones (e.g., 40) depending on the asset and timeframe. Observe where RSI(11) typically bottoms out on your chart.
Take Profit Percentage (%): Define your desired profit target per trade (e.g., enter 0.5 for 0.5%, 1.0 for 1%). The default is a very small 0.11%.
RSI Period: While default is 11, you can adjust this (e.g., the standard 14).
Visual Enhancements: Enable or disable the visual features (background highlights, bar coloring, lines, markers, table) according to your preference using the checkboxes. Adjust table position.
Observe & Backtest: Watch how the strategy behaves on your chosen asset and timeframe. Use TradingView's Strategy Tester to analyze historical performance based on your settings. No strategy works perfectly everywhere; testing is essential.
Important Considerations:
Risk Management: This specific script version focuses on a Take Profit exit. It does not include an explicit Stop Loss. You MUST manage risk through appropriate position sizing, potentially adding a Stop Loss manually, or by modifying the script.
Oversold ≠ Reversal: An RSI crossover is an indicator of potential exhaustion, not a guarantee of a price reversal.
Fixed TP: A fixed percentage TP ensures small wins but may exit before larger potential moves.
Backtesting Limitations: Past performance does not guarantee future results.
RSI Pro+ strips away complexity to focus on a robust, time-honored principle, enhanced with modern visuals for the discerning trader navigating today's (and tomorrow's) challenging markets

Trend Hunter Scalping [Daddin Algo]Trend Hunter Scalping Strategy Description
This strategy is a comprehensive scalping system designed to capture high-frequency trading opportunities within short timeframes. It combines multiple technical indicators to assess trend direction, momentum, volatility, and volume dynamics. Importantly, all parameters are user-adjustable, allowing the strategy to be optimized for various market conditions and individual preferences.
Technical Indicators and Settings
EMA (Exponential Moving Average):
The EMA is calculated based on a user-defined period. Rather than being fixed (e.g., a 200-period EMA), the period is adjustable to suit different market conditions. The position of the price relative to the EMA helps confirm the overall trend.
RSI & RSIOver:
The Relative Strength Index (RSI) measures momentum and the speed of price changes. Entry signals are generated when the RSI crosses its moving average. Additionally, overbought and oversold thresholds (set by the user) add an extra layer of confirmation for the signals.
ADX:
The Average Directional Index (ADX) assesses the strength of the current trend. When the ADX is above a user-specified threshold, the signals are considered more reliable. This helps in filtering out signals during weak trending periods.
Bollinger Bands:
Bollinger Bands gauge market volatility. The settings—including the length and the multiplier—are adjustable, providing flexibility to accommodate tightening or expanding volatility conditions.
Parabolic SAR:
This indicator identifies dynamic support and resistance levels, confirming the trend direction and helping pinpoint potential entry and exit points.
Pivot Levels (Fibonacci):
Calculated from the previous period's high, low, and close, pivot points and Fibonacci levels indicate potential reversal points and serve as support and resistance levels. These levels provide context for setting trailing stops and managing risk.
Volume Filter:
A volume condition ensures that trading signals are only considered valid when the current volume exceeds a multiple of its short-term moving average. This filter is adjustable, helping to confirm the strength of the market move.
Daddin Line:
Derived from a short-term moving average of the closing prices with a user-defined offset, the Daddin Line acts as an additional confirmation tool. Its parameters can be customized to better align with specific trading environments.
Trading Logic and Management
Signal Direction and Entry:
The strategy can generate both long (buy) and short (sell) signals, or be limited to one direction based on user preference. Entry orders are executed when all the selected indicator conditions are met. Additionally, maximum consecutive trade limits are implemented to help control risk.
Exit & Take Profit:
Trades are exited automatically when a user-defined profit percentage is reached. This take-profit percentage is flexible, enabling adjustments to match different market conditions or trading goals.
Trailing Stop (Dynamic Stop Loss):
A trailing stop mechanism is implemented using Fibonacci pivot levels. Once a position is open, the stop loss is dynamically updated as the price moves favorably. This ensures that profits are protected while minimizing losses in case of a sudden reversal.
Additional Features and Backtesting
Time Filtering (Backtesting):
The strategy includes a date range filter for backtesting. Users can define the start and end dates to evaluate the strategy’s performance during specific market periods, making it easier to assess its historical effectiveness.
Customizable Parameters:
Every indicator and risk management setting is fully customizable. This adaptability allows traders to tailor the strategy to different assets, timeframes, and market environments, ensuring optimal performance across diverse trading scenarios.
Conclusion
The Trend Hunter Scalping strategy effectively integrates multiple technical indicators to validate trends and manage risks efficiently. Its highly flexible, user-adjustable parameters make it adaptable to varying market conditions, providing traders with a robust framework for capturing quick trading opportunities.This strategy is designed to optimize both entry and exit points while offering comprehensive risk management controls.

TheRookAlgoPROThe Rook Algo PRO is an automated strategy that uses ICT dealing ranges to get in sync with potential market trends. It detects the market sentiment and then place a sell or a buy trade in premium/discount or in breakouts with the desired risk management.
Why is useful?
This algorithm is designed to help traders to quickly identify the current state of the market and easily back test their strategy over longs periods of time and different markets its ideal for traders that want to profit on potential expansions and want to avoid consolidations this algo will tell you when the expansion is likely to begin and when is just consolidating and failing moves to avoid trading.
How it works and how it does it?
The Algo detects the current and previous market structure to identify current ranges and ICT dealing ranges that are created when the market takes buyside liquidity and sellside liquidity, it will tell if the market is in a consolidation, expansion, retracement or in a potential turtle soup environment, it will tell if the range is small or big compared to the previous one. Is important to use it in a trending markets because when is ranging the signals lose effectiveness.
This algo is similar to the previously released the Rook algo with the additional features that is an automated strategy that can take trades using filters with the desired risk reward and different entry types and trade management options.
Also this version plots FVGS(fair value gaps) during expansions, and detects consolidations with a box and the mid point or average. Some bars colors are available to help in the identification of the market state. It has the option to show colors of the dealing ranges first detected state.
How to use it?
Start selecting the desired type of entry you want to trade, you can choose to take Discount longs, premium sells, breakouts longs and sells, this first four options are the selected by default. You can enable riskier options like trades without confirmation in premium and discount or turtle soup of the current or previous dealing range. This last ones are ideal for traders looking to enter on a counter trend but has to be used with caution with a higher timeframe reference.
In the picture below we can see a premium sell signal configuration followed by a discount buy signal It display the stop break even level and take profit.
This next image show how the riskier entries work. Because we are not waiting for a confirmation and entering on a counter trend is normal to experience some stop losses because the stop is very tight. Should only be used with a clear Higher timeframe reference as support of the trade idea. This algo has the option to enable standard deviations from the normal stop point to prevent liquidity sweeps. The purple or blue arrows indicate when we are in a potential turtle soup environment.
The algo have a feature called auto-trade enable by default that allow for a reversal of the current trade in case it meets the criteria. And also can take all possible buys or all possible sells that are riskier entries if you just want to see the market sentiment. This is useful when the market is very volatile but is moving not just ranging.
Then we configure the desired trade filters. We have the options to trade only when dealing ranges are in sync for a more secure trend, or we can disable it to take riskier trades like turtle soup trades. We can chose the minimum risk reward to take the trade and the target extension from the current range and the exit type can be when we hit the level or in a retracement that is the default setting. These setting are the most important that determine profitability of the strategy, they has be adjusted depending on the timeframe and market we are trading.
The stop and target levels can also be configured with standard deviations from the current range that way can be adapted to the market volatility.
The Algo allow the user to chose if it want to place break even, or trail the stop. In the picture below we can see it in action. This can work when the trend is very strong if not can lead to multiple reentries or loses.
The last option we can configure is the time where the trades are going to be taken, if we trade usually in the morning then we can just add the morning time by default is set to the morning 730am to 1330pm if you want to trade other times you should change this. Or if we want to enter on the ICT macro times can also be added in a filter. Trade taken with the macro times only enable is visible in the picture below.
Strategy Results
The results are obtained using 2000usd in the MNQ! In the 15minutes timeframe 1 contract per trade. Commission are set to 2USD, slippage to 1tick, the backtesting range is from May 2 2024 to March 2025 for a total of 119 trades, this Strategy default settings are designed to take trades on the daily expansions, trail stop and Break even is activated the exit on profit is on a retracement, and for loses when the stop is hit. The auto-trade option is enable to allow to detect quickly market changes. The strategy give realistic results, makes around 200% of the account in around a year. 1.4 profit factor with around 37% profitable trades. These results can be further improve and adapted to the specific style of trading using the filters.
Remember entries constitute only a small component of a complete winning strategy. Other factors like risk management, position-sizing, trading frequency, trading fees, and many others must also be properly managed to achieve profitability. Past performance doesn’t guarantee future results.
Summary of features
-Easily Identify the current dealing range and market state to avoid consolidations
-Recognize expansions with FVGs and consolidation with shaded boxes
-Recognize turtle soups scenarios to avoid fake out breakout
-Configurable automated trades in premium/discount or breakouts
-Auto-trade option that allow for reversal of the current trade when is no longer valid
-Time filter to allow only entries around the times you trade or on the macro times.
-Risk Reward filter to take the automated trades with visible stop and take profit levels
-Customizable trade management take profit, stop, breakeven level with standard deviations
-Trail stop option to secure profit when price move in your favor
-Option to exit on a close, retracement or reversal after hitting the take profit level
-Option to exit on a close or reversal after hitting stop loss
-Dashboard with instant statistics about the strategy current settings and market sentiment

Supertrend with 1% Target and 1% StoplossSupertrend Calculation: The Supertrend indicator is calculated using the Average True Range (ATR) and a factor. The factor and ATR length can be adjusted in the inputs.
Long and Short Conditions: The strategy enters a long position when the price crosses above the Supertrend line and a short position when the price crosses below it.
Target and Stop Loss: The strategy places a 1% target and a 1% stop loss for both long and short positions.
Visuals: The stop loss and take profit levels are plotted on the chart for better visibility.
Enhanced Doji Candle StrategyYour trading strategy is a Doji Candlestick Reversal Strategy designed to identify potential market reversals using Doji candlestick patterns. These candles indicate indecision in the market, and when detected, your strategy uses a Simple Moving Average (SMA) with a short period of 20 to confirm the overall market trend. If the price is above the SMA, the trend is considered bullish; if it's below, the trend is bearish.
Once a Doji is detected, the strategy waits for one or two consecutive confirmation candles that align with the market trend. For a bullish confirmation, the candles must close higher than their opening price without significant bottom wicks. Conversely, for a bearish confirmation, the candles must close lower without noticeable top wicks. When these conditions are met, a trade is entered at the market price.
The risk management aspect of your strategy is clearly defined. A stop loss is automatically placed at the nearest recent swing high or low, with a tighter distance of 5 pips to allow for more trading opportunities. A take-profit level is set using a 2:1 reward-to-risk ratio, meaning the potential reward is twice the size of the risk on each trade.
Additionally, the strategy incorporates an early exit mechanism. If a reversal Doji forms in the opposite direction of your trade, the position is closed immediately to minimize losses. This strategy has been optimized to increase trade frequency by loosening the strictness of Doji detection and confirmation conditions while still maintaining sound risk management principles.
The strategy is coded in Pine Script for use on TradingView and uses built-in indicators like the SMA for trend detection. You also have flexible parameters to adjust risk levels, take-profit targets, and stop-loss placements, allowing you to tailor the strategy to different market conditions.
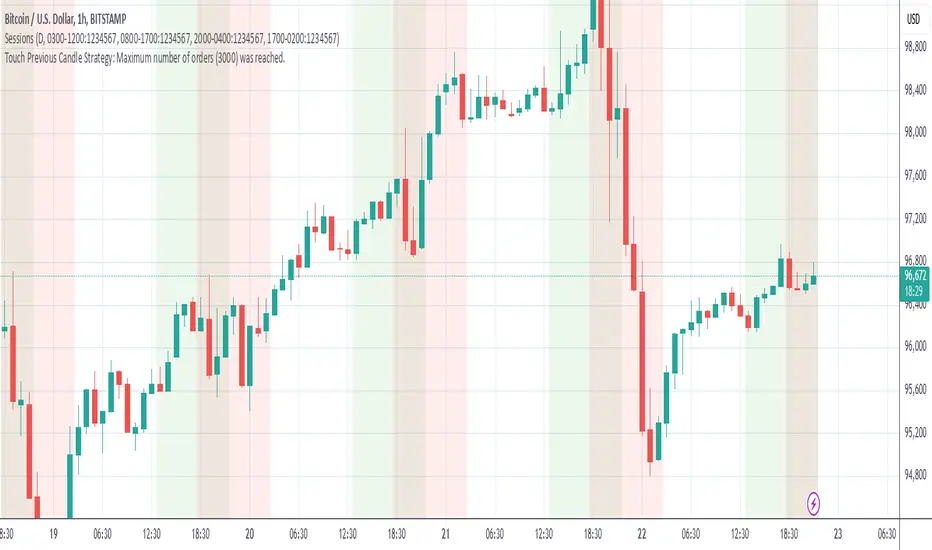
Grim SlashOverview:
The Touch Previous Candle Strategy is a simple yet effective trading approach designed for the 1-hour chart. It focuses on price action by placing trades when the current candle interacts with key levels from the previous candle. The strategy is fully automated and includes risk management with take profit and stop loss levels.
Entry Conditions:
Buy Signal: A buy order is triggered when the low of the current candle touches or drops below the previous candle's closing price.
Sell Signal: A position is closed when the high of the current candle reaches or exceeds the previous candle's highest price.
Risk Management:
Take Profit: The trade is exited automatically when the price increases by 15% from the entry point.
Stop Loss: A stop loss is set at 5% below the entry price to minimize risk.
Best Use Cases:
Works well in volatile markets where price frequently tests previous levels.
Suitable for traders who prefer price-action-based strategies over indicators.
Can be optimized for different assets or timeframes based on market behavior.
MACD Volume Strategy for XAUUSD (15m) [PineIndicators]The MACD Volume Strategy is a momentum-based trading system designed for XAUUSD on the 15-minute timeframe. It integrates two key market indicators: the Moving Average Convergence Divergence (MACD) and a volume-based oscillator to identify strong trend shifts and confirm trade opportunities. This strategy uses dynamic position sizing, incorporates leverage customization, and applies structured entry and exit conditions to improve risk management.
⚙️ Core Strategy Components
1️⃣ Volume-Based Momentum Calculation
The strategy includes a custom volume oscillator to filter trade signals based on market activity. The oscillator is derived from the difference between short-term and long-term volume trends using Exponential Moving Averages (EMAs)
Short EMA (default = 5) represents recent volume activity.
Long EMA (default = 8) captures broader volume trends.
Positive values indicate rising volume, supporting momentum-based trades.
Negative values suggest weak market activity, reducing signal reliability.
By requiring positive oscillator values, the strategy ensures momentum confirmation before entering trades.
2️⃣ MACD Trend Confirmation
The strategy uses the MACD indicator as a trend filter. The MACD is calculated as:
Fast EMA (16-period) detects short-term price trends.
Slow EMA (26-period) smooths out price fluctuations to define the overall trend.
Signal Line (9-period EMA) helps identify crossovers, signaling potential trend shifts.
Histogram (MACD – Signal) visualizes trend strength.
The system generates trade signals based on MACD crossovers around the zero line, confirming bullish or bearish trend shifts.
📌 Trade Logic & Conditions
🔹 Long Entry Conditions
A buy signal is triggered when all the following conditions are met:
✅ MACD crosses above 0, signaling bullish momentum.
✅ Volume oscillator is positive, confirming increased trading activity.
✅ Current volume is at least 50% of the previous candle’s volume, ensuring market participation.
🔻 Short Entry Conditions
A sell signal is generated when:
✅ MACD crosses below 0, indicating bearish momentum.
✅ Volume oscillator is positive, ensuring market activity is sufficient.
✅ Current volume is less than 50% of the previous candle’s volume, showing decreasing participation.
This multi-factor approach filters out weak or false signals, ensuring that trades align with both momentum and volume dynamics.
📏 Position Sizing & Leverage
Dynamic Position Calculation:
Qty = strategy.equity × leverage / close price
Leverage: Customizable (default = 1x), allowing traders to adjust risk exposure.
Adaptive Sizing: The strategy scales position sizes based on account equity and market price.
Slippage & Commission: Built-in slippage (2 points) and commission (0.01%) settings provide realistic backtesting results.
This ensures efficient capital allocation, preventing overexposure in volatile conditions.
🎯 Trade Management & Exits
Take Profit & Stop Loss Mechanism
Each position includes predefined profit and loss targets:
Take Profit: +10% of risk amount.
Stop Loss: Fixed at 10,100 points.
The risk-reward ratio remains balanced, aiming for controlled drawdowns while maximizing trade potential.
Visual Trade Tracking
To improve trade analysis, the strategy includes:
📌 Trade Markers:
"Buy" label when a long position opens.
"Close" label when a position exits.
📌 Trade History Boxes:
Green for profitable trades.
Red for losing trades.
📌 Horizontal Trade Lines:
Shows entry and exit prices.
Helps identify trend movements over multiple trades.
This structured visualization allows traders to analyze past performance directly on the chart.
⚡ How to Use This Strategy
1️⃣ Apply the script to a XAUUSD (Gold) 15m chart in TradingView.
2️⃣ Adjust leverage settings as needed.
3️⃣ Enable backtesting to assess past performance.
4️⃣ Monitor volume and MACD conditions to understand trade triggers.
5️⃣ Use the visual trade markers to review historical performance.
The MACD Volume Strategy is designed for short-term trading, aiming to capture momentum-driven opportunities while filtering out weak signals using volume confirmation.

Futures Engulfing Candle Size Strategy (Ticks, TP/SL)The Futures Candle Size Strategy is designed to identify and trade significant price movements in the futures market based on candle size. It is optimized for futures instruments like ES, NQ, or CL, where precise tick-level calculations are essential. The strategy includes a customizable take profit and stop loss in ticks and operates only within a specified time window (e.g., 7:00 AM to 9:15 AM CST).
Key Features:
Candle Size Threshold: Trades are triggered when the candle's high-to-low range exceeds the defined threshold in ticks.
Time Filter: Limits trades to the most active market hours, specifically between 7:00 AM and 9:15 AM CST.
Take Profit and Stop Loss: Customizable exit levels in ticks to manage risk and lock in profits.
Long and Short Trades: Automatically places buy or sell orders based on the candle's direction (bullish or bearish).
Alerts: Sends alerts whenever a trade is triggered, helping you stay informed in real-time.
How It Works:
The strategy calculates the size of each candle in ticks and compares it to the user-defined threshold.
If the candle size meets or exceeds the threshold within the specified time range, it triggers a long or short trade.
The trade automatically exits when the price hits the take profit or stop loss levels.

Enhanced Gold Scalping Strategy (Backtest with Time Filter)Enhanced Gold Scalping Strategy (Backtest with Time Filter)
This script is a scalping strategy designed specifically for trading gold on lower timeframes, incorporating popular technical indicators and a session filter for optimal performance. The strategy aims to achieve consistency by combining trend-following and volatility-based conditions.
Key Features:
Indicators Used:
Exponential Moving Average (EMA): Filters trades based on the trend direction using a 50-period EMA.
Relative Strength Index (RSI): Ensures trades are taken in favorable momentum conditions (above 30 for longs and below 70 for shorts).
MACD Crossover: Identifies potential trade entries based on MACD line crossing above/below the signal line.
Average True Range (ATR): Used to dynamically calculate Stop Loss and Take Profit levels and ensure trades occur in high-volatility conditions.
Risk-Reward Optimization:
The strategy uses a customizable Risk-Reward Ratio (default is 2:1) for setting Stop Loss (SL) and Take Profit (TP) levels, ensuring that winning trades outweigh losses.
Volatility Filter:
Trades are only executed when the current ATR exceeds the 14-period ATR moving average by a defined threshold, filtering out low-volatility periods.
Session Filter:
The strategy only trades during active market hours (8:00 AM to 8:00 PM Amsterdam Time) on weekdays. This ensures trades align with periods of high liquidity and market activity.
Dynamic Entry and Exit Levels:
SL and TP levels are plotted dynamically on the chart to provide a clear visual of potential risk and reward for each trade.
Buy and Sell Signals:
Visual markers (green triangles for buy, red triangles for sell) on the chart to highlight entry points for better trade visibility.
How It Works:
Long Conditions:
MACD crossover (MACD line above the signal line).
RSI above 30.
Price is above the 50-period EMA.
ATR-based volatility condition is met.
Trade must occur within the defined session hours.
Short Conditions:
MACD crossunder (MACD line below the signal line).
RSI below 70.
Price is below the 50-period EMA.
ATR-based volatility condition is met.
Trade must occur within the defined session hours.
The strategy calculates dynamic SL and TP levels based on the ATR, ensuring flexibility to market conditions.
Customization Options:
EMA length, RSI length, and MACD parameters.
Risk-Reward Ratio for SL/TP calculations.
Volatility threshold for filtering trades.
Session start and end times for active trading hours.
Recommended Use:
Best suited for scalping gold on lower timeframes (15-min charts).
Disclaimer:
This strategy is intended for educational and backtesting purposes. Past performance is not indicative of future results. Use appropriate risk management and test thoroughly before applying to live trading.

Swing High/Low Pivots Strategy [LV]The Swing High/Low Pivots Strategy was developed as a counter-momentum trading tool.
The strategy is suitable for any market and the default values used in the input settings menu are set for Bitcoin (best on 15min). These values, expressed in minimum ticks (or pips if symbol is Forex) make this tool perfectly adaptable to every symbol and/or timeframe.
Check tooltips in the settings menu for more details about every user input.
STRTEGY ENTRY & EXIT MECHANISMS:
Trades Entry based on the detection of swing highs and lows for short and long entries respectively, validated by:
- Limit orders placed after each new pivot level confirmation
- Moving averages trend filter (if enabled)
- No active trade currently open
Trades Exit when the price reaches take-profit or stop-loss level as defined in the settings menu. A double entry/second take-profit level can be enabled for partial exits, with dynamic stop-loss adjustment for the remaining position.
Enhanced Trade Precision:
By limiting entries to confirmed swing high (HH, LH) or swing low (HL, LL) pivot points, the strategy ensures that trades occur at levels of significant price reversals. This precision reduces the likelihood of entering trades in the midst of a trend or during uncertain price action.
Risk Management Optimization:
The strategy incorporates clearly defined stop-loss (SL) and take-profit (TP) levels derived from the pivot points. This structured approach minimizes potential losses while locking in profits, which is critical for consistent performance in volatile markets.
Trend Filtering for Better Entry:
The use of a configurable moving average filter adds a layer of trend validation. This prevents entering trades against the dominant market trend, increasing the probability of success for each trade.
Avoidance of Noise:
The lookback period (length parameter) confirms pivots only after a set number of bars, effectively filtering out market noise and ensuring that entries are based on reliable, well-defined price movements.
Adaptability Across Markets:
The strategy is versatile and can be applied across different markets (Forex, stocks, crypto) due to its dynamic use of ticks and pips converters. It adapts seamlessly to varying price scales and asset types.
Dual Quantity Entries:
The original and optionnal double-entry mechanism allows traders to capture both short-term and extended profits by scaling out of positions. This adaptive approach caters to varying risk appetites and market conditions.
Clear Visualization:
The plotted pivot points, entry limits, SL, and TP levels provide visual clarity, making it easy for traders to track the strategy's behavior and make informed decisions.
Automated Execution with Alerts:
Integrated alerts for both entries and exits ensure timely actions without the need for constant market monitoring, enhancing efficiency. Configurable alert messages are suitable for API use.
Any feedback, comments, or suggestions for improvement are always welcome.
Hope you enjoy!

MACD Aggressive Scalp SimpleComment on the Script
Purpose and Structure:
The script is a scalping strategy based on the MACD indicator combined with EMA (50) as a trend filter.
It uses the MACD histogram's crossover/crossunder of zero to trigger entries and exits, allowing the trader to capitalize on short-term momentum shifts.
The use of strategy.close ensures that positions are closed when specified conditions are met, although adjustments were made to align with Pine Script version 6.
Strengths:
Simplicity and Clarity: The logic is straightforward and focuses on essential scalping principles (momentum-based entries and exits).
Visual Indicators: The plotted MACD line, signal line, and histogram columns provide clear visual feedback for the strategy's operation.
Trend Confirmation: Incorporating the EMA(50) as a trend filter helps avoid trades that go against the prevailing trend, reducing the likelihood of false signals.
Dynamic Exit Conditions: The conditional logic for closing positions based on weakening momentum (via MACD histogram change) is a good way to protect profits or minimize losses.
Potential Improvements:
Parameter Inputs:
Make the MACD (12, 26, 9) and EMA(50) values adjustable by the user through input statements for better customization during backtesting.
Example:
pine
Copy code
macdFast = input(12, title="MACD Fast Length")
macdSlow = input(26, title="MACD Slow Length")
macdSignal = input(9, title="MACD Signal Line Length")
emaLength = input(50, title="EMA Length")
Stop Loss and Take Profit:
The strategy currently lacks explicit stop-loss or take-profit levels, which are critical in a scalping strategy to manage risk and lock in profits.
ATR-based or fixed-percentage exits could be added for better control.
Position Size and Risk Management:
While the script uses 50% of equity per trade, additional options (e.g., fixed position sizes or risk-adjusted sizes) would be beneficial for flexibility.
Avoid Overlapping Signals:
Add logic to prevent overlapping signals (e.g., opening a new position immediately after closing one on the same bar).
Backtesting Optimization:
Consider adding labels or markers (label.new or plotshape) to visualize entry and exit points on the chart for better debugging and analysis.
The inclusion of performance metrics like max drawdown, Sharpe ratio, or profit factor would help assess the strategy's robustness during backtesting.
Compatibility with Live Trading:
The strategy could be further enhanced with alert conditions using alertcondition to notify the trader of buy/sell signals in real-time.

linreg-gridbotLinreg-GridBot
>release note version 1<
Introduction
This script is a powerful trading strategy tool designed to help users identify market reversal points and make smarter trading decisions using grid thinking.
Background
Traditional grid/martingale strategies have several drawbacks: inefficient use of capital, premature grid boundaries, and trading at fixed intervals, all of which significantly reduce profitability. Since, there is not a gridbot can trail-stop at each level, stay close with the trend, and do better capital usage, tradalive has created this advanced gridbot to address these issues, and enhance the profitability.
How does it work?
Imagine plotting closes on a graph, where the x-axis represents the time-intervals and the y-axis represents the price. Linear regression would fit a straight line through these points that best represents the trend of the data.
In this script utilize the built-in to find consecutive slopes at each moment, and combine them to a smooth trend line. When turning point censored, an entry is placed right after the next bar. Then the gridbot starts working, the upper limit and lower limit is calculated by built-in , for example 3 ATRs above and under the entry price.
There is a 0.2 trailing stop for each step level. Also, when built-in VWMA is rising, this script uses built-in ROC to find the average change of lookback length, then move the grid upwards accordingly.
Size trading is crucial, in gridbot all-in when beginning the trade is risky, because turning point does not guarantee a reversal market upcoming. As a grid trader, we believe the price is relatively cheap near the lower limit, and the price is relatively expensive near the upper limit. Properly sized orders help prevent overexposure and reduce the potential for significant losses.
Features
Trend Detection: Utilizes linear regression to differentiate between upward and downward trends, displaying them as (orange) trend lines on the chart.
Signal Generation: Provides buy or sell signals at reversal points, helping users trade at optimal times.
Adjustable Parameters: Allows users to customize different indicator parameters to fit various trading strategies.
Backtested Device Parameters (see appendix)
Grid Parameters
🔃: Cyclic Trading
💰: Capital Turnover Ratio (Grid capital difference per level: 0.5 to 2)
⬆️ / ⬇️ Expected Number of Upward and Downward Grids.
The minimum number of grids is three: one level above and below the current price.
The maximum number of grids is seven: three levels above and below the current price.
🧭: Trade Signal: Controls the trading direction, long or short;
📏: Linear regression length value.
⏳⌛Backtest Period: Set the time range for users to analyze the performance of the strategy over different periods.
Analytic Toolbox (upper right corner) :
Usage Instructions
Add this script to your TradingView account.
Apply the script to your chart.
Adjust the parameters to fit your trading needs.
Make trading decisions based on the buy and sell signals.
Manually place orders on your trading platform using the parameters provided.
Enter grid parameters according to the highest and lowest prices.
Fill in the number of grid levels (the number of grids equals the number of upward grids plus the number of downward grids plus one).
Set stop-loss and take-profit values.
Alternatively, use a webhook to connect to your trading platform for automated trading.
Important Notes
This script currently only supports 4-hour and daily charts!
This script relies on historical data for calculations and may not be suitable for all market conditions.
Trading carries risks, so please use this script cautiously for trading decisions.
User has to update the backtest period, or else the strategy might not be seen.
Demostration
Phase one, the orange line is about to turn up.
Phase two, the reversal point is located, and right after the next bar start an entry of gridbot.
Phase Three, the gridbot operates, once level touches, then a 0.2ATR trailing stop is applied on each step.
Phase four, when vwma rises, the grid window follows it by the rate of change of lookback price. If vwma does not move up, then the grid boundaries remain.
Phase five, either side when the current price breaks through the white limits, the gridbot stops. And the trading strategy is done for this round.

Liquid Pours XtremeStrategy Description: Liquid Pours Xtreme
The Liquid Pours Xtreme is an innovative trading strategy that combines the analysis of specific time-based patterns with price comparisons to identify potential opportunities in the forex market. Designed for traders seeking a structured methodology based on clear rules, this strategy offers integration with Telegram for real-time alerts and provides visual tools to enhance trade management.
Key Features:
Analysis of Specific Time Patterns: The strategy captures and compares closing prices at two key moments during the trading day, identifying recurring patterns that may indicate future market movements.
Dynamic SL and TP Levels Implementation: Utilizes tick-based calculations to set Stop-Loss and Take-Profit levels, adapting to the current market volatility.
Advanced Telegram Integration: Provides detailed alerts including information such as the asset, signal time, entry price, and SL/TP levels, facilitating real-time decision-making.
Complete Customization: Allows users to adjust key parameters, including operation schedules, weekdays, and visual settings, adapting to different trading styles.
Enhanced Chart Visualization: Includes visual elements like candle color changes based on signal state, event markers, and halos to highlight important moments.
Default Strategy Properties: Specific configuration for optimal risk management and simulation.
How the Strategy Works
Capturing Prices at Key Moments:
- The strategy records the closing price at two user-defined specific times. These times typically correspond to periods of high market volatility, such as the opening of the European session and the US pre-market.
- Rationale: Volatility and trading volume usually increase during these times, presenting opportunities for significant price movements.
Generating Signals Based on Price Comparison:
- Buy Signal: If the second closing price is lower than the first, it indicates possible accumulation and is interpreted as a bullish signal.
- Sell Signal: If the second closing price is higher than the first, it suggests possible distribution and is interpreted as a bearish signal.
- Signals are only generated on selected trading days, allowing you to avoid days with lower liquidity or higher risk.
Calculating Dynamic SL and TP Levels:
- Stop-Loss (SL) and Take-Profit (TP) levels are calculated based on the entry price and a user-defined number of ticks, adapting to market volatility.
- The strategy offers the option to base these levels on the close of the signal candle or the open of the next candle, providing flexibility according to the trader's preference.
- SL and TP boxes are drawn on the chart for visual reference, facilitating trade management.
Automatic Execution and Alerts:
- Upon signal generation, the strategy automatically executes a market order (buy or sell).
- Sends a detailed alert to your Telegram channel, including essential information for quick decision-making.
Visual Elements:
- Colors candles based on the signal state: buy, sell, or neutral, allowing for quick trend identification.
- Provides a smooth color transition between signal states and uses markers and halos to highlight important events and signals on the chart.
Trade Management:
- Manages open trades with automatic exit conditions based on the established SL and TP levels.
- Includes mechanisms to prevent exceeding TradingView's limitations on boxes and labels, ensuring optimal script performance.
Originality and utility:
- This strategy incorporates a unique approach focusing on specific time patterns and their relationship to institutional activity in the market.
How to Use the Strategy
Add the Script to the Chart:
- Go to the indicators menu in TradingView.
- Search for " Liquid Pours Xtreme " and add it to your chart.
Set Up Telegram Alerts:
- Enter your Telegram Chat ID in the script parameters to receive alerts.
- Customize the Buy and Sell alert messages as desired.
Configure Time Patterns:
- Set the hours and minutes for the two times you want to compare closing prices, aligning them with relevant market sessions or events.
Set SL and TP Parameters:
- Define the number of ticks for the Stop-Loss and Take-Profit levels, adapting them to the asset you're trading and your risk tolerance.
- Choose the basis for SL and TP calculation (close of the signal candle or open of the next candle).
Select Trading Days:
- Enable or disable trading on specific days of the week, allowing you to avoid days with lower activity or unexpected volatility.
Customize Visual Elements:
- Adjust the colors and styles of visual elements to enhance readability and suit your personal preferences.
Monitor the Strategy:
- Observe the chart for signals and use Telegram alerts to stay informed of new opportunities, even when you're not at your terminal.
Testing and Optimization:
- Use TradingView's backtesting features to evaluate the historical performance of the strategy with different parameters.
- Adjust and optimize the parameters based on the results and your own analysis.
Adjust the Strategy Properties:
- Ensure that the strategy properties (order size, commission, slippage) are aligned with your trading account and platform to obtain realistic results.
Strategy Properties (Important)
This script backtest is conducted on M30 EURUSD , using the following backtesting properties:
Initial Capital: $10,000
Order Size: 50,000 Contracts (equivalent to 0.5% of the capital)
Commission: $0.20 per order
Slippage: 1 tick
Pyramiding: 1 order
Verify Price for Limit Orders: 0 ticks
Recalculate on Order Execution: Enabled
Recalculate on Every Tick: Enabled
Recalculate After Order Filled: Enabled
Bar Magnifier for Backtesting Precision: Enabled
We use these properties to ensure a realistic preview of the backtesting system. Note that default properties may vary for different reasons:
- Order Size: It is essential to calculate the contract size according to the traded asset and desired risk level.
- Commission and Slippage: These costs can vary depending on the market and instrument; there is no default value that might return realistic results.
We strongly recommend all users adjust the Properties within the script settings to align with their accounts and trading platforms to ensure the results from the strategies are realistic.
Backtesting Results:
- Net Profit: $4,037.50 (40.37%)
- Total Closed Trades : 292
- Profitability Percentage: 26.71%
- Profit Factor: 1.369
- Max Drawdown: $769.30 (6.28%)
- Average Trade: $13.83 (0.03%)
- Average Bars in Trades: 11
These results were obtained under the mentioned conditions and properties, providing an overview of the strategy's historical performance.
Interpreting Results:
- The strategy has demonstrated profitability in the analyzed period, although with a win rate of 26.71%, indicating that success relies on a favorable risk-reward ratio.
- The profit factor of 1.369 suggests that total gains exceed total losses by that proportion.
- It is crucial to consider the maximum drawdown of 6.28% when evaluating the strategy's suitability to your risk tolerance.
Risk Warning:
Trading leveraged financial instruments carries a high level of risk and may not be suitable for all investors. Before deciding to trade, you should carefully consider your investment objectives, level of experience, and risk tolerance. Past performance does not guarantee future results. It is essential to conduct additional testing and adjust the strategy according to your needs.
---
What Makes This Strategy Original?
Time-Based Pattern Approach: Unlike conventional strategies, this strategy focuses on identifying time patterns that reflect institutional activity and macroeconomic events that can influence the market.
Advanced Technological Integration: The combination of automatic execution and customized alerts via Telegram provides an efficient and modern tool for active traders.
Customization and Adaptability: The wide range of adjustable parameters allows the strategy to be tailored to different assets, time zones, and trading styles.
Enhanced Visual Tools: Incorporated visual elements facilitate quick market interpretation and informed decision-making.
Additional Considerations
Continuous Testing and Optimization: Users are encouraged to perform additional backtesting and optimize parameters according to their own observations and requirements.
Complementary Analysis: Use this strategy in conjunction with other indicators and fundamental analysis to reinforce decision-making.
Rigorous Risk Management: Ensure that SL and TP levels, as well as position sizing, align with your risk management plan.
Updates and Support: I am committed to providing updates and improvements based on community feedback. For inquiries or suggestions, feel free to contact me.
---
Example Configuration
Assuming you want to use the strategy with the following parameters:
Telegram Chat ID: Your unique Telegram Chat ID
First Time (Hour:Minute): 6:30
Second Time (Hour:Minute): 7:30
SL Ticks: 100
TP Ticks: 400
SL and TP Basis: Close of the Signal Candle
Trading Days: Tuesday, Wednesday, Thursday
Simulated Initial Capital: $10,000
Risk per Trade in Simulation: $50 (-0.5% of capital)
Slippage and Commissions in Simulation: 1 tick of slippage and $0.20 commission per trade
---
Conclusion
The Liquid Pours Xtreme strategy offers an innovative approach by combining specific time analysis with robust risk management and modern technological tools. Its original and adaptable design makes it valuable for traders looking to diversify their methods and capitalize on opportunities based on less conventional patterns.
Ready for immediate implementation in TradingView, this strategy can enrich your trading arsenal and contribute to a more informed and structured approach to your operations.
---
Final Disclaimer:
Financial markets are volatile and can present significant risks. This strategy should be used as part of a comprehensive trading approach and does not guarantee positive results. It is always advisable to consult with a professional financial advisor before making investment decisions.
---

Honest Volatility Grid [Honestcowboy]The Honest Volatility Grid is an attempt at creating a robust grid trading strategy but without standard levels.
Normal grid systems use price levels like 1.01;1.02;1.03;1.04... and place an order at each of these levels. In this program instead we create a grid using keltner channels using a long term moving average.
🟦 IS THIS EVEN USEFUL?
The idea is to have a more fluid style of trading where levels expand and follow price and do not stick to precreated levels. This however also makes each closed trade different instead of using fixed take profit levels. In this strategy a take profit level can even be a loss. It is useful as a strategy because it works in a different way than most strategies, making it a good tool to diversify a portfolio of trading strategies.
🟦 STRATEGY
There are 10 levels below the moving average and 10 above the moving average. For each side of the moving average the strategy uses 1 to 3 orders maximum (3 shorts at top, 3 longs at bottom). For instance you buy at level 2 below moving average and you increase position size when level 6 is reached (a cheaper price) in order to spread risks.
By default the strategy exits all trades when the moving average is reached, this makes it a mean reversion strategy. It is specifically designed for the forex market as these in my experience exhibit a lot of ranging behaviour on all the timeframes below daily.
There is also a stop loss at the outer band by default, in case price moves too far from the mean.
What are the risks?
In case price decides to stay below the moving average and never reaches the outer band one trade can create a very substantial loss, as the bands will keep following price and are not at a fixed level.
Explanation of default parameters
By default the strategy uses a starting capital of 25000$, this is realistic for retail traders.
Lot sizes at each level are set to minimum lot size 0.01, there is no reason for the default to be risky, if you want to risk more or increase equity curve increase the number at your own risk.
Slippage set to 20 points: that's a normal 2 pip slippage you will find on brokers.
Fill limit assumtion 20 points: so it takes 2 pips to confirm a fill, normal forex spread.
Commission is set to 0.00005 per contract: this means that for each contract traded there is a 5$ or whatever base currency pair has as commission. The number is set to 0.00005 because pinescript does not know that 1 contract is 100000 units. So we divide the number by 100000 to get a realistic commission.
The script will also multiply lot size by 100000 because pinescript does not know that lots are 100000 units in forex.
Extra safety limit
Normally the script uses strategy.exit() to exit trades at TP or SL. But because these are created 1 bar after a limit or stop order is filled in pinescript. There are strategy.orders set at the outer boundaries of the script to hedge against that risk. These get deleted bar after the first order is filled. Purely to counteract news bars or huge spikes in price messing up backtest.
🟦 VISUAL GOODIES
I've added a market profile feature to the edge of the grid. This so you can see in which grid zone market has been the most over X bars in the past. Some traders may wish to only turn on the strategy whenever the market profile displays specific characteristics (ranging market for instance).
These simply count how many times a high, low, or close price has been in each zone for X bars in the past. it's these purple boxes at the right side of the chart.
🟦 Script can be fully automated to MT5
There are risk settings in lot sizes or % for alerts and symbol settings provided at the bottom of the indicator. The script will send alert to MT5 broker trying to mimic the execution that happens on tradingview. There are always delays when using a bridge to MT5 broker and there could be errors so be mindful of that. This script sends alerts in format so they can be read by tradingview.to which is a bridge between the platforms.
Use the all alert function calls feature when setting up alerts and make sure you provide the right webhook if you want to use this approach.
Almost every setting in this indicator has a tooltip added to it. So if any setting is not clear hover over the (?) icon on the right of the setting.
