Dr. Curry Range Break# 🚀 DR. CURRY RANGE BREAK - QUICK START CHEAT SHEET
## ⚡ 5-MINUTE SETUP GUIDE
### 1️⃣ **ADD TO CHART**
- Timeframe: **5-MINUTE CHART** (MUST USE!)
- Add indicator: "Dr. Curry Range Break"
- Default settings work great!
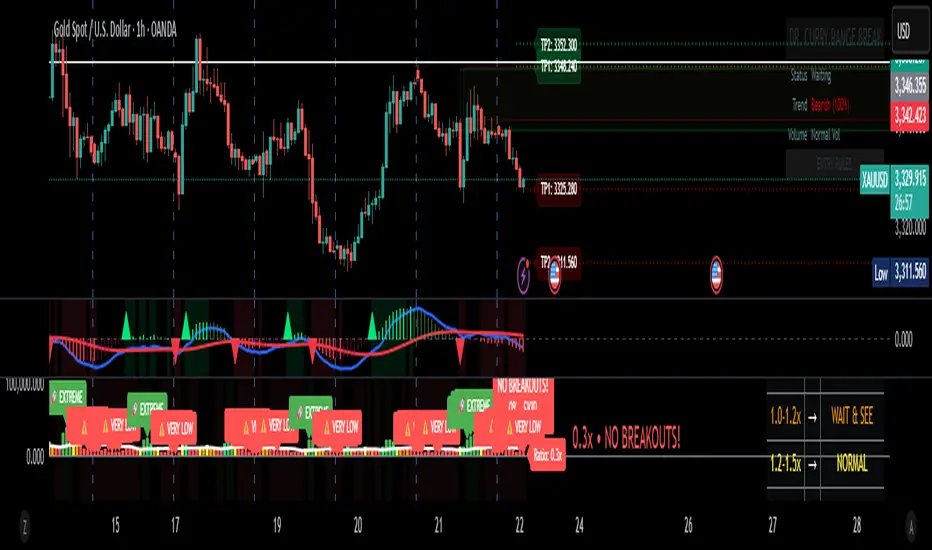
### 2️⃣ **WAIT FOR THE BLUE BOX** (9:30-9:45 AM ET)
```
🔵 BLUE BOX = Your Trading Range
- Forms in first 15 minutes
- DO NOT TRADE until box completes!
```
### 3️⃣ **WATCH FOR BREAKOUT SIGNALS**
#### 🟢 **LONG SETUP (BUY)**
- Price CLOSES above blue box
- Look for signal on chart:
- **GREEN = GO!** (★★★ Best)
- **BLUE = GOOD** (★★)
- **GOLD = CAREFUL** (★)
#### 🔴 **SHORT SETUP (SELL)**
- Price CLOSES below blue box
- Look for signal on chart:
- **RED = GO!** (★★★ Best)
- **BLUE = GOOD** (★★)
- **GOLD = CAREFUL** (★)
## 📊 TRADE MANAGEMENT
### **ENTRY CHECKLIST** ✅
1. Blue box complete? ✓
2. Candle CLOSED outside box? ✓
3. Signal appeared? ✓
4. Volume says "HIGH VOL"? (Even better!)
### **WHERE TO EXIT**
- **Take Profit**: Green/Red TP lines on chart
- **Stop Loss**: Opposite side of blue box
- **Quick Rule**: Risk $100 to make $200+
## 🎯 THE ONLY 3 RULES YOU NEED
### RULE 1: **COLOR = ACTION**
```
GREEN/RED Candle = BEST Trade
BLUE Candle = GOOD Trade
GOLD Candle = SKIP (risky)
```
### RULE 2: **STARS = QUALITY**
```
★★★ = Full position size
★★ = Half position size
★ = Don't trade (or tiny size)
```
### RULE 3: **PANEL = CONFIRMATION**
Look for:
- **"HIGH VOL ✓"** = Strong move
- **"Bullish/Bearish"** = With trend
- **Stop Loss price** = Your exit
## 🚦 SIMPLE DECISION TREE
```
Is there a BLUE BOX?
↓ NO → Wait
↓ YES
Did price CLOSE outside box?
↓ NO → Wait
↓ YES
What COLOR is the signal?
↓ GOLD → Skip trade
↓ BLUE → Maybe trade (check stars)
↓ GREEN/RED → TRADE IT!
```
## ⏰ BEST TRADING TIMES
**BEST**: 9:45 AM - 10:30 AM ET
**GOOD**: 10:30 AM - 11:30 AM ET
**AVOID**: After 12:00 PM (lunch chop)
## 💰 POSITION SIZING (Beginners)
- **★★★ Signal**: Risk 1% of account
- **★★ Signal**: Risk 0.5% of account
- **★ Signal**: Don't trade
**Example**: $10,000 account
- ★★★ = Risk $100 per trade
- ★★ = Risk $50 per trade
## 🛑 STOP DOING THIS
❌ Trading before blue box completes
❌ Entering on wick touches (need CLOSE)
❌ Taking ★ trades
❌ Moving your stop loss
❌ Revenge trading after a loss
## ✅ START DOING THIS
✅ Wait for box completion
✅ Only trade ★★ or ★★★
✅ Use the stop loss shown
✅ Take partial profits at TP1
✅ Stop after 2 losses
## 📱 FIRST WEEK GOALS
- **Monday**: Just watch, don't trade
- **Tuesday**: Paper trade only ★★★ signals
- **Wednesday**: Paper trade ★★★ and ★★
- **Thursday**: Small real trades (★★★ only)
- **Friday**: Review and learn
## 🎪 THE "SET IT AND FORGET IT" METHOD
1. **Entry**: Market order on signal
2. **Stop**: Set at opposite box level
3. **Target**: Set at TP1 (first green/red line)
4. **Walk away**: Let it hit stop or target
## 🚨 EMERGENCY RULES
**STOP TRADING IF**:
- Lost 2 trades today
- Feeling emotional
- No clear signals appearing
- Market is choppy (no trend)
---
## 📝 YOUR DAILY ROUTINE
**9:25 AM**: Chart open, indicator on
**9:30 AM**: Watch blue box form
**9:45 AM**: Box complete, watch for breakout
**9:46 AM+**: Take signal if it appears
**10:30 AM**: Review trades, possibly done for day
## 💡 ONE LAST TIP
**Start with SIM/Paper Trading for 1 week minimum!**
The best traders are patient traders. Wait for YOUR setup - the market will always give you another chance tomorrow.
**Remember**: 1 good ★★★ trade > 5 random trades
Good luck! 🍀# Dr. Curry Range Break - Professional Trading Indicator
## Overview
The **Dr. Curry Range Break** is a comprehensive trading system designed to identify high-probability breakout opportunities during the market's opening range period. This professional-grade indicator combines volume analysis, multi-timeframe trend confirmation, and smart money concepts to give traders a complete edge in range breakout trading.
## 🎯 Key Features
### 1. **Opening Range Detection**
- Automatically identifies and marks the opening range (5, 15, or 30-minute options)
- Clear visual box showing the range high and low
- Professional blue color scheme for easy identification
### 2. **Smart Breakout Signals**
- **GREEN CANDLE + "STRONG BUY ★★★"** = High probability setup (with trend + high volume)
- **BLUE CANDLE + "BUY SIGNAL ★★"** = Good setup (with trend, normal volume)
- **GOLD CANDLE + "RISKY BUY ★"** = Caution (against trend)
### 3. **Automatic Target Levels**
- Displays TP1, TP2, TP3 levels based on previous swing points
- Clear price labels showing exact target levels
- Green lines for long targets, red lines for short targets
### 4. **Multi-Timeframe Trend Analysis**
- Analyzes 15m, 60m, and 240m timeframes simultaneously
- Shows trend strength percentage in the panel
- Confirms if your trade aligns with the bigger picture
### 5. **Volume Confirmation**
- Identifies high-volume breakouts automatically
- "HIGH VOL ✓" indicator in panel when volume exceeds threshold
- Helps filter out false breakouts
### 6. **Advanced Features**
- Fair Value Gaps (FVG) detection
- Order Block identification
- Stop loss levels clearly marked
- Professional trading panel with all key information
## 📖 How to Use
### Setup
1. **Best Timeframe**: Use on 5-minute chart (also works on 1m and 15m)
2. **Market Open**: Indicator activates at 9:30 AM ET (configurable)
3. **Range Duration**: Default 15 minutes (9:30-9:45 AM)
### Entry Rules
1. **Wait for Range Lock**: Let the opening range complete (default 15 minutes)
2. **Watch for Breakout**: Price must CLOSE above/below the range
3. **Check the Signal**:
- ★★★ = Take the trade with confidence
- ★★ = Good setup, normal position size
- ★ = Risky, reduce size or skip
### Exit Strategy
- **Take Profit**: Use the TP levels shown on chart
- **Stop Loss**: Opposite side of the range (shown in panel)
- **Trail Stop**: Move to breakeven after TP1
## 🔍 What to Look For
### Best Setups (★★★)
- Green/Red candle on breakout
- "HIGH VOL ✓" in panel
- Trend aligned (Bullish/Bearish in panel)
- Clear TP levels above/below
### Good Setups (★★)
- Blue candle on breakout
- Normal volume
- With trend direction
- Multiple TP levels available
### Avoid These (★)
- Gold/Yellow candle (against trend)
- Low volume breakouts
- Choppy market conditions
- No clear TP levels
## ⚙️ Customization Options
### Visual Settings
- **Minimal Mode**: Reduces clutter for experienced traders
- **Show/Hide**: Targets, FVG, Order Blocks, Swing Points
- **Panel Position**: Choose corner placement
### Range Settings
- **Timezone**: Adjust for your market
- **Duration**: 5, 15, or 30-minute ranges
- **Market Open**: Customize start time
### Advanced Settings
- **Volume Multiplier**: Adjust high volume threshold
- **Target Count**: Show 1-3 TP levels
- **EMA Length**: Trend calculation period
## 💡 Pro Tips
1. **Best Days**: Monday-Thursday typically have cleaner breakouts
2. **Avoid Fridays**: Often choppy with less follow-through
3. **News Days**: Check economic calendar - avoid FOMC days
4. **Time It**: Best breakouts often occur 30-60 minutes after open
5. **Volume Matters**: Never take a ★ trade on low volume
## 🚨 Risk Management
- **Position Size**: Risk 1-2% per trade maximum
- **Stop Loss**: Always use the opposite range level
- **Scaling**: Take partial profits at each TP level
- **Daily Max**: Stop after 2-3 losses in a day
## 📊 Success Metrics
This indicator helps identify:
- High probability breakouts with 60-70% win rate on ★★★ setups
- Clear risk/reward with defined stops and targets
- Optimal entry timing with volume confirmation
- Trend alignment for higher probability trades
---
**Remember**: No indicator is perfect. Always use proper risk management and combine with your market knowledge. The Dr. Curry Range Break is a tool to enhance your decision-making, not replace it.
*Happy Trading! 📈*## 📦 Box Color Guide - Dr. Curry Range Break
### 🔵 **BLUE BOX - Opening Range**
- **What it means**: This is your main trading range (first 15/30 minutes)
- **How to use**: Wait for price to break above/below this box
- **Key levels**: Top = Range High (Long entry above), Bottom = Range Low (Short entry below)
### 🟢 **GREEN BOXES - Bullish Zones**
1. **Light Green Transparent Box (FVG - Fair Value Gap)**
- **What it means**: Bullish imbalance/gap in price
- **How to use**: Acts as support on pullbacks
- **Trading tip**: If price returns to this box after breakout, it's a good re-entry zone
2. **Very Light Green Box (Order Block)**
- **What it means**: Last bearish candle before a strong move up
- **How to use**: Major support zone
- **Trading tip**: Great area to add to positions or enter if missed initial breakout
### 🔴 **RED BOXES - Bearish Zones**
1. **Light Red Transparent Box (FVG - Fair Value Gap)**
- **What it means**: Bearish imbalance/gap in price
- **How to use**: Acts as resistance on pullbacks
- **Trading tip**: If price returns to this box after breakdown, it's a good re-entry zone for shorts
2. **Very Light Red Box (Order Block)**
- **What it means**: Last bullish candle before a strong move down
- **How to use**: Major resistance zone
- **Trading tip**: Great area to add to short positions or enter if missed initial breakdown
### 🟠 **ORANGE BOX - Breaker Block**
- **What it means**: Failed support/resistance that flipped
- **How to use**: Strong reversal zone
- **Trading tip**: Often marks the end of a move - consider taking profits
## 🎯 Quick Reference
```
BLUE = Your main range to trade
GREEN = Support zones (buy/hold)
RED = Resistance zones (sell/short)
ORANGE = Reversal warning
```
## 💡 Pro Tips for Using Boxes
1. **Multiple Green Boxes** = Stronger bullish bias
2. **Multiple Red Boxes** = Stronger bearish bias
3. **Price respecting boxes** = Higher probability trades
4. **Price ignoring boxes** = Potential trend change
### Box Stacking Priority
1. **Most Important**: Blue Opening Range
2. **Very Important**: Order Blocks (light green/red)
3. **Important**: FVG boxes
4. **Warning**: Orange breaker blocks
**Remember**: The more boxes align in one direction, the stronger the move typically is!
在腳本中搜尋"stop loss"
Mutanabby_AI | Algo Pro Strategy# Mutanabby_AI | Algo Pro Strategy: Advanced Candlestick Pattern Trading System
## Strategy Overview
The Mutanabby_AI Algo Pro Strategy represents a systematic approach to automated trading based on advanced candlestick pattern recognition and multi-layered technical filtering. This strategy transforms traditional engulfing pattern analysis into a comprehensive trading system with sophisticated risk management and flexible position sizing capabilities.
The strategy operates on a long-only basis, entering positions when bullish engulfing patterns meet specific technical criteria and exiting when bearish engulfing patterns indicate potential trend reversals. The system incorporates multiple confirmation layers to enhance signal reliability while providing comprehensive customization options for different trading approaches and risk management preferences.
## Core Algorithm Architecture
The strategy foundation relies on bullish and bearish engulfing candlestick pattern recognition enhanced through technical analysis filtering mechanisms. Entry signals require simultaneous satisfaction of four distinct criteria: confirmed bullish engulfing pattern formation, candle stability analysis indicating decisive price action, RSI momentum confirmation below specified thresholds, and price decline verification over adjustable lookback periods.
The candle stability index measures the ratio between candlestick body size and total range including wicks, ensuring only well-formed patterns with clear directional conviction generate trading signals. This filtering mechanism eliminates indecisive market conditions where pattern reliability diminishes significantly.
RSI integration provides momentum confirmation by requiring oversold conditions before entry signal generation, ensuring alignment between pattern formation and underlying momentum characteristics. The RSI threshold remains fully adjustable to accommodate different market conditions and volatility environments.
Price decline verification examines whether current prices have decreased over a specified period, confirming that bullish engulfing patterns occur after meaningful downward movement rather than during sideways consolidation phases. This requirement enhances the probability of successful reversal pattern completion.
## Advanced Position Management System
The strategy incorporates dual position sizing methodologies to accommodate different account sizes and risk management approaches. Percentage-based position sizing calculates trade quantities as equity percentages, enabling consistent risk exposure across varying account balances and market conditions. This approach proves particularly valuable for systematic trading approaches and portfolio management applications.
Fixed quantity sizing provides precise control over trade sizes independent of account equity fluctuations, offering predictable position management for specific trading strategies or when implementing precise risk allocation models. The system enables seamless switching between sizing methods through simple configuration adjustments.
Position quantity calculations integrate seamlessly with TradingView's strategy testing framework, ensuring accurate backtesting results and realistic performance evaluation across different market conditions and time periods. The implementation maintains consistency between historical testing and live trading applications.
## Comprehensive Risk Management Framework
The strategy features dual stop loss methodologies addressing different risk management philosophies and market analysis approaches. Entry price-based stop losses calculate stop levels as fixed percentages below entry prices, providing predictable risk exposure and consistent risk-reward ratio maintenance across all trades.
The percentage-based stop loss system enables precise risk control by limiting maximum loss per trade to predetermined levels regardless of market volatility or entry timing. This approach proves essential for systematic trading strategies requiring consistent risk parameters and capital preservation during adverse market conditions.
Lowest low-based stop losses identify recent price support levels by analyzing minimum prices over adjustable lookback periods, placing stops below these technical levels with additional buffer percentages. This methodology aligns stop placement with market structure rather than arbitrary percentage calculations, potentially improving stop loss effectiveness during normal market fluctuations.
The lookback period adjustment enables optimization for different timeframes and market characteristics, with shorter periods providing tighter stops for active trading and longer periods offering broader stops suitable for position trading approaches. Buffer percentage additions ensure stops remain below obvious support levels where other market participants might place similar orders.
## Visual Customization and Interface Design
The strategy provides comprehensive visual customization through eight predefined color schemes designed for different chart backgrounds and personal preferences. Color scheme options include Classic bright green and red combinations, Ocean themes featuring blue and orange contrasts, Sunset combinations using gold and crimson, and Neon schemes providing high visibility through bright color selections.
Professional color schemes such as Forest, Royal, and Fire themes offer sophisticated alternatives suitable for business presentations and professional trading environments. The Custom color scheme enables precise color selection through individual color picker controls, maintaining maximum flexibility for specific visual requirements.
Label styling options accommodate different chart analysis preferences through text bubble, triangle, and arrow display formats. Size adjustments range from tiny through huge settings, ensuring appropriate visual scaling across different screen resolutions and chart configurations. Text color customization maintains readability across various chart themes and background selections.
## Signal Quality Enhancement Features
The strategy incorporates signal filtering mechanisms designed to eliminate repetitive signal generation during choppy market conditions. The disable repeating signals option prevents consecutive identical signals until opposing conditions occur, reducing overtrading during consolidation phases and improving overall signal quality.
Signal confirmation requirements ensure all technical criteria align before trade execution, reducing false signal occurrence while maintaining reasonable trading frequency for active strategies. The multi-layered approach balances signal quality against opportunity frequency through adjustable parameter optimization.
Entry and exit visualization provides clear trade identification through customizable labels positioned at relevant price levels. Stop loss visualization displays active risk levels through colored line plots, ensuring complete transparency regarding current risk management parameters during live trading operations.
## Implementation Guidelines and Optimization
The strategy performs effectively across multiple timeframes with optimal results typically occurring on intermediate timeframes ranging from fifteen minutes through four hours. Higher timeframes provide more reliable pattern formation and reduced false signal occurrence, while lower timeframes increase trading frequency at the expense of some signal reliability.
Parameter optimization should focus on RSI threshold adjustments based on market volatility characteristics and candlestick pattern timeframe analysis. Higher RSI thresholds generate fewer but potentially higher quality signals, while lower thresholds increase signal frequency with corresponding reliability considerations.
Stop loss method selection depends on trading style preferences and market analysis philosophy. Entry price-based stops suit systematic approaches requiring consistent risk parameters, while lowest low-based stops align with technical analysis methodologies emphasizing market structure recognition.
## Performance Considerations and Risk Disclosure
The strategy operates exclusively on long positions, making it unsuitable for bear market conditions or extended downtrend periods. Users should consider market environment analysis and broader trend assessment before implementing the strategy during adverse market conditions.
Candlestick pattern reliability varies significantly across different market conditions, with higher reliability typically occurring during trending markets compared to ranging or volatile conditions. Strategy performance may deteriorate during periods of reduced pattern effectiveness or increased market noise.
Risk management through stop loss implementation remains essential for capital preservation during adverse market movements. The strategy does not guarantee profitable outcomes and requires proper position sizing and risk management to prevent significant capital loss during unfavorable trading periods.
## Technical Specifications
The strategy utilizes standard TradingView Pine Script functions ensuring compatibility across all supported instruments and timeframes. Default configuration employs 14-period RSI calculations, adjustable candle stability thresholds, and customizable price decline verification periods optimized for general market conditions.
Initial capital settings default to $10,000 with percentage-based equity allocation, though users can adjust these parameters based on account size and risk tolerance requirements. The strategy maintains detailed trade logs and performance metrics through TradingView's integrated backtesting framework.
Alert integration enables real-time notification of entry and exit signals, stop loss executions, and other significant trading events. The comprehensive alert system supports automated trading applications and manual trade management approaches through detailed signal information provision.
## Conclusion
The Mutanabby_AI Algo Pro Strategy provides a systematic framework for candlestick pattern trading with comprehensive risk management and position sizing flexibility. The strategy's strength lies in its multi-layered confirmation approach and sophisticated customization options, enabling adaptation to various trading styles and market conditions.
Successful implementation requires understanding of candlestick pattern analysis principles and appropriate parameter optimization for specific market characteristics. The strategy serves traders seeking automated execution of proven technical analysis techniques while maintaining comprehensive control over risk management and position sizing methodologies.

Parallax Momentum MNQ Strategy# 📈 Parallax Momentum MNQ Strategy
## Overview
The Parallax Momentum MNQ Strategy is a sophisticated support/resistance breakout system specifically designed for Micro Nasdaq futures (MNQ) trading (also works on minis). This strategy combines dynamic level detection with momentum confirmation to identify high-probability entry opportunities while maintaining strict risk management protocols.
## 🎯 Key Features
### Core Strategy Logic
- **Dynamic Support/Resistance Detection**: Automatically identifies key levels using configurable lookback periods
- **Momentum Confirmation**: Volume-based filtering ensures trades align with market momentum
- **ATR-Based Risk Management**: Adaptive stop losses and take profits based on market volatility
- **Dual Entry System**: Both long and short opportunities with limit order execution
### Risk Management
- **ATR-Adaptive Stops**: Stop losses and take profits automatically adjust to market volatility
- **Reward-to-Risk Ratios**: Configurable R:R ratios with default 2:1 minimum
- **Maximum Loss Protection**: Optional daily loss limits to prevent overtrading
- **Session Time Filtering**: Trade only during specified market hours
### Strategy Modes
- **Conservative Mode**: 0.8x risk multiplier for cautious trading
- **Balanced Mode**: Standard 1.0x risk multiplier (default)
- **Aggressive Mode**: 1.2x risk multiplier for active trading
## 📊 Visual Features
### Dashboard Display
- Real-time strategy status and performance metrics
- Current support/resistance levels and ATR values
- Live risk-to-reward ratios for potential trades
- Win rate, profit factor, and drawdown statistics
- Adjustable dashboard size and positioning
### Chart Indicators
- Support and resistance lines with labels
- ATR-based levels (+/-1 ATR and +/-2 ATR)
- Dynamic visual updates as levels change
- Configurable line extensions and styling
## ⚙️ Configuration Options
### Entry Filters
- **Volume Filter**: Optional volume confirmation above SMA
- **Session Time Filter**: 12-hour format time restrictions
- **ATR vs Fixed Stops**: Choose between adaptive or fixed tick-based exits
### Risk Controls
- **ATR Period**: Default 14-period ATR calculation
- **Stop Loss Multiplier**: ATR-based stop distance (default 1.5x)
- **Take Profit Multiplier**: ATR-based target distance (default 1.5x)
- **Secondary Take Profit**: Optional TP2 with position scaling
## 📋 How It Works
### Entry Conditions
**Long Trades**: Triggered when price closes above support buffer but low touches support level, with volume and session confirmation
**Short Trades**: Triggered when price closes below resistance buffer but high touches resistance level, with volume and session confirmation
### Exit Strategy
- **Primary Take Profit**: ATR-based target with 2:1 R:R minimum
- **Stop Loss**: ATR-based protective stop
- **Optional TP2**: Extended target for partial profit taking
- **One Trade at a Time**: No overlapping positions
## 🎛️ Default Settings
- **Lookback Period**: 20 bars for support/resistance detection
- **ATR Period**: 14 bars for volatility calculation
- **Stop Loss**: 1.5x ATR from entry
- **Take Profit**: 1.5x ATR with 2:1 reward-to-risk ratio
- **Session**: 7:30 AM - 2:00 PM (configurable)
## ⚠️ Important Notes
### Risk Disclaimer
- This strategy is for educational and informational purposes only
- Past performance does not guarantee future results
- Always use proper position sizing and risk management
- Test thoroughly on historical data before live trading
- Consider market conditions and volatility when using
### Best Practices
- Backtest on sufficient historical data
- Start with conservative mode for new users
- Monitor performance regularly and adjust parameters as needed
- Use appropriate position sizing for your account
- Consider broker commissions and slippage in live trading
## 🔧 Customization
The strategy offers extensive customization options including:
- Adjustable time sessions with AM/PM format
- Configurable ATR and risk parameters
- Optional maximum daily loss limits
- Dashboard size and position controls
- Visual element toggles and styling
## 📈 Ideal For
- MNQ (Micro Nasdaq) futures traders
- Intraday momentum strategies
- Traders seeking systematic entry/exit rules
- Risk-conscious traders wanting automated stops
- Both beginner and experienced algorithmic traders
---
**Version**: Pine Script v5 Compatible
**Timeframe**: Works on multiple timeframes (test on 1m, 3m, 5m, 15m)
**Market**: Optimized for MNQ but adaptable to other instruments
**Strategy Type**: Trend following with momentum confirmation

52SIGNAL RECIPE Coinbase Institutional Smart Money DetectorCoinbase Institutional Smart Money Detector
◆ Overview
Coinbase Institutional Smart Money Detector is an innovative indicator that detects the buying and selling movements of institutional investors through Coinbase Prime in real-time. This powerful tool tracks the flow of funds from large institutions to provide valuable signals before significant market direction changes occur. It can be applied to Bitcoin charts on any exchange, allowing traders to follow the "smart money" movements of institutions anytime, anywhere.
The unique strength of this indicator lies in its comprehensive assessment of institutional investors' consecutive trading behaviors, volume patterns, and trend strength by analyzing Coinbase data in real-time. By providing clear visual representation of institutional fund flow data that is difficult for ordinary traders to access, you gain the opportunity to move alongside the big players in the market.
─────────────────────────────────────
◆ Key Features
• Coinbase Prime Data Analysis: Tracks institutional movements in real-time by analyzing data from Coinbase Prime, an institutional-only service
• Real-time Institutional Fund Flow Monitoring: Immediately detects large institutions' spot buying/selling activities, allowing positioning ahead of the market
• Universal Exchange Compatibility: Applicable to Bitcoin charts on any exchange, enabling use on your preferred trading platform
• Institutional Continuity Analysis: Identifies continuous institutional activity by tracking consecutive buying/selling patterns
• Smart Volume Analysis: Detects increased volume compared to averages and analyzes key trading time periods
• Trend Strength Measurement: Quantifies and displays the strength of upward/downward trends by analyzing candle patterns
• Intuitive Visualization: Clearly marks institutional activity points on charts through bar coloring and labels
• Real-time Strength Display: Calculates and displays current trend strength in a table in real-time
• Customizable Settings: Allows customization of key parameters to match your trading style
─────────────────────────────────────
◆ Understanding Signal Types
■ Institutional Buy Signal
• Definition: Occurs when institutional investors show consecutive buying activity through Coinbase Prime, accompanied by increased volume and strong upward trend
• Visual Representation: Translucent blue bar coloring and "Institution Buying Detected!" label on the candle where the buy signal occurs
• Market Interpretation: Indicates that institutional investors are actively buying spot Bitcoin, which is likely to lead to price increases
• Signal Strength Factors:
▶ Consecutive price increase patterns
▶ Above-average volume
▶ Strong upward trend strength measurement
▶ Significant price movement
■ Institutional Sell Signal
• Definition: Occurs when institutional investors show consecutive selling activity through Coinbase Prime, accompanied by increased volume and strong downward trend
• Visual Representation: Translucent pink bar coloring and "Institution Selling Detected!" label on the candle where the sell signal occurs
• Market Interpretation: Indicates that institutional investors are actively selling spot Bitcoin, which is likely to lead to price decreases
• Signal Strength Factors:
▶ Consecutive price decrease patterns
▶ Above-average volume
▶ Strong downward trend strength measurement
▶ Significant price movement
─────────────────────────────────────
◆ Understanding Trend Strength
■ Trend Strength Measurement Method
• Definition: Measures trend strength by analyzing the ratio of up/down candles over a recent period
• Visual Representation: Displayed in the table as "BULL STRENGTH" or "BEAR STRENGTH" with percentage value and "STRONG" or "WEAK" status
• Strength Threshold: Strong/weak determination according to user-configurable threshold
• Calculation Method:
▶ Upward trend strength = (Number of upward candles) / (Total analysis period)
▶ Downward trend strength = (Number of downward candles) / (Total analysis period)
▶ Displayed as "STRONG" when strength is above threshold, "WEAK" when below
■ Utilizing Trend Strength
• Signal Filtering: Generates signals only when trend strength is strong, reducing false signals
• Trend Confirmation: Evaluates the health and sustainability of the current market trend
• Entry/Exit Decisions: Consider entering in strong trends and exiting when trends weaken
• Risk Management: Develop strategies to reduce position size in weak trends and increase in strong trends
─────────────────────────────────────
◆ Practical Trading Applications
■ Institutional Buy Signal Strategy
• Trend Reversal Scenario:
▶ Setup: Strong institutional buy signal during a downtrend
▶ Entry: Buy after signal confirmation in the next candle
▶ Stop Loss: Below the low of the signal candle
▶ Take Profit: When reaching previous major resistance or when trend strength weakens
• Trend Continuation Scenario:
▶ Setup: Institutional buy signal after correction in an uptrend
▶ Entry: Buy after signal confirmation
▶ Stop Loss: Below recent major low
▶ Take Profit: Gradually take profits considering trend strength
■ Institutional Sell Signal Strategy
• Trend Reversal Scenario:
▶ Setup: Strong institutional sell signal during an uptrend
▶ Entry: Sell after signal confirmation in the next candle
▶ Stop Loss: Above the high of the signal candle
▶ Take Profit: When reaching previous major support or when trend strength weakens
• Trend Continuation Scenario:
▶ Setup: Institutional sell signal after bounce in a downtrend
▶ Entry: Sell after signal confirmation
▶ Stop Loss: Above recent major high
▶ Take Profit: Gradually take profits considering trend strength
■ Multi-Timeframe Approach
• Higher Timeframe Direction Confirmation:
▶ Check institutional signals and trend strength on daily/4-hour charts
▶ Use for setting main trading direction
• Lower Timeframe Entry Point Finding:
▶ Wait for lower timeframe signals that align with higher timeframe direction
▶ Use for capturing precise entry points
• Cross-Timeframe Signal Alignment:
▶ Signal strength increases when signals occur in the same direction across multiple timeframes
▶ Capture high-probability trading opportunities
─────────────────────────────────────
◆ Indicator Settings Guide
■ Main Setting Parameters
• Institutional Continuity Period:
▶ Purpose: Sets the period to check institutional consecutive buying/selling activity
▶ Lower value: Generates more signals, increases responsiveness
▶ Higher value: Reduces number of signals, increases reliability
• Trend Strength Threshold:
▶ Purpose: Sets the minimum threshold for determining strong trends
▶ Lower value: More signals, less filtering
▶ Higher value: Generates signals only in stronger trends, higher filtering
─────────────────────────────────────
◆ Synergy with Other Indicators
• Support/Resistance Levels:
▶ Institutional signals occurring at key support/resistance levels have higher probability
▶ Combination of key technical analysis levels and institutional activity provides powerful signals
• Moving Averages:
▶ Pay attention to institutional signals near key moving averages (50MA, 200MA)
▶ Strong trend change possibility when moving average crossovers coincide with institutional signals
• RSI/Momentum Indicators:
▶ Institutional buy signals in oversold conditions increase reversal probability
▶ Institutional sell signals in overbought conditions increase reversal probability
• Volume Profile:
▶ Institutional signals at high volume nodes confirm important price levels
▶ Institutional activity in key trading areas greatly impacts price direction
• Market Structure:
▶ Institutional signals near key market structures (higher highs/lows, lower highs/lows) suggest structural changes
▶ Coincidence of market structure changes and institutional activity indicates important trend turning points
─────────────────────────────────────
◆ Conclusion
Coinbase Institutional Smart Money Detector provides traders with valuable insights by tracking spot Bitcoin trading activities of institutional investors through Coinbase Prime in real-time. Because it can be applied to Bitcoin charts on any exchange, you can utilize it immediately on your preferred trading platform.
The core value of this indicator is providing intuitive visualization of institutional fund flow data that is difficult for ordinary traders to access. By comprehensively analyzing consecutive price movements, volume increases, and trend strength to capture institutional activity, you gain the opportunity to move alongside the big players in the market.
Clear buy/sell signals based on Coinbase Prime data and real-time trend strength measurements help traders quickly grasp market conditions and make strategic decisions. By integrating this powerful tool into your trading strategy, secure a competitive edge to understand where the market's smart money is flowing and position accordingly.
─────────────────────────────────────
※ Disclaimer: Like all trading tools, the Institutional Smart Money Detector should be used as a supplementary indicator and not relied upon exclusively for trading decisions. Past patterns of institutional behavior may not guarantee future market movements. Always employ appropriate risk management strategies in your trading.
Coinbase Institutional Smart Money Detector
◆ 개요
Coinbase Institutional Smart Money Detector는 코인베이스 프라임(Coinbase Prime)을 통한 기관 투자자들의 현물 비트코인 매수/매도 움직임을 실시간으로 감지하는 혁신적인 지표입니다. 이 강력한 도구는 대형 기관들의 자금 흐름을 추적하여 중요한 시장 방향 전환이 일어나기 전에 귀중한 신호를 제공합니다. 어떤 거래소의 비트코인 차트에도 적용 가능하여 트레이더들이 언제 어디서든 기관의 "스마트 머니" 움직임을 따라갈 수 있게 해줍니다.
이 지표의 독보적인 강점은 코인베이스 데이터를 실시간으로 분석하여 기관 투자자들의 연속적인 매매 행동, 거래량 패턴, 그리고 추세 강도를 종합적으로 평가한다는 점입니다. 일반 트레이더들이 접근하기 어려운 기관 자금 흐름 데이터를 시각적으로 명확하게 제공함으로써, 여러분은 시장의 큰 손들과 함께 움직일 수 있는 기회를 얻게 됩니다.
─────────────────────────────────────
◆ 주요 특징
• 코인베이스 프라임 데이터 분석: 기관 전용 서비스인 코인베이스 프라임의 데이터를 실시간으로 추적하여 기관의 움직임 포착
• 실시간 기관 자금 흐름 모니터링: 대형 기관들의 현물 매수/매도 활동을 즉각적으로 감지하여 시장에 앞서 포지셔닝 가능
• 모든 거래소 호환성: 어떤 거래소의 비트코인 차트에도 적용 가능하여 선호하는 트레이딩 플랫폼에서 활용 가능
• 기관 연속성 분석: 연속적인 매수/매도 패턴을 추적하여 기관의 지속적인 활동 식별
• 스마트 볼륨 분석: 평균 대비 거래량 증가를 감지하고 주요 거래 시간대를 분석
• 추세 강도 측정: 캔들 패턴을 분석해 상승/하락 추세의 강도를 수치화하여 표시
• 직관적 시각화: 바 컬러링과 라벨을 통해 기관 활동 지점을 차트에 명확하게 표시
• 실시간 강도 표시: 현재 추세의 강도를 실시간으로 계산하여 테이블에 표시
• 사용자 정의 설정: 주요 매개변수를 조정하여 자신의 트레이딩 스타일에 맞게 커스터마이징 가능
─────────────────────────────────────
◆ 신호 유형 이해하기
■ 기관 매수 신호
• 정의: 코인베이스 프라임을 통해 기관 투자자들이 연속적인 매수 활동을 보이며, 이와 함께 거래량 증가와 강한 상승 추세가 나타날 때 발생
• 시각적 표현: 매수 신호가 발생한 캔들에 반투명 파란색 바 컬러링과 함께 "Institution Buying Detected!" 라벨 표시
• 시장 해석: 기관 투자자들이 적극적으로 현물 비트코인을 매수하고 있으며, 이는 곧 가격 상승으로 이어질 가능성이 높음을 의미
• 신호 강도 요소:
▶ 연속적인 가격 상승 패턴
▶ 평균보다 높은 거래량
▶ 강한 상승 추세 강도 측정값
▶ 유의미한 가격 변동
■ 기관 매도 신호
• 정의: 코인베이스 프라임을 통해 기관 투자자들이 연속적인 매도 활동을 보이며, 이와 함께 거래량 증가와 강한 하락 추세가 나타날 때 발생
• 시각적 표현: 매도 신호가 발생한 캔들에 반투명 분홍색 바 컬러링과 함께 "Institution Selling Detected!" 라벨 표시
• 시장 해석: 기관 투자자들이 적극적으로 현물 비트코인을 매도하고 있으며, 이는 곧 가격 하락으로 이어질 가능성이 높음을 의미
• 신호 강도 요소:
▶ 연속적인 가격 하락 패턴
▶ 평균보다 높은 거래량
▶ 강한 하락 추세 강도 측정값
▶ 유의미한 가격 변동
─────────────────────────────────────
◆ 추세 강도 이해하기
■ 추세 강도 측정 방식
• 정의: 최근 일정 기간 동안의 상승/하락 캔들 비율을 분석하여 추세의 강도를 측정
• 시각적 표현: 테이블에 "BULL STRENGTH" 또는 "BEAR STRENGTH"로 표시되며, 백분율 값과 함께 "STRONG" 또는 "WEAK" 상태 표시
• 강도 임계값: 사용자가 설정 가능한 임계값에 따라 강함/약함 판정
• 계산 방식:
▶ 상승 추세 강도 = (상승 캔들 수) / (전체 분석 기간)
▶ 하락 추세 강도 = (하락 캔들 수) / (전체 분석 기간)
▶ 강도가 임계값 이상일 때 "STRONG", 미만일 때 "WEAK"로 표시
■ 추세 강도의 활용
• 신호 필터링: 추세 강도가 강할 때만 신호를 생성하여 허위 신호 감소
• 추세 확인: 현재 시장 추세의 건전성과 지속 가능성 평가
• 진입/퇴출 결정: 강한 추세에서 진입하고 약한 추세로 전환될 때 퇴출 고려
• 리스크 관리: 약한 추세에서는 포지션 크기를 줄이고, 강한 추세에서는 늘리는 전략 수립 가능
─────────────────────────────────────
◆ 실전 트레이딩 응용
■ 기관 매수 신호 활용 전략
• 추세 전환 시나리오:
▶ 설정: 하락 추세 중 강한 기관 매수 신호 발생
▶ 진입: 신호 확인 후 다음 캔들에서 매수
▶ 손절: 신호 캔들의 저점 아래
▶ 이익실현: 이전 주요 저항선 도달 시 또는 추세 강도가 약해질 때
• 추세 지속 시나리오:
▶ 설정: 상승 추세 중 조정 후 기관 매수 신호 발생
▶ 진입: 신호 확인 후 매수
▶ 손절: 최근 주요 저점 아래
▶ 이익실현: 추세 강도를 고려하여 단계적으로 이익실현
■ 기관 매도 신호 활용 전략
• 추세 전환 시나리오:
▶ 설정: 상승 추세 중 강한 기관 매도 신호 발생
▶ 진입: 신호 확인 후 다음 캔들에서 매도
▶ 손절: 신호 캔들의 고점 위
▶ 이익실현: 이전 주요 지지선 도달 시 또는 추세 강도가 약해질 때
• 추세 지속 시나리오:
▶ 설정: 하락 추세 중 반등 후 기관 매도 신호 발생
▶ 진입: 신호 확인 후 매도
▶ 손절: 최근 주요 고점 위
▶ 이익실현: 추세 강도를 고려하여 단계적으로 이익실현
■ 다중 시간프레임 접근법
• 상위 시간프레임 방향성 확인:
▶ 일봉/4시간봉에서 기관 신호 및 추세 강도 확인
▶ 주 트레이딩 방향 설정에 활용
• 하위 시간프레임 진입점 찾기:
▶ 상위 시간프레임 방향과 일치하는 하위 시간프레임 신호 대기
▶ 정밀한 진입점 포착에 활용
• 시간프레임 간 신호 일치 확인:
▶ 여러 시간프레임에서 동일한 방향의 신호가 발생할 때 신호 강도 증가
▶ 높은 확률의 트레이딩 기회 포착
─────────────────────────────────────
◆ 지표 설정 가이드
■ 주요 설정 매개변수
• Institutional Continuity Period (기관 연속성 확인 기간):
▶ 목적: 기관의 연속적인 매수/매도 활동을 확인할 기간 설정
▶ 낮은 값: 더 많은 신호 생성, 반응성 증가
▶ 높은 값: 신호 수 감소, 신뢰성 증가
• Trend Strength Threshold (추세 강도 임계값):
▶ 목적: 추세가 강하다고 판단할 최소 임계값 설정
▶ 낮은 값: 더 많은 신호, 낮은 필터링
▶ 높은 값: 더 강한 추세에서만 신호 생성, 높은 필터링
─────────────────────────────────────
◆ 다른 지표와의 시너지
• 지지/저항 레벨:
▶ 주요 지지/저항 레벨에서 발생하는 기관 신호는 확률이 더 높음
▶ 기술적 분석의 핵심 레벨과 기관 활동의 결합은 강력한 시그널 제공
• 이동평균선:
▶ 주요 이동평균선(50MA, 200MA) 근처에서 발생하는 기관 신호 주목
▶ 이동평균선 돌파와 기관 신호가 일치할 때 강한 추세 변화 가능성
• RSI/모멘텀 지표:
▶ 과매수/과매도 상태에서 발생하는 기관 신호는 반전 가능성 높임
▶ 모멘텀 다이버전스와 기관 신호의 일치는 강력한 반전 신호
• 볼륨 프로파일:
▶ 높은 볼륨 노드에서 발생하는 기관 신호는 중요한 가격 레벨 확인
▶ 주요 거래 영역에서의 기관 활동은 가격 방향에 큰 영향 미침
• 시장 구조:
▶ 주요 시장 구조(높은 고점/저점, 낮은 고점/저점) 근처에서 발생하는 기관 신호는 구조 변화 암시
▶ 시장 구조 변화와 기관 활동의 일치는 중요한 추세 전환점 표시
─────────────────────────────────────
◆ 결론
Coinbase Institutional Smart Money Detector는 코인베이스 프라임을 통한 기관 투자자들의 현물 비트코인 거래 활동을 실시간으로 추적하여 트레이더들에게 귀중한 통찰력을 제공합니다. 어떤 거래소의 비트코인 차트에도 적용 가능하기 때문에, 여러분이 선호하는 트레이딩 플랫폼에서 바로 활용할 수 있습니다.
이 지표의 핵심 가치는 일반 트레이더들이 접근하기 어려운 기관 자금 흐름 데이터를 직관적으로 시각화하여 제공한다는 점입니다. 연속적인 가격 움직임, 거래량 증가, 그리고 추세 강도를 종합적으로 분석하여 기관의 활동을 포착함으로써, 여러분은 시장의 큰 손들과 함께 움직일 수 있는 기회를 얻게 됩니다.
코인베이스 프라임 데이터를 기반으로 한 명확한 매수/매도 신호와 실시간 추세 강도 측정은 트레이더들이 시장 상황을 한눈에 파악하고 신속하게 전략적 결정을 내릴 수 있게 도와줍니다. 이 강력한 도구를 여러분의 트레이딩 전략에 통합함으로써, 시장의 스마트 머니가 어디로 흘러가는지 파악하고 그에 따라 포지셔닝할 수 있는 경쟁 우위를 확보하세요.
─────────────────────────────────────
※ 면책 조항: 모든 트레이딩 도구와 마찬가지로, Institutional Smart Money Detector는 보조 지표로 사용해야 하며 트레이딩 결정을 전적으로 의존해서는 안 됩니다. 과거의 기관 행동 패턴이 미래 시장 움직임을 보장하지는 않습니다. 항상 적절한 리스크 관리 전략을 트레이딩에 활용하세요.

Pullback Pro Dow Strategy v7 (ADX Filter)
### **Strategy Description (For TradingView)**
#### **Title:** Pullback Pro: Dow Theory & ADX Strategy
---
#### **1. Summary**
This strategy is designed to identify and trade pullbacks within an established trend, based on the core principles of Dow Theory. It uses market structure (pivot highs and lows) to determine the trend direction and an Exponential Moving Average (EMA) to pinpoint pullback entry opportunities.
To enhance trade quality and avoid ranging markets, an ADX (Average Directional Index) filter is integrated to ensure that entries are only taken when the trend has sufficient momentum.
---
#### **2. Core Logic: How It Works**
The strategy's logic is broken down into three main steps:
**Step 1: Trend Determination (Dow Theory)**
* The primary trend is identified by analyzing recent pivot points.
* An **Uptrend** is confirmed when the script detects a pattern of higher highs and higher lows (HH/HL).
* A **Downtrend** is confirmed by a pattern of lower highs and lower lows (LH/LL).
* If neither pattern is present, the strategy considers the market to be in a range and will not seek trades.
**Step 2: Entry Signal (Pullback to EMA)**
* Once a clear trend is established, the strategy waits for a price correction.
* **Long Entry:** In a confirmed uptrend, a long position is initiated when the price pulls back and crosses *under* the specified EMA.
* **Short Entry:** In a confirmed downtrend, a short position is initiated when the price rallies and crosses *over* the EMA.
**Step 3: Confirmation & Risk Management**
* **ADX Filter:** To ensure the trend is strong enough to trade, an entry signal is only validated if the ADX value is above a user-defined threshold (e.g., 25). This helps filter out weak signals during choppy or consolidating markets.
* **Stop Loss:** The initial Stop Loss is automatically and logically placed at the last market structure point:
* For long trades, it's placed at the `lastPivotLow`.
* For short trades, it's placed at the `lastPivotHigh`.
* **Take Profit:** Two Take Profit levels are calculated based on user-defined Risk-to-Reward (R:R) ratios. The strategy allows for partial profit-taking at the first target (TP1), moving the remainder of the position to the second target (TP2).
---
#### **3. Input Settings Explained**
**① Dow Theory Settings**
* **Pivot Lookback Period:** Determines the sensitivity for detecting pivot highs and lows. A smaller number makes it more sensitive to recent price swings; a larger number focuses on more significant, longer-term pivots.
**② Entry Logic (Pullback)**
* **Pullback EMA Length:** Sets the period for the Exponential Moving Average used to identify pullback entries.
**③ Risk & Exit Management**
* **Take Profit 1 R:R:** Sets the Risk-to-Reward ratio for the first take-profit target.
* **Take Profit 1 (%):** The percentage of the position to be closed when TP1 is hit.
* **Take Profit 2 R:R:** Sets the Risk-to-Reward ratio for the final take-profit target.
**④ Filters**
* **Use ADX Trend Filter:** A master switch to enable or disable the ADX filter.
* **ADX Length:** The lookback period for the ADX calculation.
* **ADX Threshold:** The minimum ADX value required to confirm a trade signal. Trades will only be placed if the ADX is above this level.
---
#### **4. Best Practices & Recommendations**
* This is a trend-following system. It is designed to perform best in markets that exhibit clear, sustained trending behavior.
* It may underperform in choppy, sideways, or strongly ranging markets. The ADX filter is designed to help mitigate this, but no filter is perfect.
* **Crucially, you must backtest this strategy thoroughly** on your preferred financial instrument and timeframe before considering any live application.
* Experiment with the `Pivot Lookback Period`, `Pullback EMA Length`, and `ADX Threshold` to optimize performance for a specific market's characteristics.
---
#### **DISCLAIMER**
This script is provided for educational and informational purposes only. It does not constitute financial advice. All trading involves a high level of risk, and past performance is not indicative of future results. You are solely responsible for your own trading decisions. The author assumes no liability for any financial losses you may incur from using this strategy. Always conduct your own research and due diligence.

KST Strategy [Skyrexio]Overview
KST Strategy leverages Know Sure Thing (KST) indicator in conjunction with the Williams Alligator and Moving average to obtain the high probability setups. KST is used for for having the high probability to enter in the direction of a current trend when momentum is rising, Alligator is used as a short term trend filter, while Moving average approximates the long term trend and allows trades only in its direction. Also strategy has the additional optional filter on Choppiness Index which does not allow trades if market is choppy, above the user-specified threshold. Strategy has the user specified take profit and stop-loss numbers, but multiplied by Average True Range (ATR) value on the moment when trade is open. The strategy opens only long trades.
Unique Features
ATR based stop-loss and take profit. Instead of fixed take profit and stop-loss percentage strategy utilizes user chosen numbers multiplied by ATR for its calculation.
Configurable Trading Periods. Users can tailor the strategy to specific market windows, adapting to different market conditions.
Optional Choppiness Index filter. Strategy allows to choose if it will use the filter trades with Choppiness Index and set up its threshold.
Methodology
The strategy opens long trade when the following price met the conditions:
Close price is above the Alligator's jaw line
Close price is above the filtering Moving average
KST line of Know Sure Thing indicator shall cross over its signal line (details in justification of methodology)
If the Choppiness Index filter is enabled its value shall be less than user defined threshold
When the long trade is executed algorithm defines the stop-loss level as the low minus user defined number, multiplied by ATR at the trade open candle. Also it defines take profit with close price plus user defined number, multiplied by ATR at the trade open candle. While trade is in progress, if high price on any candle above the calculated take profit level or low price is below the calculated stop loss level, trade is closed.
Strategy settings
In the inputs window user can setup the following strategy settings:
ATR Stop Loss (by default = 1.5, number of ATRs to calculate stop-loss level)
ATR Take Profit (by default = 3.5, number of ATRs to calculate take profit level)
Filter MA Type (by default = Least Squares MA, type of moving average which is used for filter MA)
Filter MA Length (by default = 200, length for filter MA calculation)
Enable Choppiness Index Filter (by default = true, setting to choose the optional filtering using Choppiness index)
Choppiness Index Threshold (by default = 50, Choppiness Index threshold, its value shall be below it to allow trades execution)
Choppiness Index Length (by default = 14, length used in Choppiness index calculation)
KST ROC Length #1 (by default = 10, value used in KST indicator calculation, more information in Justification of Methodology)
KST ROC Length #2 (by default = 15, value used in KST indicator calculation, more information in Justification of Methodology)
KST ROC Length #3 (by default = 20, value used in KST indicator calculation, more information in Justification of Methodology)
KST ROC Length #4 (by default = 30, value used in KST indicator calculation, more information in Justification of Methodology)
KST SMA Length #1 (by default = 10, value used in KST indicator calculation, more information in Justification of Methodology)
KST SMA Length #2 (by default = 10, value used in KST indicator calculation, more information in Justification of Methodology)
KST SMA Length #3 (by default = 10, value used in KST indicator calculation, more information in Justification of Methodology)
KST SMA Length #4 (by default = 15, value used in KST indicator calculation, more information in Justification of Methodology)
KST Signal Line Length (by default = 10, value used in KST indicator calculation, more information in Justification of Methodology)
User can choose the optimal parameters during backtesting on certain price chart.
Justification of Methodology
Before understanding why this particular combination of indicator has been chosen let's briefly explain what is KST, Williams Alligator, Moving Average, ATR and Choppiness Index.
The KST (Know Sure Thing) is a momentum oscillator developed by Martin Pring. It combines multiple Rate of Change (ROC) values, smoothed over different timeframes, to identify trend direction and momentum strength. First of all, what is ROC? ROC (Rate of Change) is a momentum indicator that measures the percentage change in price between the current price and the price a set number of periods ago.
ROC = 100 * (Current Price - Price N Periods Ago) / Price N Periods Ago
In our case N is the KST ROC Length inputs from settings, here we will calculate 4 different ROCs to obtain KST value:
KST = ROC1_smooth × 1 + ROC2_smooth × 2 + ROC3_smooth × 3 + ROC4_smooth × 4
ROC1 = ROC(close, KST ROC Length #1), smoothed by KST SMA Length #1,
ROC2 = ROC(close, KST ROC Length #2), smoothed by KST SMA Length #2,
ROC3 = ROC(close, KST ROC Length #3), smoothed by KST SMA Length #3,
ROC4 = ROC(close, KST ROC Length #4), smoothed by KST SMA Length #4
Also for this indicator the signal line is calculated:
Signal = SMA(KST, KST Signal Line Length)
When the KST line rises, it indicates increasing momentum and suggests that an upward trend may be developing. Conversely, when the KST line declines, it reflects weakening momentum and a potential downward trend. A crossover of the KST line above its signal line is considered a buy signal, while a crossover below the signal line is viewed as a sell signal. If the KST stays above zero, it indicates overall bullish momentum; if it remains below zero, it points to bearish momentum. The KST indicator smooths momentum across multiple timeframes, helping to reduce noise and provide clearer signals for medium- to long-term trends.
Next, let’s discuss the short-term trend filter, which combines the Williams Alligator and Williams Fractals. Williams Alligator
Developed by Bill Williams, the Alligator is a technical indicator that identifies trends and potential market reversals. It consists of three smoothed moving averages:
Jaw (Blue Line): The slowest of the three, based on a 13-period smoothed moving average shifted 8 bars ahead.
Teeth (Red Line): The medium-speed line, derived from an 8-period smoothed moving average shifted 5 bars forward.
Lips (Green Line): The fastest line, calculated using a 5-period smoothed moving average shifted 3 bars forward.
When the lines diverge and align in order, the "Alligator" is "awake," signaling a strong trend. When the lines overlap or intertwine, the "Alligator" is "asleep," indicating a range-bound or sideways market. This indicator helps traders determine when to enter or avoid trades.
The next indicator is Moving Average. It has a lot of different types which can be chosen to filter trades and the Least Squares MA is used by default settings. Let's briefly explain what is it.
The Least Squares Moving Average (LSMA) — also known as Linear Regression Moving Average — is a trend-following indicator that uses the least squares method to fit a straight line to the price data over a given period, then plots the value of that line at the most recent point. It draws the best-fitting straight line through the past N prices (using linear regression), and then takes the endpoint of that line as the value of the moving average for that bar. The LSMA aims to reduce lag and highlight the current trend more accurately than traditional moving averages like SMA or EMA.
Key Features:
It reacts faster to price changes than most moving averages.
It is smoother and less noisy than short-term EMAs.
It can be used to identify trend direction, momentum, and potential reversal points.
ATR (Average True Range) is a volatility indicator that measures how much an asset typically moves during a given period. It was introduced by J. Welles Wilder and is widely used to assess market volatility, not direction.
To calculate it first of all we need to get True Range (TR), this is the greatest value among:
High - Low
abs(High - Previous Close)
abs(Low - Previous Close)
ATR = MA(TR, n) , where n is number of periods for moving average, in our case equals 14.
ATR shows how much an asset moves on average per candle/bar. A higher ATR means more volatility; a lower ATR means a calmer market.
The Choppiness Index is a technical indicator that quantifies whether the market is trending or choppy (sideways). It doesn't indicate trend direction — only the strength or weakness of a trend. Higher Choppiness Index usually approximates the sideways market, while its low value tells us that there is a high probability of a trend.
Choppiness Index = 100 × log10(ΣATR(n) / (MaxHigh(n) - MinLow(n))) / log10(n)
where:
ΣATR(n) = sum of the Average True Range over n periods
MaxHigh(n) = highest high over n periods
MinLow(n) = lowest low over n periods
log10 = base-10 logarithm
Now let's understand how these indicators work in conjunction and why they were chosen for this strategy. KST indicator approximates current momentum, when it is rising and KST line crosses over the signal line there is high probability that short term trend is reversing to the upside and strategy allows to take part in this potential move. Alligator's jaw (blue) line is used as an approximation of a short term trend, taking trades only above it we want to avoid trading against trend to increase probability that long trade is going to be winning.
Almost the same for Moving Average, but it approximates the long term trend, this is just the additional filter. If we trade in the direction of the long term trend we increase probability that higher risk to reward trade will hit the take profit. Choppiness index is the optional filter, but if it turned on it is used for approximating if now market is in sideways or in trend. On the range bounded market the potential moves are restricted. We want to decrease probability opening trades in such condition avoiding trades if this index is above threshold value.
When trade is open script sets the stop loss and take profit targets. ATR approximates the current volatility, so we can make a decision when to exit a trade based on current market condition, it can increase the probability that strategy will avoid the excessive stop loss hits, but anyway user can setup how many ATRs to use as a stop loss and take profit target. As was said in the Methodology stop loss level is obtained by subtracting number of ATRs from trade opening candle low, while take profit by adding to this candle's close.
Backtest Results
Operating window: Date range of backtests is 2023.01.01 - 2025.05.01. It is chosen to let the strategy to close all opened positions.
Commission and Slippage: Includes a standard Binance commission of 0.1% and accounts for possible slippage over 5 ticks.
Initial capital: 10000 USDT
Percent of capital used in every trade: 60%
Maximum Single Position Loss: -5.53%
Maximum Single Profit: +8.35%
Net Profit: +5175.20 USDT (+51.75%)
Total Trades: 120 (56.67% win rate)
Profit Factor: 1.747
Maximum Accumulated Loss: 1039.89 USDT (-9.1%)
Average Profit per Trade: 43.13 USDT (+0.6%)
Average Trade Duration: 27 hours
These results are obtained with realistic parameters representing trading conditions observed at major exchanges such as Binance and with realistic trading portfolio usage parameters.
How to Use
Add the script to favorites for easy access.
Apply to the desired timeframe and chart (optimal performance observed on 1h BTC/USDT).
Configure settings using the dropdown choice list in the built-in menu.
Set up alerts to automate strategy positions through web hook with the text: {{strategy.order.alert_message}}
Disclaimer:
Educational and informational tool reflecting Skyrexio commitment to informed trading. Past performance does not guarantee future results. Test strategies in a simulated environment before live implementation.

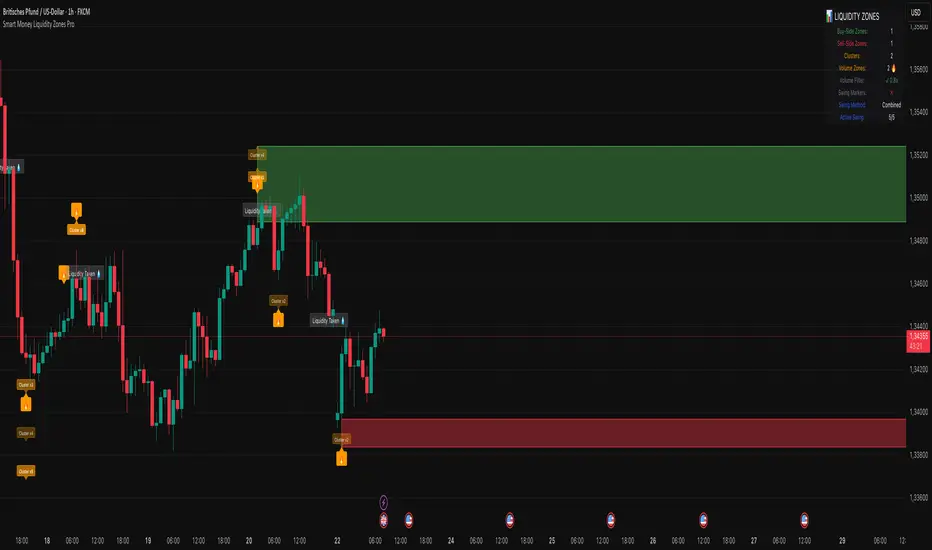
Smart Money Liquidity Zones ProThe Smart Money Liquidity Zones Pro indicator identifies and visualizes key liquidity areas in the market where institutional traders (smart money) are likely to have placed their stop-loss orders. These zones represent areas of high liquidity that often act as magnets for price, making them valuable reference points for trading decisions.
What the Indicator Does
Core Functionality
Swing Point Detection: The indicator identifies significant swing highs and lows using three different methods (Classic, Fractal, or Combined) to locate potential liquidity pools.
Liquidity Zone Creation: At each valid swing point, the indicator creates a horizontal zone representing an area where stop-loss orders are likely clustered.
Zone Clustering: When multiple swing points occur near the same price level, the indicator intelligently combines them into larger cluster zones, indicating stronger liquidity areas.
Volume Confirmation: The indicator can filter zones based on volume, showing only those swing points that occurred with significant trading volume.
Zone Break Detection: When price closes through a liquidity zone, the indicator marks it as "Liquidity Taken" and removes the zone from the chart.
Zone Types
Buy-Side Liquidity Zones (Green): Created at swing highs where short sellers' stop-losses are likely placed
Sell-Side Liquidity Zones (Red): Created at swing lows where long traders' stop-losses are likely placed
Trading Strategies
Basic Concepts
Liquidity Runs: Price often moves toward these zones to trigger stop-loss orders before reversing. This creates trading opportunities.
Support and Resistance: Unbroken liquidity zones can act as support (sell-side) or resistance (buy-side) levels.
Breakout Confirmation: When price breaks through a zone with strong momentum, it often continues in that direction.
Entry Strategies
Strategy 1: Liquidity Grab Reversa l
Wait for price to spike into a liquidity zone
Look for rejection candles (wicks) at the zone
Enter in the opposite direction after confirmation
Place stop-loss beyond the liquidity zone
Strategy 2: Zone Break Continuation
Wait for price to close decisively through a zone
Enter on the retest of the broken zone
Target the next liquidity zone in the direction of the break
Strategy 3: Zone Clustering Trade
Focus on areas with multiple overlapping zones (clusters)
These areas offer higher probability setups
Trade bounces from cluster zones with tighter risk management
Risk Management
Always use stop-losses beyond the liquidity zones
Consider the overall market context and trend
Zones on higher timeframes are generally more significant
Volume-confirmed zones have higher reliability
Settings Explanation
Swing Detection Settings
Swing Strength (Lookback Bars)
Determines how many bars to look back for swing point validation
Higher values find more significant swings but fewer zones
Recommended settings:
1m-5m charts: 3-5
15m-1h charts: 5-8
Daily charts: 5-10
Weekly charts: 3-5
Monthly charts: 2-3
Adaptive Swing Detection
Automatically adjusts swing detection based on available historical data
Prevents errors when there's limited chart history
Recommended to keep enabled
Minimum Bars for Swing
Sets the absolute minimum bars required for swing detection
Lower values allow detection in limited data conditions
Swing Detection Method
Classic: Strict price comparison for pure swing highs/lows
Fractal: Williams Fractal pattern (2 bars on each side)
Combined: Uses both methods for maximum zone detection
Auto-Adjust for Timeframe
Automatically optimizes settings based on chart timeframe
Prevents inappropriate settings on higher timeframes
Zone Settings
Max Number of Visible Zones
Limits the number of zones displayed to prevent chart clutter
Older zones are automatically removed
Max Zone Duration (Bars)
Zones older than this are automatically deleted
Keeps the chart focused on recent liquidity areas
Enable Zone Clustering
Groups nearby zones into larger clusters
Identifies stronger liquidity areas
Cluster Threshold (%)
Maximum price distance for zones to be clustered
Lower values create tighter clusters
Show Cluster Labels
Displays "Cluster x2", "Cluster x3" etc. on grouped zones
Volume Filter Settings
Enable Volume Filter
When enabled, only creates zones at high-volume swing points
Increases zone quality but reduces quantity
Volume Multiplier
Multiplier for average volume to determine "high volume"
Lower values (0.7-0.9) create more zones
Higher values (1.2+) create fewer, higher-quality zones
Volume SMA Period
Period for calculating average volume
Higher values create smoother volume baseline
Show Volume Confirmation Icon
Displays a fire emoji on volume-confirmed zones
Volume Visualization Settings
Show Volume Dots
Displays dots below high-volume bars
Dynamic Zone Colors
Volume-confirmed zones appear with more intense colors
Show Volume Background
Highlights the chart background on high-volume bars
Visual Settings
Buy-Side/Sell-Side Zone Colors
Customize colors for long and short liquidity zones
Border Width
Thickness of zone borders (1-3)
Show 'Liquidity Taken' Labels
Displays labels when zones are broken
Label Size
Size of the liquidity taken labels
Show Swing Point Markers
Displays triangles at detected swing points
Show Debug Info
Shows diagnostic information for troubleshooting
Dashboard Settings
Show Dashboard
Toggles the information panel display
Dashboard Position
Choose from 6 positions on the chart
Background Color
Dashboard background color
Text Color
Dashboard text color
Text Size
Dashboard text size (tiny/small/normal/large)
Tips for Effective Use
Start with default settings and adjust based on your trading style and timeframe
Use multiple timeframes to identify confluence between zones on different scales
Combine with other indicators like trend analysis or momentum oscillators
Pay attention to clusters as they represent stronger liquidity areas
Monitor volume-confirmed zones for higher probability setups
Adjust zone duration based on your trading timeframe (shorter for scalping, longer for swing trading)
Use the debug feature if zones aren't appearing to understand why
Keep the chart clean by limiting the number of visible zones
Common Issues and Solutions
No zones appearing:
Lower the Swing Strength setting
Switch to Combined detection method
Disable volume filter if active
Check if there's enough historical data
Too many zones:
Increase Swing Strength
Enable volume filter
Reduce Max Number of Visible Zones
Increase Cluster Threshold
Zones disappearing too quickly:
Increase Max Zone Duration
Check if zones are being broken by price
Poor performance on higher timeframes:
Enable Auto-Adjust for Timeframe
Use appropriate Swing Strength for the timeframe
Consider using Classic method instead of Fractal
PineConnector [Extension] | FractalystWhat is the PineConnector Extension?
The PineConnector Extension is a sophisticated bridge indicator designed to seamlessly connect Quantify trading signals with PineConnector's automated execution system.
This extension transforms manual signal monitoring into fully automated trading by interpreting Quantify's signal outputs and converting them into executable PineConnector commands.
Unlike standalone trading indicators, this extension serves as a communication layer between your signal generation (Quantify indicator) and trade execution (PineConnector), enabling hands-free trading across multiple timeframes and instruments.
How does the signal processing work?
The extension processes four distinct signal types from Quantify indicators:
Signal Values:
1 = Buy/Long signal - Opens bullish positions
-1 = Sell/Short signal - Opens bearish positions
0.5 = Close Long - Closes all long positions
-0.5 = Close Short - Closes all short positions
The script continuously monitors the "Signal Source" input, which should be connected to any Quantify indicator's output. When a signal is detected, the extension automatically generates the corresponding PineConnector command with your configured parameters.
What are the available order types and how do they work?
The extension supports three order execution modes:
Market Orders:
- Execute immediately at current market price
- Highest execution probability
- Subject to slippage during volatile conditions
Limit Orders:
- Execute only when price reaches a more favorable level
- Buy limits placed below current price
- Sell limits placed above current price
- Dynamic pip offset calculated using ATR-based volatility
Stop Orders:
- Execute when price breaks beyond specified levels
- Buy stops placed above current price
- Sell stops placed below current price
- Useful for breakout strategies
Dynamic Pricing Calculation:
The extension calculates optimal entry prices using volatility-adjusted pip offsets:
priceVolatility = ta.atr(14) / close * 100
volatilityFactor = math.min(math.max(priceVolatility / 0.1, 0.5), 2.0)
pipsOffset = 10 * volatilityFactor
How does the risk management system work?
Risk Percentage:
The extension uses percentage-based position sizing where you specify the risk per trade (0.1% to 10.0%). This value is passed to PineConnector, which calculates the exact position size based on:
- Account balance
- Stop loss distance
- Instrument specifications
- Broker settings
Stop Loss Integration:
- The "Stop Source" input connects to external stop loss levels from Quantify or other indicators. - This ensures:
- Consistent risk-reward ratios
- Dynamic stop placement based on market structure
- Automatic position sizing calculations
Multi-Asset Compatibility:
The extension automatically detects instrument types and adjusts pip calculations:
Forex: mintick * 10
Crypto: mintick * 10
Other assets: mintick * 1
What does the information display table show?
The real-time status table provides essential configuration monitoring:
Status Indicators:
- License: Shows PineConnector license ID status (Blue = Set, Red = Missing)
- Security: Displays secret key status (Blue = Set, Orange = Disabled)
- Comment: Shows trade comment or timeframe if empty
- Symbol: Current trading symbol (manual override or chart symbol)
- Order Type: Active execution mode (Market/Limit/Stop)
- Risk: Risk percentage with color coding (Blue ≤1%, Orange >1%)
- Signal: Connection status (Blue = Connected, Red = Not Set)
- Stop: Stop loss source status (Blue = Connected, Red = Not Set)
Color Coding System:
Blue: Optimal/Connected
Orange: Warning/Moderate risk
Red: Error/Not configured
How do I connect this to my Quantify indicator?
Step-by-Step Connection:
Add the PineConnector Extension to your chart containing Quantify indicator
Configure Signal Source:
In the extension settings, locate "Signal Source"
Click the dropdown and select your Quantify indicator's signal output
The extension will automatically detect custom sources vs. default price data
Configure Stop Source:
Connect "Stop Source" to your Quantify indicator's stop loss output
This enables dynamic position sizing based on stop distance
Verify Connection:
Check the information table for "Signal" and "Stop" status
Blue indicates successful connection
Red indicates default price data (not connected)
Compatible Quantify Indicators:
- Quantify Trading Model
- Any indicator outputting standardized signals (1, -1, 0.5, -0.5)
What PineConnector setup is required?
Prerequisites:
- Active PineConnector License - Required for all functionality
- MetaTrader 4/5 or supported broker platform
- PineConnector EA installed and configured
- TradingView Pro/Pro+/Premium for alert functionality
Configuration Steps:
- License ID: Enter your PineConnector license ID in the extension
- Secret Key: Optional security layer for command verification
- Symbol Mapping: Ensure symbol names match between TradingView and broker
- Alert Setup: Create TradingView alerts using this indicator
- Webhook Configuration: Point alerts to your PineConnector webhook URL
Security Features:
- Optional secret key encryption
- Symbol-specific commands
- Debug mode for testing and validation
What makes this extension unique?
Seamless Integration:
- Unlike manual signal copying, this extension provides:
- Zero-latency signal translation
- Automated parameter passing
- Consistent execution across timeframes
- No human intervention required
Dynamic Adaptability:
Volatility-adjusted pricing for limit/stop orders
Automatic symbol detection and conversion
Multi-asset pip calculations
Intelligent timeframe formatting
Professional Risk Management:
- Percentage-based position sizing
- External stop loss integration
- Multi-order type support
- Real-time status monitoring
Robust Architecture:
- Error-resistant signal processing
- Comprehensive input validation
- Debug and testing capabilities
- Security features for live trading
Installation and Setup Guide
Quick Start:
- Add "PineConnector | Fractalyst" to your chart
- Configure your PineConnector license ID
- Connect Signal Source to your Quantify indicator
- Connect Stop Source to your stop loss indicator
- Set your preferred risk percentage
- Choose order type (Market recommended for beginners)
- Create TradingView alert using this indicator
- Ensure PineConnector EA is running on your trading platform
Advanced Configuration:
- Custom symbol mapping for cross-platform trading
- Secret key implementation for enhanced security
- Comment customization for trade tracking
- Debug mode for strategy validation
Legal Disclaimers and Risk Acknowledgments
Trading Risk Disclosure
This PineConnector Extension is provided for informational, educational, and automation purposes only and should not be construed as financial, investment, or trading advice. The extension facilitates automated trading connections but does not guarantee profitable outcomes, successful trade execution, or positive investment returns.
Automated trading systems carry substantial risks including but not limited to total capital loss, system failures, connectivity issues, and adverse market conditions. The extension's performance depends on multiple third-party services including PineConnector, MetaTrader platforms, TradingView infrastructure, and broker execution quality, any of which may experience downtime, technical failures, or service interruptions that could affect trading performance.
System Dependency Acknowledgment
The extension requires continuous operation of multiple interconnected systems: TradingView charts and alerts, PineConnector services and Expert Advisors, MetaTrader platforms, broker connectivity, and stable internet connections. Any interruption or malfunction in these systems may result in missed signals, failed executions, or unexpected trading behavior.
Users acknowledge that neither the seller nor the creator of this extension has control over these third-party services and cannot guarantee their availability, accuracy, or performance. Market conditions, broker execution policies, slippage, and technical factors may significantly affect actual trading results compared to theoretical or backtested performance.
Liability Limitation
By utilizing this extension, users acknowledge and agree that they assume full responsibility and liability for all trading decisions, financial outcomes, and potential losses resulting from the use of this automated trading system. Neither the seller nor the creator shall be liable for any unfavorable outcomes, financial losses, missed opportunities, or damages resulting from the development, use, malfunction, or performance of this extension.
Past performance of connected indicators, strategies, or the extension itself does not guarantee future results. Trading outcomes depend on numerous factors including market conditions, economic events, broker execution quality, network connectivity, and proper system configuration, all of which are beyond the control of the extension creator.
User Responsibility Statement
Users are solely responsible for understanding the risks associated with automated trading, properly configuring all system components, maintaining adequate capitalization and risk management, and regularly monitoring system performance. Users should thoroughly test the extension in demo environments before live deployment and should never risk more capital than they can afford to lose.
This extension is designed to automate signal execution but does not replace the need for proper risk management, market understanding, and trading discipline. Users should maintain active oversight of their automated trading systems and be prepared to intervene manually when necessary.

Momentum Flip Pro - Advanced ZigZag Trading SystemMomentum Flip Pro - Advanced ZigZag Trading System
Complete User Guide
📊 What This Indicator Does
The Momentum Flip Pro is an advanced position-flipping trading system that automatically identifies trend reversals using ZigZag patterns combined with momentum analysis. It's designed for traders who want to always be in the market, flipping between long and short positions at optimal reversal points.
Key Features:
Automatically flips positions at each ZigZag reversal point
Dynamic stop loss placement at exact ZigZag levels
Real-time trading dashboard with performance metrics
Capital tracking and ROI calculation
Three momentum engines to choose from
🎯 How It Works
Entry Signal: When a ZigZag point appears (circle on chart), the indicator:
Exits current position (if any)
Immediately enters opposite position
Places stop loss at the exact ZigZag price
Exit Signal: Positions are closed when the next ZigZag appears, then immediately reversed
Position Management:
Long Entry: ZigZag bottom (momentum turns UP)
Short Entry: ZigZag peak (momentum turns DOWN)
Stop Loss: Always at the ZigZag entry price
Take Profit: Next ZigZag point (automatic position flip)
⚙️ Recommended Settings
For Day Trading (5m-15m timeframes):
Momentum Engine: Quantum
- RSI Length: 9-12
- Quantum Factor: 3.5-4.0
- RSI Smoothing: 3-5
- Threshold: 8-10
For Swing Trading (1H-4H timeframes):
Momentum Engine: MACD
- Fast Length: 12
- Slow Length: 26
- Signal Smoothing: 9
- MA Type: EMA
For Position Trading (Daily):
Momentum Engine: Moving Average
- Average Type: EMA or HMA
- Length: 20-50
📈 How to Use for Trading
Add to Chart:
Add indicator to your chart
Set your starting capital
Choose your preferred momentum engine
Understanding Signals:
Green circles: Strong bullish momentum reversal
Red circles: Strong bearish momentum reversal
Purple circles: Normal momentum reversal
Entry labels: Show exact entry points with tooltips
Trading Rules:
Enter LONG when you see an up arrow + green/purple circle
Enter SHORT when you see a down arrow + red/purple circle
Stop loss is automatically at the ZigZag level
Hold until next ZigZag appears (exit + reverse)
Risk Management:
Risk per trade = Entry Price - Stop Loss
Position size = (Capital * Risk %) / Risk per trade
Recommended risk: 1-2% per trade
💡 Best Practices
Market Conditions:
Works best in trending markets
Excellent for volatile pairs (crypto, forex majors)
Avoid during low volume/consolidation
Timeframe Selection:
Lower timeframes (5m-15m): More signals, higher noise
Higher timeframes (1H+): Fewer signals, higher reliability
Sweet spot: 15m-1H for most traders
Momentum Engine Selection:
Quantum: Best for volatile markets (crypto, indices)
MACD: Best for trending markets (forex, stocks)
Moving Average: Best for smooth trends (commodities)
📊 Dashboard Interpretation
The trading dashboard shows:
Current Capital: Your running balance
Position: Current trade direction
Entry/Stop: Your risk levels
Statistics: Win rate and performance
ROI: Overall return on investment
⚠️ Important Notes
Always Active: This system is always in a position (long or short)
No Neutral: You're either long or short, never flat
Automatic Reversal: Positions flip at each signal
Stop Loss: Fixed at entry ZigZag level (doesn't trail)
🎮 Quick Start Guide
Beginners: Start with default settings on 1H timeframe
Test First: Use paper trading to understand the signals
Small Size: Begin with 1% risk per trade
Track Results: Monitor the dashboard statistics
Adjust: Fine-tune momentum settings based on results
🔧 Customization Tips
Color Signals: Enable to see momentum strength
Dashboard Position: Move to preferred screen location
Visual Settings: Adjust colors for your theme
Alerts: Set up for automated notifications
This indicator is ideal for traders who prefer an always-in-market approach with clear entry/exit rules and automated position management. The key to success is choosing the right momentum engine for your market and maintaining disciplined risk management.

Support & Resistance AriesSupport & Resistance Aries
This indicator automatically identifies support and resistance levels based on the highest and lowest closing prices within a configurable period.
How it works:
The user sets a calculation period (default is 20 candles).
The indicator plots:
Green line = Support: lowest closing price within the period.
Red line = Resistance: highest closing price within the period.
Adjustable parameter:
Calculation Period (1 to 200): defines how many candles are used to find the price extremes.
Purpose:
Helps users quickly visualize dynamic support and resistance zones that adjust as price evolves, making it easier to identify areas for potential entries, exits, and stop placements.
Important:
This indicator should not be used as a standalone buy or sell signal, nor as a trend confirmation tool on its own.
It is recommended to use it in combination with other technical analysis tools such as MACD, RSI, Volume, Moving Averages, among others, for a more complete market view.
Disclaimer:
Investing involves financial risk. Be cautious with both profits and losses. Always define a stop loss to avoid larger losses if the trend reverses.
One of the golden rules in trading is: a trader should not lose more than 3% to 5% of their capital per trade. Protecting your capital should always be the priority.

MTS📊 MTS (Murrey Math System) Trading Strategy for TradingView 📊
Introduction:
This script implements the Murrey Math System (MTS), a market analysis tool based on a set of pivot points and price ranges, designed to help traders identify key levels of support and resistance.
MTS calculates key price levels based on historical price swings and helps identify price targets, stop-loss levels, and potential breakout zones.
The strategy also includes an adaptive bias panel, showing buy or sell suggestions based on current price action relative to Murrey Math levels.
Key Components:
1. Pivot Calculation and Conditions:
Pivot Lookback & Spikeyness Index:
The pivots: lookback/forward input defines how far back (and forward) the script looks to identify potential pivot points (high and low). A smaller value focuses on more recent swings, while larger values consider a broader range.
The Spikeyness Index (atrMult) allows you to adjust sensitivity to market spikes, utilizing the Average True Range (ATR) to detect sharp price movements that could indicate potential turning points.
Pivot Conditions:
isPivHigh and isPivLow detect local high and low pivot points, respectively.
Spiky Conditions: The spikyH and spikyL conditions filter out pivots that do not meet the spikiness criteria, which is based on ATR and moving averages.
2. Swing High and Swing Low Identification:
The script identifies and stores previous swing highs (HR_prev) and lows (LR_prev), updating them based on the current market structure.
3. Proprietary Calculation:
The propCalc input enables a proprietary calculation method for determining higher or lower levels beyond the typical Murrey Math levels, offering a more adaptive approach to price targets and support/resistance levels.
4. Murrey Math Lines (MML):
MML Calculation:
The code calculates a set of Murrey Math Lines (EightEight, FourEight, ZeroEight), which are key price levels based on the range of the price over a given time period. These levels represent major support and resistance zones, with the EightEight line indicating extremely overbought conditions and ZeroEight signaling deeply oversold conditions.
Level and Extension Lines:
The script also plots additional levels and extensions based on the range between HR and LR, representing key support/resistance levels. These levels are dynamically drawn on the chart, offering clear insights into where price might reverse or break out.
Strategy Logic:
- Breakout and Breakdown:
The Bias Box panel dynamically displays a trade bias, either suggesting to "Buy on Dip" or "Sell on Rise," depending on whether the current price is above or below the midpoint of the Murrey Math range (BEP). This bias is calculated using the market's relationship to the Murrey Math Levels.
- Buy on Dip: When the price is below the midpoint (BEP), suggesting the market is in a buying zone.
- Sell on Rise: When the price is above the midpoint, suggesting the market is in a selling zone.
- Stop-Loss and Target Hints:
The stop-loss (SL) and target levels are dynamically set based on the position relative to HR and LR:
For Buy on Dip: SL is set at LR Low, Target is set at HR High.
For sell on Rise: SL is set at HR Low, Target is set at LR High.
2. Historical and Current Levels:
The script compares the most recent Murrey Math levels with historical levels. This helps identify any shifts or changes in the market structure, enhancing the trader's ability to adapt to new trends.
- Current Levels:
The current levels are drawn from the most recent HR and LR values, with corresponding extensions showing possible breakout or breakdown zones.
- Historical Levels:
Historical levels are drawn in a "ghost" style, helping traders visualize past market conditions and potential support/resistance zones that could still influence price movement.
- Trade Examples:
Example 1: Buy on Dip
a. Scenario:
Price is below the midpoint (BEP), and the bias suggests a buy on dip.
The trader looks for a rebound from the LR Low level, with a target at the HR High.
b. Entry:
Buy when the price reaches the LR Low level.
c. Exit:
Take profit when the price hits the HR High.
d. Stop-Loss:
Place stop-loss at the LR Low.
Example 2: Sell on Rise
a. Scenario:
Price is above the midpoint (BEP), and the bias suggests a sell on rise.
The trader looks for a pullback to the HR Low, with a target at the LR High.
b. Entry:
Sell when the price reaches the HR High level.
c. Exit:
Take profit when the price hits the LR Low.
d. Stop-Loss:
Place stop-loss at the HR Low.
Key Features:
Bias Panel: A table in the top-right corner showing the current market bias (Buy on Dip, Sell on Rise, or Neutral).
Displays real-time trade direction and risk information, such as stop-loss and target hints.
Dynamic Level Adjustment: As the price moves, the script dynamically updates the key levels (HR, LR, and Murrey Math lines), keeping traders aware of the most recent market structure.
Visualization Tools:
The chart is populated with a series of lines and labels that indicate the critical price levels for trading.
Support/Resistance Lines: Each key level is marked with different colors for quick recognition.
Extensions: Additional lines are plotted based on price projections, indicating where the market could potentially move.
Note:
Please note that this is an educational purpose idea, any action/trade taken will be user's own responsibility.
Enjoy!
Regards.

Reversal Trading Bot Strategy[BullByte]Overview :
The indicator Reversal Trading Bot Strategy is crafted to capture potential market reversal points by combining momentum, volatility, and trend alignment filters. It uses a blend of technical indicators to identify both bullish and bearish reversal setups, ensuring that multiple market conditions are met before entering a trade.
Core Components :
Technical Indicators Used :
RSI (Relative Strength Index) :
Purpose : Detects divergence conditions by comparing recent lows/highs in price with the RSI.
Parameter : Length of 8.
Bollinger Bands (BB) :
Purpose : Measures volatility and identifies price levels that are statistically extreme.
Parameter : Length of 20 and a 2-standard deviation multiplier.
ADX (Average Directional Index) & DMI (Directional Movement Index) :
Purpose : Quantifies the strength of the trend. The ADX threshold is set at 20, and additional filters check for the alignment of the directional indicators (DI+ and DI–).
ATR (Average True Range) :
Purpose : Provides a volatility measure used to set stop levels and determine risk through trailing stops.
Volume SMA (Simple Moving Average of Volume ):
Purpose : Helps confirm strength by comparing the current volume against a 20-period average, with an optional filter to ensure volume is at least twice the SMA.
User-Defined Toggle Filters :
Volume Filter : Confirms that the volume is above average (or twice the SMA) before taking trades.
ADX Trend Alignment Filter : Checks that the ADX’s directional indicators support the trade direction.
BB Close Confirmation : Optionally refines the entry by requiring price to be beyond the upper or lower Bollinger Band rather than just above or below.
RSI Divergence Exit : Allows the script to close positions if RSI divergence is detected.
BB Mean Reversion Exit : Closes positions if the price reverts to the Bollinger Bands’ middle line.
Risk/Reward Filter : Ensures that the potential reward is at least twice the risk by comparing the distance to the Bollinger Band with the ATR.
Candle Movement Filter : Optional filter to require a minimum percentage move in the candle to confirm momentum.
ADX Trend Exit : Closes positions if the ADX falls below the threshold and the directional indicators reverse.
Entry Conditions :
Bullish Entry :
RSI Divergence : Checks if the current close is lower than a previous low while the RSI is above the previous low, suggesting bullish divergence.
Bollinger Confirmation : Requires that the price is above the lower (or upper if confirmation is toggled) Bollinger Band.
Volume & Trend Filters : Combines volume condition, ADX strength, and an optional candle momentum condition.
Risk/Reward Check : Validates that the trade meets a favorable risk-to-reward ratio.
Bearish Entry :
Uses a mirror logic of the bullish entry by checking for bearish divergence, ensuring the price is below the appropriate Bollinger level, and confirming volume, trend strength, candle pattern, and risk/reward criteria.
Trade Execution and Exit Strateg y:
Trade Execution :
Upon meeting the entry conditions, the strategy initiates a long or short position.
Stop Loss & Trailing Stops :
A stop-loss is dynamically set using the ATR value, and trailing stops are implemented as a percentage of the close price.
Exit Conditions :
Additional exit filters can trigger early closures based on RSI divergence, mean reversion (via the middle Bollinger Band), or a weakening trend as signaled by ADX falling below its threshold.
This multi-layered exit strategy is designed to lock in gains or minimize losses if the market begins to reverse unexpectedly.
How the Strategy Works in Different Market Conditions :
Trending Markets :
The ADX filter ensures that trades are only taken when the trend is strong. When the market is trending, the directional movement indicators help confirm the momentum, making the reversal signal more reliable.
Ranging Markets :
In choppy markets, the Bollinger Bands expand and contract, while the RSI divergence can highlight potential turning points. The optional filters can be adjusted to avoid false signals in low-volume or low-volatility conditions.
Volatility Management :
With ATR-based stop-losses and a risk/reward filter, the strategy adapts to current market volatility, ensuring that risk is managed consistently.
Recommendation on using this Strategy with a Trading Bot :
This strategy is well-suited for high-frequency trading (HFT) due to its ability to quickly identify reversal setups and execute trades dynamically with automated stop-loss and trailing exits. By integrating this script with a TradingView webhook-based bot or an API-driven execution system, traders can automate trade entries and exits in real-time, reducing manual execution delays and capitalizing on fast market movements.
Disclaimer :
This script is provided for educational and informational purposes only. It is not intended as investment advice. Trading involves significant risk, and you should always conduct your own research and analysis before making any trading decisions. The author is not responsible for any losses incurred while using this script.

Sniper Trade Pro (ES 15-Min) - Topstep Optimized🔹 Overview
Sniper Trade Pro is an advanced algorithmic trading strategy designed specifically for E-mini S&P 500 (ES) Futures on the 15-minute timeframe. This strategy is optimized for Topstep 50K evaluations, incorporating strict risk management to comply with their max $1,000 daily loss limit while maintaining a high probability of success.
It uses a multi-confirmation approach, integrating:
✅ Money Flow Divergence (MFD) → To track liquidity imbalances and institutional accumulation/distribution.
✅ Trend Confirmation (EMA + VWAP) → To identify strong trend direction and avoid choppy markets.
✅ ADX Strength Filter → To ensure entries only occur in trending conditions, avoiding weak setups.
✅ Break-Even & Dynamic Stop-Losses → To reduce drawdowns and protect profits dynamically.
This script automatically generates Buy and Sell signals and provides built-in risk management for automated trading execution through TradingView Webhooks.
🔹 How Does This Strategy Work?
📌 1. Trend Confirmation (EMA + VWAP)
The strategy uses:
✔ 9-EMA & 21-EMA: Fast-moving averages to detect short-term momentum.
✔ VWAP (Volume-Weighted Average Price): Ensures trades align with institutional volume flow.
How it works:
Bullish Condition: 9-EMA above 21-EMA AND price above VWAP → Confirms buy trend.
Bearish Condition: 9-EMA below 21-EMA AND price below VWAP → Confirms sell trend.
📌 2. Liquidity & Money Flow Divergence (MFD)
This indicator measures liquidity shifts by tracking momentum changes in price and volume.
✔ MFD Calculation:
Uses Exponential Moving Average (EMA) of Momentum (MOM) to detect changes in buying/selling pressure.
If MFD is above its moving average, it signals liquidity inflows → bullish strength.
If MFD is below its moving average, it signals liquidity outflows → bearish weakness.
Why is this important?
Detects when Smart Money is accumulating or distributing before major moves.
Filters out false breakouts by confirming momentum strength before entry.
📌 3. Trade Entry Triggers (Candlestick Patterns & ADX Filter)
To avoid random entries, the strategy waits for specific candlestick confirmations with ADX trend strength:
✔ Bullish Entry (Buy Signal) → Requires:
Bullish Engulfing Candle (Reversal confirmation)
ADX > 20 (Ensures strong trending conditions)
MFD above its moving average (Liquidity inflows)
9-EMA > 21-EMA & price above VWAP (Trend confirmation)
✔ Bearish Entry (Sell Signal) → Requires:
Bearish Engulfing Candle (Reversal confirmation)
ADX > 20 (Ensures strong trending conditions)
MFD below its moving average (Liquidity outflows)
9-EMA < 21-EMA & price below VWAP (Trend confirmation)
📌 4. Risk Management & Profit Protection
This strategy is built with strict risk management to maintain low drawdowns and maximize profits:
✔ Dynamic Position Sizing → Automatically adjusts trade size to risk a fixed $400 per trade.
✔ Adaptive Stop-Losses → Uses ATR-based stop-loss (0.8x ATR) to adapt to market volatility.
✔ Take-Profit Targets → Fixed at 2x ATR for a Risk:Reward ratio of 2:1.
✔ Break-Even Protection → Moves stop-loss to entry once price moves 1x ATR in profit, locking in gains.
✔ Max Daily Loss Limit (-$1,000) → Stops trading if total losses exceed $1,000, complying with Topstep rules.

IronBot v4IronBot v4 – Trading Strategy Overview
1. Quick Context
IronBot v4 is a trading strategy designed for users who want a simple yet effective approach to reading the markets. It uses a combination of Fibonacci retracement levels, custom logic triggers, and innovative modules (EMA validation, Iron Impulse Shield and Iron Auto Volume Detector) to identify potential entry and exit points, strengthening the strategy’s detection of sudden market volatility or shifts in trading volume.
2. Theoretical Details
Fibonacci Analysis
The script identifies recent market highs and lows, then calculates key Fibonacci levels (high- and low-based). These levels can help confirm potential reversals or trends.
EMA Option
When enabled, the exponential moving average (EMA) offers additional validation for trade entries. If the current price remains above a certain EMA threshold, long positions may be favored; conversely, if it stays below the EMA, short positions may be initiated.
IIS (Iron Impulse Shield)
IIS helps to filter out risky trades by measuring recent price shocks or surges. If an extreme movement is detected, the strategy may temporarily disable longs or shorts to avoid false signals.
IAVD (Iron Auto Volume Detector)
This functionality automatically detects the average market volume over a defined period (regardless of the market, since it relies on real data). When entering a position, it ensures that overall volume is high enough to confirm a genuinely active, robust market. By providing an additional filter, it can strengthen the decision-making process whenever the market’s participation level is in question.
Panel
IronBot v4 displays a real-time backtest panel that summarizes the selected configuration (including the current pair, analysis window, enabled filters), as well as showing net profit, applicable exchange fees, country taxes, and the final net balance. This gives traders an immediate overview of strategy performance and risk metrics.
What Pinescript Adds Visually
The script plots:
Fibonacci levels (highlighting potential reversal zones)
Trend lines indicating bullish (green) or bearish (red) lean
Optional EMA line
Optional Fibonacci forecast lines for anticipating future moves
Automatic labeling of entry, take-profit, and stop-loss levels, indicating the profit percentage of each trade.
3. Explanation of Inputs
The strategy exposes multiple inputs that can be toggled or configured by the user:
Analysis Window : Dictates how many bars to consider for high/low calculations and the fib retracement thresholds.
TRADES
Display TP/SL: For displaying Take profits and Stop loss.
Display Forecast: When enabled, this feature calculates and projects possible future Fibonacci retracements using historical data, helping traders anticipate potential upcoming trade setups.
Leverage: Only used for the Panel and not for trades. Lets you amplify your position size; higher leverage increases potential gains but also heightens risk. TradingView strategy is using properties for doing this.
Exchange Maker Fees & Exchange Taker Fees: Only used for the Panel and not for trades. Define the percentage cost applied by your exchange for maker and taker trades, respectively. These fees are accounted for in final profit calculations of the Panel.
Country Tax: Only used for the Panel and not for trades. Specifies a tax percentage to be deducted from net profits.
STOP LOSS and TAKE PROFITS
Stop-Loss & Take-Profit Parameters: Controls the percentage distances at which the strategy will exit positions. Additionally, you can configure up to four distinct take-profit levels (TP1 through TP4). Each level should be higher target than the previous one, and you can assign a specific percentage of the total position to close at each TP, ensuring the sum equals 100%. A break-even feature is also available when multiple TPs are used.
EMA
EMA (Exponential Moving Average) Option: When enabled, the strategy opens long trades only if the current price is above the specified EMA length, and opens short trades only if it is below that threshold.
PANELS
Show Panel: For displaying the backtest integrated panel.
IRON IMPULSE SHIELD (IIS)
IIS (Iron Impulse Shield) Option: When enabled, IIS continuously monitors recent price volatility depending on the analysis window set. If the market experiences an extreme surge or drop beyond a specified threshold, IIS temporarily blocks new long or short positions.
IRON AUTO VOLUME DETECTOR (IAVD)
IAVD (Iron Auto Volume Detector) Option: When enabled, it continuously measures the average market volume over a special period, irrespective of the specific trading pair. This ensures that IronBot v4 focuses on markets with robust participation, reducing the likelihood of entering trades during low-liquidity conditions.
By changing these values, IronBot v4 reacts differently to market structure and risk management requirements. Stop-loss and take-profit levels will adjust accordingly, while advanced filters (like EMA or IIS) influence when trades can open.
4. TradingView Strategy Properties
IronBot v4 uses the built-in TradingView “strategy” functionality. In particular:
Order Placement: The code calls strategy.entry() and strategy.close() for direct orders, ensuring signals are sent immediately (no limit orders are used). This helps connect with exchange signal bots for automated execution.
Initial Capital: The code uses initial capital defined in properties for calculating Net balance in the integrated panel.
On bar close: This strategy fill orders on bar close.
Pyramiding: This strategy can take only 1 successive trade in the same direction
Be careful to configure your leverage input depending on your strategy properties.
5. Visualization
5. Purpose & Disclaimer
This script is for educational purposes only and does not constitute financial advice. Past performance does not guarantee future results. Always confirm your own risk tolerance and consult a financial professional before placing live trades. Trading leveraged products can involve substantial risk of loss.

[TehThomas] - ICT Liquidity sweepsThe ICT Liquidity Sweeps Indicator is designed to track liquidity zones in the market areas where stop-losses and pending orders are typically clustered. This indicator marks buyside liquidity (resistance) and sellside liquidity (support), helping traders identify areas where price is likely to manipulate liquidity before making a significant move.
This tool is based on Inner Circle Trader (ICT) Smart Money Concepts, which emphasize how institutional traders, or “Smart Money,” manipulate liquidity to fuel price movements. By identifying these zones, traders can anticipate liquidity sweeps and position themselves accordingly.
⚙️ How It Works
1️⃣ Detects Key Liquidity Zones
The script automatically identifies significant swing highs and swing lows in price action using a pivot-based method.
A swing high (buyside liquidity) is a peak where price struggles to break higher, forming a resistance level.
A swing low (sellside liquidity) is a valley where price struggles to go lower, creating a support level.
These liquidity points are prime targets for liquidity sweeps before a true trend direction is confirmed.
2️⃣ Draws Liquidity Lines
Once a swing high or low is identified, a horizontal line is drawn at that level.
The lines extend to the right, serving as future liquidity targets until they are broken.
The indicator allows customization in terms of color, line width, and maximum number of liquidity lines displayed at once.
3️⃣ Handles Liquidity Sweeps
When price breaks a liquidity level, the indicator reacts based on the chosen action setting:
Dotted/Dashed: The line remains visible but changes style to indicate a sweep.
Delete: The line is completely removed once price has interacted with it.
This feature ensures that traders can easily spot where liquidity has been taken and determine whether a reversal or continuation is likely.
4️⃣ Prevents Chart Clutter
To maintain a clean chart, the script limits the number of liquidity lines displayed at any given time.
When new liquidity zones are formed, the oldest lines are automatically removed, keeping the focus on the most relevant liquidity zones.
🎯 How to Use the ICT Liquidity Sweeps Indicator
🔍 Identifying Liquidity Grabs
This indicator helps you identify areas where Smart Money is targeting liquidity before making a move.
Buyside Liquidity (BSL) Sweeps:
Occur when price spikes above a resistance level before reversing downward.
Indicate that Smart Money has hunted stop-losses and buy stops before driving price lower.
Sellside Liquidity (SSL) Sweeps:
Occur when price drops below a support level before reversing upward.
Indicate that Smart Money has collected liquidity from stop-losses and sell stops before pushing price higher.
📈 Combining with Market Structure Shifts (MSS)
One of the best ways to use this indicator is in conjunction with our Market Structure Shifts Indicator.
Liquidity sweeps + MSS Confirmation give strong high-probability trade setups:
Wait for a liquidity sweep (price takes out a liquidity level).
Look for an MSS in the opposite direction (e.g., price sweeps a high, then breaks a recent low).
Enter the trade in the new direction with stop-loss above/below the liquidity sweep.
📊 Entry & Exit Strategies
Long Trade Example:
Price sweeps a key sellside liquidity level (SSL) → creates a false breakdown.
MSS confirms a reversal (price breaks structure upwards).
Enter long position after confirmation.
Stop-loss below the liquidity grab to minimize risk.
Short Trade Example:
Price sweeps a key buyside liquidity level (BSL) → takes liquidity above resistance.
MSS confirms a bearish move (price breaks a key support level).
Enter short position after confirmation.
Stop-loss above the liquidity grab.
🚀 Why This Indicator is a Game-Changer
✅ Helps Identify Smart Money Manipulation – Understand where institutions are likely to grab liquidity before the real move happens.
✅ Enhances Market Structure Analysis – When paired with MSS, liquidity sweeps become powerful signals for trend reversals.
✅ Filters Out False Breakouts – Many traders get caught in liquidity grabs. This indicator helps avoid bad entries.
✅ Keeps Your Chart Clean – The auto-limiting feature ensures that only the most relevant liquidity levels remain visible.
✅ Works on Any Timeframe – Whether you’re a scalper, day trader, or swing trader, liquidity concepts apply universally.
📌 Final Thoughts
The ICT Liquidity Sweeps Indicator is a must-have tool for traders who follow Smart Money Concepts. By tracking liquidity levels and highlighting sweeps, it allows traders to enter trades with precision while avoiding false breakouts.
When combined with Market Structure Shifts (MSS), this strategy becomes even more powerful, offering traders an edge in spotting reversals and timing entries effectively.
__________________________________________
Thanks for your support!
If you found this idea helpful or learned something new, drop a like 👍 and leave a comment—I’d love to hear your thoughts! 🚀
Make sure to follow me for more price action insights, free indicators, and trading strategies. Let’s grow and trade smarter together! 📈✨

NSE: 2in1 Options-Index (Nifty-Bank-MID-Fin)
1. Using Two Charts in One Indicator with Buy and Sell Signals on Both Charts
Dual-Chart Functionality: This indicator allows you to monitor two charts simultaneously – the main chart (Options) and the underlying index chart (NIFTY, BANKNIFTY, etc.).
The index chart (below the main chart) shows the underlying index movement.
The main chart displays the Options data (e.g., NIFTY options, BANKNIFTY options).
Buy/Sell Signals on Both Charts:
Buy and sell signals are generated on both the options chart and the index chart, ensuring you don’t miss any trading opportunities.
This dual-chart setup helps you correlate the movement of the index with the options data for better decision-making.
2. Works Across Major Indices (NIFTY, BANKNIFTY, FINNIFTY, etc.)
Automatic Index Detection: The script automatically detects the underlying index based on the chart symbol. It supports:
NIFTY, BANKNIFTY, FINNIFTY, MIDCPNIFTY, SENSEX
Flexibility: Whether you’re trading NIFTY options or BANKNIFTY options, the indicator adapts to the selected index and provides accurate signals.
3. Helps You Select ATM, ITM, and OTM Strikes (Ideal for Beginners and Advanced Traders)
ATM (At-The-Money) Strike Calculation:
The script calculates the ATM strike price based on the current spot price of the underlying index.
ITM (In-The-Money) and OTM (Out-Of-The-Money) Strikes:
Users can adjust the strike price using a slider to select ITM or OTM strikes.
This feature is especially helpful for beginners who are learning about options trading and want to understand the difference between ITM, ATM, and OTM strikes.
Strike Price Display:
The selected strike price is displayed on the chart, making it easy to identify the right strike for your trades.
4. Double EMA Selection for Trading
Customizable EMAs:
The script uses two Exponential Moving Averages (EMAs) to generate signals:
Short EMA (Default: 21 periods)
Long EMA (Default: 34 periods)
Users can customize the EMA lengths based on their trading strategy.
5. Option Chart in the Main Chart with Index Chart Below for Easy Monitoring
Integrated Chart Setup:
The main chart displays the options data (e.g., NIFTY options, BANKNIFTY options).
The index chart (below the main chart) shows the underlying index movement.
Benefits:
This setup allows you to monitor both the options and the index in a single view, making it easier to:
Correlate the movement of the index with the options data.
Identify trading opportunities directly on the chart.
No need to switch between multiple charts – everything is in one place.
6. Targets and Stop-Loss When the Signal is Generated
Dynamic Targets and Stop-Loss:
The script calculates targets and stop-loss levels based on the Predicted Range (PR) bands.
Trailing Stop-Loss:
The stop-loss level adjusts dynamically as the price moves in your favor.
Target Levels:
Two target levels are provided (Target 1 and Target 2) based on the PR bands.
Visual Indicators:
Targets and stop-loss levels are plotted on the chart with labels and lines for easy reference.
Colors:
Trailing Stop: Light Pink
Target 1: Light Green
Target 2: Light Green
7. Various Other Options in One Indicator
Advanced Statistical Bands (KRO Settings):
The script includes Kernel Regression Oscillator (KRO) settings for advanced traders.
Plots upper and lower bands based on standard deviation and kernel regression.
Helps identify overbought and oversold conditions.
Customizable Alerts:
Users can enable/disable alerts for:
Buy/Sell signals.
Trailing stop-loss hits.
Target achievements.
Summary of Benefits
All-in-One Tool: Combines candlestick analysis, EMAs, options strike selection, targets, stop-loss, and advanced statistical bands in a single indicator.
Beginner-Friendly: Helps new traders understand ATM, ITM, and OTM strikes while providing clear buy/sell signals.
Advanced Features: Includes KRO settings, dynamic targets, and trailing stop-loss for experienced traders.
Dual-Chart Setup: Monitor options and the underlying index simultaneously for better decision-making.
Customizable: Adjust EMA lengths, strike prices, colors, and alerts to suit your trading style.
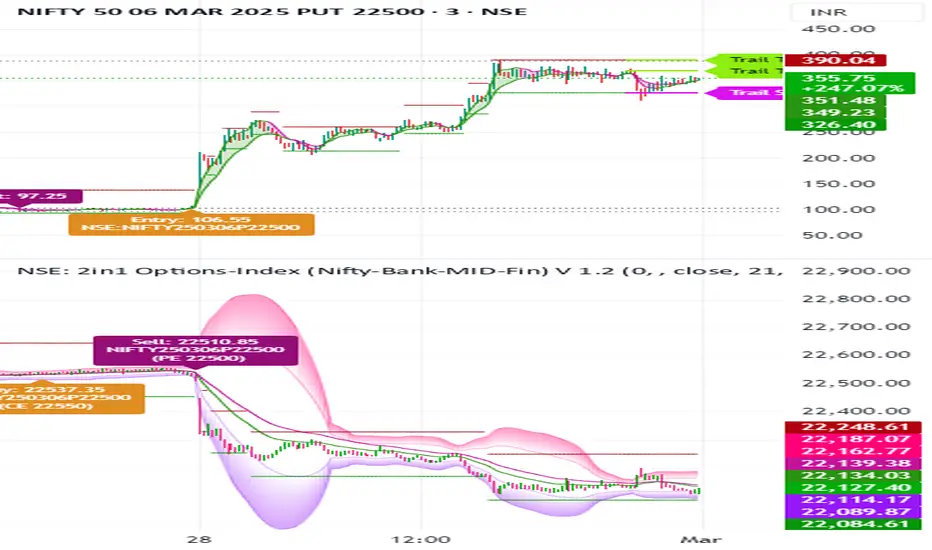
Pivot & Source Cross StrategyPivot & ZoneCross Strategy V2
A powerful trading script combining Pivot Points, Retracement Zones, and Dynamic Stop-Loss Management. Suitable for beginners and advanced traders.
Introduction
This script enables traders to leverage Pivot Points and retracement zones for precise entry and exit points. Using price crossover detection and customizable stop-loss management, it offers a structured approach to trading various market conditions.
Features
Pivot Point Calculations: Select between Classic or Fibonacci methods for precise support and resistance levels.
Zone-Based Entry Signals: Identify price crossovers with retracement levels for optimal trade timing.
Customizable Stop-Loss Management: Automatically adjusts stop-loss levels to secure profits or limit losses.
Support for Market or Limit Orders: Choose instant market execution or specific limit entry points.
Flexible Inputs for Sources: Use Source First and Source Second to integrate external indicators like RSI and RSI MA, providing advanced customization options.
Visualization of Key Levels: Easily track retracement zones, Pivot Points, and stop-loss levels directly on the chart.
Configurable Conditions: Tailor entry/exit logic for your trading style.
How to Set Up
Choose Your Higher Timeframe (TIMEFRAME):
This determines the Pivot Points and retracement levels.
Example: Use “D” for daily pivots while trading on lower timeframes.
Select Entry Zone Patterns:
Define the pattern for detecting retracement levels:
xxx: Minor levels (steps of 10).
xx0: Intermediate levels (steps of 50).
x00: Major levels (steps of 100).
Set Entry Conditions for Long and Short Trades:
Activate or deactivate up/down conditions for xxx, xx0, or x00 patterns. Specify the count and range of crosses required for valid signals.
Configure Source Inputs (Source First and Source Second):
Assign external indicators such as RSI and RSI MA to refine entry conditions.
Tip: Adjust RSI settings in its separate indicator to suit your needs.
Select Your Order Type:
Choose between Market orders for instant execution or Limit orders for precision entries. Adjust offset zones for limit orders.
Set Up Stop-Loss Management:
Use dynamic stop-loss patterns with adjustable offsets:
HL: Stop-loss uses high/low levels of the zone.
Close: Stop-loss uses the closing price.
Customize Visualization Options:
Enable or disable xxx, xx0, x00, or 0 levels for cleaner charts. Adjust the display of retracement levels and stop-loss lines.
Apply and Monitor:
Attach the script to your chart, monitor entry/exit signals, and adjust parameters as needed.
How It Works
Calculates Pivot Points based on the chosen method ( Classic or Fibonacci ).
Detects price crossovers with retracement zones to identify potential entry points.
Dynamically adjusts stop-loss levels based on retracement zones and stop-loss patterns.
Supports both market and limit orders with customizable offsets for precise entries.
Allows integration of external sources like RSI for enhanced signal precision.
Important Notes
Use Source First and Source Second to input external indicators like RSI. You can configure RSI settings in its separate indicator to refine signals further.
Always test and optimize parameters before live trading.
Combine this script with your own analysis and proper risk management strategies.
This script is a tool to assist trading decisions but does not guarantee profits. Always trade responsibly.

Triple CCI Strategy MFI Confirmed [Skyrexio]Overview
Triple CCI Strategy MFI Confirmed leverages 3 different periods Commodity Channel Index (CCI) indicator in conjunction Money Flow Index (MFI) and Exponential Moving Average (EMA) to obtain the high probability setups. Fast period CCI is used for having the high probability to enter in the direction of short term trend, middle and slow period CCI are used for confirmation, if market now likely in the mid and long-term uptrend. MFI is used to confirm trade with the money inflow/outflow with the high probability. EMA is used as an additional trend filter. Moreover, strategy uses exponential moving average (EMA) to trail the price when it reaches the specific level. More information in "Methodology" and "Justification of Methodology" paragraphs. The strategy opens only long trades.
Unique Features
Dynamic stop-loss system: Instead of fixed stop-loss level strategy utilizes average true range (ATR) multiplied by user given number subtracted from the position entry price as a dynamic stop loss level.
Configurable Trading Periods: Users can tailor the strategy to specific market windows, adapting to different market conditions.
Four layers trade filtering system: Strategy utilizes two different period CCI indicators, MFI and EMA indicators to confirm the signals produced by fast period CCI.
Trailing take profit level: After reaching the trailing profit activation level scrip activate the trailing of long trade using EMA. More information in methodology.
Methodology
The strategy opens long trade when the following price met the conditions:
Fast period CCI shall crossover the zero-line.
Slow and Middle period CCI shall be above zero-lines.
Price shall close above the EMA. Crossover is not obligatory
MFI shall be above 50
When long trade is executed, strategy set the stop-loss level at the price ATR multiplied by user-given value below the entry price. This level is recalculated on every next candle close, adjusting to the current market volatility.
At the same time strategy set up the trailing stop validation level. When the price crosses the level equals entry price plus ATR multiplied by user-given value script starts to trail the price with EMA. If price closes below EMA long trade is closed. When the trailing starts, script prints the label “Trailing Activated”.
Strategy settings
In the inputs window user can setup the following strategy settings:
ATR Stop Loss (by default = 1.75)
ATR Trailing Profit Activation Level (by default = 2.25)
CCI Fast Length (by default = 14, used for calculation short term period CCI)
CCI Middle Length (by default = 25, used for calculation short term period CCI)
CCI Slow Length (by default = 50, used for calculation long term period CCI)
MFI Length (by default = 14, used for calculation MFI
EMA Length (by default = 50, period of EMA, used for trend filtering EMA calculation)
Trailing EMA Length (by default = 20)
User can choose the optimal parameters during backtesting on certain price chart.
Justification of Methodology
Before understanding why this particular combination of indicator has been chosen let's briefly explain what is CCI, MFI and EMA.
The Commodity Channel Index (CCI) is a momentum-based technical indicator that measures the deviation of a security's price from its average price over a specific period. It helps traders identify overbought or oversold conditions and potential trend reversals.
The CCI formula is:
CCI = (Typical Price − SMA) / (0.015 × Mean Deviation)
Typical Price (TP): This is calculated as the average of the high, low, and closing prices for the period.
Simple Moving Average (SMA): This is the average of the Typical Prices over a specific number of periods.
Mean Deviation: This is the average of the absolute differences between the Typical Price and the SMA.
The result is a value that typically fluctuates between +100 and -100, though it is not bounded and can go higher or lower depending on the price movement.
The Money Flow Index (MFI) is a technical indicator that measures the strength of money flowing into and out of a security. It combines price and volume data to assess buying and selling pressure and is often used to identify overbought or oversold conditions. The formula for MFI involves several steps:
1. Calculate the Typical Price (TP):
TP = (high + low + close) / 3
2. Calculate the Raw Money Flow (RMF):
Raw Money Flow = TP × Volume
3. Determine Positive and Negative Money Flow:
If the current TP is greater than the previous TP, it's Positive Money Flow.
If the current TP is less than the previous TP, it's Negative Money Flow.
4. Calculate the Money Flow Ratio (MFR):
Money Flow Ratio = Sum of Positive Money Flow (over n periods) / Sum of Negative Money Flow (over n periods)
5. Calculate the Money Flow Index (MFI):
MFI = 100 − (100 / (1 + Money Flow Ratio))
MFI above 80 can be considered as overbought, below 20 - oversold.
The Exponential Moving Average (EMA) is a type of moving average that places greater weight and significance on the most recent data points. It is widely used in technical analysis to smooth price data and identify trends more quickly than the Simple Moving Average (SMA).
Formula:
1. Calculate the multiplier
Multiplier = 2 / (n + 1) , Where n is the number of periods.
2. EMA Calculation
EMA = (Current Price) × Multiplier + (Previous EMA) × (1 − Multiplier)
This strategy leverages Fast period CCI, which shall break the zero line to the upside to say that probability of short term trend change to the upside increased. This zero line crossover shall be confirmed by the Middle and Slow periods CCI Indicators. At the moment of breakout these two CCIs shall be above 0, indicating that there is a high probability that price is in middle and long term uptrend. This approach increases chances to have a long trade setup in the direction of mid-term and long-term trends when the short-term trend starts to reverse to the upside.
Additionally strategy uses MFI to have a greater probability that fast CCI breakout is confirmed by this indicator. We consider the values of MFI above 50 as a higher probability that trend change from downtrend to the uptrend is real. Script opens long trades only if MFI is above 50. As you already know from the MFI description, it incorporates volume in its calculation, therefore we have another one confirmation factor.
Finally, strategy uses EMA an additional trend filter. It allows to open long trades only if price close above EMA (by default 50 period). It increases the probability of taking long trades only in the direction of the trend.
ATR is used to adjust the strategy risk management to the current market volatility. If volatility is low, we don’t need the large stop loss to understand the there is a high probability that we made a mistake opening the trade. User can setup the settings ATR Stop Loss and ATR Trailing Profit Activation Level to realize his own risk to reward preferences, but the unique feature of a strategy is that after reaching trailing profit activation level strategy is trying to follow the trend until it is likely to be finished instead of using fixed risk management settings. It allows sometimes to be involved in the large movements. It’s also important to make a note, that script uses another one EMA (by default = 20 period) as a trailing profit level.
Backtest Results
Operating window: Date range of backtests is 2022.04.01 - 2024.11.25. It is chosen to let the strategy to close all opened positions.
Commission and Slippage: Includes a standard Binance commission of 0.1% and accounts for possible slippage over 5 ticks.
Initial capital: 10000 USDT
Percent of capital used in every trade: 50%
Maximum Single Position Loss: -4.13%
Maximum Single Profit: +19.66%
Net Profit: +5421.21 USDT (+54.21%)
Total Trades: 108 (44.44% win rate)
Profit Factor: 2.006
Maximum Accumulated Loss: 777.40 USDT (-7.77%)
Average Profit per Trade: 50.20 USDT (+0.85%)
Average Trade Duration: 44 hours
These results are obtained with realistic parameters representing trading conditions observed at major exchanges such as Binance and with realistic trading portfolio usage parameters.
How to Use
Add the script to favorites for easy access.
Apply to the desired timeframe and chart (optimal performance observed on 2h BTC/USDT).
Configure settings using the dropdown choice list in the built-in menu.
Set up alerts to automate strategy positions through web hook with the text: {{strategy.order.alert_message}}
Disclaimer:
Educational and informational tool reflecting Skyrex commitment to informed trading. Past performance does not guarantee future results. Test strategies in a simulated environment before live implementation

30-Minute Candle Strategy30-Minute Candle Trading Strategy
This strategy works on a 30-minute candle timeframe. When a new 30-minute candle opens, the following actions will take place based on the previous 30-minute candle's closing price:
Buy Trade Setup:
If the market opens above the previous 30-minute candle's closing price, a buy trade will be executed immediately at the market price.
The stop-loss will be set at the previous 30-minute candle's closing price.
There will be no fixed target.
The trade will be closed 1 minute before the current 30-minute candle closes, regardless of profit or loss.
Sell Trade Setup:
If a buy trade hits the stop-loss and the market moves below the previous 30-minute candle's closing price, a sell trade will be executed immediately at the market price.
The stop-loss for the sell trade will also be set at the previous 30-minute candle's closing price.
There will be no fixed target.
The trade will be closed 1 minute before the current 30-minute candle closes, regardless of profit or loss.
Procedure:
This process will repeat for every 30-minute candle.
If the market crosses the previous 30-minute candle's closing price to the upside, a buy trade will be executed, and the stop-loss will be set at the previous candle's closing price.
If the market crosses the previous 30-minute candle's closing price to the downside, a sell trade will be executed, and the stop-loss will also be set at the previous candle's closing price.
Each trade will be closed 1 minute before the current candle closes.
Key Points:
This strategy applies to every new 30-minute candle.
The stop-loss will always be based on the previous 30-minute candle's closing price.
If a stop-loss is hit, the strategy will automatically switch to the opposite trade (buy to sell or sell to buy) based on market movement crossing the previous candle's closing price.
This is a repetitive and systematic approach to trading, ensuring the rules are followed for every 30-minute candle.
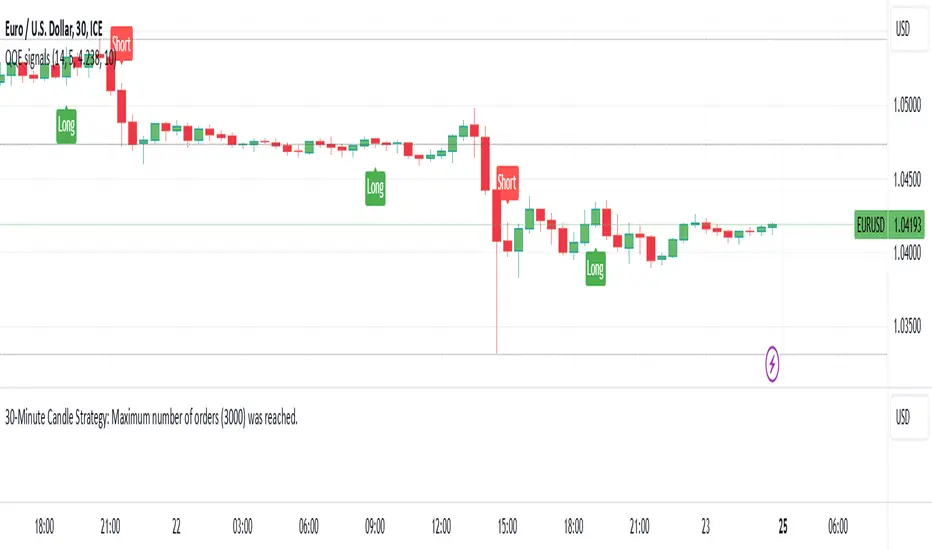
MFI Strategy with Oversold Zone Exit and AveragingThis strategy is based on the Money Flow Index (MFI) and aims to enter a long position when the MFI exits an oversold zone, with specific rules for limit orders, stop-loss, and take-profit settings. Here's a detailed breakdown:
Key Components
1. **Money Flow Index (MFI)**: The strategy uses the MFI, a volume-weighted indicator, to gauge whether the market is in an oversold condition (default threshold of MFI < 20). Once the MFI rises above the oversold threshold, it signals a potential buying opportunity.
2. **Limit Order for Long Entry**: Instead of entering immediately after the oversold condition is cleared, the strategy places a limit order at a price slightly below the current price (by a user-defined percentage). This helps achieve a better entry price.
3. **Stop-Loss and Take-Profit**:
- **Stop-Loss**: A stop-loss is set to protect against significant losses, calculated as a percentage below the entry price.
- **Take-Profit**: A take-profit target is set as a percentage above the entry price to lock in gains.
4. **Order Cancellation**: If the limit order isn’t filled within a specific number of bars (default is 5 bars), it’s automatically canceled to avoid being filled at a potentially suboptimal price as market conditions change.
Strategy Workflow
1. **Identify Oversold Zone**: The strategy checks if the MFI falls below a defined oversold level (default is 20). Once this condition is met, the flag `inOversoldZone` is set to `true`.
2. **Wait for Exit from Oversold Zone**: When the MFI rises back above the oversold level, it’s considered a signal that the market is potentially recovering, and the strategy prepares to enter a position.
3. **Place Limit Order**: Upon exiting the oversold zone, the strategy places a limit order for a long position at a price below the current price, defined by the `Long Entry Percentage` parameter.
4. **Monitor Limit Order**: A counter (`barsSinceEntryOrder`) starts counting the bars since the limit order was placed. If the order isn’t filled within the specified number of bars, it’s canceled automatically.
5. **Set Stop-Loss and Take-Profit**: Once the order is filled, a stop-loss and take-profit are set based on user-defined percentages relative to the entry price.
6. **Exit Strategy**: The trade will close automatically when either the stop-loss or take-profit level is hit.
Advantages
- **Risk Management**: With configurable stop-loss and take-profit, the strategy ensures losses are limited while capturing profits at pre-defined levels.
- **Controlled Entry**: The use of a limit order below the current price helps secure a better entry point, enhancing risk-reward.
- **Oversold Exit Trigger**: Using the exit from an oversold zone as an entry condition can help catch reversals.
Disadvantages
- **Missed Entries**: If the limit order isn’t filled due to insufficient downward movement after the oversold signal, potential opportunities may be missed.
- **Dependency on MFI Sensitivity**: As the MFI is sensitive to both price and volume, its fluctuations might not always accurately represent oversold conditions.
Overall Purpose
The strategy is suited for traders who want to capture potential reversals after oversold conditions in the market, with a focus on precise entries, risk management, and an automated exit plan.

Austin's Apex AcceleratorIndicator Name: Austin’s Apex Accelerator
Overview
The Austin’s Apex Accelerator is a highly aggressive trading indicator designed specifically for high-frequency Forex trading. It combines several technical analysis tools to identify rapid entry and exit points, making it well-suited for intraday or even lower timeframe trades. The indicator leverages a combination of exponential moving averages (EMAs), Bollinger Bands, volume filters, and volatility-adjusted ranges to detect breakout opportunities and manage risk with precision.
Core Components
Fast and Slow EMAs: The two EMAs act as trend and momentum indicators. When the shorter EMA crosses the longer EMA, it signals a change in momentum. The crossover of these EMAs often indicates a potential entry point, especially when combined with volume and volatility filters.
ATR-Based Range Filter: Using the Average True Range (ATR) for dynamic range calculation, the indicator adapts to market volatility. Higher ATR values widen the range, helping the indicator adjust for volatile conditions.
Volume Filter: A volume condition ensures that buy and sell signals only trigger when there’s significant market interest, reducing the likelihood of false signals in low-liquidity environments.
Bollinger Bands: The Bollinger Bands provide additional context for potential overbought or oversold conditions, highlighting opportunities for price reversals or trend continuations.
Key Features
Aggressive Buy and Sell Signals:
Buy Signal: A buy signal is generated when the fast EMA crosses above the slow EMA, confirming bullish momentum, and the volume condition is met. If the price is also near the lower Bollinger Band, it adds further confirmation of an oversold condition.
Sell Signal: A sell signal is generated when the fast EMA crosses below the slow EMA, confirming bearish momentum, with sufficient trading volume. If the price is near the upper Bollinger Band, it signals a potential overbought condition, which supports the sell signal.
Dynamic Range with ATR:
The indicator uses a volatility-based range, derived from the ATR, to adjust the signal sensitivity based on recent price fluctuations. This dynamic range ensures that signals are responsive in both high and low volatility conditions.
The range’s upper and lower bands act as thresholds, with trades often occurring when the price breaches these levels, signaling momentum shifts or trend reversals.
Trend Background Color:
A green background highlights bullish trends when the fast EMA is above the slow EMA.
A red background signifies bearish trends when the fast EMA is below the slow EMA, providing a visual indication of the overall market trend direction.
Trend Line:
The indicator plots a dynamic trend line that changes color based on the price's relationship to the EMAs, helping traders quickly assess the current trend’s strength and direction.
Alerts:
The indicator includes configurable alerts for buy and sell signals, allowing traders to be notified of entry opportunities without needing to monitor the chart continuously.
How to Use Austin’s Apex Accelerator
Identify Entry Points:
Buy Entry: When the fast EMA crosses above the slow EMA, a buy signal is triggered. Confirm this signal by checking if the price is near or below the lower Bollinger Band (indicating an oversold condition) and if trading volume meets the set threshold.
Sell Entry: When the fast EMA crosses below the slow EMA, a sell signal is triggered. Confirm the signal by ensuring the price is near or above the upper Bollinger Band (suggesting an overbought condition) and that volume is sufficient.
Exit Strategy:
Take Profit: The take profit level is calculated as 1.5 times the ATR from the entry point. This ensures that each trade aims to achieve a positive risk/reward ratio.
Stop Loss: The stop loss is set at 1 ATR from the entry, providing a tight risk control mechanism that limits potential losses on each trade.
Trend Identification and Background Colors:
Use the background colors to assess the trend direction. A green background indicates a bullish trend, while a red background suggests a bearish trend. These colors can help you filter signals that go against the trend, increasing the chances of a successful trade.
Volume Confirmation:
This indicator has an inbuilt volume filter to prevent trading in low-volume conditions. Look for signals only when volume exceeds the average volume threshold, which is set by the multiplier. This helps avoid trading during quieter times when false signals are more likely.
Alerts:
Set up alerts for buy and sell signals to be notified in real-time whenever a new trading opportunity arises, so you can act on high-quality signals promptly.
Practical Tips for Using Austin’s Apex Accelerator
Timeframe: Best suited for short timeframes such as 5-minute or 15-minute charts for high-frequency trading.
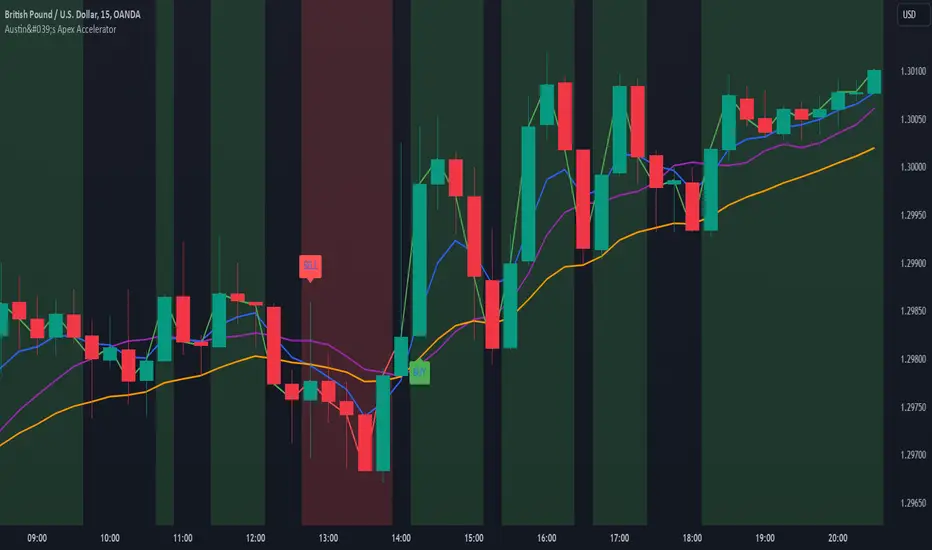
Profit & Risk CalculatorThe "Profit & Risk Calculator" script in Pine Script (TradingView) is designed to help users calculate potential profit and risk when trading, and to provide alerts when specific price levels are reached (such as entry price, take profit, or stop loss). It includes several components as described below:
1. Input Fields:
The user can manually input various prices: entry price, stop loss price, and take profit price, with steps of 0.25.
There is also an option to input a custom value (e.g., for personal lot sizing) and a total investment amount.
2. Dynamic Lines:
The script draws dynamic horizontal lines for the input prices: entry line (white), stop loss line (red), and take profit line (green).
These lines are automatically updated based on the entered price levels.
3. Labels for the Lines:
Labels are added to the lines to visually indicate the entry, stop loss, and take profit levels on the chart.
4. Long and Short Position Calculations:
The script calculates potential profit and loss for both long (profit if the price goes up) and short (profit if the price goes down) positions.
It also calculates the distance between entry and take profit, and distance between entry and stop loss, along with the risk/reward ratio (RR).
5. Alerts:
The script generates alerts when one of the following conditions is met:
Entry Condition: The price touches or exceeds the entry price (high >= entryPrice).
Stop Loss Condition: The price touches or drops below the stop loss price (low <= stopLossPrice).
Take Profit Condition: The price touches or exceeds the take profit price (high >= takeProfitPrice).
6. Lot Calculations:
The script calculates both micro and mini lot sizes based on a preset table and the custom value.
The results are displayed in a table on the chart.
7. Profit/Risk Table:
The script shows two tables:
One table calculates the profit, loss, and risk/reward ratio based on the input entry price.
A second table shows the same calculations based on the current price.
8. Chart Display:
The script places tables and other visual data on the chart, such as preset values, profit and loss calculations, and the distance from take profit and stop loss to the entry price.
English Explanation of Each Part of the Script
1. Input Fields
The script starts with several input fields where the user can specify the entry price, stop loss price, take profit price, custom value, and investment amount. These values help define the parameters for risk/reward calculations.
2. Dynamic Horizontal Lines
Three horizontal lines are drawn on the chart, representing the entry price, stop loss price, and take profit price. These lines update dynamically based on user input.
3. Dynamic Line Updates
As the user adjusts their inputs, the position of the lines is updated in real-time to match the new price levels. This keeps the chart visually accurate.
4. Labels for Lines
Labels are placed on the chart next to each price line, allowing the user to clearly see which line represents which price level.
5. Long and Short Position Calculations
The script calculates the potential profit or loss for both long (prices go up) and short (prices go down) positions, providing users with an idea of their potential gains or losses.
6. **6. Risk/Reward Ratio Calculation
This calculates the Risk/Reward Ratio (RR) by dividing the distance between the take profit and entry price by the distance between the entry and stop loss price. This gives the trader an idea of how much risk they're taking relative to the potential reward.
7. Alert Conditions
The alert conditions are defined based on the price hitting the set levels:
Entry Condition: If the price goes up and touches the entry level, the alert is triggered.
Stop Loss Condition: If the price drops and hits the stop loss level, the alert is triggered.
Take Profit Condition: If the price rises and reaches the take profit level, the alert is triggered.
8. Alert Configuration
Each condition is linked to an alert that sends a message when the specific price level is touched. The alerts notify the user when the entry, stop loss, or take profit levels are hit.
9. Lot Calculations
The script includes a function that calculates micro and mini lot sizes based on a preset table and a custom value input by the user. This is useful for adjusting lot sizes to the desired amount and determining position sizes for trades.
10. Entry Price-Based Profit & Loss Table
A table is generated on the chart that displays detailed information about the profit, loss, and risk/reward ratio based on the entry price. It helps traders see the potential outcomes for different lot sizes.
11. Current Price-Based Profit & Loss Table
This second table provides similar information as the first but calculates profit, loss, and risk/reward based on the current price. This allows the trader to see how their position performs as the market price changes in real time.
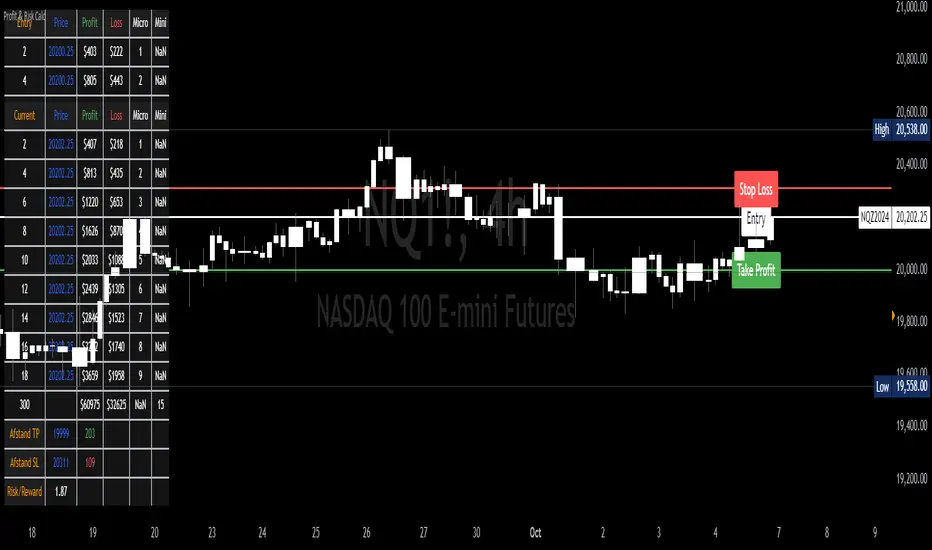
G.O.A.T. Scalper Diagnostics v1OVERVIEW:
The G.O.A.T. Scalper Diagnostics indicator system enables users to discover unorthodox indicator patterns, reading price charts in unusual ways, thus gaining an edge over the majority of market participants they trade against.
CONCEPTS:
Th G.O.A.T. Scalper Diagnostics is a system that aims to satisfy the fundamental condition for successful online trading - providing an edge.
It's a battle between advantages. To take other people's money, successful traders must have an advantage over everybody else. To hope for consistent success in trading, you need to do things differently and see what almost nobody else sees. Of course then you must act on it, and that's where the G.O.A.T. Scalper Diagnostic's mandate ends.
I believe the vast majority of indicators out there show you what everybody else sees. I've always been an indicator guy, I respect and cherish most indicators and I know a good indicator when I see it.
However, although most indicators are great works of art, their practicality is in most cases doubtful. Presenting great information is one thing, but providing an edge over the people you trade against is something different.
What Everybody Else Sees
The G.O.A.T. Scalper Diagnostics is based on indicators most of you have probably heard of and used:
Moving Averages (particularly the Kaufman Moving Average, among others)
ADX and DI
Bollinger Bands
Stochastic (particularly the Stochastic RSI)
Most traders should be well familiar with these classic indicators, they've provided the basis for online indicator trading for decades. But it's also true that due to how popular online trading has become all over the world, one is more and more unable to use these indicators successfully on lower timeframes.
Usually, more noteworthy success is achieved by going up in scale and discovering the timeframe where a particular indicator produces no false signals. Often times these timeframes range from bi-weekly to multi-month scale. In other words, consistently successful low timeframe trading and scalp trading in particular are now almost impossible using indicators.
Traders that dominate the scalping arena are big professional/institutional groups of traders, who have systematic access to the order books of most exchanges. This can be achieved one way or another, but not by individuals, small groups without significant capital or simply traders who lack political/social power and influence in the trading field.
In other words - giant order book traders have an edge over everybody else, who use indicators to trade on lower timeframes.
Through a series of interventions into these classical indicators, the G.O.A.T. System brings them back into the lower timeframe competitive game. Most original formulas are preserved, but these immortal classics are applied in ways popular TA would consider unorthodox.
Ingenious Indicators Built by Creators
The G.O.A.T. Scalper Diagnostics relies on the fundamental work of others. The System is developed on the basis of:
Quadratic Kernel Regression - it uses the publicly published library of Justin Dehorty: www.tradingview.com
PMARP - Price Moving Average Ratio & Percentile, publicly published by "The_Caretaker": www.tradingview.com
These Creators deserve full credit for their fundamental work and are endorsed by the G.O.A.T. Scalper Diagnostics project.
And yet... ingenious and inspired as these tools are, in my humble opinion the general public is presented with a rather unproductive way to apply them. In my own view, these wonderful tools built by JDehorty and The_Caretaker have a massive potential should they be applied and wielded in a different direction. So I tried to bring my vision about them into flesh with the G.O.A.T. Diagnostics.
What the G.O.A.T. Scalper Diagnostics Is and How to Use It
It's a System for new pattern discovery, bringing the disciplines of pattern and indicator trading together.
By using it as a stand-alone, or mixing it with other great indicators, one is able to discover new indicator patterns. Patterns can be compared, matched together and categorized. By applying statistics to differentiated historical pattern groups, we're able to derive their meaning.
Thus, the trader is able to research their own "alphabet" to read the price charts. After categorizing and differentiating pattern groups with statistically predominant meaning, the trader is then able to read into longer scenarios - price set-ups that are harder to detect due to them being stretched in time or misshapen according to the particular situation.
The G.O.A.T. Scalper leverages and encourages group trading, as different traders will probably discover different price "alphabets" for themselves, potentially giving rise to a social economy of sharing and combining "trading languages" based on indicator patterns people have discovered via the G.O.A.T. Diagnostics.
Support/Resistance Trading
The G.O.A.T. Scalper has its own way of deriving Support/Resistance.
Unlike most existing S/R indicators, The Scalper derives Support/Resistance not by measuring price highs, lows and closes, but solely by using momentum and trend strength.
This seems like a much more versatile way to plot S/R during scalping on low timeframes where time is of essence and the trader's view is too narrow to have macro S/R levels in constant consideration.
The Scalper's way to derive S/R in real time and on the go, while staying very relative to important higher timeframe S/R zones, makes it much more desirable than any other S/R indicator I've thus far encountered.
All S/R functionality is derived from the classical ADX and DI indicator. To do this, I use the ADX and DI in an unpopular way. To generate the actual plot of S/R levels I also modify the indicator's code, not by removing functional parts from it, but adding more to it in order to filter the signals it produces.
I can metaphorically describe its action in the following way:
Imagine you're Price action itself;
You're walking through a labyrinth or corridors. You're walking through one straight corridor, and it has a crossing with another corridor ahead;
Very strong wind is blowing along that other corridor. You can't see the wind, but when you reach it and try to move past it, the force of the wind resists your moving ahead and instead pushes you sideways.
At this point, the G.O.A.T. Diagnostics already knows this can only be one thing - resistance.
Orthodox TA and trading demand retests. In my opinion, this deeply rooted tradition wastes time proving the obvious, then wastes time again double-proving the validity of recent past, while scalping opportunities go to waste. Modern successful traders are way ahead of the popular strategy of testing and retesting S/R that almost every trader uses. So-called "Stops hunting" is just one expression of this situation, where wide adoption of the S/R retesting strategy actually lures unsuccessful traders into the schemes of the successful few.
In my own way of trading, I use the G.O.A.T. Diagnostics to take action on Support/Resistance as it's plotted in real time.
But probably my biggest heresy into the DI is my opinion, that the crossings of the +DI and -DI are useless and should actually be discarded.
My research shows that the DIs often show indications of being "oversold", but don't seem to exhibit an "overbought" state. Statistically, I've had much more success basing my TA on that, rather than cross-ups and cross-downs of the DI plot lines.
Therefore I discarded these crossings by presenting the DI part of the ADX and DI as a Heatmap channel rather than crossing lines.
To further enhance the ability of the System to provide S/R analysis, I plot this Heatmap onto an adjustable price offset plots (a percentage above and below current price).
In modern times, the vast majority of trading is done by automatic machines and algorithms. To give a specific example, one can easily notice, that a 5% offset of the BTC 1h price plot leads to remarkably accurate S/R charting. Following the rule to chart a S/R line connecting highs and lows on the 5% price offset often successfully "foresees" valid S/R zones before price ever visits them. Or, the levels were visited so far back in the timeframe's history that orthodox understanding considers them "invalidated" or washed away in the noise of the relevant volume profile.
My explanation for this is simple - I think Grid bots now dominate automatic trading across the majority of exchanges.
In my understanding, by adjusting the percentage offset of current price action I can often discover relevant conglomerations of dominating Grid bot cell parameters and anticipate price reaction. By plotting the DI heatmap on these price action offsets I can use the indicator for my trading decisions.
Heatmaps
Every heatmap produces different series of data. They're not the same.
Bollinger Band heatmap depicts the percentile distance between the Band's extremes.
The price candles heatmap, and the KAMA moving average heatmap, depict the percentile distance between price and the KAMA. So, it's the same thing. However, the percentile of that distance is calculated in two different ways, hence the difference in color in every particular moment. This color discrepancy aims to visualize the "strain" between price action and KAMA, like a soft and hard "springs" that go in unison with each other in sustainable moves, and in dissonance with each other during unsustainable moves.
Price offset heatmap depicts the percentile average of the +DI (above price) and the -DI (below price). A Hot temperature above price and a Cold temperature below price would mean a strong bullish sentiment, and vise versa, while Green would mean neutrality in sentiment.
There are important interplays between different heatmaps. For example, although representing totally different things, a Teal price bar would almost always (according to historical statistics) foreshadow a change in DI's heatmap sentiment. That's just one avenue of correlation between S/R analysis and sentiment analysis using the G.O.A.T. Diagnostics.
Oscillator Chart
In terms of applying Quadratic Kernel Regression, I endorse the natural principle that no center can exist without a periphery, and no periphery can exist without a center. Therefore I try to pay attention not only to the average of the regression's values, but also to the cloud of data points itself.
Following this understanding, I attempt to depict the natural cycles of price converging/diverging towards/from its regression average. To do this, I apply the classic Stochastic formula.
Thus, the Oscillator part of the System depicts the following:
Thin heatmap line displays the cycles of price converging with its quadratic kernel regression average (moving down), and diverging with its regression average (moving up). Its heatmap depicts the percentile of this oscillation.
The wider heatmap line displays the KAMA's cycles of convergence/divergence with its own quadratic kernel regression average. The reason for this is again creating discrepancy - while KAMA is based on price action, its regression data values differ from those of price action's regression. This discrepancy produces useful historic patterns that can be studied statistically.
The thin and wide purple oscillator lines depict the change of slope of price action regression average and KAMA regression average, respectively. Very often change of slope is not detectable with the naked eye, but clearly indicated by the oscillators.
By combining all these elements into a single analysis, a trader can detect hidden trends that are yet to become visible for the rest of market participants.
For example, convergence of price with its quadratic kernel regression average while the slope of the average deteriorates down in most cases (according to statistics) means a sideways consolidation in a downtrend before downtrend continuation. Conversely, deviation of price action from its regression average while the regression average slope deteriorates down usually marks the very beginning of a downtrend.
Bollinger Bands
Bollinger Bands are not modified, but are based on quadratic kernel regression values. Thus, if Bollinger Bands themselves are indicative of volatility, then based on kernel regression values, they should indicate the volatility of change of values in the regression's window.
Again, applying it to both the price and KAMA regression data series, a discrepancy is highlighted that leads to useful historical patterns subject to analysis and categorization.
SOME EXAMPLES
Support / Resistance
Support/Resistance levels are market by White Triangles with dotted lines plotted from them, in real time. The indicator plots Ghost Triangles in anticipation of Support/Resistance, preparing the trader for the eventual confirmation of a zone of interest and signaling price is feeling Support or Resistance pressure.
Dialing the length of the S/R lines to 25 makes the indicator more useful.
Dialing the setting to 500 clearly shows macro S/R zones by conglomerating and bundling individual lines. The thicker the bundling and the confluence of lines, the more significant the zone.
Thus lower timeframe scalping and trading is made more easy, without the need to do nearly as much manual S/R charting. Support/Resistance analysis and plotting is entirely based on a modified ADX.
Heatmap
Sustainable moves are generally marked by Green price color and calm KAMA colors.
Unsustainable moves are usually marked by more extreme colors of price bars and KAMA. Red usually means price is unsustainably distanced from the KAMA, while deep Blue usually means price is undesirably close to the KAMA, foreshadowing a directional distancing.
Usually Teal color of price bars and KAMA foreshadow a change of sentiment of the outside Heatmap sentiment channel.
Red color of the outside channel always signals the direction of the desired sentimental movement, while Blue signals the extent at which the counter-element suffers. Thus, one side being Green, while the other is Blue, often means the Blue will soon evolve into a warmer color, attracting price in that direction. Outside Heatmap channel is entirely based on a modified DI.
Oscillator Chart
An example of Chart Diagnosis using the Oscillator and other elements of the G.O.A.T. Scalper:
First (far left), a Resistance is plotted. This coincides with price bars being Red (distressed state). The thin colorful Oscillator line takes an Up-turn, signifying a period of price moving away from its Quadratic Kernel Regression (pink moving average).
After Price cools down to Green sustainable colors, a Support is plotted. During this time, the thin colorful line is falling down, signifying a period when the distance between price action and its quadratic kernel regression average is decreasing.
During this phase, the thin purple Oscillator line goes up. This signifies the slope of the price regression is restoring to the upside.
Next, the thin colorful line starts going up again, signifying another period of price getting further away from its regression average. This time to the upside.
Resistance is being broken and new support is established. At this point, the thin colorful line starts falling again, signifying distance between price and its regression MA is shortening. This is clearly visible as a sideways consolidation (with a slight tilt up of slope).
A moment comes when all lines - the price and KAMA lines, and price and KAMA regression slopes, all point down. A new down period is clearly starting. This is further indicated by Teal price bars and new Resistance forming. Notice how the external heatmap channel goes into more balanced Green colors with trend enthusiasm calming down.
This analysis may appear to be overwhelming and confusing at first, as these metrics are unorthodox and unpopular. But different aspects of the indicator can be toggled ON/OFF to single them out, which makes observations much simpler for new users. After some time spent discovering personal patterns, or reviewing other users' catalogues with already published pattern libraries, it soon becomes easy to read charts in this new way.
Bollinger Bands
Bollinger Bands provide another way to produce patterns that give users specific chart information.
One noteworthy indication is when the price and KAMA Bollinger Bands separate their value zones. Since the zones of these Bands are based on the kernel regression values of the respective sources, their separation is significant and too often means violent reversals or violent continuations (which usually can be judged using the other metrics the System provides, or additional indicators of choice).
Another noteworthy Bollinger Band pattern is when price action leaves a prolonged trending move.
First phase of the end of a prolonged trending move is the BB zones expanding and doing a significant overlap.
Second stage is price getting reaccepted in the Price BB. This however doesn't mean reacceptance in the KAMA BB and if the moment isn't right, usually leads to bounces and continuations.
The KAMA needs to "make space" for price to get reaccepted into the KAMA BB. While the KAMA is outside its BB or very near to its wall, price reacceptance into it is not very probable. When KAMA withdraws from its BB wall, opening an "entrance on its membrane", that's when price is eligible to get reaccepted into the KAMA BB. That's usually the moment the long awaited consolidation starts and a long trending move is over.
Users of the G.O.A.T. Scalper Diagnostics can discover many more patterns and correlations between patterns within the System. But the System itself can multiply all possible patterns when inspected in the context of additional indicators, leading to vast possibilities of signal and pattern discovery with huge potential.
A very good idea would probably be to use the G.O.A.T. Diagnostics together with the Ichimoku.
Ichimoku has always been famous for its genius simplicity and elegant profoundness, but notorious for its total lack of accuracy, as well as general uselessness on lower timeframes. The G.O.A.T. System has the potential to enhance all of Ichimoku's strengths and cure its weaknesses.
Yet another good idea may be to pair it with kindred indicators, like the Gaussian Channel, which has a stunning performance, but suffers from too high level of generalization. The Diagnostics can provide the intricate texture of price manoeuvres the Gaussian Channel fails to register, while the GC can give the Scalper even more solid context for its patterns.
The worthwhile possibilities seem endless...
Entry Table
I've added a little Entry Table at the bottom right corner. It's designed to potentially help scalpers trade faster, and to visualize a potential trade they're thinking about before they execute it. A Stop Loss is visually plotted in real time to better visualize it's placement in the chart context.
It encourages responsible risk management in its settings:
The user enters the amount of their trading portfolio;
Then specify the percentage of their portfolio they're willing to risk at every trade;
After that the user can chose to specify a flat percentage Stop Loss.
The table will calculate the size of the entry of a market order, so the user only risks the specified percentage of their portfolio should the specified Stop Loss level is hit.
There's also the option to use automatically suggested Stop Loss, based on recent volatility. The actual Stop Loss is calculated 20% away from the actual volatility level, to better protect from unforeseen wicks.
In the current example, the user with a $1000 trading portfolio has to do a $1000 entry to lose 1% of their portfolio ($10) at a 1% Stop Loss.
But the user has to do a $2,525 entry in order to lose 1% of their portfolio (%10) at a much closer Stop Loss which is less than 1%, based on recent volatility.
The Entry Table should be considered as a cosmetic convenience and not a dedicated risk management tool.
CONCLUSION:
The G.O.A.T. Scalper Diagnostics is an indicator System, based on popular, but modified and tweaked versions of indicators like the ADX and DI, Stochastic, Bollinger Bands and MAs. It also leverages the remarkable work of inspired creators: JDehorty's Quadratic Kernel Regression library, and The_Caretaker's PMARP .
The G.O.A.T. Scalper Diagnostics indicator system enables users to discover so-called new "indicator-pattern alphabets", reading price charts in new and unorthodox ways, thus gaining an edge over the majority of market participants they trade against.
The high degree of freedom when discovering new patterns, either within the System itself or correlating its output to external auxiliary indicators, highlights the System's potential for original discoveries leading to highly personalized trading strategies. Exchanging information about personal pattern libraries can potentially also give birth to new private trading communities.
