在腳本中搜尋"stop loss"
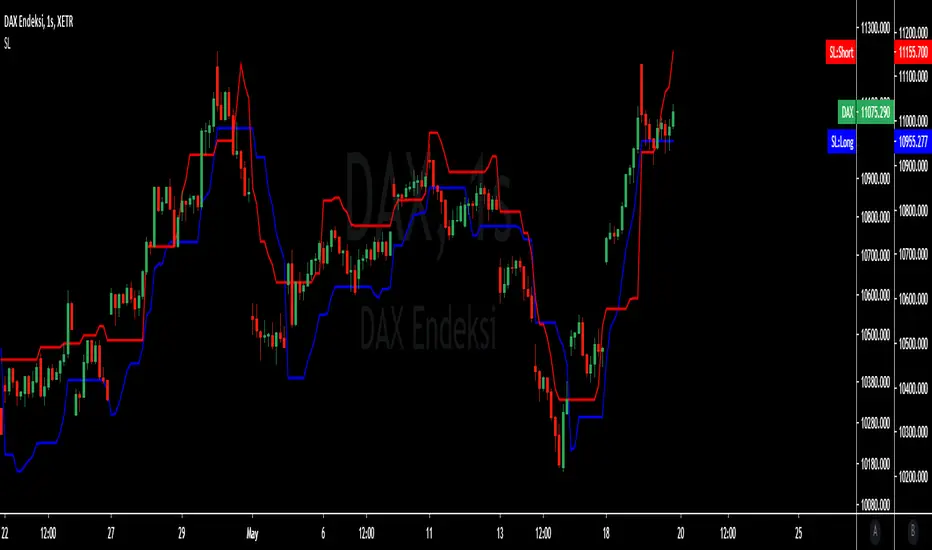
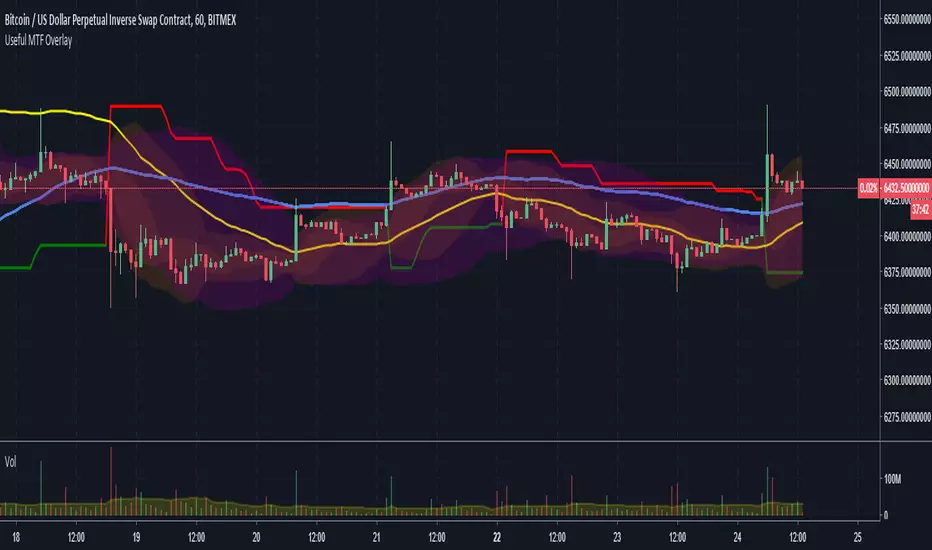
MTF Bollinger Bands, SuperTrend, TEMA Wave and ATR Stop LossThis script is a combination of useful overlay indicators that can be used for day trading or swing trading. You can use it for long term positions as well, but some tweaking may be required. I also added the multi time frame possibility for the majority of settings. This indicator gives you a lot of opportunities and trade setups. Default settings are made for day trading, using intraday time frames.
This script can display the following:
4 independent Bollinger Bands (MTF)
4 independent SuperTrends (MTF)
6 independent TEMAs (MTF)
ATR Stop loss for longs / shorts
Default settings display 3 Bollinger Bands, 2 TEMAs(I have found these two TEMAs particullarly useful, see screenshots below) and a signle SuperTrend.
Do not forget to always use a proper stop loss and risk management.
Here you can see the script in action in different markets:
BTC - BitMex - Setup before the drop from 7400 USD
BTC - BitMex - Setup before the drop from 8400 USD
BTC - BitMex - Setup before the pump to 7800 USD
BTC - BitMex - Setup before the pump to 6800 USD
All-in-One Solutions - Stop Loss Position CalculatorHello,
This indicator will calculate and plot your stop loss, according to your wallet size, order size, entry price, leverage and the pourcentage of risk that you want to consider.
Here is screenshot of the menu of the indicator :
imgur.com
The alert are also available if you desire to know if your stop loss is reached :
imgur.com
Please contact me in order to get access to this indicator. Please note that by subscribing to my offer, you will have access to all indicators I made and and the futur indicators I will develop according to the demand of the community.
Messages are welcome also in order to improve my indicators.
After subscribing, all indicators will be added into your under invitation indicators list or you can have a look on my Tradingview page :https://fr.tradingview.com/u/KenLeShim/#published-scripts
I hope my indicators will help you !

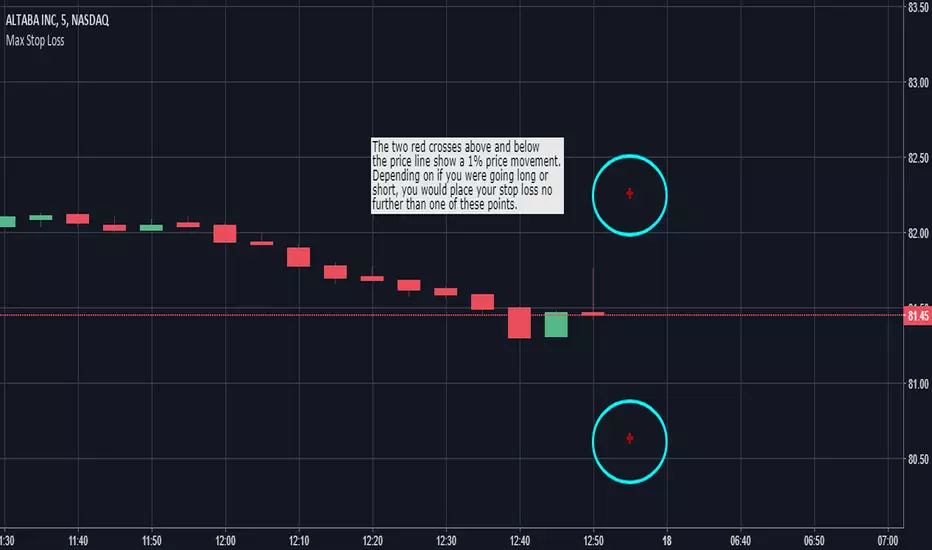
Max Stop Loss - Risk Management VisualizerThis indicator helps traders implement proper risk management in their trading. For example, let's say that you were trading a $1,000 account and didn't want to risk more than 1% of your account on any one trade. If you were placing $100 positions, you wouldn't want the price to move more than 10% against you (10% of $100 is $10, which is 1% of $1,000). So, assuming you were trading without any leverage, you would put "1000" into the "Max Stop Loss %" field in the format box and the indicator would display red crosses 10% above and below the current price of the market you are looking at. If you were going to take that same trade with 10x leverage, you would want to enter "100" into the indicator's format box and the red crosses would then plot themselves 1% above and below the current price.
"Max Stop Loss - Risk Management Visualizer" is able to show all the way down to a 0.01% price variation with no upper limit.
MavilimW and Stop Loss IndicatorMavlimW and Stop Loss Indicator scripts which have prepared by kivancfr3762, are merged .
kivancfr3762 hocanın önemli çalışmaları, mavilimW ve Stop Loss Indicator betiklerinin birleştirilmiş halidir.

Mastering ATR for Smart Stop Loss and Take Profit PlacementUsing the ATR indicator to set Stop Loss and Take Profit levels provides a dynamic and flexible way to manage risk based on the volatility of the market. This method ensures that your SL and TP are always in tune with current market conditions, preventing unnecessary stop-outs while maximizing the potential for profit. The table in the script makes it easy to view your calculated levels directly on the chart, improving your trading efficiency.
If you're looking for a more automated way to manage your trades, integrating ATR-based SL and TP can be a powerful tool in your strategy.
Happy Trading!

ATR Trailing Stop Loss [V5]A complete ATR Trailing Stop Loss in version 5.
Features Include:
Timeframe Option
Long/Short Triggers (Green/Red Triangles)
Long/Short Conditions (Bottom Colored Line)
"Golden" Long/Short Triggers (Yellow Triangles)(Hanging Man or Shooting Star Candlestick patterns breaking ATR trailing stop)
Alerts

Auto Stop
A simple script using the last three bars(including the current) and draws a line on the chart under that for an easy automated stop loss point

ATR with Take and StopThis simple indicator will plot the take profit and stop loss values based on the ATR indicator.
It's possible to set how many times the ATR value will be applied to the closing price and
what trade type is used, Long or Short.

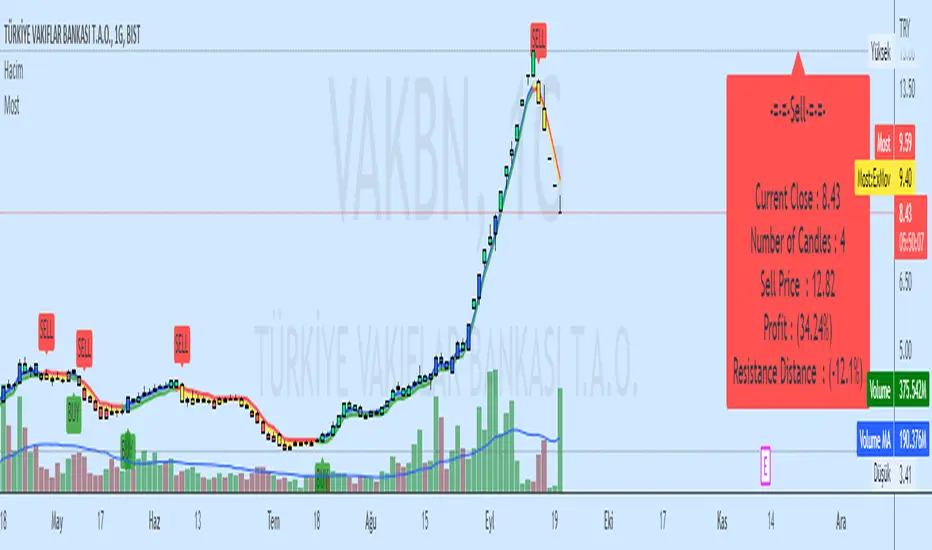
Moving Stop Loss (Most) by ceyhunATR is an indicator that has been removed and replaced with a moving average.Bar colors and infopanel have been added.
//Barcolor
Green = ExMov > Most and close > Most and low > Most
Blue = ExMov > Most and close > Most and low < Most
Red = Most > ExMov and close < Most and high < Most
Yellow = Most > ExMov and close < Most and high > Most
//It gives White color where there is deterioration.
//InfoPanel
Buy Price = Blue draws the circles at the purchase price.
Profit Long>20 = Risk level taken as a percentage, I got the highest 20%, you can determine as you wish.
Sell Price = Red draws the circles at the purchase price.
Profit Short>20 = Risk level taken as a percentage, I got the highest 20%, you can determine as you wish.
==Atr Original Code==
CDC ATR Trailing Stop V2.1 (2013)
==Most Code==
MOST by Anıl ÖZEKŞİ
Barcolor
Barcolor
ATR Pips with Stop LossThis indicator shares ATR pips and a calculated 1.5 x stop loss calculation.
1st number is ATR.
2nd number is ATR x 1.5 (a typical SL when trading daily time frame).
The plot lines are really not that important- it's the actual numbers.
What I do is uncheck the plot line checkboxes (ATR & SL) so it doesn't show up, that way I can reduce the indicator window.
This script is a modified script by ATR Pips . Kept the BB section for now as it might be useful, but doubt it.
Future updates:
- editable the multiple for SL
- static daily numbers (right now this shows the timeframe you are viewing, I'd keep that but add a static daily ATR so you have both)

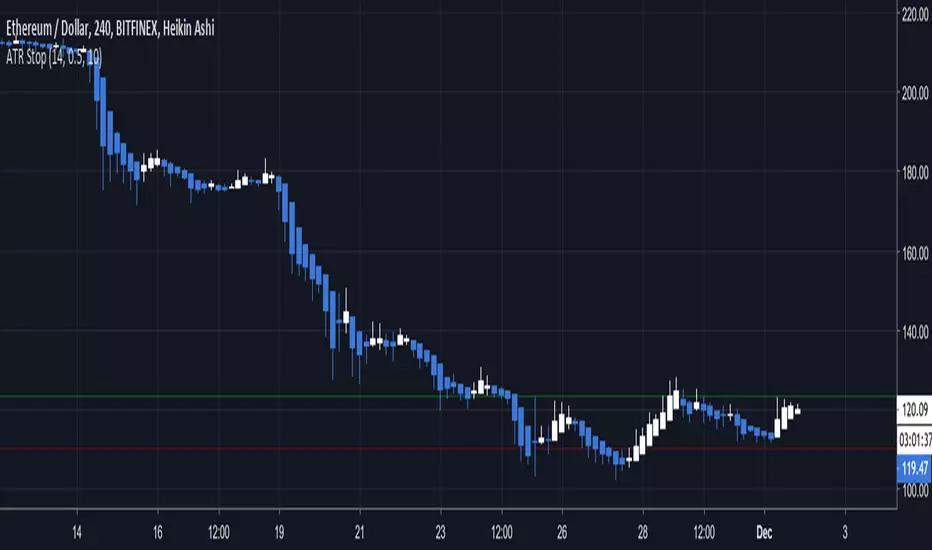
ATR Stop Loss VisualizerThis will help you figure out what stop loss settings work best for you. Some people might prefer ATR 14 * 0.5 for shorter timeframes, some might prefer more extreme settings such as ATR 30 * 2 to not get stopped out as often.
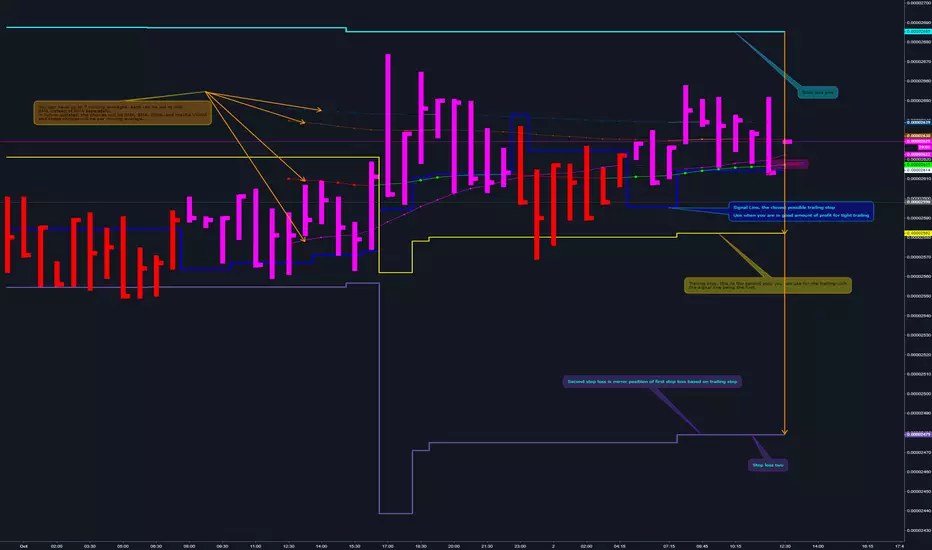
NeoIchi TrailingThis is the separation of moving average parts from NeoIchi indicator with addition of four different ATR setting that can be used for Stop Loss and Trailing Stops. The NeoIchi indicator won't have any moving averages any more, the code is secured but every one have access to use this indicator on their charts.
Custom ATR Stop Loss Calculator by riyukireiruCan automatically input the entry price, calculate ATR stop-loss, allow customizable period, adjustable table position, selectable MA ATR type, and customizable ATR value.

Long-Only Trailing Stop Loss Strategy by Ravi PrasadSimple & Eligant way to make money. As the profit % increases, the trailing stop loss follows tightly !
Multiple EMAs with RSI and ATR Stop-LossMultiple EMA Buy and Sell with pre condition of Overbought Oversold RSI pre requirement. Purple line is Stop Loss Level.

SMA150 Stop Loss AlertSMA150 indicator that alerts you when stock falls under 150 with additional of -2% (for avoiding early stop-loss)

AI - Williams Alligator Strategy (ATR Stop-Loss) AlertsAI - Williams Alligator Strategy (ATR Stop-Loss) with Alerts

ATR stop lossPlots the stop loss level based on average true range (ATR) and a multiplier of choice (1 to 2.5, default is 1.5), subtracted from closing price.
Additions in this version:
You can now show percentage labels to help evaluate the level of risk.
The color of the plotted line and the text labels can be picked by the user.

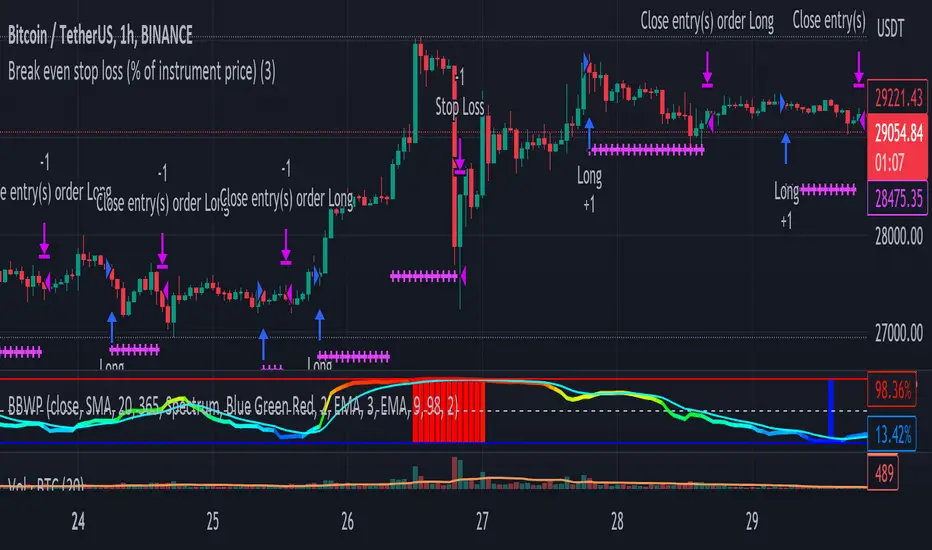
Break even stop loss (% of instrument price)Simply proof of concept to place a stop loss a percentage below entry price and move it to break even if the price moves the same percentage above the entre price.
EMA and MACD with Trailing Stop Loss (by Coinrule)An exponential moving average ( EMA ) is a type of moving average (MA) that places a greater weight and significance on the most recent data points. The exponential moving average is also referred to as the exponentially weighted moving average. An exponentially weighted moving average reacts more significantly to recent price changes than a simple moving average simple moving average ( SMA ), which applies an equal weight to all observations in the period.
Moving average convergence divergence ( MACD ) is a trend-following momentum indicator that shows the relationship between two moving averages of a security’s price. The MACD is calculated by subtracting the 26-period exponential moving average ( EMA ) from the 12-period EMA.
The result of that calculation is the MACD line. A nine-day EMA of the MACD called the "signal line," is then plotted on top of the MACD line, which can function as a trigger for buy and sell signals. Traders may buy the security when the MACD crosses above its signal line and sell—or short—the security when the MACD crosses below the signal line. Moving average convergence divergence ( MACD ) indicators can be interpreted in several ways, but the more common methods are crossovers, divergences, and rapid rises/falls.
The Strategy enters and closes the trade when the following conditions are met:
LONG
The MACD histogram turns bearish
EMA7 is greater than EMA14
EXIT
Price increases 3% trailing
Price decreases 1% trailing
This strategy is back-tested from 1 January 2022 to simulate how the strategy would work in a bear market and provides good returns.
Pairs that produce very strong results include XRPUSDT on the 1-minute timeframe. This short timeframe means that this strategy opens and closes trades regularly
In order to further improve the strategy, the EMA can be changed from 7 and 14 to, say, EMA20 and EMA50. Furthermore, the trailing stop loss can also be changed to ideally suit the user to match their needs.
The strategy assumes each order is using 30% of the available coins to make the results more realistic and to simulate you only ran this strategy on 30% of your holdings. A trading fee of 0.1% is also taken into account and is aligned to the base fee applied on Binance.

Oversold RSI with Tight Stop-Loss Strategy (by Coinrule)KRAKEN:LINKUSD
This is one of the best strategies that can be used to get familiar with technical indicators and start to include them in your rules on Coinrule .
ENTRY
1. This trading system uses the RSI (Relative Strength Index) to anticipate good points to enter positions. RSI is a technical indicator frequently used in trading. It works by measuring the speed and change of price movements to determine whether a coin is oversold (indicating a good entry point) or overbought (indicating a point of exit/entry for a short position). The RSI oscillates between 0 and 100 and is traditionally considered overbought when over 70 and oversold when below 30.
2. To pick the right moment to buy, the strategy enters a trade when the RSI falls below 30 indicating the coin is oversold and primed for a trend reversal.
EXIT
The strategy then exits the position when the price appreciates 7% from the point of entry. The position also maintains a tight stop-loss and closes the position if the price depreciates 1% from the entry price. The idea behind this is to cut your losing trades fast and let your winners ride.
The best time frame for this strategy based on our back testing data is the daily. Shorter time frames can also work well on certain coins, however in our experience, the daily works best. Feel free to experiment with this script and test it on a variety of your coins! With our back testing data a trading fee of 0.1% is taken into account. The fee is aligned to the base fee applied on Binance, which is the largest cryptocurrency exchange by volume. In the example shown, this strategy made a handsome net profit of 52.6% on Chainlink with 66.67% of trades being profitable.
You can execute this strategy on your favorite exchanges with Coinrule .

isamuch - 2MA Cross and Stop Lossสัญญาณซื้อ/ขาย : มาจาก Moving Average สองเส้นตัดกัน
Stop Loss : มาจากราคาต่ำสุด/สูงสุดของช่วงระหว่าง Moving Average สองเส้นตัดกันก่อนหน้ากับ Moving Average ตัดกันปัจจุบัน
