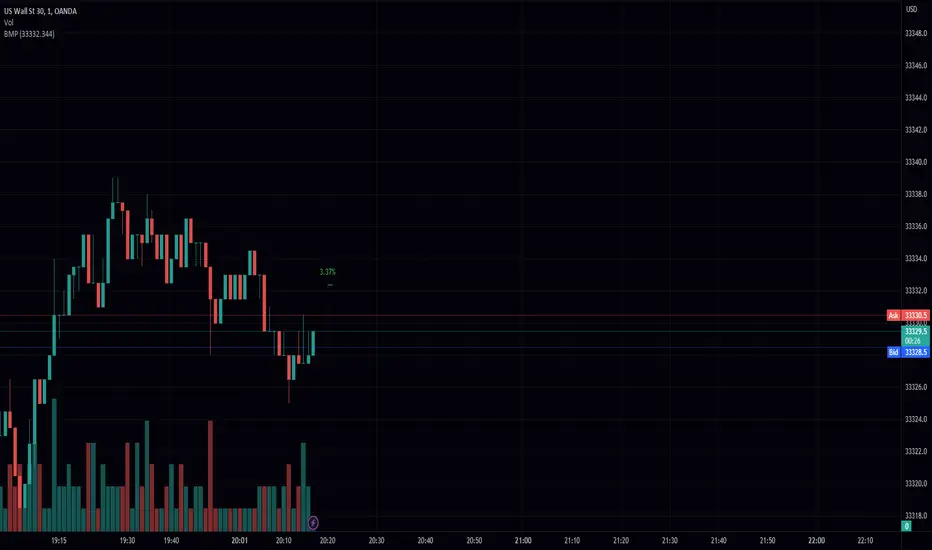
Bar Move Probability (BMP)Hello fellow traders! I am excited to share with you my latest creation, the Bar Move Probability (BMP) indicator. This powerful tool is designed to give you a statistical edge in your trading by helping you understand the likelihood of price movements based on historical data. In this blog post, I'll give you an overview of the indicator, its features, and how it can help you make more informed trading decisions. Let's dive in!
What is the Bar Move Probability Indicator?
The Bar Move Probability (BMP) indicator is a unique tool that calculates the probability of a bar's price movement, either up or down, based on past occurrences of similar price movements. This can give you valuable insights into the potential direction of the market, allowing you to make better-informed trading decisions.
One of the key features of the BMP indicator is that it allows you to choose the price you want to determine the probability of. By inputting your desired price, the indicator will analyze historical data and provide you with the likelihood of reaching that price, offering a more personalized approach to trading.
How Does the BMP Indicator Work?
The BMP indicator calculates the probability of a bar's price movement by comparing the current price change (in percentage) to historical price changes. It does this by maintaining separate arrays for green (bullish) and red (bearish) price movements, as well as corresponding arrays for the count of each movement.
Whenever a new bar is formed, the indicator checks whether the price movement (in percentage) is already present in the respective array. If it is, the corresponding count is updated. Otherwise, a new entry is added to the array, with an initial count of 1.
After analyzing the historical data, the BMP indicator calculates the probability of each price movement by dividing the count of each movement by the sum of all counts. These probabilities are then stored in separate arrays for green and red movements.
Finally, the indicator displays the probability of the current price movement as a label on the chart. The label is color-coded, with green indicating a bullish price movement and red indicating a bearish price movement.
How Can the BMP Indicator Benefit Your Trading?
The primary benefit of the BMP indicator is its ability to provide you with a statistical edge in your trading. By analyzing historical price data, the indicator helps you understand the likelihood of a certain price movement occurring, allowing you to make more informed decisions about your trades.
The customizable nature of the BMP indicator, allowing you to input your desired price, makes it a valuable tool for traders with specific price targets in mind. By understanding the probability of reaching your target price, you can better manage your risk and optimize your trading strategy.
For example, suppose the BMP indicator shows a high probability of a bullish price movement towards your target price. In that case, you may consider entering a long position or tightening your stop loss on an existing short position. Conversely, if the indicator displays a high probability of a bearish price movement away from your target price, you may consider entering a short position or taking profit on an existing long position.
The BMP indicator can be used in conjunction with other technical analysis tools and indicators to further strengthen your trading strategy. For example, you can combine the BMP indicator with support and resistance levels, trend lines, and moving averages to better time your entries and exits.
Wrapping Up
In conclusion, the Bar Move Probability (BMP) indicator is a powerful and customizable tool that can help you gain a statistical edge in your trading. By analyzing historical price data and allowing you to input your desired price, the indicator provides valuable insights into the likelihood of price movements, enabling you to make better-informed trading decisions.
I hope you find the BMP indicator useful
在腳本中搜尋"support resistance"
RSI + MA, LinReg, ZZ (HH HL LH LL), Div, Ichi, MACD and TSI HistRelative Strength Index with Moving Average, Linear Regression, Zig Zag (Highs and Lows), Divergence, Ichimoku Cloud, Moving Average Convergence Divergence and True Strength Index Histogram
This script is based on zdmre's RSI script, I revamped a lot of things and added a few indicators from ParkF's RSI script.
Disable Labels in the Style tab and the histogram if you don't enlarge the indicator and it seems too small.
Look to buy in the oversold area and bounce of the support of the linear regression.
Look to sell in the overbought area and bounce of the resistance of the linear regression.
Look for retracement to the moving average or horizontal lines, and divergences for potential reversal.
RSI
The Relative Strength Index (RSI) is a well versed momentum based oscillator which is used to measure the speed (velocity) as well as the change (magnitude) of directional price movements.
Moving Average
Moving Average (MA) is a good way to gauge momentum as well as to confirm trends, and define areas of support and resistance.
Linear Regression
The Linear Regression indicator visualizes the general price trend of a specific part of the chart based on the Linear Regression calculation.
Zig Zag (Highs and Lows)
The Zig Zag indicator is used to identify price trends, and in doing so plots points on the chart to mark whenever prices reverse by a larger percentage point than a predetermined variable or marker.
Divergence
The divergence indicator warns traders and technical analysts of changes in a price trend, oftentimes that it is weakening or changing direction.
Ichimoku Cloud
The Ichimoku Cloud is a package of multiple technical indicators that signal support, resistance, market trend, and market momentum.
MACD and TSI Histogram
MACD can be used to identify aspects of a security's overall trend.
The True Strength Index indicator is a momentum oscillator designed to detect, confirm or visualize the strength of a trend.

Gann Square of 144This indicator will create lines on the chart based on W.D. Gann's Square of 144. All the inputs will be detailed below
Why create this indicator?
I didn't find it on Tradingview (at least with open source). But the main reason is to study the strategy and be able to draw it fast. Manually drawing the square is not hard, but moving all together to the right spots and scale was time-consuming.
It has a lot of inputs...
Yes, each square point divisible by 6 has information with some options, so the user can create any configuration he wants. Also, it has the advantage of having the square built in seconds and adjusting itself on each new calculation.
About the inputs
Starting Date
This input will be used when the "Set Upper/Lower Prices and Start Bar Automatically" checkbox is not selected. The indicator will calculate all the line locations on the chart using the selected start date. When selecting this input, change the Manual Max and Min Prices to the better calculation
Manual Max/Min Price
This input will be used when the "Set Upper/Lower Prices and Start Bar Automatically" checkbox is not selected. The indicator will calculate all the line's locations on the chart using these prices
Set Upper/Lower Prices and Start Bar Automatically
Selects if the starting date will be automatically selected by the system or based on the input data. When it's set, the indicator will use the most recent bar as the middle point of the square, using the higher price as the Upper Price and the lowest price as the Lower Price in the latest 72 bars (or more based on the Candles Per Division parameter)
Update at a new bar
When this option is market, the indicator will update all created lines to match the new bar position, together with all the possible new Upper/Lower prices. Let it unchecked to watch the progression of the price while the square remains fixed in the chart.
Top X-Axis
When checked, it will display the labels on the Top of the square
Bottom X-Axis
When checked, it will display the labels on the Bottom of the square
Left X-Axis
When checked, it will display the labels on the left of the square
Right X-Axis
When checked, it will display the labels on the right of the square
Show Prices on the Right Y-Axis
When checked, it will display the prices together with the labels on the right of the square
Show Vertical Divisions
Show the lines that will divide the square into 9 equal parts
Show Extra Lines
Show unique lines that will come from the Top and bottom middle of the square, connecting the center to the 36 and 108 levels
Show Grid
When selected, it will display a grid in the square
Line Patterns
A selector with some options of built-in lines configuration. When any option besides None is selected, it will override the lines inputs below
Numbers Color
Select the color of each number on the Axis
Vertical Lines Color
Select the color of the vertical lines
Grid Color
Select the grid line color
Connections from corners to N
Each corner is represented by 2 characters, so they all fit in a single line
It will indicate where the line starts and where it ends
┏ ↓ = Top Left to Bottom
┏ → = Top Left to Right
┗ ↑ = Bottom Left to Top
┗ → = Bottom Left to Right
┓ ← = Top Right to Left
┓ ↓ = Top Right to Bottom
┛ ← = Bottom Right to Left
┛ ↑ = Bottom Right to Top
Besides selecting what line will be created, it's possible to select the color, the style, and the extension
How to use this indicator
When you dig into Gann's books for more information about the square of 144, you find that it was part of his setup with multiple indicators (technical and fundamental, and astrological). It is not a "one indicator" setup, so it's hard to say that you will find entries, exits, stop loss, and take profit in this. Still, it will help see trendiness, support, and resistance levels.
Mixing this with other indicators is probably a good idea, but some may find this indicator the only one needed.
Some aspects of the square
The end of the square is important, so where it starts is crucial. The end is important because it is where the price and time expire. The other parts of the square are defined based on their start and end, so placing them right is essential.
So, where to set the start of the square?
The last major low is the most indicated. The minimum price will be the lowest, and the max price will be the last major Top. Note that the indicator uses 1 candle on each point.
After finding the start, the minimum, and the maximum prices for the square, it will draw all lines. Another essential part of the square is The Midpoint.
The midpoint is the most crucial part of the square and is the best way to see if you positioned the square correctly. When the price is inside the square, using the starting candle as the start, a second higher low or a lower high occurs in that spot. When using the Vertical lines in the indicator, it's the middle square inside Gann's square.
The other divisions will be opposing each other most of the time. So if the price is rising in the 1/3 of the square, it's common to see the price fall in the 3/3 of the square.
More information about these aspects here
Considerations
This indicator was meant for price targets and a time calculator for possible support/resistances in the chart. It was created by William Delbert Gann and was part of his setup for trading almost a century ago. The lines will form geometric figures, which Gann used with high accuracy to predict tops/bottoms and when they would occur.

Volume Profile and Volume Indicator by DGTVolume Profile (also known as Price by Volume) is an charting study that displays trading activity over a specified time period at specific price levels. It is plotted as a horizontal histogram on the finacial isntrumnet's chart that highlights the trader's interest at specific price levels.
The histogram is used by traders to predict areas of support and resistance. Price levels where the traded volume is high could be assumed as support and resistance levels.
Price may experience difficulty moving above or below areas with large bars. Usually there is a great deal of activity on both the buy and sell side and the market stays at that price level for a great deal of time
It is advised to use volume profile in conjunction with other forms of technical analysis to maximize the odds of success
Light version of Volume Profile is added to Price Action - Support & Resistance by DGT

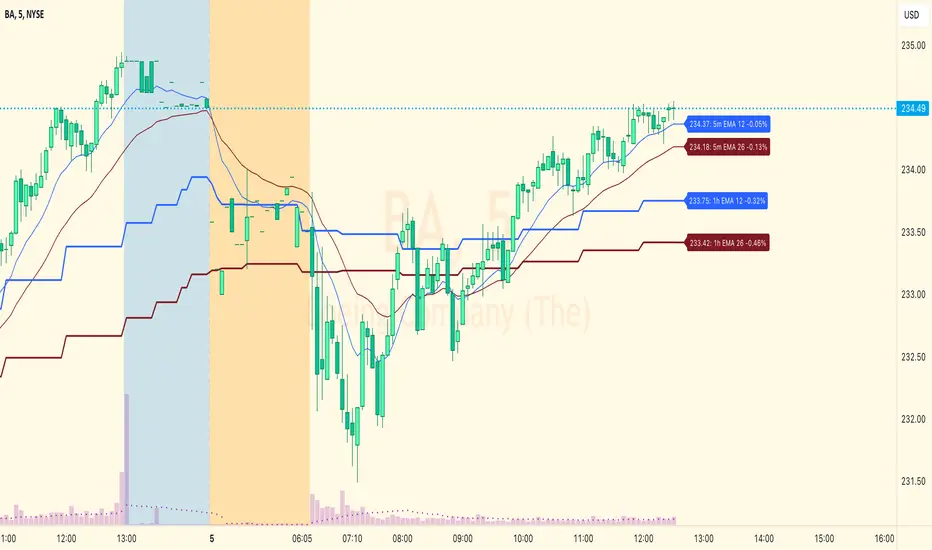
EMA Levels, Multi-TimeframeThe exponential moving average (EMA) tracks price over time, giving more importance to recent price data than simple moving average (SMA). EMAs for larger timeframes are generally considered to be stronger supports/resistances for price to move through than smaller timeframes. This indicator allows you to specify two different EMA lengths that you want to track. Additionally, this indicator allows you to display not just the EMA levels of your currently viewed timeframe on the chart, but also shows the EMA levels of up to 4 different timeframes on the same chart. This allows you to quickly see if multiple EMA levels are aligning across different timeframes, which is an even stronger indication that price is going to meet support or resistance when it meets those levels on the chart. There are a lot of nice configuration options, like:
Ability to customize the EMA lengths you want to track
Style customization (color, thickness, size)
Hide any timeframes/levels you aren't interested in
Labels on the chart so you can tell which plots are the EMA levels
Optionally display the plot as a horizontal line if all you care about is the EMA level right now
Liquidity Levels [LuxAlgo]The Peak Activity Levels indicator displays support and resistance levels from prices accompanied by significant volume. The indicator includes a histogram returning the frequency of closing prices falling between two parallel levels, each bin shows the number of bullish candles within the levels.
1. Settings
Length: Lookback for the detection of volume peaks.
Number Of Levels: Determines the number of levels to display.
Levels Color Mode: Determines how the levels should be colored. "Relative" will color the levels based on their location relative to the current price. "Random" will apply a random color to each level. "Fixed" will use a single color for each level.
Levels Style: Style of the displayed levels. Styles include solid, dashed, and dotted.
1.1 Histogram
Show Histogram: Determines whether to display the histogram or not.
Histogram Window: Lookback period of the histogram calculation.
Bins Colors: Control the color of the histogram bins.
2. Usage
The indicator can be used to display ready-to-use support and resistance. These are constructed from peaks in volume. When a peak occurs, we take the price where this peak occurred and use it as the value for our level.
If one of the levels was previously tested, we can hypothesize that the level might be used as support/resistance in the future. Additional analysis using volume can be done in order to confirm a potential bounce.
The histogram can return various information to the user. It can show if the price stayed within two levels for a long time and if the price within two levels was mostly made of bullish or bearish candles.
In the chart above, we can see that over the most recent 200 bars (determined by Histogram Window) 68 closing prices fall between levels A and B, with 27 bars being bullish.
Additionally, the width of a bin and its length can sometimes give information about the volatility of a specific price variation. If a bin is very wide but short (a low number of closing prices fallen within the levels) then we can conclude a most of the movement was done on a short amount of time.

Auto Phivots S/R [DM]Greetings colleagues
Today I share the classic pivot points indicator
Added options:
Standard levels
Fibonacci levels "up to 261'8"
Logarithmic scale option
//Pivot Points Standard
//Pivot Points Standard — is a technical indicator that is used to determine the levels
//at which price may face support or resistance. The Pivot Points indicator consists of
//a pivot point (PP) level and several support (S) and resistance (R) levels.
//
//Calculation
//PP, resistance and support values are calculated in different ways, depending on
//the type of the indicator, specified by the Type field in indicator inputs. To
//calculate PP and support/resistance levels, the values OPENcurr, OPENprev, HIGHprev,
//LOWprev, CLOSEprev are used, which are the values of the current open and previous
//open, high, low and close, respectively, on the indicator resolution. The indicator
//resolution is set by the input of the Pivots Timeframe. If the Pivots Timeframe is set
//to AUTO (the default value), then the increased resolution is determined by the
//following algorithm:
//
//for intraday resolutions up to and including 15 min, DAY (1D) is used
//for intraday resolutions more than 15 min, WEEK (1W) is used
//for daily resolutions MONTH is used (1M)
//for weekly and monthly resolutions, 12-MONTH (12M) is used

MTF Key Levels - Support and ResistanceThis indicator shows how to Multi Time Frame (MTF) interpret levels:
Watch how price acts around these levels and how they can act as support/resistance and can be used as great confluence levels for your technical analysis.
This indicator displays:
VWAP Levels
Daily / Weekly / Monthly / Yearly
Within the chart above I have marked out how displaying these VWAP levels can provide support and resistance levels to be aware of.
Daily – Weekly - Monthly – Yearly Levels
O = Open / H = High / L = Low
pO = Previous Open / pH = Previous High / pL = Previous Low / pEQ = Previous Equlibrium
Having previous Low/High levels makes you aware of Swing Failure Patterns (SFP). Also the daily/weekly/monthly opening and previous opening can assist with the trend.
Daily Open: Gives you an idea who is in control for the day. This level very often acts as strong support or resistance.
Weekly Open: Indicates where the price is within the higher timeframe.
Monthly Open & Yearly Levels: Overview of direction for the whole month without looking at a monthly chart and Yearly chart
Line Options
Within the line options you can choose to have a clean chart and display a “short line”. These line length can be adjusted by the user.
Line just to the right.
Line across the screen.
Disclaimer: The Monthly and Yealy VWAP will only show on higher timeframes this is due to restriction of how many candles can be shown on the chart. The candles displayed need to go back to either the start of the month of year to be able to calculate their VWAPs.

SMA 200 Ribbon MTF - Support and ResistanceThe SMA 200 is one of the most important and strongest support/resistance lines on any timeframe. This script pulls the SMA 200 line from multiple timeframes so traders can visually see price action bounce between support and resistance . The current timeframes SMA 200 is displayed in white and turns yellow to signify "pressure". Can be used on higher timeframes to find bull action. This indicator can also be used to filter out pumps and dumps as shown in example 3 and 4.
Example of indicator on 5 min timeframe. Candles bounce along SMA200 lines.
Example of indicator on daily timeframe . Lines turn green and price action pumps. Lines turn red and price action dumps.
Example 3: A clean crossover of lines usually signals a bullish pump.
Example 4: Tangled or messy lines tend to result in a dump as price action struggles to cross resistance. A pullback is required to "clean" the lines.
EMA Band can be turned on using "tickbox" in settings menu.

[fikira] Bollinger Bands + Higher Time FramesHere is my take on BB and MTF, based on the most excellent work of
"PineCoders" (MTF Selection Framework functions)!
The big advantage is that on 1 image you can easily see where
price is compared to 5 or less BB Bands (each of different Time Frames).
This gives a lot of Support and Resistance area's!
Includes:
- 1 Bollinger Bands (can be enabled/disabled - "Bollinger Bands"
- 4 Bollinger Bands (each can be enabled/disabled - "HTF Selection 1-4")
Each BB has its colour (can be changed)
- Labels (Timeframe and price) can be enabled/disabled
- Labels position and size can be changed
...

Multi Timeframe Moving Average Collection | Swing [aamonkey]This is a Multi Timeframe Moving Average Collection (Swing Edition).
Why use it?
- Spot cluster of MAs on one chart
- See support and resistance
- Spot "freefall zones"
In the default settings you will get:
20, 100 and 200 MA of the 1D, W, and the W chart.
The color indicates significance!
From weaker to stronger support/resistance:
green(1D),yellow(W),red(M)
- Length of the MAs is modifiable
- Timeframes of the MAs is modifiable
- Which MAs you want to see
- Colors
Why use this if there is a Swing edition, that can do the same?
You can use this Swing Edition if you don't want to change between the Swing and Scalp timeframes in the settings.
Just turn on of the two on or off.

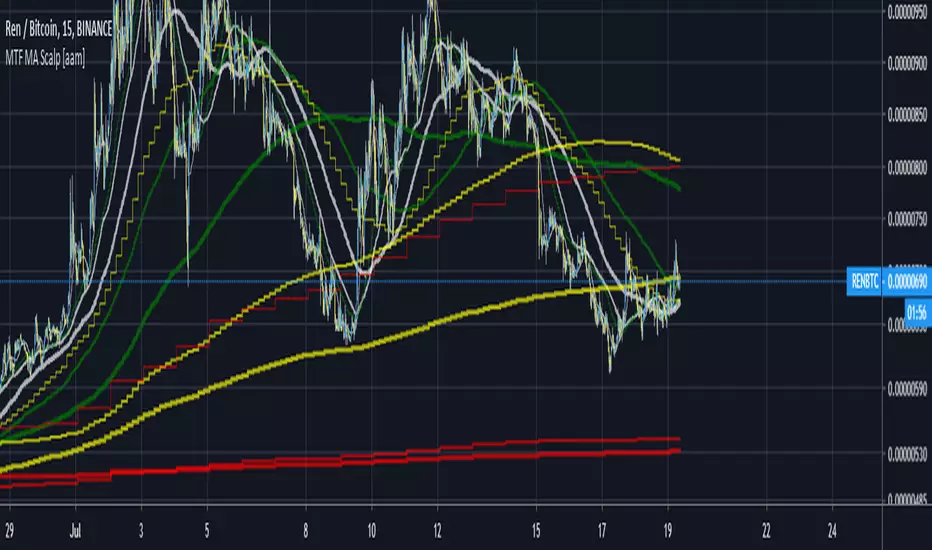
Multi Timeframe Moving Average Collection | Scalp [aamonkey]This is a Multi Timeframe Moving Average Collection (Scalp Edition).
Why use it?
- Spot cluster of MAs on one chart
- See support and resistance
- Spot "freefall zones"
In the default settings you will get:
20, 100 and 200 MA of the 15min, 1h, 4h, and the 1D chart.
The color indicates significance!
From weaker to stronger support/resistance:
white(15min), green(1h),yellow(4h),red(1D)
- Length of the MAs is modifiable
- Timeframes of the MAs is modifiable
- Which MAs you want to see
- Colors
5 MAs w. alerts [LucF]Is this gazillionth MA indicator worth an addition to the already crowded field of contenders? I say yes! This one shows up to 5 MAs and 6 different marker conditions that can be used to create alerts, among many other goodies.
Features
MAs can be darkened when they are falling.
MAs from another time frame can be displayed, with the option of smoothing them.
Markers can be filtered to Longs or Shorts only.
EMAs can be selected for either all or the two shortest MAs.
The background can be colored using any of the marker states except no. 3.
Markers are:
1. On crosses between any two user-defined MAs,
2. When price is above or below an MA,
3. On Quick Flips (a specific setup involving a cross, multiple MA states and increasing volume, when available),
4. When the difference between two MAs is within a % of its high/low historic values,
5. When an MA has been rising/falling for n bars,
6. When the difference between two MAs is greater than a multiple of ATR.
Some markers use similar visual cues, so distinguishing them will be a challenge if they are used concurrently.
Alerts
Alerts can be created on any combination of alerts. Only non-consecutive instances of markers 5 and 6 will trigger the alert condition. Make sure you are on the interval you want the alert to run at. Using the “Once Per Bar Close” trigger condition is usually the best option.
When an alert is created in TradingView, a snapshot of the indicator’s settings is saved with the alert, which then takes on a life of its own. That is why even though there is only one alert to choose from when you bring up the alert creation dialog box and choose “5 MAs”, that alert can be triggered from any number of conditions. You select those conditions by activating the markers you want the alert to trigger on before creating the alert. If you have selected multiple conditions, then it can be a good idea to record a reminder in the alert’s message field. When the alert triggers, you will need the indicator on the chart to figure out which one of your conditions triggered the alert, as there is currently no way to dynamically change the alert’s message field from within the script.
Background settings will not trigger alerts; only marker configurations.
Notes
MAs are just… averages. Trader lure would have them act as support and resistance levels. I’m not sure about that, and not the only one thinking along these lines. Adam Grimes has studied moving averages in quite a bit of detail. His numbers point to no evidence indicating they act as support/resistance, and to specific MA lengths not being more meaningful than others. His point of view is debated by some—not by me. Mean reversion does not entail that price stops when it reaches its MA; rather, it makes sense to me that price would often more or less oscillate around its MA, which entails the MA does not act as support/resistance. Aren’t the best mean reversion opportunities when price is furthest away from its MA? If so, it should be more profitable to identify these areas, which some of this indicator’s markers try to do.
I think MAs can be much more powerful when thought of as instruments we can use to situate price events in contexts of various resolutions, from the instantaneous to the big picture. Accordingly, I use the relative positions and slopes of MAs in both discretionary and automated trading; but never their purported ability to support/resist.
Regardless of how you use MAs, I hope you will find this indicator useful.
Biased References
The Art and Science of Technical Analysis: Market Structure, Price Action, and Trading Strategies, Adam Grimes, 2012.
Does the 200 day moving average “work”?
Moving averages: digging deeper

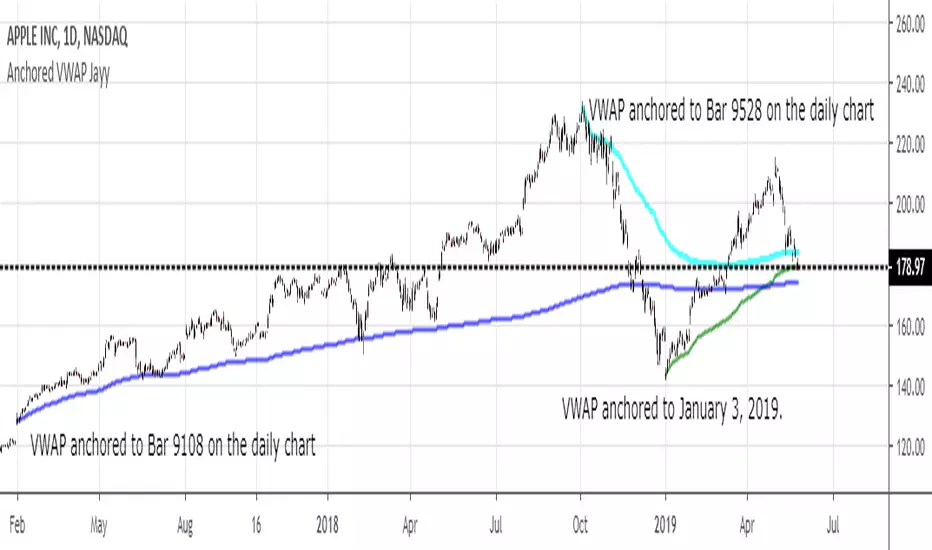
MIDAS VWAP Jayy his is just a bash together of two MIDAS VWAP scripts particularly AkifTokuz and drshoe.
I added the ability to show more MIDAS curves from the same script.
The algorithm primarily uses the "n" number but the date can be used for the 8th VWAP
I have not converted the script to version 3.
To find bar number go into "Chart Properties" select " "background" then select Indicator Titles and "Indicator values". When you place your cursor over a bar the first number you see adjacent to the script title is the bar number. Put that in the dialogue box midline is MIDAS VWAP . The resistance is a MIDAS VWAP using bar highs. The resistance is MIDAS VWAP using bar lows.
In most case using N will suffice. However, if you are flipping around charts inputting a specific date can be handy. In this way, you can compare the same point in time across multiple instruments eg first trading day of the year or an election date.
Adding dates into the dialogue box is a bit cumbersome so in this version, it is enabled for only one curve. I have called it VWAP and it follows the typical VWAP algorithm. (Does that make a difference? Read below re my opinion on the Difference between MIDAS VWAP and VWAP ).
I have added the ability to start from the bottom or top of the initiating bar.
In theory in a probable uptrend pick a low of a bar for a low pivot and start the MIDAS VWAP there using the support.
For a downtrend use the high pivot bar and select resistance. The way to see is to play with these values.
Difference between MIDAS VWAP and the regular VWAP
MIDAS itself as described by Levine uses a time anchored On-Balance Volume (OBV) plotted on a graph where the horizontal (abscissa) arm of the graph is cumulative volume not time. He called his VWAP curves Support/Resistance VWAP or S/R curves. These S/R curves are often referred to as "MIDAS curves".
These are the main components of the MIDAS chart. A third algorithm called the Top-Bottom Finder was also described. (Separate script).
Additional tools have been described in "MIDAS_Technical_Analysis"
Midas Technical Analysis: A VWAP Approach to Trading and Investing in Today’s Markets by Andrew Coles, David G. Hawkins
Copyright © 2011 by Andrew Coles and David G. Hawkins.
Denoting the different way in which Levine approached the calculation.
The difference between "MIDAS" VWAP and VWAP is, in my opinion, much ado about nothing. The algorithms generate identical curves albeit the MIDAS algorithm launches the curve one bar later than the VWAP algorithm which can be a pain in the neck. All of the algorithms that I looked at on Tradingview step back one bar in time to initiate the MIDAS curve. As such the plotted curves are identical to traditional VWAP assuming the initiation is from the candle/bar midpoint.
How did Levine intend the curves to be drawn?
On a reversal, he suggested the initiation of the Support and Resistance VVWAP (S/R curve) to be started after a reversal.
It is clear in his examples this happens occasionally but in many cases he initiates the so-called MIDAS S/R VWAP right at the reversal point. In any case, the algorithm is problematic if you wish to start a curve on the first bar of an IPO .
You will get nothing. That is a pain. Also in Levine's writings, he describes simply clicking on the point where a
S/R VWAP is to be drawn from. As such, the generally accepted method of initiating the curve at N-1 is a practical and sensible method. The only issue is that you cannot draw the curve from the first bar on any security, as mentioned without resorting to the typical VWAP algorithm. There is another difference. VWAP is launched from the middle of the bar (as per AlphaTrends), You can also launch from the top of the bar or the bottom (or anywhere for that matter). The calculation proceeds using the top or bottom for each new bar.
The potential applications are discussed in the MIDAS Technical Analysis book.
HTF Candles Pro by MurshidFx# HTF Candles Pro by MurshidFx
## Professional Trading Indicator for Multi-Timeframe Market Structure Analysis
**HTF Candles Pro** is an advanced, open-source trading indicator that synthesizes Higher Timeframe (HTF) candle visualization with CISD (Change in State of Delivery) detection, providing comprehensive market structure analysis across multiple timeframes. Designed for traders at all experience levels—from scalpers to swing traders—this tool enables precise alignment of trades with higher timeframe momentum while identifying critical market structure transitions.
---
## Core Functionality
This indicator integrates three essential analytical frameworks:
- **HTF Candle Visualization** – Inspired by the innovative work of Fadi x MMT's MTF Candles indicator
- **CISD Detection System** – Algorithmic identification of significant market structure reversals
- **Intelligent Session Level Management** – Automated consolidation of overlapping session markers for enhanced chart clarity
The result is a sophisticated yet streamlined analytical tool that delivers actionable market insights with minimal visual complexity.
---
## Feature Set
### Higher Timeframe Candle Analysis
Monitor higher timeframe price action seamlessly without chart switching. The indicator employs automatic HTF selection based on current timeframe, with manual override capability.
**Components:**
- **Primary HTF Display**: Automatically positioned adjacent to current price action
- **Secondary HTF Display**: Optional dual-timeframe analysis capability
- **Adaptive Time Labeling**: Context-aware formatting (intraday times, day names, week numbers)
- **Real-Time Countdown**: Optional timer displaying remaining time until HTF candle close
- **Customizable Color Schemes**: Full color customization for bullish and bearish candles
### CISD Detection (Change in State of Delivery)
The CISD system identifies critical inflection points where market structure undergoes directional change, signaling potential trend reversals or continuations.
**Mechanism:**
- **Market Structure Monitoring**: Continuous tracking of swing highs and lows
- **Liquidity Sweep Detection**: Identification of stop-hunt patterns preceding reversals
- **Reversal Confirmation**: Validation-based CISD level plotting upon structure break confirmation
- **Clear Visual Signals**: Bullish CISD (blue) and bearish CISD (red) demarcation
- **Optimized Display**: Default 5-bar line length (adjustable) minimizes chart clutter
**Technical Definition:**
CISD occurs when price breaches structure in one direction—typically sweeping liquidity and triggering stops—then reverses to break structure in the opposite direction, indicating a fundamental shift in market delivery bias.
### Intelligent Session Level Management
Eliminates visual clutter caused by overlapping session opens at identical price levels through automated consolidation.
**Functionality:**
- **Automatic Consolidation**: Merges multiple concurrent session opens into single reference lines
- **Combined Labeling**: Creates unified labels (e.g., "Week-Day Open," "4H-Day-Week Open")
- **Enhanced Clarity**: Maintains professional chart aesthetics while preserving all relevant information
**Supported Session Intervals:**
- 30-Minute Opens
- 4-Hour Opens
- Daily Opens
- Weekly Opens
- Monthly Opens
### Advanced Market Structure Tools
**Liquidity Sweep Identification:**
Highlights price wicks extending beyond previous HTF extremes that close within range—characteristic liquidity grab patterns.
**HTF Midpoint Reference:**
Displays the 50% retracement level of the most recent completed HTF candle, serving as a key reference for entries and profit targets.
**HTF Opening Price:**
Tracks current HTF candle open price, frequently functioning as dynamic support or resistance.
**Interval Demarcation:**
Visual separators defining HTF period boundaries for enhanced temporal clarity.
### Information Dashboard
Compact, customizable dashboard displaying:
- Current symbol and active timeframe
- HTF candle countdown timer
- Active trading session (Asia/London/New York)
- Current date and time
Flexible positioning: configurable for any chart corner.
---
## Default Configuration
Optimized settings for immediate professional-grade chart presentation:
- **Secondary HTF**: Disabled (enable for multi-timeframe comparative analysis)
- **CISD Bullish Color**: Blue (#0080ff) – optimal visibility with reduced eye strain
- **CISD Line Width**: 1 pixel – subtle yet discernible
- **CISD Line Length**: 5 bars – balanced visibility without excessive clutter
- **Session Opens**: Smart consolidation enabled – eliminates overlapping labels
---
## Application Strategies
### Trend Following
1. Monitor CISD confirmations aligned with HTF trend direction
2. Utilize HTF candle color for directional bias confirmation
3. Execute entries on pullbacks to HTF midpoint or open price levels
### Reversal Trading
1. Identify counter-trend CISD formations
2. Await HTF candle close confirming new directional bias
3. Use session opens as secondary confirmation levels
### Scalping
1. Trade exclusively in HTF candle direction
2. Employ lower timeframe CISD signals for precise entry timing
3. Target HTF midpoint or subsequent session open levels
### Structure-Based Trading
1. Mark liquidity sweep levels as potential reversal zones
2. Monitor CISD formations at key session opens
3. Confirm trend changes via HTF candle closes
---
## Customization Parameters
Comprehensive customization options:
- **Color Schemes**: Independent control of bull/bear candles, borders, CISD signals, session levels
- **Dimensional Settings**: Candle width, line thickness, label sizing
- **Display Quantities**: HTF candle count (1-10 range)
- **Positioning**: Candle offset, dashboard placement, label positioning
- **Line Styles**: Solid, dashed, or dotted rendering
- **Timeframe Selection**: Manual secondary HTF specification
---
## Attribution
**HTF Candle Visualization:**
The HTF candle rendering methodology draws inspiration from Fadi x MMT's "MTF Candles" indicator. Their elegant implementation of multi-timeframe candle visualization provided valuable reference for this development. Recognition and appreciation to their contribution to the TradingView community.
**CISD Detection:**
Proprietary CISD detection algorithm engineered to identify market structure transitions with high signal clarity and reduced false positive rate.
**Session Level Consolidation:**
Custom-developed intelligent grouping system addressing the common challenge of overlapping session labels at coincident price levels.
---
## Open Source License
This indicator is released as open source for the TradingView community. Permitted uses include:
- Implementation in live trading
- Educational study for Pine Script learning
- Personal modification and customization
- Distribution among trading communities
Community contributions, improvements, and derivative works are welcomed and encouraged.
---
## Implementation Guide
1. **Installation**: Click "Add to Chart"
2. **Configuration Access**: Open indicator settings panel
3. **Initial Use**: Default settings provide optimal starting configuration
4. **Optional Features**: Enable secondary HTF for multi-timeframe analysis
5. **Theme Integration**: Adjust color schemes to match chart aesthetics
---
## Best Practices
**Timeframe Optimization:**
- 1-5 minute charts: Optimal with 15m or 1H HTF
- 15-30 minute charts: Effective with 4H HTF
- 1-4 hour charts: Suitable for Daily HTF
- Daily charts: Best utilized with Weekly/Monthly HTF
**CISD Trading Guidelines:**
- Require CISD confirmation before position entry
- Prioritize CISD signals at significant levels (session opens, HTF midpoints)
- Confirm CISD direction aligns with HTF candle bias
- Apply contextual filtering—not all CISD signals warrant trades
**Session Open Strategy:**
- Weekly opens typically provide robust support/resistance
- Daily opens offer reliable intraday reference points
- 4-Hour opens effective for short-term scalping
- Consolidated labels (e.g., "Week-Day Open") indicate confluence zones with elevated significance
---
## Technical Specifications
**Performance Optimization:**
- Intelligent object management prevents TradingView rendering limits
- Efficient array processing for session consolidation
- Proper memory management through systematic object deletion
- Consistent performance across all timeframe ranges
**Compatibility:**
- Universal timeframe support
- Optimized for all market types (forex, stocks, crypto, futures)
- Minimal computational overhead
---
## Support & Development
**Feedback Channels:**
- Comment section for user feedback and suggestions
- Bug reports and feature requests welcomed
- Community-driven enhancement consideration
**Documentation:**
- Well-commented source code for learning purposes
- Clear section organization for easy navigation
- Comprehensive type definitions for structural clarity
- Educational value for market structure concept understanding
---
## Version Information
**Version:** 1.0 (Initial Release)
**License:** Open Source
**Category:** Multi-Timeframe Analysis | Market Structure
**Compatibility:** All Timeframes
**Language:** Pine Script v5
---
**For optimal results:**
- Provide feedback through comments
- Share with trading communities
- Submit enhancement suggestions
- Report technical issues for resolution
**Professional Support:**
Available through comment section for technical inquiries, implementation questions, and feature requests.
---
*Developed for the TradingView trading community | Professional-grade market structure analysis | Open source contribution*

HTF Session Boxes H4 > H2 > H1HTF Session Boxes H4 > H2 > H1
Visualize higher timeframe candle structures on lower timeframe charts with nested, customizable boxes.
Overview
HTF Session Boxes plots 4-hour, 2-hour, and 1-hour candle ranges as nested boxes directly on your lower timeframe charts (15M and below). This provides instant visual context of higher timeframe structure without switching between different chart timeframes.
Key Features
- Three Timeframe Levels: Simultaneously displays 4H, 2H, and 1H candle boxes
- Nested Design: Boxes are layered inside each other for clear hierarchical structure
- Real-Time Updates: Boxes dynamically adjust as higher timeframe candles develop
Fully Customizable:
-Individual colors and transparency for each timeframe
-Custom border colors, widths, and styles (solid, dashed, dotted)
-Toggle each timeframe on/off independently
Best Use Cases
-Scalping & Day Trading: Maintain awareness of higher timeframe structure while trading lower
timeframes
-Session Analysis: Clearly see 4H session boundaries and internal 2H/1H divisions
-Support/Resistance: Identify key levels where higher timeframe candles open, close, or create
highs/lows
-Multi-Timeframe Confluence: Spot when multiple timeframes align at key price levels

Adaptive Volatility Bands | AlphaNattAdaptive Volatility Bands (AVB) | AlphaNatt
Professional-grade dynamic bands that adapt to market volatility and trend strength, featuring smooth gradient visualization for enhanced chart clarity.
🎯 CORE CONCEPT
AVB creates self-adjusting bands around a customizable basis line, expanding during trending markets and contracting during consolidation. The gradient fill provides instant visual feedback on price position within the volatility envelope.
✨ KEY FEATURES
5 Basis Types: Choose between SMA, EMA, ALMA, KAMA, or VWMA for the centerline calculation
Adaptive Band Width: Bands automatically widen in strong trends and tighten in ranging markets
Smooth Gradient Fills: 10-layer gradient on each side for professional depth visualization
Multiple Volatility Metrics: ATR, Standard Deviation, or Range-based calculations
Squeeze Detection: Identifies Bollinger/Keltner squeeze conditions for breakout anticipation
Dynamic Color States: Cyan (#00F1FF) for bullish, Magenta (#FF019A) for bearish conditions
📊 HOW IT WORKS
The basis line is calculated using your selected moving average type
Volatility is measured using ATR, StDev, or Range
Trend strength is quantified via linear regression
Band width adapts based on normalized trend strength (when enabled)
Gradient layers create smooth visual transitions from bands to basis
Color state changes based on price position and basis direction
🔧 PARAMETER GROUPS
Basis Configuration:
Basis Type: Moving average calculation method
Basis Length (20): Period for centerline calculation
ALMA Settings: Offset (0.85) and Sigma (6) for ALMA basis
Volatility Settings:
Volatility Method: ATR, Standard Deviation, or Range
Volatility Length (14): Lookback for volatility calculation
Band Multiplier (2.0): Distance of bands from basis
Adaptive Settings:
Enable Adaptive (true): Toggle dynamic band adjustment
Adaptation Period (50): Trend strength measurement window
Squeeze Detection:
BB/KC Parameters: Settings for squeeze identification
Expansion Threshold: Multiplier for expansion signals
📈 TRADING SIGNALS
Long Conditions:
Price crosses above basis
Basis line is rising
Band color shifts to cyan
Short Conditions:
Price crosses below basis
Basis line is falling
Band color shifts to magenta
💡 USAGE STRATEGIES
Trend Following: Trade with the basis direction when bands are expanding
Mean Reversion: Fade moves to outer bands during squeeze conditions
Breakout Trading: Enter on expansion signals after squeeze periods
Support/Resistance: Use bands as dynamic S/R levels
Position Sizing: Wider bands suggest higher volatility - adjust size accordingly
🎨 VISUAL ELEMENTS
Gradient Fills: 10 opacity layers creating smooth band transitions
Dynamic Colors: State-dependent coloring for instant trend recognition
Basis Line: Bold centerline changes color with trend state
Band Lines: Outer boundaries with matching state colors
⚡ BEST PRACTICES
The AVB indicator works optimally on liquid instruments with consistent volume. The adaptive feature performs best in trending markets but can generate false signals during choppy conditions. Consider using alongside momentum indicators for confirmation. The gradient visualization helps identify price position within the volatility envelope at a glance.
🔔 ALERTS INCLUDED
Long/Short Signals
Squeeze Conditions
Expansion Breakouts
Band Touch Events
Version 6 | Pine Script™ | © AlphaNatt

Multi-Timeframe EMA (5 Configurable)Here's a comprehensive description you can use for your indicator:
Multi-Timeframe EMA Indicator (5 Configurable Slots)
Description
This indicator displays up to 5 Exponential Moving Averages (EMAs) from different timeframes simultaneously on a single chart. Perfect for multi-timeframe analysis, it allows traders to visualize key EMAs from intraday to higher timeframes without switching charts.
Key Features
5 Independent EMA Slots: Each slot can be configured with its own timeframe, EMA length, and color
Flexible Configuration: Mix any timeframes and EMA lengths (e.g., 1m EMA 50, 15m EMA 200, 4h EMA 100)
Smart Label Formatting: Automatically displays timeframes in readable format (minutes, hours, or days)
Optional Data Table: Toggle a compact table showing EMA values and price distance percentages
Individual Toggle Controls: Enable/disable each EMA independently without losing settings
Customizable Styling: Adjust colors and line width to match your chart theme
Default Configuration
EMA 1: 1-minute timeframe, EMA 200 (Red)
EMA 2: 5-minute timeframe, EMA 200 (Purple)
EMA 3: 15-minute timeframe, EMA 200 (Yellow)
EMA 4: 1-hour timeframe, EMA 200 (Blue)
EMA 5: 4-hour timeframe, EMA 200 (Orange)
How to Use
Add the indicator to any chart
Configure each EMA slot in the settings:
Timeframe: Choose from 1m, 5m, 15m, 1h, 4h, D, W, M, or custom
Length: Set the EMA period (default 200)
Color: Select a color for easy identification
Enable "Show Line Labels" to see EMA identifiers on the right side
Enable "Show Values Table" for a detailed view of current values and distances
Use Cases
Trend Analysis: Identify alignment across multiple timeframes
Support/Resistance: Use higher timeframe EMAs as dynamic S/R levels
Entry/Exit Timing: Enter on lower timeframe signals near higher timeframe EMAs
Multi-Timeframe Confirmation: Validate setups when price is above/below key EMAs
Scalping: Monitor 1m/5m EMAs while respecting 1h/4h trend direction
Tips
All EMAs update in real-time and move with the chart
Use contrasting colors for easier visual distinction
Disable unused slots to declutter your chart
The table shows percentage distance from current price to each EMA
Works on any symbol and any chart timeframe

Adaptive Jump Moving AverageAdaptive Jump Moving Average - Description
This indicator solves the classic moving average lag problem during significant price moves. Traditional MAs (like the 200-day) take forever to catch up after a major drop or rally because they average across all historical periods equally.
How it works:
Tracks price smoothly during normal market conditions
When price moves 20%+ away from the MA, it immediately "resets" to the current price level
Treats that new level as the baseline and continues smooth tracking from there
Advantages over normal MA:
No lag on major moves: A 40% crash doesn't get diluted over 200 days - the MA instantly adapts
Reduces false signals: You won't get late "death cross" signals months after a crash already happened
Better support/resistance: The MA stays relevant to current price action instead of reflecting outdated levels
Keeps the smoothness: During normal volatility, it behaves like a traditional MA without the noise of shorter periods

20/40/60Displays three consecutive, connected range boxes showing high/low price ranges for customizable periods. Boxes are positioned seamlessly with shared boundaries for continuous price action visualization.
Features
Three Connected Boxes: Red (most recent), Orange (middle), Green (earliest) periods
Customizable Positioning: Set range length and starting offset from current bar
Individual Styling: Custom colors, transparency, and border width for each box
Display Controls: Toggle borders, fills, and line visibility
Use Cases
Range Analysis: Compare volatility across time periods, spot breakouts
Support/Resistance: Use box boundaries as potential S/R levels
Market Structure: Visualize recent price development and trend patterns
Key Settings
Range Length: Bars per box (default: 20)
Starting Offset: Bars back from current to position boxes (default: 0)
Style Options: Colors, borders, and visibility controls for each box
Perfect for traders analyzing consecutive price ranges and comparing current conditions to recent historical periods.

ZigZag Volume Profile [ChartPrime]⯁ OVERVIEW
ZigZag Volume Profile combines swing structure with volume analytics by plotting a ZigZag of major price swings and overlaying a detailed volume profile around each swing. At the end of each swing, it highlights the Point of Control (POC) — the price level with the highest traded volume — and extends it forward to identify key areas of potential support or resistance.
⯁ KEY FEATURES
ZigZag Swing Detection:
Automatically detects swing highs and lows based on a user-defined length, creating clean visual segments of market structure.
These segments act as boundaries for volume profile calculations.
swingHigh = ta.highest(swingLength)
swingLow = ta.lowest(swingLength)
ZigZag Channel Visualization:
The ZigZag structure is connected with sloped lines, forming a visual “channel” of the price movement.
The ZigZag can optionally, scaled by ATR.
Volume Profile Around Each Swing:
For every completed swing (high to low or low to high), the indicator constructs a full volume profile using user-defined bin counts.
It scans volume across price levels in the swing and plots histogram-style bins using a gradient color to indicate volume magnitude.
Dynamic Bin Width and Slope Adjustment:
Bins are distributed across a vertical ATR-based range, and their width is adjusted based on the percentage of total swing volume.
The volume fill direction is adapted to the swing’s slope for visually aligned plotting.
POC Detection and Extension:
The highest volume bin in each swing is identified as the Point of Control (POC).
This level is plotted with a thicker line and extended horizontally into the future as a key reaction level.
Automatic POC Expiry on Price Interaction:
POC lines are continuously extended unless breached by price.
When price crosses the POC level, the extension is terminated — signaling that the level may have been absorbed.
Clean Volume Bin Visualization:
Bin colors range from green (low volume) to blue (higher volume), with the POC always marked in red by default for easy identification.
Volume percentages are optionally labeled at each bin level.
Flexible Swing Profile Parameters:
Users can control:
Number of volume bins
Bin width
Channel width (ATR factor)
Visibility of the swing channel or POC lines
Efficient Memory Handling:
Old POC lines and volume profiles are automatically removed from memory after a threshold to keep charts clean and performant.
⯁ USAGE
Use ZigZag swings to define market structure visually.
Analyze volume profile around each swing to understand where most trading activity occurred.
Use POC extensions as dynamic support/resistance zones for entries, stops, or take-profits.
Watch for price interaction with extended POC lines — breaks may suggest absorbed liquidity or breakout potential.
Use the ATR-based channel width to adapt profiles based on market volatility.
⯁ CONCLUSION
ZigZag Volume Profile offers a powerful fusion of structure and volume. By plotting detailed volume profiles over each price swing and extending the POC as actionable S/R levels, this tool provides deep insight into market participation zones — giving traders a tactical edge in both ranging and trending environments.

Wavelet-Trend ML Integration [Alpha Extract]Alpha-Extract Volatility Quality Indicator
The Alpha-Extract Volatility Quality (AVQ) Indicator provides traders with deep insights into market volatility by measuring the directional strength of price movements. This sophisticated momentum-based tool helps identify overbought and oversold conditions, offering actionable buy and sell signals based on volatility trends and standard deviation bands.
🔶 CALCULATION
The indicator processes volatility quality data through a series of analytical steps:
Bar Range Calculation: Measures true range (TR) to capture price volatility.
Directional Weighting: Applies directional bias (positive for bullish candles, negative for bearish) to the true range.
VQI Computation: Uses an exponential moving average (EMA) of weighted volatility to derive the Volatility Quality Index (VQI).
Smoothing: Applies an additional EMA to smooth the VQI for clearer signals.
Normalization: Optionally normalizes VQI to a -100/+100 scale based on historical highs and lows.
Standard Deviation Bands: Calculates three upper and lower bands using standard deviation multipliers for volatility thresholds.
Signal Generation: Produces overbought/oversold signals when VQI reaches extreme levels (±200 in normalized mode).
Formula:
Bar Range = True Range (TR)
Weighted Volatility = Bar Range × (Close > Open ? 1 : Close < Open ? -1 : 0)
VQI Raw = EMA(Weighted Volatility, VQI Length)
VQI Smoothed = EMA(VQI Raw, Smoothing Length)
VQI Normalized = ((VQI Smoothed - Lowest VQI) / (Highest VQI - Lowest VQI) - 0.5) × 200
Upper Band N = VQI Smoothed + (StdDev(VQI Smoothed, VQI Length) × Multiplier N)
Lower Band N = VQI Smoothed - (StdDev(VQI Smoothed, VQI Length) × Multiplier N)
🔶 DETAILS
Visual Features:
VQI Plot: Displays VQI as a line or histogram (lime for positive, red for negative).
Standard Deviation Bands: Plots three upper and lower bands (teal for upper, grayscale for lower) to indicate volatility thresholds.
Reference Levels: Horizontal lines at 0 (neutral), +100, and -100 (in normalized mode) for context.
Zone Highlighting: Overbought (⋎ above bars) and oversold (⋏ below bars) signals for extreme VQI levels (±200 in normalized mode).
Candle Coloring: Optional candle overlay colored by VQI direction (lime for positive, red for negative).
Interpretation:
VQI ≥ 200 (Normalized): Overbought condition, strong sell signal.
VQI 100–200: High volatility, potential selling opportunity.
VQI 0–100: Neutral bullish momentum.
VQI 0 to -100: Neutral bearish momentum.
VQI -100 to -200: High volatility, strong bearish momentum.
VQI ≤ -200 (Normalized): Oversold condition, strong buy signal.
🔶 EXAMPLES
Overbought Signal Detection: When VQI exceeds 200 (normalized), the indicator flags potential market tops with a red ⋎ symbol.
Example: During strong uptrends, VQI reaching 200 has historically preceded corrections, allowing traders to secure profits.
Oversold Signal Detection: When VQI falls below -200 (normalized), a lime ⋏ symbol highlights potential buying opportunities.
Example: In bearish markets, VQI dropping below -200 has marked reversal points for profitable long entries.
Volatility Trend Tracking: The VQI plot and bands help traders visualize shifts in market momentum.
Example: A rising VQI crossing above zero with widening bands indicates strengthening bullish momentum, guiding traders to hold or enter long positions.
Dynamic Support/Resistance: Standard deviation bands act as dynamic volatility thresholds during price movements.
Example: Price reversals often occur near the third standard deviation bands, providing reliable entry/exit points during volatile periods.
🔶 SETTINGS
Customization Options:
VQI Length: Adjust the EMA period for VQI calculation (default: 14, range: 1–50).
Smoothing Length: Set the EMA period for smoothing (default: 5, range: 1–50).
Standard Deviation Multipliers: Customize multipliers for bands (defaults: 1.0, 2.0, 3.0).
Normalization: Toggle normalization to -100/+100 scale and adjust lookback period (default: 200, min: 50).
Display Style: Switch between line or histogram plot for VQI.
Candle Overlay: Enable/disable VQI-colored candles (lime for positive, red for negative).
The Alpha-Extract Volatility Quality Indicator empowers traders with a robust tool to navigate market volatility. By combining directional price range analysis with smoothed volatility metrics, it identifies overbought and oversold conditions, offering clear buy and sell signals. The customizable standard deviation bands and optional normalization provide precise context for market conditions, enabling traders to make informed decisions across various market cycles.

Volatility Quality [Alpha Extract]The Alpha-Extract Volatility Quality (AVQ) Indicator provides traders with deep insights into market volatility by measuring the directional strength of price movements. This sophisticated momentum-based tool helps identify overbought and oversold conditions, offering actionable buy and sell signals based on volatility trends and standard deviation bands.
🔶 CALCULATION
The indicator processes volatility quality data through a series of analytical steps:
Bar Range Calculation: Measures true range (TR) to capture price volatility.
Directional Weighting: Applies directional bias (positive for bullish candles, negative for bearish) to the true range.
VQI Computation: Uses an exponential moving average (EMA) of weighted volatility to derive the Volatility Quality Index (VQI).
vqiRaw = ta.ema(weightedVol, vqiLen)
Smoothing: Applies an additional EMA to smooth the VQI for clearer signals.
Normalization: Optionally normalizes VQI to a -100/+100 scale based on historical highs and lows.
Standard Deviation Bands: Calculates three upper and lower bands using standard deviation multipliers for volatility thresholds.
vqiStdev = ta.stdev(vqiSmoothed, vqiLen)
upperBand1 = vqiSmoothed + (vqiStdev * stdevMultiplier1)
upperBand2 = vqiSmoothed + (vqiStdev * stdevMultiplier2)
upperBand3 = vqiSmoothed + (vqiStdev * stdevMultiplier3)
lowerBand1 = vqiSmoothed - (vqiStdev * stdevMultiplier1)
lowerBand2 = vqiSmoothed - (vqiStdev * stdevMultiplier2)
lowerBand3 = vqiSmoothed - (vqiStdev * stdevMultiplier3)
Signal Generation: Produces overbought/oversold signals when VQI reaches extreme levels (±200 in normalized mode).
Formula:
Bar Range = True Range (TR)
Weighted Volatility = Bar Range × (Close > Open ? 1 : Close < Open ? -1 : 0)
VQI Raw = EMA(Weighted Volatility, VQI Length)
VQI Smoothed = EMA(VQI Raw, Smoothing Length)
VQI Normalized = ((VQI Smoothed - Lowest VQI) / (Highest VQI - Lowest VQI) - 0.5) × 200
Upper Band N = VQI Smoothed + (StdDev(VQI Smoothed, VQI Length) × Multiplier N)
Lower Band N = VQI Smoothed - (StdDev(VQI Smoothed, VQI Length) × Multiplier N)
🔶 DETAILS
Visual Features:
VQI Plot: Displays VQI as a line or histogram (lime for positive, red for negative).
Standard Deviation Bands: Plots three upper and lower bands (teal for upper, grayscale for lower) to indicate volatility thresholds.
Reference Levels: Horizontal lines at 0 (neutral), +100, and -100 (in normalized mode) for context.
Zone Highlighting: Overbought (⋎ above bars) and oversold (⋏ below bars) signals for extreme VQI levels (±200 in normalized mode).
Candle Coloring: Optional candle overlay colored by VQI direction (lime for positive, red for negative).
Interpretation:
VQI ≥ 200 (Normalized): Overbought condition, strong sell signal.
VQI 100–200: High volatility, potential selling opportunity.
VQI 0–100: Neutral bullish momentum.
VQI 0 to -100: Neutral bearish momentum.
VQI -100 to -200: High volatility, strong bearish momentum.
VQI ≤ -200 (Normalized): Oversold condition, strong buy signal.
🔶 EXAMPLES
Overbought Signal Detection: When VQI exceeds 200 (normalized), the indicator flags potential market tops with a red ⋎ symbol.
Example: During strong uptrends, VQI reaching 200 has historically preceded corrections, allowing traders to secure profits.
Oversold Signal Detection: When VQI falls below -200 (normalized), a lime ⋏ symbol highlights potential buying opportunities.
Example: In bearish markets, VQI dropping below -200 has marked reversal points for profitable long entries.
Volatility Trend Tracking: The VQI plot and bands help traders visualize shifts in market momentum.
Example: A rising VQI crossing above zero with widening bands indicates strengthening bullish momentum, guiding traders to hold or enter long positions.
Dynamic Support/Resistance: Standard deviation bands act as dynamic volatility thresholds during price movements.
Example: Price reversals often occur near the third standard deviation bands, providing reliable entry/exit points during volatile periods.
🔶 SETTINGS
Customization Options:
VQI Length: Adjust the EMA period for VQI calculation (default: 14, range: 1–50).
Smoothing Length: Set the EMA period for smoothing (default: 5, range: 1–50).
Standard Deviation Multipliers: Customize multipliers for bands (defaults: 1.0, 2.0, 3.0).
Normalization: Toggle normalization to -100/+100 scale and adjust lookback period (default: 200, min: 50).
Display Style: Switch between line or histogram plot for VQI.
Candle Overlay: Enable/disable VQI-colored candles (lime for positive, red for negative).
The Alpha-Extract Volatility Quality Indicator empowers traders with a robust tool to navigate market volatility. By combining directional price range analysis with smoothed volatility metrics, it identifies overbought and oversold conditions, offering clear buy and sell signals. The customizable standard deviation bands and optional normalization provide precise context for market conditions, enabling traders to make informed decisions across various market cycles.
