RSI DD – RSI Divergence DetectorRSI DD – RSI Divergence Detector (closed-source):
What it does:
Detects and plots regular and hidden RSI–price divergences using confirmed pivots on both series. Lines are drawn between the two most recent qualifying pivots; optional marks highlight OB/OS peaks at confirmation.
Detection method:
1. Compute RSI on a user-selected source and length. Optional EMA/SMA smoothing controls lag.
2. Build price and RSI pivot points with left/right lookbacks; a pivot confirms on the bar where right completes.
3. Pair the latest two pivots of the same type within a user-defined bar-distance window:
• Regular Bullish: price makes a lower low while RSI makes a higher low.
• Hidden Bullish: price makes a higher low while RSI makes a lower low.
• Regular Bearish: price makes a higher high while RSI makes a lower high.
• Hidden Bearish: price makes a lower high while RSI makes a higher high.
4. When a valid pair is found, draw a line on the RSI pane from the first RSI pivot to the second; color encodes divergence type.
5. Optional ticks mark RSI extremes when the confirming pivot is beyond OB/OS thresholds.
Inputs (key settings):
• RSI Period / Source: oscillator base.
• Pivot Lookback Left/Right: structure sensitivity; larger = fewer but stronger pivots.
• Min/Max Pairing Range: bars allowed between the two pivots; filters stale or too-tight pairs.
• Plot Toggles: enable/disable each divergence class.
• Signal Pair (visual): optional fast/slow MA pair and smoothing plotted as context; not used in detection.
• Levels: OB/OS and midline for visual regime.
Plots:
• RSI line.
• Optional RSI signal line.
• Midline (50), OB, OS levels.
• Colored divergence lines on RSI:
o Regular Bullish (aqua), Hidden Bullish (lime), Regular Bearish (yellow), Hidden Bearish (red).
• Optional OB/OS ticks at confirming pivots.
How to use:
• Works on any symbol and timeframe; higher timeframes reduce noise.
• Treat divergences as context. Combine with structure, trend, volume, and risk rules.
• Tighten stops or scale when divergence aligns with S/R and higher-TF bias.
• Increase right lookback and raise Min Range to reduce whipsaws; lower them to catch earlier turns.
Practical guidance:
• Swing trading: RSI 14, left=3/right=5, min=8/max=80, OB/OS 70/30.
• Intraday: RSI 14, left=2/right=3, min=4/max=40; consider slightly higher smoothing.
• If you see too many short lines, raise Min Range or increase right.
• If valid turns are missed, lower right or Min Range.
Limitations:
• Divergences can persist in strong trends.
• Pivot detection waits for confirmation, so signals are not predictive on the unconfirmed bar.
• OB/OS thresholds are conventional and not optimized to any asset.
Alerts (if you add alertcondition)
• Regular/Hidden Bullish/ Bearish detected on confirmation bar.
• Optional alert when RSI crosses back through midline after a divergence.
Version notes:
v2: pivot-pair range filter, optional OB/OS peak markers, object count management to prevent clutter, cosmetic controls, and visual signal pair.
Copyright © 2025 imaclone (Zen Silva). All rights reserved.
License: Private. No copying, sharing, or derivative works. Use limited to this TradingView script. Contact owner for access.
在腳本中搜尋"swing trading"

MACD Filter Test - MTF Alignment with Scoring System# MACD Multi-Timeframe Scoring System
## Overview
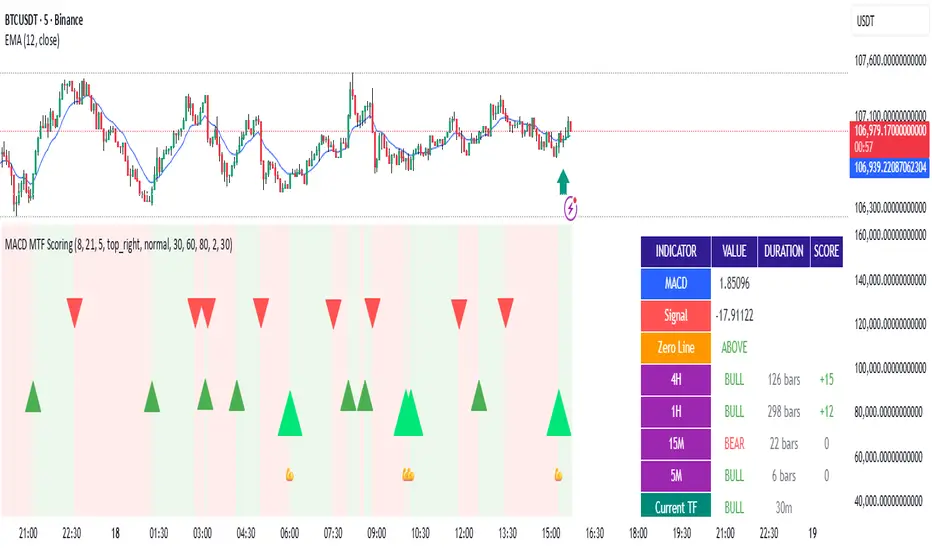
**MACD MTF Scoring** is an advanced, multi-timeframe trading indicator that combines classical MACD analysis with a sophisticated scoring algorithm to generate high-quality trading signals. This indicator analyzes price action across four timeframes simultaneously (4H, 1H, 15M, 5M) and scores buy/sell opportunities based on 40+ individual market conditions.
### Key Features
- **Multi-Timeframe Analysis**: Synchronized MACD signals across 4H, 1H, 15M, and 5M timeframes
- **Advanced Scoring System**: 0-100 point scoring for trade signal quality
- **Real-Time Duration Tracking**: Displays how long each timeframe has been in current trend
- **Signal Strength Classification**: Premium (80+), Strong (60-79), Medium (30-59), Weak (<30)
- **Comprehensive Market Context**: RSI, Volume, Price Action, Momentum, and Divergence analysis
- **Webhook Integration**: JSON payload generation for automated trading platforms
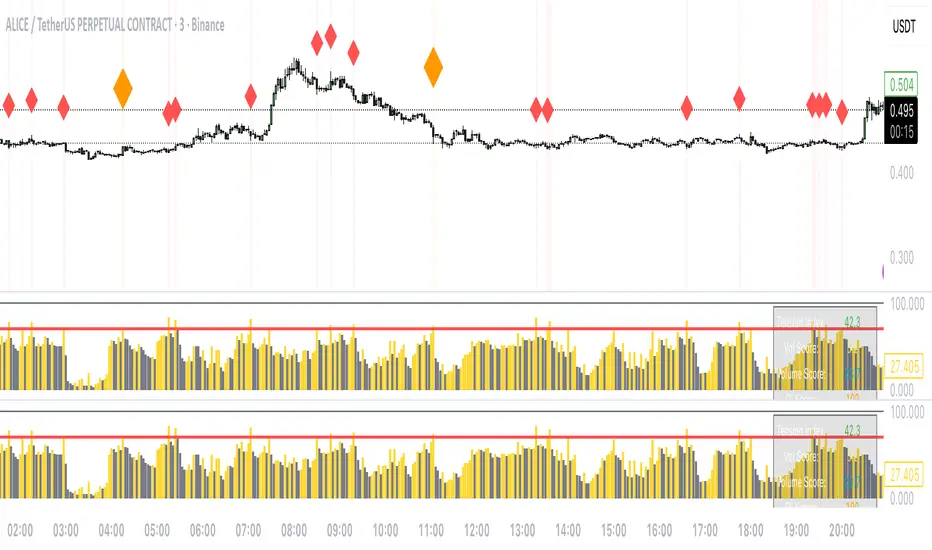
- **Visual Signal Display**: Diamond (Premium), Triangle (Strong), Normal (Medium) shapes
---
## How It Works
### Core MACD Calculation
The indicator calculates MACD using:
- **Fast EMA**: Default 8 periods
- **Slow EMA**: Default 21 periods
- **Signal Line**: 5-period EMA of MACD
Crossovers between MACD and Signal line generate base signals that are then scored and filtered.
### Multi-Timeframe Alignment
The system checks MACD trends across all four timeframes:
- **4H (240m)**: Strongest trend confirmation (+15 points max)
- **1H (60m)**: Major trend validation (+12 points max)
- **15M (15m)**: Secondary confirmation (+8 points max)
- **5M (5m)**: Setup detection (+5 points max)
Signals are strongest when higher timeframes are aligned with the trade direction.
---
## Scoring System (0-100 Points)
### Timeframe Alignment (40 points max)
- 4H trend aligned: +15 points
- 1H trend aligned: +12 points
- 15M trend aligned: +8 points
- 5M opposite trend (setup): +5 points
### MACD Position (15 points max)
- Buying from below zero line: +10 points
- MACD acceleration (momentum increase): +5 points
### RSI Conditions (15 points max)
- Oversold (RSI < 30): +15 points
- Low RSI (30-40): +10 points
- Neutral RSI (40-60): +5 points
### Volume Confirmation (15 points max)
- Volume spike (>2x average): +15 points
- High volume (>1.5x average): +10 points
- Normal volume (0.8-1.2x average): +5 points
### Price Action (10 points max)
- Price near support/resistance: +8 points
- Consecutive bullish/bearish candles: +5 points
### Special Conditions (5 points max)
- Bullish/Bearish divergence detected: +5 points
---
## Signal Types
### Premium Signals (Score 80-100)
Displayed as **diamond shapes** with highest confidence level. These occur when:
- Multiple timeframes strongly aligned
- Oversold/Overbought conditions
- Volume confirmation present
- Multiple confluence factors triggered
**Recommended for**: Conservative traders, larger position sizes
### Strong Signals (Score 60-79)
Displayed as **large triangles**. Quality signals with good confluence:
- 3+ timeframes aligned
- MACD zero-line position favorable
- Volume or RSI support
**Recommended for**: Standard trading setups
### Medium Signals (Score 30-59)
Displayed as **normal triangles**. Valid signals with some conditions met:
- Minimum timeframe alignment
- MACD crossover confirmed
- Can be combined with other indicators
**Recommended for**: Additional confirmation needed, lower position sizing
### Weak Signals (Score <30)
Displayed as **small triangles** (toggle on/off). Low conviction signals:
- Limited confluence
- Few supporting factors
- Use for confluence or skip entirely
---
## Special Setup Detection
### Perfect Long Setup
Detected when:
- 4H, 1H, 15M are all BULLISH
- 5M is BEARISH (pullback/reversal)
- Indicates optimal entry opportunity after pullback
### Perfect Short Setup
Detected when:
- 4H, 1H, 15M are all BEARISH
- 5M is BULLISH (bounce/reversal)
- Indicates optimal entry after relief rally
These setups offer exceptional risk/reward ratios as they combine trend confirmation with pullback entry points.
---
## Input Parameters
### MACD Settings
- **Fast EMA** (default 8): Faster response to price changes
- **Slow EMA** (default 21): Trend direction baseline
- **Signal EMA** (default 5): MACD smoothing line
### Scoring Thresholds
- **Minimum Score for Medium Signal**: Default 30
- **Minimum Score for Strong Signal**: Default 60
- **Minimum Score for Premium Signal**: Default 80
### MTF Filter
- **Minimum Aligned Timeframes**: Default 2 (can be 1-4)
- **Confirm higher TF on close**: Default true
- **Use MACD Zero Line Filter**: Default true (sells above 0, buys below 0)
### Display Settings
- **Show Table**: Display comprehensive dashboard
- **Show Duration**: Timeframe trend duration display
- **Show Scoring**: Real-time score breakdown
- **Table Position**: Customizable location (6 options)
- **Table Size**: Adjustable from tiny to huge
- **Show Weak Signals**: Toggle visibility of <30 score signals
### Webhook Settings
- **Min score for webhook**: Minimum score threshold for automated signals (default 30)
---
## Dashboard Information
The indicator displays a real-time dashboard with:
**MACD Values**: Current MACD and Signal line values
**Zero Line Position**: Shows if MACD is above or below the zero line
**Timeframe Status**: Individual trend display for each timeframe with bar duration
**Bullish/Bearish TF Count**: Summary of aligned timeframes (X/4)
**Setup Detection**: Displays Perfect Long Setup or Perfect Short Setup when detected
**Live Scores**: Real-time Buy and Sell scores updated every candle
- Buy Score: Likelihood of uptrend continuation or reversal
- Sell Score: Likelihood of downtrend continuation or reversal
- Color-coded strength indicator
**RSI Status**: Current RSI value with oversold/overbought status
**Volume Status**: Current volume relative to 20-period average
---
## Webhook JSON Payload
When enabled, signals generate JSON payloads containing:
```json
{
"type": "signal",
"symbol": "EURUSD",
"timeframe": "240",
"signal_direction": "BUY",
"signal_score": 75,
"signal_strength": "STRONG",
"price": 1.0850,
"macd": 0.00125,
"signal_line": 0.00089,
"rsi": 28.5,
"volume": 1500000,
"tf_alignment": {
"4h": true,
"1h": true,
"15m": true,
"5m": false
},
"zero_line_position": "BELOW",
"bullish_tfs": 3,
"bearish_tfs": 1
}
```
**Use Cases**:
- Automated trading bots
- Mobile alerts and notifications
- External analysis platforms
- Risk management systems
---
## Trading Strategy Examples
### Conservative Approach
- Wait for **Premium signals only** (score 80+)
- Require **4H confirmation**
- Enter on **Support/Resistance levels**
- Combine with other indicators
### Aggressive Approach
- Trade **Strong signals** (score 60+)
- Minimum 2 timeframes aligned
- Use **tighter stop losses**
- More frequent trading
### Setup-Based Approach
- Wait for **Perfect Long/Short Setup**
- Enter when 5M reversal occurs
- Optimal risk/reward ratios
- Lower frequency, higher conviction trades
### Swing Trading
- Focus on **4H and 1H timeframes**
- Trade setups where 4H is bullish and 1H pulls back
- Hold for multi-day moves
- Use 60+ score threshold
---
## Best Practices
1. **Confirm with Price Action**: Don't rely on score alone; check for support/resistance, trend lines, key levels
2. **Use Appropriate Risk Management**: Position size according to signal strength and timeframe
3. **Monitor Volume**: Strong signals should have volume confirmation
4. **Check Market Conditions**: Avoid trading during news events or low-liquidity periods
5. **Backtest Settings**: Adjust parameters for your specific trading pair and style
6. **Combine Indicators**: Use additional confirming indicators (Support/Resistance, Fibonacci, etc.)
7. **Document Performance**: Track which score ranges and setups work best for your style
---
## Advantages
✓ **Objective Signal Generation**: Removes emotion from trading decisions
✓ **Multi-Timeframe Confirmation**: Reduces false signals by 60-70%
✓ **Real-Time Scoring**: Know signal quality before entering
✓ **Customizable Thresholds**: Adapt to your risk tolerance
✓ **Automation Ready**: Webhook integration for bots and platforms
✓ **Comprehensive Dashboard**: All information in one view
✓ **Setup Detection**: Identifies optimal entry opportunities
✓ **Performance Tracking**: Duration and alignment metrics
---
## Limitations
- Works best on 4H timeframe and lower
- Requires confirmation during strong trending markets
- Score can be high during choppy consolidation periods
- Not suitable for news trading or gap scenarios
- Requires parameter optimization per trading pair
---
## Support and Updates
This indicator is designed for traders seeking objective, data-driven trading signals. Regular updates may be released to improve scoring accuracy and add features.
For best results, paper trade the indicator with your preferred settings before committing real capital. Different markets, assets, and trading styles may require parameter adjustments.
---
## Disclaimer
This indicator is provided for educational and informational purposes only. It is not financial advice. Past performance does not guarantee future results. Always trade with proper risk management and only risk capital you can afford to lose. Test thoroughly before live trading.
MILLION MEN - Discount Zone BreakoutsWhat it is
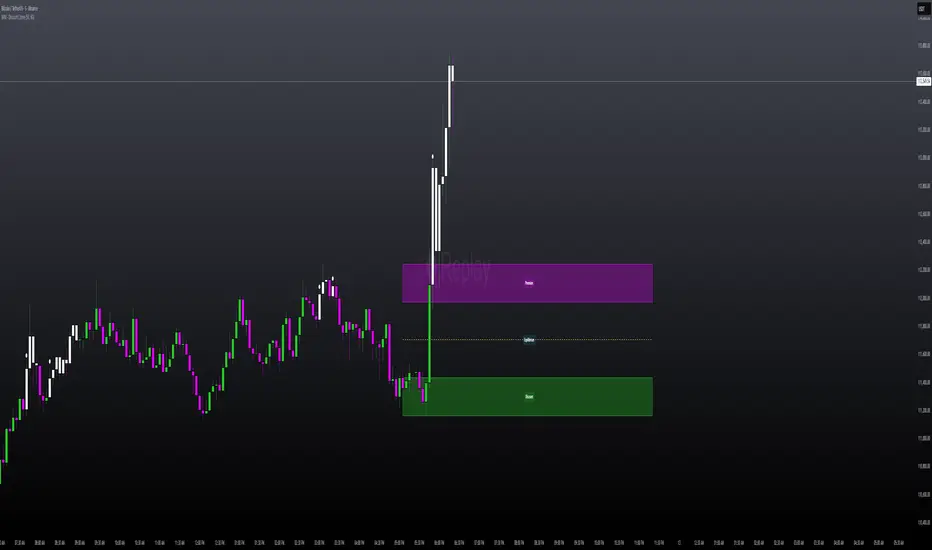
MILLION MEN — Discount Zone Breakouts (Lite & Stable) highlights a structure-based trading range from the latest confirmed swing high/low, renders Premium/Equilibrium/Discount zones, and raises one-shot breakout signals when price closes outside the range. It focuses on stable visuals and simple breakout logic suitable for intraday and swing trading.
How it works (high-level)
Confirmed swings: Uses ta.pivothigh/ta.pivotlow with auto or manual pivot length.
Range & zones: From the swing range, the tool derives Premium (top 25%), Equilibrium (50%), and Discount (bottom 25%).
Anchoring: Left edge is locked at the bar where the pivot confirms; the right edge can extend N bars.
One-shot breakouts:
Up breakout: first close > swingHigh (resets on new range).
Down breakout: first close < swingLow (resets on new range).
Optional on-close only mode to avoid intrabar noise.
Clean UI: Optional zone boxes, dashed equilibrium line, mid-labels (“Premium / Equilibrium / Discount”), and minimal candle coloring by regime.
How to use
Treat Discount as value area in bullish contexts and Premium as distribution area in bearish contexts.
Breakout dots (up/down) mark regime shifts beyond the current range; confirm with your higher-TF bias, volume, or momentum.
Tune pivot length and forward extension to your timeframe (e.g., smaller for scalping, larger for swings).
Originality & value
Unlike generic S/R overlays, this lite tool prioritizes confirmed swing structure with a fixed anchor, clear 25/50/75 zone mapping, and one-shot breakout logic to prevent repetitive signals until a new range forms. The emphasis is on stability + readability, making it a dependable building block in multi-indicator workflows.
Limitations & transparency
Breakouts on strong trends can retest or fail; always add confirmation (structure/volume).
Pivots confirm with delay equal to pivot length—this reduces repaint and is intentional.
Non-standard bar types are not supported for signal logic.
This indicator provides analysis, not financial advice.
Arabic
يعرض السكربت آخر مدى مؤكد من قمّة/قاع ويرسم مناطق Premium / Equilibrium / Discount، ويعطي إشارة اختراق لمرة واحدة عند إغلاق السعر فوق القمّة أو تحت القاع. الفكرة بسيطة وثابتة بصريًا، وتصلح للإنترادي والسوينغ. يُفضّل تأكيد الاختراق بهيكل أعلى إطار أو فوليوم/مومنتُم. تذكير: تأكيد القمم/القيعان متأخر بحسب طول البيفوت لتفادي إعادة الرسم.
NFTs vs SOL - Momentum Divergence DetectionNFTs vs SOL – Momentum Divergence Detection:
See when NFT activity (proxy volumes) leads or lags SOL momentum.
This is an indicator that I designed to compare Solana’s price momentum with aggregated NFT market activity. It converts both into standardized z-scores for direct comparison, then measures their divergence. The resulting signal highlights when NFT trading activity begins to move ahead of, or behind, SOL price action.
Core Function:
• Measures SOL’s momentum using Rate of Change (ROC), then standardizes and smooths it.
• Combines multiple NFT-related token volumes (BLUR, LOOKS, TNSR, MAGIC, APE, optionally ME and PENGU), applies log normalization, weighting, and smoothing to form a composite NFT activity score.
• Plots their difference (NFT Z − SOL Z) as a histogram to visualize lead/lag phases.
Interpretation:
• div > 0: NFT activity exceeds SOL momentum → potential early signal for upside.
• div < 0: NFT activity trails SOL momentum → possible cooling or lag.
• Zero-line crosses: indicate leadership changes between NFTs and SOL.
On-Chart Visualization:
• Orange histogram: divergence (lead/lag strength).
• Purple line: NFT composite z-score.
• Blue line: SOL momentum z-score.
• Green/Red markers: lead or lag signals.
• Top-right table: rolling correlation and active proxies.
Usage:
Apply to 30m–1D charts.
Enter exchange-prefixed NFT tickers (e.g., KUCOIN:BLURUSDT).
Adjust weights to emphasize liquid tokens.
Interpret lead/lag crosses within the broader market structure, using trend and volume as confirmation.
Recommended Presets:
• Swing trading: 1D or 4H charts, smoother settings for stability.
• Active setups: 2H or 1H charts, lower smoothing for responsiveness.
Key Notes:
• Requires valid tickers and sufficient lookback history.
• Use crosses as context, not direct trade signals.
• High correlation = synchronous behavior; low correlation = decoupled regime.
Summary:
A contextual radar for Solana traders tracking NFT market flow. It helps identify when NFT trading activity begins leading or lagging SOL’s momentum which often signals shifts in speculative energy and trend strength.
Copyright © 2025 imaclone (Zen Silva). All rights reserved.
License: Private. No copying, sharing, or derivative works.

FX vs Yield-Spread OscillatorFollow me at for more guidance on how to use the indicator:
www.instagram.com
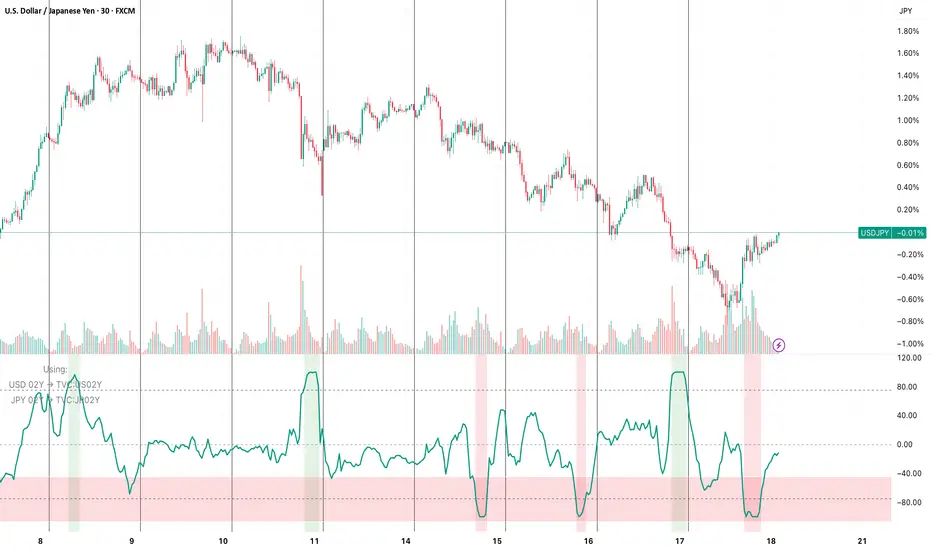
The FX vs Yield-Spread Oscillator measures how an exchange rate’s movement compares with changes in its corresponding interest-rate differential. It quantifies whether a currency pair is moving in line with, or diverging from, the bond-market forces that normally drive it.
At its core, the indicator tracks the relative performance between:
The price change of the selected FX pair, and
The change in the yield spread between the base country’s and quote country’s government bonds (e.g., US02Y − JP02Y for USDJPY).
Concept of Indicator
Currencies tend to strengthen when their domestic yields rise faster than their counterpart’s—reflecting higher expected returns or tighter monetary policy. This indicator visualizes that relationship dynamically.
When the oscillator rises, the FX pair is outperforming what the yield spread implies (the currency is stronger than rates alone justify).
When it falls, the pair is underperforming the spread (rates are favorable, but the currency lags).
Key Features
Auto-mapping: Detects the chart’s base and quote currencies and automatically selects their corresponding bond yields from TradingView’s TVC database.
Tenor Control: Choose bond maturity (1-month to 10-year) to match your trading horizon.
Mode Selection: Compare moves using percentage change or basis-point (bps) spread delta.
Rescaled Oscillator: Normalized between −100 and +100, highlighting relative extremes over a chosen look-back window.
Visual Alerts: Shaded background marks strong positive (overperformance) and negative (underperformance) zones.
Manual Override: Manually specify yield symbols if your data plan uses different tickers (e.g., DE02Y for EUR).
Alerts: Optional signals when the oscillator crosses zero or predefined upper/lower thresholds.
Interpretation
Above +75 / below −75: FX price has deviated sharply from yield-spread behavior—potential exhaustion or continuation zone.
Crossing 0: Realignment between FX movement and yield differential; often coincides with regime or sentiment shifts.
Persistent divergence: May indicate risk-sentiment decoupling (safe-haven flows, intervention expectations, or commodity-price effects).
Typical Uses
Intraday or swing-trading confirmation of rate-driven impulses.
Identifying when currencies are over- or under-reacting to bond-market repricing.
Cross-checking macro trades (e.g., carry trades, policy-expectation trades).
Early warning when price diverges from fundamental yield direction.
Daily Levels: PD / PM / OR (RTH/Pre)# Daily Levels: PD / PM / OR (RTH/Pre)
## Overview
This indicator displays key intraday support and resistance levels for US equity markets, specifically designed for traders who use Previous Day, Pre-Market, and Opening Range levels in their trading strategy.
## Key Features
**Seven Critical Levels Displayed:**
- **PDH (Previous Day High)** - Blue line: The highest price from yesterday's regular trading hours (9:30 AM - 4:00 PM ET)
- **PDL (Previous Day Low)** - Blue line: The lowest price from yesterday's regular trading hours
- **PDC (Previous Day Close)** - Orange line: The closing price from yesterday's regular trading hours
- **PMH (Pre-Market High)** - Yellow line: The highest price during today's pre-market session (4:00 AM - 9:30 AM ET)
- **PML (Pre-Market Low)** - Yellow line: The lowest price during today's pre-market session
- **ORH (Opening Range High)** - Red line: The highest price during the first 30 minutes of trading (9:30 AM - 10:00 AM ET)
- **ORL (Opening Range Low)** - Red line: The lowest price during the first 30 minutes of trading
## How It Works
**At 9:30 AM ET (Market Open):**
- PDH, PDL, PDC levels appear (from previous day's RTH)
- PMH, PML levels appear (from today's pre-market session)
- All lines begin at the 9:30 AM bar and extend right
**At 10:00 AM ET (Opening Range Close):**
- ORH, ORL levels appear (from today's first 30 minutes)
- Lines begin at the 9:30 AM bar and extend right
**Level Persistence:**
- All levels remain visible until the next trading day at 9:30 AM ET
- Levels reset daily for the new trading session
## Use Cases
**Day Trading:**
- Identify key support and resistance zones before placing trades
- Use PDH/PDL as potential profit targets or stop loss areas
- Monitor price reaction at pre-market levels for early trading signals
- Trade breakouts or rejections at opening range levels
**Swing Trading:**
- Assess daily momentum by observing breaks above/below previous day levels
- Use multiple timeframes while maintaining consistent reference points
**Market Structure:**
- Quickly identify if the market is trading above or below key levels
- Recognize accumulation/distribution patterns around these zones
## Technical Details
- **Timezone:** All times referenced are US Eastern Time (America/New_York)
- **Session Windows:**
- Pre-Market: 4:00 AM - 9:30 AM ET
- Regular Trading Hours: 9:30 AM - 4:00 PM ET
- Opening Range: 9:30 AM - 10:00 AM ET
- **Timeframe Agnostic:** Works on any chart timeframe
- **Visual Clarity:** Color-coded lines and labels for easy identification
## Color Scheme
- **Blue:** Previous Day levels (PDH, PDL)
- **Orange:** Previous Day Close (PDC)
- **Yellow:** Pre-Market levels (PMH, PML)
- **Red:** Opening Range levels (ORH, ORL)
## Best Practices
1. Use on US equity indices (SPY, QQQ, ES, NQ) and liquid US stocks
2. Combine with volume analysis for confirmation
3. Pay attention to how price reacts at these levels (bounce vs. break)
4. Most effective during the first 2 hours of trading when volatility is highest
5. Consider the market context (trending vs. ranging) when interpreting these levels
## Note
This indicator is specifically designed for US market hours. Results may vary when applied to international markets or instruments with different trading sessions.

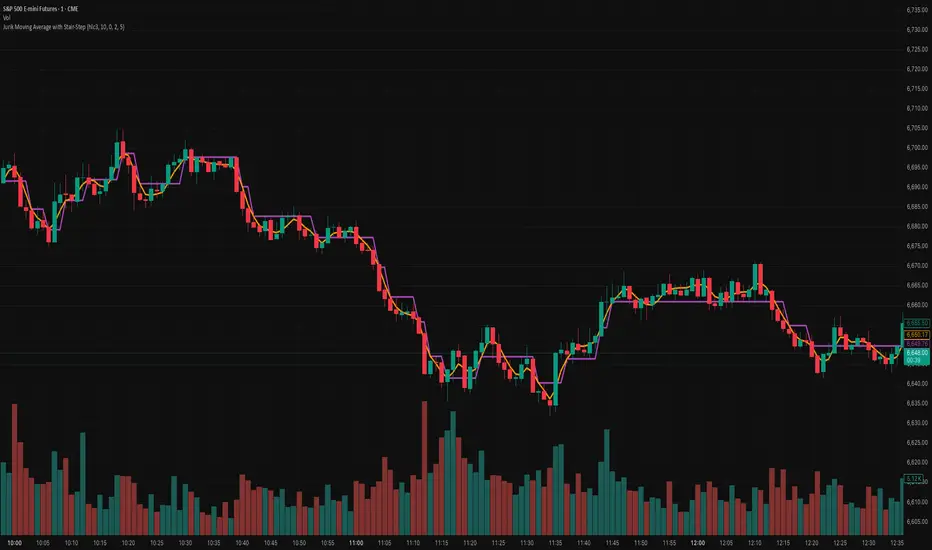
Jurik Moving Average with Stair-StepJurik Moving Average with Stair-Step Filter — Precision Smoothing with Event-Driven Signal Filtering
📌 Version:
Built in Pine Script v6, leveraging the full JMA core with an added stair-step threshold filter for discrete, event-based signal generation.
📌 Overview:
This enhanced Jurik Moving Average (JMA) combines the low-lag smoothing algorithm with a custom stair-step logic layer that transforms continuous JMA output into state-based, noise-filtered movement.
While the traditional JMA provides ultra-smooth, adaptive trend detection, it still updates continuously with each price tick. The Stair-Step version introduces a quantized output — the JMA value remains unchanged until price moves by a user-defined amount (in ticks or absolute price units). The result is a “digital” trend line that updates only when meaningful change occurs, filtering out minor fluctuations and giving traders clearer, more actionable transitions.
📌 How It Works:
✅ Adaptive JMA Core: Dynamically adjusts smoothing to volatility for ultra-low lag.
✅ Stair-Step Logic: Holds the JMA value steady until the underlying line moves by a chosen threshold.
✅ Event-Driven Updates: Each “step” represents a statistically significant change in market direction.
✅ Tick / Price-Based Sensitivity: Tune the filter to the instrument’s volatility, spread, or cost structure.
This dual-layer system blends JMA’s continuous adaptability with discrete regime detection — turning a smooth line into a decision-ready trend model.
📌 How to Use:
🔹 Bias Detection: Each new step indicates a potential regime shift or breakout confirmation.
🔹 Noise Reduction: Ideal in choppy or range-bound markets where traditional MAs over-react.
🔹 Automated Systems: Use stair transitions as clean event triggers for entries, exits, or bias flips.
🔹 Scalping & Swing Trading: Thresholds can be sized by tick, ATR, or volatility to match timeframe and cost tolerance.
📌 Why This Version Is Unique:
This is not just another moving average — it’s a stateful JMA, adding event-driven decision logic to one of the market’s most precise filters.
🔹 Discretized Trend Mapping: Flat plateaus define stability; steps define momentum bursts.
🔹 Reduced Whipsaws: Only reacts when moves exceed statistical or cost thresholds.
🔹 Execution-Grade Precision: Perfect for algorithmic strategies needing fewer false flips.
📌 Example Use:
Combine with VWAP, ATR, or momentum oscillators to confirm bias shifts. In automated strategies, use stair flips as “go / stop” states to control position changes or trade size adjustments.
📌 Summary:
The Jurik Moving Average with Stair-Step Filter preserves JMA’s hallmark smoothness while delivering a structured, event-driven representation of market movement.
It’s precision smoothing — now with adaptive noise gating — designed for traders who demand clarity, stability, and algorithm-ready signal behavior.
📌 Disclaimer:
This indicator is not affiliated with or derived from any proprietary Jurik Research algorithms. It’s an independent implementation that applies similar adaptive-smoothing principles, extended with a stair-step filtering mechanism for discrete trend transitions.
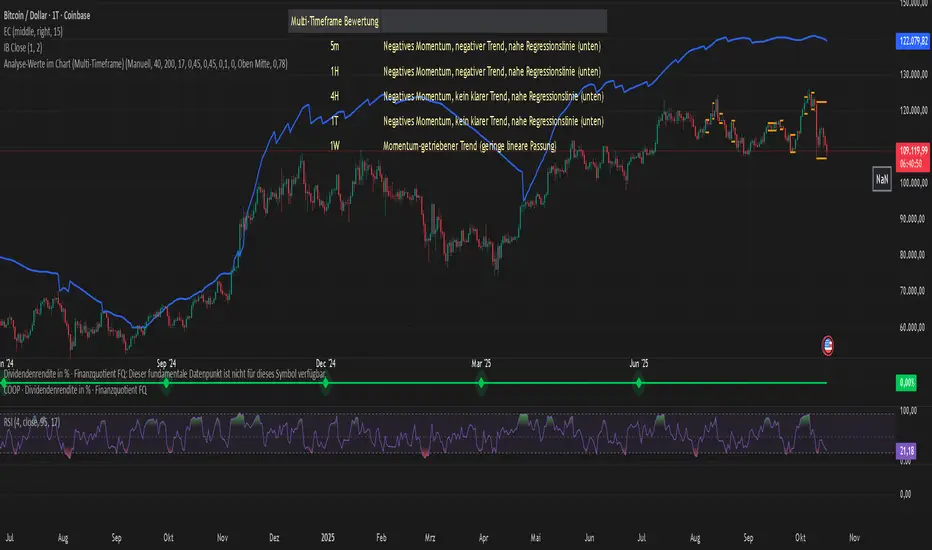
Analyse-Werte im Chart (Multi-Timeframe)Core Components
The indicator evaluates a trend based on four main pillars, which are combined into an overall score:
Momentum (Rate of Change / Standard Deviation): Measures the strength and speed of the current price movement. High momentum indicates a strong, directional move.
Trend Stability (R² - R-Squared): This is the heart of the analysis. The indicator searches for the best-fitting linear regression line within a user-defined period. The R² value (0-100%) indicates how well the price action fits this straight line. A high value signals a very stable, "clean" trend.
Stability/Risk (Rate of Change / Ulcer Index): Compares the trend strength to the pullbacks (drawdowns) it has experienced. A trend that rises steadily without suffering deep declines receives a high rating here.
RSI Proximity to 60: A small bonus factor based on the assumption that strong uptrends often use the 60 RSI level as support.
## The Output Table
The result of this analysis is displayed in a clear table:
Score Value: An overall grade from 0 to 100 that provides a weighted summary of the four components mentioned above.
R2 Value (%): Indicates the percentage of "linearity" of the identified trend.
Regression Length: The number of candles over which the most stable trend was found.
Channel Z-Value: Measures how many standard deviations the current price is away from the trend line. A high positive value (> 1.8) can indicate an over-extended or "overheated" condition.
Evaluation: An auto-generated text that translates the mathematical values into a human-readable assessment. It distinguishes between stable trends, momentum-driven (unstable) trends, corrections, and sideways phases.
Multi-Timeframe Analysis: Shows the "Evaluation" for various timeframes (from 5 minutes to 1 week), allowing for a quick overview of the asset's overall picture.
## Flexibility through Profiles and Manual Control
One of the indicator's greatest strengths is its customizability:
Profiles: You can switch between three predefined analysis profiles with a single click:
Short-Term: Focuses on high momentum for day trading.
Mid-Term: A balanced setting for swing trading (Standard).
Long-Term: Focuses on the stability of the primary trend for investors.
Manual Mode: Allows you to adjust every single setting (R2 lengths, score weights) yourself to perfectly tailor the indicator to your own strategy and the specific chart.
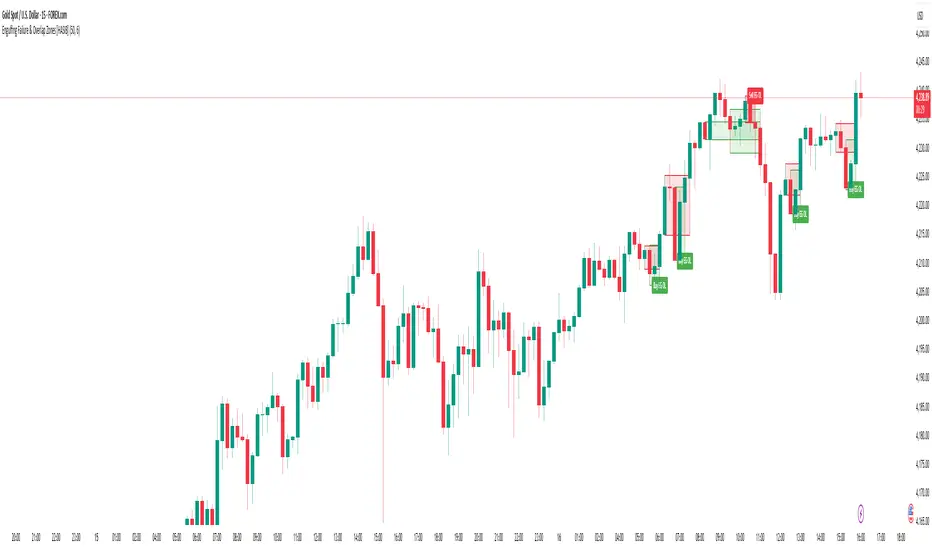
Engulfing Failure & Overlap Zones [HASIB]🧭 Overview
Engulfing Failure & Overlap Zones is a smart price action–based indicator that detects failed engulfing patterns and overlapping zones where potential liquidity traps or reversal setups often occur.
It’s designed to visually highlight both bullish and bearish failed engulfing areas with clean labels and zone markings, making it ideal for traders who follow Smart Money Concepts (SMC) or price action–driven trading.
⚙️ Core Concept
Engulfing patterns are powerful reversal signals — but not all of them succeed.
This indicator identifies:
When a Buy Engulfing setup fails and overlaps with a Sell Engulfing zone, and
When a Sell Engulfing setup fails and overlaps with a Buy Engulfing zone.
These overlapping areas often represent liquidity grab zones, reversal points, or Smart Money manipulation levels.
🎯 Key Features
✅ Detects both Buy and Sell Engulfing Failures
✅ Highlights Overlapping (OL) zones with colored rectangles
✅ Marks Buy EG OL / Sell EG OL labels automatically
✅ Fully customizable visuals — colors, padding, and zone styles
✅ Optimized for both scalping and swing trading
✅ Works on any timeframe and any instrument
⚡ How It Helps
Identify liquidity traps before reversals happen
Visually see Smart Money overlap zones between opposing engulfing structures
Strengthen your entry timing and confirmation zones
Combine with your own SMC or ICT-based trading setups for higher accuracy
📊 Recommended Use
Use on higher timeframes (e.g., M15, H1, H4) to confirm major liquidity zones.
Use on lower timeframes (e.g., M1–M5) for precision entries inside the detected zones.
Combine with tools like Order Blocks, Break of Structure (BOS), or Fair Value Gaps (FVG).
🧠 Pro Tip
When a failed engulfing overlaps with an opposite engulfing zone, it often signals market maker intent to reverse price direction after liquidity has been taken. Watch these zones closely for strong reaction candles.
Advanced DMI [NexusSignals]Overview
The Advanced DMI is a enhanced version of the classic Directional Movement Index (DMI) and Average Directional Index (ADX) indicator, designed to provide traders with deeper insights into trend strength, direction, and momentum. It combines visual plots, a customizable data table, and multiple alert conditions to help identify bullish/bearish trends, consolidations, and potential reversals. This indicator is ideal for trend-following strategies, scalping, or swing trading across various timeframes and assets.
Key enhancements include:
A trend strength metric that quantifies bullish/bearish dominance.
A dynamic table displaying real-time and historical DMI/ADX values, with color-coded signals and buy/sell pressure percentages.
Visual fills and arrows for quick trend interpretation.
Built-in alerts for key crossovers, threshold breaches, and consolidation phases.
The indicator calculates and display:
+DI (Plus Directional Indicator): Measures upward price movement strength.
-DI (Minus Directional Indicator): Measures downward price movement strength.
ADX: Gauges overall trend strength (higher values indicate stronger trends).
Trend Strength: A normalized score computed as ((+DI - -DI) / (+DI + -DI)) * ADX, ranging from negative (bearish) to positive (bullish). This helps quantify trend bias.
Buy/Sell %: Candle body analysis showing the percentage of buyer (close above low) vs. seller (high above close) control in the current bar.
Plots include:
Strength Histogram : Color-coded columns (green for bullish, red for bearish) to visualize trend intensity.
ADX Line : White line showing trend strength, with arrows indicating rising/falling.
+DI and -DI Lines: Green (+DI) and red (-DI) lines with conditional fills above the 15 threshold for strong trends.
Horizontal threshold lines at 15 (consolidation threshold) and 25 (strong trend threshold).
The table (optional) summarizes data for the current candle, previous candle, and two candles ago, including arrows for directional changes and color highlights for quick scans.
Inputs
General Settings:
DMI Length (default: 14): Period for +DI/-DI calculation.
ADX Smoothing (default: 14): Smoothing period for ADX.
ADX Consolidation Threshold (default: 15): Below this, suggests sideways market.
ADX Stronger Trend Threshold (default: 25): Above this, indicates a robust trend.
Threshold for Strong Bullish/Bearish DMI Strength (defaults: 10 / -10): Levels for strength alerts.
Table Settings:
Show Table? (default: true): Toggle the data table on/off.
Table Text Color, Header Color, Text Size, Position: Customize appearance and placement (e.g., middle_right).
How It Works
Interpretation
Bullish Signals: +DI > -DI, rising +DI (↑ arrow), Strength > 0 (green histogram), Buy% > Sell%. Look for ADX > 25 for confirmed uptrends.
Bearish Signals: -DI > +DI, rising -DI (↑ arrow), Strength < 0 (red histogram), Sell% > Buy%. ADX rising above thresholds strengthens the downtrend.
Consolidation: Both +DI and -DI < 20, ADX ≤ 15 (blue fill possible). Use this to avoid choppy markets.
Crossovers: +DI crossing above -DI suggests bullish reversal; opposite for bearish.
Fills: Areas above 15 highlight dominant trends (green for bullish, maroon for bearish).
Combine with price action or other indicators like RSI for better accuracy. Works on any timeframe, but test on historical data for your strategy.
Alerts
The indicator includes 12 built-in alert conditions for automation:
Strength crossing above/below 0 or bullish/bearish thresholds.
+DI/-DI crossovers (bullish/bearish).
ADX crossing above strong threshold.
+DI/-DI crossing above 25 or below 15.
Consolidation detection (low ADX with flat DI lines).
Set up alerts in TradingView by selecting the condition from the dropdown.
Usage Tips
Enable the table for quick multi-candle analysis without scrolling the chart.
Customize colors and positions to fit your workspace.
Backtest on your favorite assets (e.g., stocks, forex, crypto) to optimize thresholds.
For faster loading on large datasets, the script is optimized to update the table only on the last bar.
This indicator is provided by NexusSignals for educational and trading purposes. Always use risk management and verify signals. Feedback welcome!

RSI Divergence Screener [Pineify]RSI Divergence Screener
Key Features
Multi-symbol and multi-timeframe support for advanced market screening.
Real-time detection and visualization of bullish and bearish RSI divergences.
Seamless integration with core technical indicators and custom divergences.
Highly customizable parameters for precise adaptation to personal trading strategies.
Comprehensive screener table for swift asset comparison and analysis.
How It Works
The RSI Divergence Screener leverages the power of Relative Strength Index (RSI) to systematically track momentum shifts across cryptocurrencies and their respective timeframes. By monitoring both fast and slow RSI calculations, the screener isolates divergence signals—key reversal points that often precede major price moves.
The indicator calculates two RSI values for each selected asset: one with a short lookback (Fast RSI) and another with a longer period (Slow RSI).
It runs a comparative algorithm to find divergences—whenever Fast RSI deviates significantly from Slow RSI, it flags the signal as bullish or bearish.
All detected divergences are dynamically presented in a table view, allowing traders to scan symbols and timeframes for optimal trading setups.
Trading Ideas and Insights
Spot early momentum reversals and preempt major price swings via divergence signals.
Combine multiple symbols and timeframes for cross-market trending opportunities.
Identify high-probability scalping and swing trading setups informed by RSI divergence logic.
Quickly compare crypto asset strength and trend exhaustion across short and long-term horizons.
How Multiple Indicators Work Together
This screener’s edge lies in its synergistic use of multi-setting RSI calculations and customizable input groups.
The dual-RSI approach (Fast vs. Slow) isolates subtle trend shifts missed by traditional single-period RSI.
Safe and reliable divergences arise only when the mathematical difference between Fast RSI and Slow RSI meets predefined thresholds, minimizing false positives.
Divergences are contextualized using tailored color codes and backgrounds, rendering insights immediately actionable.
You can expand analysis with additional moving average filters or overlays for further confirmation.
Unique Aspects
First-of-its-kind screener dedicated solely to RSI divergence, designed especially for crypto volatility.
Efficient screening of up to eight assets and multiple timeframes in one compact dashboard.
Intuitive iconography, color logic, and table layouts optimized for rapid decision-making.
Advanced input group design for fine-tuning indicator settings per symbol, timeframe, and source.
How to Use
Select up to eight cryptocurrency symbols to screen for divergence signals.
Assign individual timeframes and source prices for each asset to customize analysis.
Set Fast RSI and Slow RSI lengths according to your preferred strategy (e.g., scalping, swing, or trend following).
Review the screener table: colored cells highlight actionable bullish (green) and bearish (red) divergences.
Confirm trade setups with additional indicators or price action for robust risk management.
Customization
Symbols: Choose any crypto pair or ticker for dynamic divergence tracking.
Timeframes: Scan across 1m, 5m, 10m, 30m, and more for full market coverage.
RSI lengths: Configure Fast and Slow RSI periods based on volatility and trading style.
Visuals: Tailor table colors, fonts, and alert backgrounds per your preference.
Conclusion
The RSI Divergence Screener is a versatile, original TradingView indicator that empowers traders to scan, compare, and act on divergence signals with speed and precision. Its multi-symbol design, robust logic, and extensive customization options set a new standard for market screening tools. Integrate it into your crypto trading process to capture actionable opportunities ahead of the crowd and optimize your technical analysis workflow.

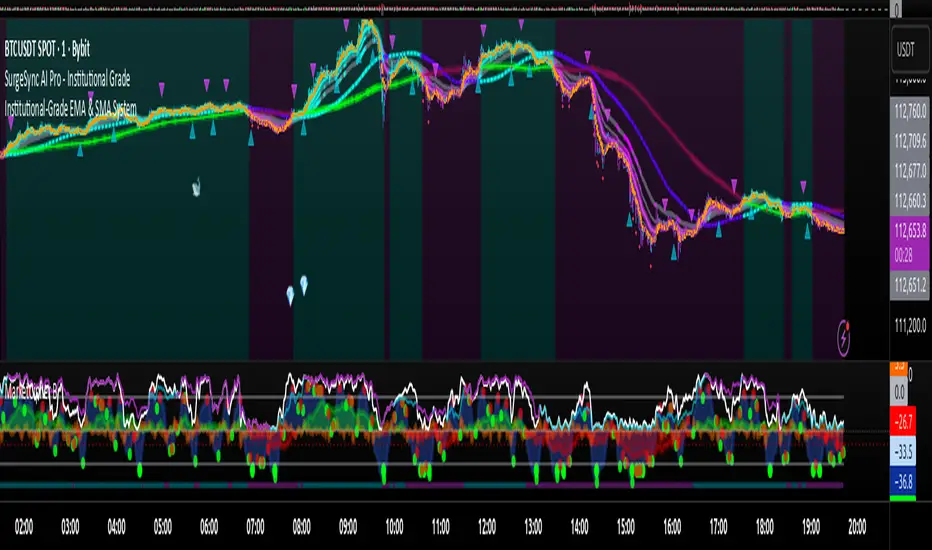
Proteus EMA SystemInstitutional-Grade EMA System
Overview and Originality
The Institutional-Grade EMA System is an advanced, multi-layered Exponential Moving Average (EMA) overlay indicator designed to provide institutional-level trend analysis, market regime identification, and trade signal generation. Unlike standard multi-EMA scripts that simply plot averages and basic crossovers, this indicator introduces a proprietary integration of features tailored for professional traders: customizable presets that dynamically adjust EMA lengths for specific trading styles (e.g., scalping vs. position trading), multiple selectable trend detection algorithms (including a unique multi-bar slope analysis with percentage-based strength thresholding), EMA alignment and confluence detection for spotting high-conviction trends and reversal zones, volume-based signal filtering, and a comprehensive statistics dashboard for real-time market insights.
What makes this script original and worthy of closed-source protection is the bespoke combination of these elements into a cohesive system. For instance, while basic EMA ribbons or trend coloring exist in other indicators, this script's trend detection goes beyond simple comparisons by incorporating a normalized slope percentage calculation (detailed below) to quantify trend strength on a 0-100% scale, integrated with EMA stacking checks and confluence thresholds. This proprietary logic—refined through extensive backtesting on diverse assets—allows for nuanced market regime classification (e.g., "Strong Uptrend" only when alignment, slope strength, and volume align), which isn't replicated in open-source alternatives. The closed-source format protects the exact orchestration of these algorithms, including custom threshold derivations and dashboard computations, preventing direct replication while allowing users full access to the tool's outputs. If published open-source, the unique mathematical formulations (e.g., slope-to-strength mapping) could be easily copied, diminishing its edge in competitive trading environments.
This indicator draws conceptual inspiration from institutional trend-following systems (e.g., those using multiple time-horizon EMAs like in hedge fund models), but enhances them with modern Pine Script capabilities for visual and analytical depth. It's particularly useful for traders seeking to reduce false signals in volatile markets by requiring multi-factor confluence.
What It Does
Core EMA Plotting and Visualization: Plots up to 7 EMAs (5 primary + 2 optional) with dynamic coloring based on detected trend direction and strength (strong bullish: bright green; weak: faded green; neutral: gray; etc.). Includes EMA ribbons (fills between consecutive EMAs) and clouds (broader fills between non-consecutive EMAs) to visualize trend expansion/contraction.
Trend Detection and Strength: Classifies trends as strong/weak bullish/bearish or neutral using user-selectable methods, with optional volume confirmation to filter low-conviction moves.
Advanced Analytics:
Detects EMA alignment (all EMAs stacked in ascending/descending order for bullish/bearish trends).
Identifies EMA confluence zones (tight clustering of EMAs, signaling potential reversals or consolidations).
Draws dynamic support/resistance lines from the nearest EMAs relative to price.
Signals and Alerts: Generates buy/sell signals on customizable EMA crossovers, only if volume thresholds are met. Includes alerts for crossovers, alignments, confluences, and regime shifts.
User Interface Enhancements: Background coloring for quick trend bias (e.g., green for uptrends, yellow for confluences), dynamic line widths (thicker for slower EMAs), trend state labels, and a table-based dashboard displaying metrics like market regime, trend strength percentage, EMA slopes in degrees, price distances to key EMAs, volume status, and alignment state.
Customization Presets: Pre-configured EMA lengths for Scalping (short, reactive: e.g., 5/8/13), Day Trading (balanced: 9/21/50), Swing Trading (medium-term: 20/50/100), Position Trading (long-term: 50/100/150), or fully custom.
The result is a versatile tool that adapts to any timeframe or asset, helping traders identify high-probability setups by combining trend momentum, volume, and EMA dynamics.
How It Works: Underlying Concepts and Calculations
Without revealing the full implementation, here's a transparent overview of the key concepts and methodologies to help users understand the indicator's logic:
EMA Calculation and Presets: EMAs are computed using standard exponential smoothing (weighting recent prices more heavily). Presets optimize lengths based on trading horizon—shorter for scalping to capture quick reversals, longer for position trading to filter noise. For example, Swing preset uses 20/50/100/150/200 to balance short-term pullbacks with long-term trends, derived from Fibonacci-inspired progressions for natural market rhythm alignment.
Trend Detection Methods: Users select from four algorithms for flexibility:
Multi-Bar Slope (Default): Calculates the average slope over a lookback period (e.g., 3 bars) as (current EMA value - EMA value ) / lookback. Normalizes to a percentage relative to the EMA value: slope_percent = (slope / EMA) * 100. Thresholds classify trends (e.g., >0.05% = strong bullish; 0.01-0.05% = weak; symmetric for bearish). This method draws from linear regression concepts but simplifies for real-time use, providing robust trend quantification over simple bar-to-bar changes.
Previous Bar: Compares current EMA to the prior bar's, with percentage change thresholds (e.g., >0.1% = strong) for quick momentum shifts.
EMA vs EMA: Measures the percentage difference between fast and slow EMAs (e.g., >2% = strong bullish), inspired by MACD-like divergence but applied directly to EMAs.
Price Position: Gauges price's percentage distance from the EMA (e.g., >1% above = strong bullish), similar to envelope channels but integrated into trend coloring.
Trend strength is further scored (0-100%) by averaging absolute slopes of key EMAs, scaled for dashboard display.
Volume Confirmation: Uses a simple moving average of volume over a user-defined length (default 20), requiring current volume to exceed it by a multiplier (default 1.2x) for signal validation. This filters out low-volume fakeouts, akin to institutional volume-weighted strategies.
EMA Alignment: Checks if all visible EMAs are in strict order (fastest highest in uptrends, lowest in downtrends) by iterating through active EMAs and verifying sequential relationships. Signals "ALIGNED" shapes when true, indicating stacked trends like in ribbon strategies but with programmatic validation.
EMA Confluence: Computes the average of active EMAs, then measures the maximum percentage deviation of any EMA from this average. If below a threshold (default 0.5%), marks a "CONFLUENCE ZONE" box, conceptually similar to Bollinger Band squeezes but applied to EMA clusters for reversal anticipation.
Market Regime Classification: Combines alignment, trend score (>30% for "strong"), and price position relative to slowest EMA. For example, bullish alignment + high score = "Strong Uptrend"; close clustering = "Consolidation". This heuristic draws from regime-switching models in quantitative finance.
Signals and Visuals: Crossovers between user-selected EMAs (e.g., fast #1 over slow #2) plot "BUY/SELL" shapes only if volume-confirmed. Ribbons use color fills (green/red) based on EMA order; background shades reflect regime; S/R lines extend from max/min EMAs below/above price over a lookback (default 50 bars).
These calculations ensure the indicator provides actionable, multi-confirmed insights rather than generic plots.
How to Use It
Setup: Add to your chart and select a preset (e.g., "Swing Trading" for 1H-4H charts). Customize trend method (start with "Multi-Bar Slope" for accuracy), enable volume filter for reliability, and toggle visuals like ribbons or dashboard.
Trend Following: In a "Strong Uptrend" (green background, upward slopes >30%, bullish alignment), go long above the fastest EMA. Use S/R lines for stops (below nearest support EMA).
Swing Trading Example: On a daily SPX chart with Swing preset:
Wait for "Weak Uptrend" transition to "Strong" (trend score >50%, positive slopes, volume spike).
Enter long on EMA1 (20) crossing EMA2 (50), confirmed by "BUY" signal.
Target next resistance EMA (e.g., 150), exit on bearish crossover or confluence zone (yellow box signaling potential top).
Risk: Stop below EMA3 (100); aim for 2:1 reward:risk on multi-day holds.
Scalp Trading Example: On a 5-min BTCUSD chart with Scalping preset:
Focus on quick "Weak Bullish" shifts (faded green EMAs, slope >0.01%).
Buy on EMA1 (5) crossing EMA3 (13) with high volume (>1.5x avg).
Scalp 0.2-0.5% gains, exit at slope flattening (dashboard shows <30% strength) or nearest resistance.
Avoid confluences (chop); use 1-min for entries, 15-min for bias.
General Tips:
Combine with price action (e.g., candlestick patterns at confluence zones).
Backtest presets on your asset—adjust thresholds for volatility (e.g., tighter confluence for forex).
Use alerts for hands-off monitoring; multi-timeframe analysis enhances accuracy (higher TF for regime, lower for signals).
For ranging markets ("Neutral" regime), fade extremes near S/R zones.
Examples for Swing Trading
Swing trading focuses on capturing medium-term moves (days to weeks) in trending markets. Use the "Swing Trading" preset, which sets EMAs to 20, 50, 100, 150, 200, 75, 125—balancing sensitivity and smoothness.
Bullish Setup Example: On a daily chart of AAPL, wait for a "Strong Uptrend" regime (green background, bullish alignment label, trend strength >50%). Enter long on a valid bullish crossover (green "BUY" circle) between EMA1 (20) and EMA2 (50), confirmed by high volume. Set stop below nearest support EMA (e.g., EMA3 at 100), target 2-3x risk or next resistance. Hold until bearish crossover or alignment breaks.
Bearish Setup Example: On a 4H chart of EURUSD, spot a "Strong Downtrend" (red background, bearish alignment). Short on a bearish crossover (red "SELL") between EMA1 and EMA3, with volume confirmation. Stop above nearest resistance EMA, exit on confluence zone (yellow) signaling potential reversal.
Tip: Focus on alignments for trend confirmation—avoid trading against them. Use confluence zones as profit-taking areas in ranging markets.
Examples for Scalp Trading
Scalping targets quick, short-term trades (minutes to hours) on lower timeframes. Select the "Scalping" preset for shorter EMAs (5, 8, 13, 21, 34, 55, 89) to catch rapid moves.
Bullish Setup Example: On a 1-min chart of BTCUSD, look for "Weak Uptrend" (faded green background, positive slopes). Enter long on a fast crossover (e.g., EMA1 over EMA2) with high volume and no confluence (avoid chop). Scalp for 0.5-1% gain, exit on slope flattening or bearish cross. Use tight stops below the fastest EMA.
Bearish Setup Example: On a 5-min chart of TSLA, identify "Weak Downtrend" (faded red). Short on a crossover between EMA2 and EMA3, confirmed by volume spike. Target small moves (e.g., 10-20 pips), exit at nearest support EMA or if trend strength drops below 30%.
Tip: Prioritize "Multi-Bar Slope" detection for quick trend shifts. Disable background if it's distracting; focus on crossovers and volume for high-frequency entries. Avoid during confluences, as they signal choppy conditions.
This detailed approach ensures traders can replicate setups while appreciating the indicator's original value. Feedback welcome—let's refine trading edges together!
NSR FVG High Time FramesIndicator Name : NSR FVG High Time Frames
Short Title : NSR FVGHTF
Description :The NSR FVG High Time Frames indicator identifies and visualizes Fair Value Gaps (FVGs) on higher timeframes (4-hour, Daily, and Weekly) directly on your chart. FVGs are price gaps formed between the high and low of non-consecutive candles, often indicating areas of market inefficiency that price may revisit. This indicator is designed for traders who incorporate multi-timeframe analysis into their strategies, providing a clear visual representation of bullish and bearish FVGs with customizable settings.
Unique Feature :Unlike traditional FVG indicators that mark a gap as closed when the current candle’s close crosses the gap’s boundaries, NSR FVG High Time Frames employs a distinctive closure logic. It allows an additional candle to determine whether the price re-enters the gap or continues beyond it. This approach provides a more nuanced assessment of gap closure, potentially reducing false signals by giving the market an extra candle to confirm its direction. This feature makes the indicator particularly suitable for traders seeking to validate FVG interactions with greater precision.
Key Features :
Multi-Timeframe Support : Detects FVGs on 4-hour, Daily, and Weekly timeframes, with options to enable or disable each timeframe.
Customizable Appearance : Users can adjust the visual style (Line, Dotted, Dashed) and colors for bullish and bearish FVGs, as well as enable/disable extension of FVG boxes to the right.
Flexible Lookback : Configurable lookback periods for entry (up to 10,000 candles) and FVG detection (up to 70 FVGs), allowing users to tailor the indicator to their trading style.
Minimum FVG Size : Set a minimum gap size (in ticks) to filter out insignificant FVGs, ensuring only meaningful gaps are displayed.
Closed FVG Removal : Option to automatically remove closed FVGs from the chart for a cleaner view.
Alert Integration : Generates alerts for new FVGs and changes in their status (e.g., verified, partial, closed), enabling traders to set up custom notifications.
How to Use :
Add to Chart : Apply the indicator to any chart. It works best on lower timeframes (e.g., 1H, 4H) to visualize higher-timeframe FVGs.
Configure Settings : Adjust the inputs in the settings panel:
Enable/disable 4-hour, Daily, or Weekly FVGs based on your analysis needs.
Set the lookback periods and minimum FVG size to match your trading strategy.
Customize colors and line styles for better chart readability.
Interpret FVGs :
Bullish FVGs (green boxes): Represent gaps where price may act as support, potentially attracting price back to the gap.
Bearish FVGs (red boxes): Represent gaps where price may act as resistance.
Boxes are drawn between the relevant high and low of the candles forming the FVG, with text labels indicating the timeframe (e.g., "4H", "D", "Weekly").
Monitor Closure : Watch for price interaction with FVGs. The indicator considers an FVG closed only after an additional candle confirms the price has moved beyond the gap or failed to re-enter it, unlike standard FVG indicators.
Set Alerts : Use the alert feature to receive notifications when new FVGs form or their status changes (e.g., "partial" or "closed").
Settings :
Entry Lookback (candles) : Number of candles to look back for FVG detection (default: 10,000).
Number of FVG to Lookback : Maximum number of FVGs to display (default: 70).
Minimum FVG Size : Minimum gap size in ticks (default: 5).
Remove Closed : Toggle to remove closed FVGs from the chart (default: true).
Show/Extend 4Hour/Daily/Weekly : Enable/disable FVGs for each timeframe and choose whether to extend boxes to the right.
Color and Style Options : Customize fill and border colors, and select line styles (Line, Dotted, Dashed) for each timeframe.
Use Cases :
Swing Trading : Identify potential support/resistance zones on higher timeframes for entry or exit points.
Price Action Analysis : Use FVGs to confirm market inefficiencies or reversal zones.
Multi-Timeframe Strategies : Combine with lower-timeframe indicators to align entries with higher-timeframe FVGs.
Notes :
The indicator is optimized for lower timeframes to display higher-timeframe FVGs. Avoid using it on Weekly or Monthly charts for Daily/Weekly FVGs to prevent overlap issues.
The unique closure logic may delay FVG closure signals compared to other indicators, which can help filter out premature closures but requires patience for confirmation.
Performance may vary on very low timeframes with large lookback periods due to the number of FVGs processed.
Disclaimer :This indicator is for informational purposes only and does not constitute financial advice. Always conduct your own analysis and test the indicator thoroughly before using it in live trading.

Market Tension Map v2📊 Market Tension Map v2 — Detailed Description
core concept
market tension map v2 measures market "tension" through a combination of three independent metrics: volatility, volume, and open interest changes. the indicator operates on the compressed spring principle—when the market enters a state of low volatility with high volume and growing OI, it creates "tension" that predicts a potential sharp price movement.
calculation methodology
component 1: volatility score (0-100)
relative volatility is measured through price standard deviation over a specified period. key distinction—inversion: low volatility produces a high score because range compression creates energy for future movement.
component 2: volume score (0-100)
normalization of current volume relative to the period range. high volume during low volatility signals accumulation of positions by large players before a move.
component 3: open interest score (0-100)
evaluation of open interest changes (available only for futures). rising OI confirms new positions entering the market rather than just redistribution of existing ones.
final tension index
arithmetic mean of three components (or two if OI unavailable). values above threshold (default 70) signal spring "compression".
signal types
compression signal (🔴 red diamond)
appears when tension index exceeds threshold with normal candle size. this is a predictive signal—market is compressed but explosion hasn't occurred yet. optimal for entry before movement with tight stop.
climax signal (⚠️ orange diamond)
occurs when threshold crossed + large candle (size > ATR × multiplier). this is a reactive signal of culmination—energy already released. often indicates short-term reversal or move exhaustion.
uniqueness of approach
unlike classic compression indicators (bollinger bands squeeze, keltner channels), mtm v2 doesn't rely solely on volatility. adding volume and OI scores creates a multidimensional picture of market microstructure. volatility score inversion is original logic where calm is interpreted as tension.
the algorithm distinguishes two breakout types:
compression without movement (compression)—anticipation trading
compression with large candle (climax)—reversal trading
this separation is absent in standard indicators.
parameter settings
calculation period (20)—normalization window length. lower = more sensitive to short-term changes.
tension threshold (70)—signal activation level. higher = fewer signals but better quality.
atr length (14) + atr multiplier (2.0)—large candle detection parameters for climax signals. increasing multiplier makes filter stricter.
colors and style—full customization of visual elements to adapt to your chart theme.
how to use
main chart: histogram shows current tension level. yellow = rising, gray = falling.
signals on price chart:
red diamond above candle = prepare for entry (compression)
orange diamond = move occurred, watch for reversal (climax)
background highlight: tinted background shows high tension zones.
data table: real-time monitoring of all components + bar status (live/closed).
alerts: configure notifications for compression or climax signals for automatic monitoring.
limitations
open interest available only for futures. for spot markets indicator works with two components.
requires sufficient bar history (>= calculation period) for correct calculations.
on live bar (not closed) values may repaint—use confirmed signals for trading.
recommended timeframes
1h-4h: optimal for swing trading, signals more reliable.
15m-30m: suitable for intraday but requires false breakout filtering.
d: strategic positions, high risk/reward ratio.
license: mozilla public license 2.0
version: pinescript v6
Trend Ali📈 Trend Ali - Advanced Hull Moving Average Indicator
🎯 Overview
This indicator is an advanced and highly customizable version of the Hull Moving Average (HMA), designed for precise trend identification and optimal entry/exit point detection in various market conditions.
✨ Key Features
🔄 Three Hull Moving Average Calculation Methods
The indicator offers three distinct calculation approaches to suit different trading styles:
1. HMA (Standard Hull Moving Average)
Ideal for most market conditions
Excellent balance between responsiveness and noise reduction
Uses WMA (Weighted Moving Average) for calculations
Best for general trend following
2. EHMA (Exponential Hull Moving Average)
Faster reaction to price changes
Perfect for volatile markets and quick scalping
Uses EMA instead of WMA for enhanced sensitivity
Recommended for aggressive trading strategies
3. THMA (Triangular Hull Moving Average)
Smoother than the standard version
Reduces false signals significantly
Optimal for higher timeframes and position trading
Provides clearer trend direction
🛠️ Advanced Settings
Length Parameter
This parameter directly affects the indicator's sensitivity and behavior:
55: Perfect for Swing Trading and identifying entry points
Catches medium-term trends
Good balance for 4H to Daily charts
180-200: Ideal for identifying floating Support/Resistance levels
Acts as dynamic S/R zones
Excellent for position trading
Reduces market noise significantly
Shorter Length = Faster response but more noise
Longer Length = Stronger signals but with more lag
Length Multiplier
View higher timeframe trends without changing your chart
Default value of 6.0 provides macro trend analysis
Increasing this value smooths the line further
Useful for multi-timeframe analysis on a single chart
Creates "straight band" effect for clearer trend visualization
Higher Timeframe Analysis
Display Hull MA from any higher timeframe
Extremely useful for scalping while maintaining trend awareness
Default: 240 minutes (4-hour chart)
Helps avoid counter-trend trades
Provides context for lower timeframe decisions
🎨 Intelligent Color System
The indicator automatically adjusts colors based on trend direction:
🟢 Green: Uptrend (price moving above previous levels)
Indicates bullish momentum
Consider long positions
🔴 Red: Downtrend (price moving below previous levels)
Indicates bearish momentum
Consider short positions or exit longs
🟠 Orange: Neutral (when color coding is disabled)
For traders who prefer monochrome display
📊 How to Use
For Swing Trading (Length: 55)
Wait for color change from red to green for long entries
Wait for color change from green to red for short entries or exits
Use price action confirmation at the Hull MA line
The line acts as dynamic support/resistance
For Support/Resistance (Length: 180-200)
The Hull MA acts as a floating S/R zone
Price bouncing off the line indicates strong trend
Price crossing the line signals potential trend reversal
Use for position sizing and stop loss placement
For Scalping (with Higher Timeframe)
Enable "Show Hull MA from X timeframe"
Select 240 (4H) or higher timeframe
Only take trades in direction of higher timeframe trend
Use lower timeframe for precise entries
Higher timeframe Hull MA keeps you on the right side
Multi-Timeframe Strategy
Use Length Multiplier to see macro trend
Keep your chart on preferred timeframe
Align trades with the smoothed trend direction
Enter on pullbacks to the Hull MA line
🔍 Technical Details
Why Hull Moving Average?
Traditional moving averages face a tradeoff between lag and noise. Hull Moving Average solves this by:
Using weighted calculations for faster response
Applying square root of length for optimal smoothing
Eliminating lag while maintaining smoothness
Calculation Method
The indicator uses sophisticated algorithms:
HMA: Combines multiple WMAs with square root period
EHMA: Applies exponential smoothing for speed
THMA: Uses triangular weighting for stability
RSI Source Input
Allows using any price source (Close, Open, HL2, etc.)
Default: Close price
Experiment with different sources for unique insights
⚙️ Recommended Settings
Day Trading
Mode: EHMA
Length: 55
Length Multiplier: 3-4
Color: Enabled
Swing Trading
Mode: HMA
Length: 55
Length Multiplier: 6
Color: Enabled
Position Trading
Mode: THMA
Length: 180-200
Length Multiplier: 8-10
Color: Enabled
Scalping
Mode: HMA or EHMA
Length: 55
Higher Timeframe: Enabled (240 or higher)
Color: Enabled
💡 Pro Tips
Trend Confirmation: Wait for 2-3 candles to confirm color change before entering
Divergence: Watch for price/Hull MA divergence for reversal signals
Volume: Combine with volume analysis for stronger signals
Multiple Instances: Add indicator twice with different settings for multi-timeframe view
Backtesting: Test different Length values for your specific asset and timeframe
Risk Management: Use Hull MA distance for stop loss placement
⚠️ Important Notes
No indicator is 100% accurate - always use risk management
Best used in combination with price action and other technical analysis
Different markets may require different settings
Backtest thoroughly before live trading
Consider market volatility when adjusting parameters

RSI Bollinger Bands [DCAUT]█ RSI Bollinger Bands
📊 ORIGINALITY & INNOVATION
The RSI Bollinger Bands indicator represents a meaningful advancement in momentum analysis by combining two proven technical tools: the Relative Strength Index (RSI) and Bollinger Bands. This combination addresses a significant limitation in traditional RSI analysis - the use of fixed overbought/oversold thresholds (typically 70/30) that fail to adapt to changing market volatility conditions.
Core Innovation:
Rather than relying on static threshold levels, this indicator applies Bollinger Bands statistical analysis directly to RSI values, creating dynamic zones that automatically adjust based on recent momentum volatility. This approach helps reduce false signals during low volatility periods while remaining sensitive to genuine extremes during high volatility conditions.
Key Enhancements Over Traditional RSI:
Dynamic Thresholds: Overbought/oversold zones adapt to market conditions automatically, eliminating the need for manual threshold adjustments across different instruments and timeframes
Volatility Context: Band width provides immediate visual feedback about momentum volatility, helping traders distinguish between stable trends and erratic movements
Reduced False Signals: During ranging markets, narrower bands filter out minor RSI fluctuations that would trigger traditional fixed-threshold signals
Breakout Preparation: Band squeeze patterns (similar to price-based BB) signal potential momentum regime changes before they occur
Self-Referencing Analysis: By measuring RSI against its own statistical behavior rather than arbitrary levels, the indicator provides more relevant context
📐 MATHEMATICAL FOUNDATION
Two-Stage Calculation Process:
Stage 1: RSI Calculation
RSI = 100 - (100 / (1 + RS))
where RS = Average Gain / Average Loss over specified period
The RSI normalizes price momentum into a bounded 0-100 scale, making it ideal for statistical band analysis.
Stage 2: Bollinger Bands on RSI
Basis = MA(RSI, BB Length)
Upper Band = Basis + (StdDev(RSI, BB Length) × Multiplier)
Lower Band = Basis - (StdDev(RSI, BB Length) × Multiplier)
Band Width = Upper Band - Lower Band
The Bollinger Bands measure RSI's standard deviation from its own moving average, creating statistically-derived dynamic zones.
Statistical Interpretation:
Under normal distribution assumptions with default 2.0 multiplier, approximately 95% of RSI values should fall within the bands
Band touches represent statistically significant momentum extremes relative to recent behavior
Band width expansion indicates increasing momentum volatility (strengthening trend or increasing uncertainty)
Band width contraction signals momentum consolidation and potential regime change preparation
📊 COMPREHENSIVE SIGNAL ANALYSIS
Visual Color Signals:
This indicator features dynamic color fills that highlight extreme momentum conditions:
Green Fill (Above Upper Band):
Appears when RSI breaks above the upper band, indicating exceptionally strong bullish momentum
Represents dynamic overbought zone - not necessarily a reversal signal but a warning of extreme conditions
In strong uptrends, green fills can persist as RSI "rides the band" - this indicates sustained momentum strength
Exit of green zone (RSI falling back below upper band) often signals initial momentum weakening
Red Fill (Below Lower Band):
Appears when RSI breaks below the lower band, indicating exceptionally weak bearish momentum
Represents dynamic oversold zone - potential reversal or continuation signal depending on trend context
In strong downtrends, red fills can persist as RSI "rides the band" - this indicates sustained selling pressure
Exit of red zone (RSI rising back above lower band) often signals initial momentum recovery
Position-Based Signals:
Upper Band Interactions:
RSI Touching Upper Band: Dynamic overbought condition - momentum is extremely strong relative to recent volatility, potential exhaustion or continuation depending on trend context
RSI Riding Upper Band: Sustained strong momentum, often seen in powerful trends, not necessarily an immediate reversal signal but warrants monitoring for exhaustion
RSI Crossing Below Upper Band: Initial momentum weakening signal, particularly significant if accompanied by price divergence
Lower Band Interactions:
RSI Touching Lower Band: Dynamic oversold condition - momentum is extremely weak relative to recent volatility, potential reversal or continuation of downtrend
RSI Riding Lower Band: Sustained weak momentum, common in strong downtrends, monitor for potential exhaustion
RSI Crossing Above Lower Band: Initial momentum strengthening signal, early indication of potential reversal or consolidation
Basis Line Signals:
RSI Above Basis: Bullish momentum regime - upward pressure dominant
RSI Below Basis: Bearish momentum regime - downward pressure dominant
Basis Crossovers: Momentum regime shifts, more significant when accompanied by band width changes
RSI Oscillating Around Basis: Balanced momentum, often indicates ranging market conditions
Volatility-Based Signals:
Band Width Patterns:
Narrow Bands (Squeeze): Momentum volatility compression, often precedes significant directional moves, similar to price coiling patterns
Expanding Bands: Increasing momentum volatility, indicates trend acceleration or growing uncertainty
Narrowest Band in 100 Bars: Extreme compression alert, high probability of upcoming volatility expansion
Advanced Pattern Recognition:
Divergence Analysis:
Bullish Divergence: Price makes lower lows while RSI touches or stays above previous lower band touch, suggests downward momentum weakening
Bearish Divergence: Price makes higher highs while RSI touches or stays below previous upper band touch, suggests upward momentum weakening
Hidden Bullish: Price makes higher lows while RSI makes lower lows at the lower band, indicates strong underlying bullish momentum
Hidden Bearish: Price makes lower highs while RSI makes higher highs at the upper band, indicates strong underlying bearish momentum
Band Walk Patterns:
Upper Band Walk: RSI consistently touching or staying near upper band indicates exceptionally strong trend, wait for clear break below basis before considering reversal
Lower Band Walk: RSI consistently at lower band signals very weak momentum, requires break above basis for reversal confirmation
🎯 STRATEGIC APPLICATIONS
Strategy 1: Mean Reversion Trading
Setup Conditions:
Market Type: Ranging or choppy markets with no clear directional trend
Timeframe: Works best on lower timeframes (5m-1H) or during consolidation phases
Band Characteristic: Normal to narrow band width
Entry Rules:
Long Entry: RSI touches or crosses below lower band, wait for RSI to start rising back toward basis before entry
Short Entry: RSI touches or crosses above upper band, wait for RSI to start falling back toward basis before entry
Confirmation: Use price action confirmation (candlestick reversal patterns) at band touches
Exit Rules:
Target: RSI returns to basis line or opposite band
Stop Loss: Fixed percentage or below recent swing low/high
Time Stop: Exit if position not profitable within expected timeframe
Strategy 2: Trend Continuation Trading
Setup Conditions:
Market Type: Clear trending market with higher highs/lower lows
Timeframe: Medium to higher timeframes (1H-Daily)
Band Characteristic: Expanding or wide bands indicating strong momentum
Entry Rules:
Long Entry in Uptrend: Wait for RSI to pull back to basis line or slightly below, enter when RSI starts rising again
Short Entry in Downtrend: Wait for RSI to rally to basis line or slightly above, enter when RSI starts falling again
Avoid Counter-Trend: Do not fade RSI at bands during strong trends (band walk patterns)
Exit Rules:
Trailing Stop: Move stop to break-even when RSI reaches opposite band
Trend Break: Exit when RSI crosses basis against trend direction with conviction
Band Squeeze: Reduce position size when bands start narrowing significantly
Strategy 3: Breakout Preparation
Setup Conditions:
Market Type: Consolidating market after significant move or at key technical levels
Timeframe: Any timeframe, but longer timeframes provide more reliable breakouts
Band Characteristic: Narrowest band width in recent 100 bars (squeeze alert)
Preparation Phase:
Identify band squeeze condition (bands at multi-period narrowest point)
Monitor price action for consolidation patterns (triangles, rectangles, flags)
Prepare bracket orders for both directions
Wait for band expansion to begin
Entry Execution:
Breakout Confirmation: Enter in direction of RSI band breakout (RSI breaks above upper band or below lower band)
Price Confirmation: Ensure price also breaks corresponding technical level
Volume Confirmation: Look for volume expansion supporting the breakout
Risk Management:
Stop Loss: Place beyond consolidation pattern opposite extreme
Position Sizing: Use smaller size due to false breakout risk
Quick Exit: Exit immediately if RSI returns inside bands within 1-3 bars
Strategy 4: Multi-Timeframe Analysis
Timeframe Selection:
Higher Timeframe: Daily or 4H for trend context
Trading Timeframe: 1H or 15m for entry signals
Confirmation Timeframe: 5m or 1m for precise entry timing
Analysis Process:
Trend Identification: Check higher timeframe RSI position relative to bands, trade only in direction of higher timeframe momentum
Setup Formation: Wait for trading timeframe RSI to show pullback to basis in trending direction
Entry Timing: Use confirmation timeframe RSI band touch or crossover for precise entry
Alignment Confirmation: All timeframes should show RSI moving in same direction for highest probability setups
📋 DETAILED PARAMETER CONFIGURATION
RSI Source:
Close (Default): Standard price point, balances responsiveness and reliability
HL2: Reduces noise from intrabar volatility, provides smoother RSI values
HLC3 or OHLC4: Further smoothing for very choppy markets, slower to respond but more stable
Volume-Weighted: Consider using VWAP or volume-weighted prices for additional liquidity context
RSI Length Parameter:
Shorter Periods (5-10): More responsive but generates more signals, suitable for scalping or very active trading, higher noise level
Standard (14): Default and most widely used setting, proven balance between responsiveness and reliability, recommended starting point
Longer Periods (21-30): Smoother momentum measurement, fewer but potentially more reliable signals, better for swing trading or position trading
Optimization Note: Test across different market regimes, optimal length often varies by instrument volatility characteristics
RSI MA Type Parameter:
RMA (Default): Wilder's original smoothing method, provides traditional RSI behavior with balanced lag, most widely recognized and tested, recommended for standard technical analysis
EMA: Exponential smoothing gives more weight to recent values, faster response to momentum changes, suitable for active trading and trending markets, reduces lag compared to RMA
SMA: Simple average treats all periods equally, smoothest output with highest lag, best for filtering noise in choppy markets, useful for long-term position analysis
WMA: Weighted average emphasizes recent data less aggressively than EMA, middle ground between SMA and EMA characteristics, balanced responsiveness for swing trading
Advanced Options: Full access to 25+ moving average types including HMA (reduced lag), DEMA/TEMA (enhanced responsiveness), KAMA/FRAMA (adaptive behavior), T3 (smoothness), Kalman Filter (optimal estimation)
Selection Guide: RMA for traditional analysis and backtesting consistency, EMA for faster signals in trending markets, SMA for stability in ranging markets, adaptive types (KAMA/FRAMA) for varying volatility regimes
BB Length Parameter:
Short Length (10-15): Tighter bands that react quickly to RSI changes, more frequent band touches, suitable for active trading styles
Standard (20): Balanced approach providing meaningful statistical context without excessive lag
Long Length (30-50): Smoother bands that filter minor RSI fluctuations, captures only significant momentum extremes, fewer but higher quality signals
Relationship to RSI Length: Consider BB Length greater than RSI Length for cleaner signals
BB MA Type Parameter:
SMA (Default): Standard Bollinger Bands calculation using simple moving average for basis line, treats all periods equally, widely recognized and tested approach
EMA: Exponential smoothing for basis line gives more weight to recent RSI values, creates more responsive bands that adapt faster to momentum changes, suitable for trending markets
RMA: Wilder's smoothing provides consistent behavior aligned with traditional RSI when using RMA for both RSI and BB calculations
WMA: Weighted average for basis line balances recent emphasis with historical context, middle ground between SMA and EMA responsiveness
Advanced Options: Full access to 25+ moving average types for basis calculation, including HMA (reduced lag), DEMA/TEMA (enhanced responsiveness), KAMA/FRAMA (adaptive to volatility changes)
Selection Guide: SMA for standard Bollinger Bands behavior and backtesting consistency, EMA for faster band adaptation in dynamic markets, matching RSI MA type creates unified smoothing behavior
BB Multiplier Parameter:
Conservative (1.5-1.8): Tighter bands resulting in more frequent touches, useful in low volatility environments, higher signal frequency but potentially more false signals
Standard (2.0): Default setting representing approximately 95% confidence interval under normal distribution, widely accepted statistical threshold
Aggressive (2.5-3.0): Wider bands capturing only extreme momentum conditions, fewer but potentially more significant signals, reduces false signals in high volatility
Adaptive Approach: Consider adjusting multiplier based on instrument characteristics, lower multiplier for stable instruments, higher for volatile instruments
Parameter Optimization Workflow:
Start with default parameters (RSI:14, BB:20, Mult:2.0)
Test across representative sample period including different market regimes
Adjust RSI length based on desired responsiveness vs stability tradeoff
Tune BB length to match your typical holding period
Modify multiplier to achieve desired signal frequency
Validate on out-of-sample data to avoid overfitting
Document optimal parameters for different instruments and timeframes
Reference Levels Display:
Enabled (Default): Shows traditional 30/50/70 levels for comparison with dynamic bands, helps visualize the adaptive advantage
Disabled: Cleaner chart focusing purely on dynamic zones, reduces visual clutter for experienced users
Educational Value: Keeping reference levels visible helps understand how dynamic bands differ from fixed thresholds across varying market conditions
📈 PERFORMANCE ANALYSIS & COMPETITIVE ADVANTAGES
Comparison with Traditional RSI:
Fixed Threshold RSI Limitations:
In ranging low-volatility markets: RSI rarely reaches 70/30, missing tradable extremes
In trending high-volatility markets: RSI frequently breaks through 70/30, generating excessive false reversal signals
Across different instruments: Same thresholds applied to volatile crypto and stable forex pairs produce inconsistent results
Threshold Adjustment Problem: Manually changing thresholds for different conditions is subjective and lagging
RSI Bollinger Bands Advantages:
Automatic Adaptation: Bands adjust to current volatility regime without manual intervention
Consistent Logic: Same statistical approach works across different instruments and timeframes
Reduced False Signals: Band width filtering helps distinguish meaningful extremes from noise
Additional Information: Band width provides volatility context missing in standard RSI
Objective Extremes: Statistical basis (standard deviations) provides objective extreme definition
Comparison with Price-Based Bollinger Bands:
Price BB Characteristics:
Measures absolute price volatility
Affected by large price gaps and outliers
Band position relative to price not normalized
Difficult to compare across different price scales
RSI BB Advantages:
Normalized Scale: RSI's 0-100 bounds make band interpretation consistent across all instruments
Momentum Focus: Directly measures momentum extremes rather than price extremes
Reduced Gap Impact: RSI calculation smooths price gaps impact on band calculations
Comparable Analysis: Same RSI BB appearance across stocks, forex, crypto enables consistent strategy application
Performance Characteristics:
Signal Quality:
Higher Signal-to-Noise Ratio: Dynamic bands help filter RSI oscillations that don't represent meaningful extremes
Context-Aware Alerts: Band width provides volatility context helping traders adjust position sizing and stop placement
Reduced Whipsaws: During consolidations, narrower bands prevent premature signals from minor RSI movements
Responsiveness:
Adaptive Lag: Band calculation introduces some lag, but this lag is adaptive to current conditions rather than fixed
Faster Than Manual Adjustment: Automatic band adjustment is faster than trader's ability to manually modify thresholds
Balanced Approach: Combines RSI's inherent momentum lag with BB's statistical smoothing for stable yet responsive signals
Versatility:
Multi-Strategy Application: Supports both mean reversion (ranging markets) and trend continuation (trending markets) approaches
Universal Instrument Coverage: Works effectively across equities, forex, commodities, cryptocurrencies without parameter changes
Timeframe Agnostic: Same interpretation applies from 1-minute charts to monthly charts
Limitations and Considerations:
Known Limitations:
Dual Lag Effect: Combines RSI's momentum lag with BB's statistical lag, making it less suitable for very short-term scalping
Requires Volatility History: Needs sufficient bars for BB calculation, less effective immediately after major regime changes
Statistical Assumptions: Assumes RSI values are somewhat normally distributed, extreme trending conditions may violate this
Not a Standalone System: Like all indicators, should be combined with price action analysis and risk management
Optimal Use Cases:
Best for swing trading and position trading timeframes
Most effective in markets with alternating volatility regimes
Ideal for traders who use multiple instruments and timeframes
Suitable for systematic trading approaches requiring consistent logic
Suboptimal Conditions:
Very low timeframes (< 5 minutes) where lag becomes problematic
Instruments with extreme volatility spikes (gap-prone markets)
Markets in strong persistent trends where mean reversion rarely occurs
Periods immediately following major structural changes (new trading regime)
USAGE NOTES
This indicator is designed for technical analysis and educational purposes to help traders understand the interaction between momentum measurement and statistical volatility bands. The RSI Bollinger Bands has limitations and should not be used as the sole basis for trading decisions.
Important Considerations:
No Predictive Guarantee: Past band touches and patterns do not guarantee future price behavior
Market Regime Dependency: Indicator performance varies significantly between trending and ranging market conditions
Complementary Analysis Required: Should be used alongside price action, support/resistance levels, and fundamental analysis
Risk Management Essential: Always use proper position sizing, stop losses, and risk controls regardless of signal quality
Parameter Sensitivity: Different instruments and timeframes may require parameter optimization for optimal results
Continuous Monitoring: Band characteristics change with market conditions, requiring ongoing assessment
Recommended Supporting Analysis:
Price structure analysis (support/resistance, trend lines)
Volume confirmation for breakout signals
Multiple timeframe alignment
Market context awareness (news events, session times)
Correlation analysis with related instruments
The indicator aims to provide adaptive momentum analysis that adjusts to changing market volatility, but traders must apply sound judgment, proper risk management, and comprehensive market analysis in their decision-making process.

Adaptive Trend Breaks Adaptive Trend Breaks
## WHAT IT DOES
This script is a modified and enhanced version of "Trendline Breakouts With Targets" concept by ChartPrime.
Adaptive Trend Breaks (ATB) is a trendline breakout system optimized for scalping liquid futures contracts. The indicator automatically draws dynamic support and resistance trendlines based on pivot points, then generates trade signals when price breaks through these levels with confirmation filters. It includes automated target and stop-loss placement with real-time P&L tracking in dollars.
## HOW IT WORKS
**Trendline Detection Method:**
The indicator uses pivot high/low detection to identify significant price turning points. When a new pivot forms, it calculates the slope between consecutive pivots to draw dynamic trendlines. These lines extend forward based on the established trend angle, creating actionable support and resistance zones.
**Band System:**
Around each trendline, the script creates a "band" using a volatility-adjusted calculation: `ATR(14) * 0.2 * bandwidth multiplier / 2`. This adaptive band accounts for current market conditions - wider during volatile periods, tighter during quiet markets.
**Breakout Logic:**
A breakout signal triggers when:
1. Price closes beyond the trendline + band zone
2. Volume exceeds the 20-period moving average by your set multiplier (default 1.2x)
3. Price is within Regular Trading Hours (9:30-16:00 EST) if session filter enabled
4. Current ATR meets minimum volatility threshold (prevents trading dead markets)
**Target & Stop Calculation:**
Upon breakout confirmation:
- **Entry**: Trendline breach point
- **Target**: Entry ± (bandwidth × target multiplier) - default 8x for quick scalps
- **Stop**: Entry ± (bandwidth × stop multiplier) - default 8x for 1:1 risk/reward
- Multipliers adjust automatically to market volatility through the ATR-based band
**P&L Conversion:**
The script converts point movements to dollars using:
```
Dollar P&L = (Price Points × Contract Point Value × Quantity)
```
For example, a 10-point NQ move with 2 contracts = 10 × $20 × 2 = $400
## HOW TO USE IT
**Setup:**
1. Select your instrument (NQ/ES/YM/RTY) - point values auto-configure
2. Set contract quantity for accurate dollar P&L
3. Choose pivot period (lower = more signals but more noise, default 5 for scalping)
4. Adjust bandwidth multiplier if trendlines are too tight/loose (1-5 range)
**Filters Configuration:**
- **Volume Filter**: Requires breakout volume > moving average × multiplier. Increase multiplier (1.5-2.0) for higher conviction trades
- **Session Filter**: Enable to trade only RTH. Disable for 24-hour trading
- **ATR Filter**: Prevents signals during low volatility. Increase minimum % for more active markets only
**Risk Management:**
- Set target/stop multipliers based on your risk tolerance
- 8x bandwidth = approximately 1:1 risk/reward for most liquid futures
- Enable trailing stops for trend-following approach (moves stop to protect profits)
- Adjust line length to see targets further into the future
**Statistics Table:**
- Choose timeframe to analyze: all-time, today, this week, custom days
- Monitor win rate, profit factor, and net P&L in dollars
- Track long vs short performance separately
- See real-time unrealized P&L on active trades
**Reading Signals:**
- **Green triangle below bar** = Long breakout (resistance broken)
- **Red triangle above bar** = Short breakout (support broken)
- **White dashed line** = Entry price
- **Orange line** = Take profit target with dollar value
- **Red line** = Stop loss with dollar value
- **Green checkmark (✓)** = Target hit, winning trade
- **Red X (✗)** = Stop hit, losing trade
## WHAT IT DOES NOT DO
**Limitations to Understand:**
- Does not predict future trendline formations - it reacts to breakouts after they occur
- Historical trendlines disappear after breakout (not kept on chart for clarity)
- Requires sufficient volatility - may not signal in extremely quiet markets
- Volume filter requires exchange volume data (not available on all symbols)
- Statistics are indicator-based simulations, not actual trading results
- Does not account for slippage, commissions, or order fills
## BEST PRACTICES
**Recommended Settings by Market:**
- **NQ (Nasdaq)**: Default settings work well, consider volume multiplier 1.3-1.5
- **ES (S&P 500)**: Slightly slower, try period 7-8, volume 1.2
- **YM (Dow)**: Lower volatility, reduce bandwidth to 1.5-2
- **RTY (Russell)**: Higher volatility, increase bandwidth to 3-4
**Risk Management:**
- Never risk more than 2-3% of account per trade
- Use contract quantity calculator: Max Risk $ ÷ (Stop Distance × Point Value)
- Start with 1 contract while learning the system
- Backtest your specific timeframe and instrument before live trading
**Optimization Tips:**
- Increase pivot period (7-10) for fewer but higher-quality signals
- Raise volume multiplier (1.5-2.0) in choppy markets
- Lower target/stop multipliers (5-6x) for tighter profit taking
- Use trailing stops in strong trending conditions
- Disable session filter for overnight gaps and Asia session moves
## TECHNICAL DETAILS
**Key Calculations:**
- Pivot Detection: `ta.pivothigh(high, period, period/2)` and `ta.pivotlow(low, period, period/2)`
- Slope Calculation: `(newPivot - oldPivot) / (newTime - oldTime)`
- Adaptive Band: `min(ATR(14) * 0.2, close * 0.002) * multiplier / 2`
- Breakout Confirmation: Price crosses trendline + 10% of band threshold
**Data Requirements:**
- Minimum bars in view: 500 for proper pivot calculation
- Volume data required for volume filter accuracy
- Intraday timeframes recommended (1min - 15min) for scalping
- Works on any timeframe but optimized for fast execution
**Performance Metrics:**
All statistics calculate based on indicator signals:
- Tracks every signal as a trade from entry to TP/SL
- P&L in actual contract dollar values
- Win rate = (Winning trades / Total trades) × 100
- Profit factor = Gross profit / Gross loss
- Separates long/short performance for bias analysis
## IDEAL FOR
- Futures scalpers and day traders
- Traders who prefer visual trendline breakouts
- Those wanting automated TP/SL placement
- Traders tracking performance in dollar terms
- Multiple timeframe analysis (compare 1min vs 5min signals)
## NOT SUITABLE FOR
- Swing trading (targets too close)
- Stocks/forex without modifying point values
- Extremely low timeframes (<30 seconds) - too much noise
- Markets without volume data if using volume filter
- Illiquid contracts (signals may not execute at shown prices)
---
**Settings Summary:**
- Core: Period, bandwidth, extension, trendline style
- Filters: Volume, RTH session, ATR volatility
- Risk: R:R ratio, target/stop multipliers, trailing stop
- Display: Stats table position, size, colors
- Stats: Timeframe selection (all-time to custom days)
**License:** This indicator is published open-source under Mozilla Public License 2.0. You may use and modify the code with proper attribution.
**Disclaimer:** This indicator is for educational purposes. Past performance does not guarantee future results. Always practice proper risk management and test thoroughly before live trading.
---
## CREDITS & ATTRIBUTION
This script builds upon the "Trendline Breakouts With Targets" concept by ChartPrime with significant enhancements:
**Major Improvements Added:**
- **Futures-Specific Calculations**: Automated dollar P&L conversion using actual contract point values (NQ=$20, ES=$50, YM=$5, RTY=$50)
- **Advanced Statistics Engine**: Comprehensive performance tracking with customizable timeframe analysis (today, week, month, custom ranges)
- **Multi-Layer Filtering System**: Volume confirmation, RTH session filter, and ATR volatility filter to reduce false signals
- **Professional Trade Management**: Enhanced visual trade tracking with separate TP/SL lines, dollar value labels, and optional trailing stops
- **Optimized for Scalping**: Faster pivot periods (5 vs 10), tighter bands, and reduced extension bars for quick entries
Original trendline detection methodology by ChartPrime - used with modification under Mozilla Public License 2.0.

BTS by Ichan Aristain• Breakout Trading System
Adaptive buy/sell engine tuned for crypto that blends EMAs, Ichimoku cloud context, breakout/consolidation filters, momentum checks, and volume validation. It auto-detects symbol
class (BTC, majors, alts, DeFi, small caps) and adjusts the logic accordingly. On the chart you see clean BUY/SELL tags, optional TP ideas, and peak/floor markers; support/resistance
price-action dots keep the view tidy.
Breakout helpers, consolidation and momentum pings, peak/floor updates, and TP suggestions all drive alert hooks so you can automate entries, exits, or take-profit workflows. A
bottom-right dashboard tracks buy/sell win counts (TP hits) and overall hit rate so you always know how the strategy is performing. Toggle the visual layers you need via the “Trade
Visuals” inputs to match your workflow—from scalping to higher-timeframe swing trading.

Breakout Trading System• Breakout Trading System
Adaptive buy/sell engine tuned for crypto that blends EMAs, Ichimoku cloud context, breakout/consolidation filters, momentum checks, and volume validation. It auto-detects symbol
class (BTC, majors, alts, DeFi, small caps) and adjusts the logic accordingly. On the chart you see clean BUY/SELL tags, optional TP ideas, and peak/floor markers; support/resistance
price-action dots keep the view tidy.
Breakout helpers, consolidation and momentum pings, peak/floor updates, and TP suggestions all drive alert hooks so you can automate entries, exits, or take-profit workflows. A
bottom-right dashboard tracks buy/sell win counts (TP hits) and overall hit rate so you always know how the strategy is performing. Toggle the visual layers you need via the “Trade
Visuals” inputs to match your workflow—from scalping to higher-timeframe swing trading.

Pivot Breakout with Trend ZonesOverview
Pivot Breakout with Trend Zones is a technical analysis indicator that identifies key pivot points and trend direction through dynamic candle coloring. It helps traders visualize breakouts and ongoing trends in real-time.
Key Features
🔍 Pivot Point Detection
Automatically identifies significant high and low pivot points
Customizable left/right bar parameters for sensitivity adjustment
Displays pivot levels as cross-style lines with offset positioning
🎨 Smart Candle Coloring
White candles: Breakout above pivot high (bullish signal)
Black candles: Breakout below pivot low (bearish signal)
Teal candles: Uptrend continuation
Coral Red candles: Downtrend continuation
Optional color fill toggle for customization
📊 Trend Identification
Automatically tracks trend direction after breakouts
Maintains trend state until opposite breakout occurs
Clear visual distinction between breakout and trend-following phases
Input Parameters
Pivot Settings
Left Bars (High/Low): Number of bars to the left of pivot
Right Bars (High/Low): Number of bars to the right of pivot
Display Options
Enable Candle Color Fill: Toggle color visualization on/off
Line Offset: Adjust pivot line positioning (-50 to 0 bars)
How It Works
Pivot Calculation: Uses TradingView's built-in pivothigh() and pivotlow() functions to detect significant turning points
Breakout Detection: Monitors when price closes beyond pivot levels, triggering trend changes
Trend Management: Once a breakout occurs, the indicator maintains the trend direction until a counter-breakout signals reversal
Visual Feedback: Provides immediate color-coded feedback for quick market analysis
Use Cases
Swing Trading: Identify entry points at pivot breakouts
Trend Following: Stay in trades during trend continuation phases
Market Structure: Visualize support/resistance levels and trend changes
Risk Management: Use pivot levels for stop-loss placement
Ideal For
Traders looking for clear visual trend identification
Technical analysts monitoring breakout opportunities
Anyone seeking to combine pivot analysis with trend following strategies
This indicator provides a clean, intuitive way to spot trend changes and follow market momentum with immediate visual feedback through candle coloring.

MACD Enhanced [DCAUT]█ MACD Enhanced
📊 ORIGINALITY & INNOVATION
The MACD Enhanced represents a significant improvement over traditional MACD implementations. While Gerald Appel's original MACD from the 1970s was limited to exponential moving averages (EMA), this enhanced version expands algorithmic options by supporting 21 different moving average calculations for both the main MACD line and signal line independently.
This improvement addresses an important limitation of traditional MACD: the inability to adapt the indicator's mathematical foundation to different market conditions. By allowing traders to select from algorithms ranging from simple moving averages (SMA) for stability to advanced adaptive filters like Kalman Filter for noise reduction, this implementation changes MACD from a fixed-algorithm tool into a flexible instrument that can be adjusted for specific market environments and trading strategies.
The enhanced histogram visualization system uses a four-color gradient that helps communicate momentum strength and direction more clearly than traditional single-color histograms.
📐 MATHEMATICAL FOUNDATION
The core calculation maintains the proven MACD formula: Fast MA(source, fastLength) - Slow MA(source, slowLength), but extends it with algorithmic flexibility. The signal line applies the selected smoothing algorithm to the MACD line over the specified signal period, while the histogram represents the difference between MACD and signal lines.
Available Algorithms:
The implementation supports a comprehensive spectrum of technical analysis algorithms:
Basic Averages: SMA (arithmetic mean), EMA (exponential weighting), RMA (Wilder's smoothing), WMA (linear weighting)
Advanced Averages: HMA (Hull's low-lag), VWMA (volume-weighted), ALMA (Arnaud Legoux adaptive)
Mathematical Filters: LSMA (least squares regression), DEMA (double exponential), TEMA (triple exponential), ZLEMA (zero-lag exponential)
Adaptive Systems: T3 (Tillson T3), FRAMA (fractal adaptive), KAMA (Kaufman adaptive), MCGINLEY_DYNAMIC (reactive to volatility)
Signal Processing: ULTIMATE_SMOOTHER (low-pass filter), LAGUERRE_FILTER (four-pole IIR), SUPER_SMOOTHER (two-pole Butterworth), KALMAN_FILTER (state-space estimation)
Specialized: TMA (triangular moving average), LAGUERRE_BINOMIAL_FILTER (binomial smoothing)
Each algorithm responds differently to price action, allowing traders to match the indicator's behavior to market characteristics: trending markets benefit from responsive algorithms like EMA or HMA, while ranging markets require stable algorithms like SMA or RMA.
📊 COMPREHENSIVE SIGNAL ANALYSIS
Histogram Interpretation:
Positive Values: Indicate bullish momentum when MACD line exceeds signal line, suggesting upward price pressure and potential buying opportunities
Negative Values: Reflect bearish momentum when MACD line falls below signal line, indicating downward pressure and potential selling opportunities
Zero Line Crosses: MACD crossing above zero suggests transition to bullish bias, while crossing below indicates bearish bias shift
Momentum Changes: Rising histogram (regardless of positive/negative) signals accelerating momentum in the current direction, while declining histogram warns of momentum deceleration
Advanced Signal Recognition:
Divergences: Price making new highs/lows while MACD fails to confirm often precedes trend reversals
Convergence Patterns: MACD line approaching signal line suggests impending crossover and potential trade setup
Histogram Peaks: Extreme histogram values often mark momentum exhaustion points and potential reversal zones
🎯 STRATEGIC APPLICATIONS
Comprehensive Trend Confirmation Strategies:
Primary Trend Validation Protocol:
Identify primary trend direction using higher timeframe (4H or Daily) MACD position relative to zero line
Confirm trend strength by analyzing histogram progression: consistent expansion indicates strong momentum, contraction suggests weakening
Use secondary confirmation from MACD line angle: steep angles (>45°) indicate strong trends, shallow angles suggest consolidation
Validate with price structure: trending markets show consistent higher highs/higher lows (uptrend) or lower highs/lower lows (downtrend)
Entry Timing Techniques:
Pullback Entries in Uptrends: Wait for MACD histogram to decline toward zero line without crossing, then enter on histogram expansion with MACD line still above zero
Breakout Confirmations: Use MACD line crossing above zero as confirmation of upward breakouts from consolidation patterns
Continuation Signals: Look for MACD line re-acceleration (steepening angle) after brief consolidation periods as trend continuation signals
Advanced Divergence Trading Systems:
Regular Divergence Recognition:
Bullish Regular Divergence: Price creates lower lows while MACD line forms higher lows. This pattern is traditionally considered a potential upward reversal signal, but should be combined with other confirmation signals
Bearish Regular Divergence: Price makes higher highs while MACD shows lower highs. This pattern is traditionally considered a potential downward reversal signal, but trading decisions should incorporate proper risk management
Hidden Divergence Strategies:
Bullish Hidden Divergence: Price shows higher lows while MACD displays lower lows, indicating trend continuation potential. Use for adding to existing long positions during pullbacks
Bearish Hidden Divergence: Price creates lower highs while MACD forms higher highs, suggesting downtrend continuation. Optimal for adding to short positions during bear market rallies
Multi-Timeframe Coordination Framework:
Three-Timeframe Analysis Structure:
Primary Timeframe (Daily): Determine overall market bias and major trend direction. Only trade in alignment with daily MACD direction
Secondary Timeframe (4H): Identify intermediate trend changes and major entry opportunities. Use for position sizing decisions
Execution Timeframe (1H): Precise entry and exit timing. Look for MACD line crossovers that align with higher timeframe bias
Timeframe Synchronization Rules:
Daily MACD above zero + 4H MACD rising = Strong uptrend context for long positions
Daily MACD below zero + 4H MACD declining = Strong downtrend context for short positions
Conflicting signals between timeframes = Wait for alignment or use smaller position sizes
1H MACD signals only valid when aligned with both higher timeframes
Algorithm Considerations by Market Type:
Trending Markets: Responsive algorithms like EMA, HMA may be considered, but effectiveness should be tested for specific market conditions
Volatile Markets: Noise-reducing algorithms like KALMAN_FILTER, SUPER_SMOOTHER may help reduce false signals, though results vary by market
Range-Bound Markets: Stability-focused algorithms like SMA, RMA may provide smoother signals, but individual testing is required
Short Timeframes: Low-lag algorithms like ZLEMA, T3 theoretically respond faster but may also increase noise
Important Note: All algorithm choices and parameter settings should be thoroughly backtested and validated based on specific trading strategies, market conditions, and individual risk tolerance. Different market environments and trading styles may require different configuration approaches.
📋 DETAILED PARAMETER CONFIGURATION
Comprehensive Source Selection Strategy:
Price Source Analysis and Optimization:
Close Price (Default): Most commonly used, reflects final market sentiment of each period. Best for end-of-day analysis, swing trading, daily/weekly timeframes. Advantages: widely accepted standard, good for backtesting comparisons. Disadvantages: ignores intraday price action, may miss important highs/lows
HL2 (High+Low)/2: Midpoint of the trading range, reduces impact of opening gaps and closing spikes. Best for volatile markets, gap-prone assets, forex markets. Calculation impact: smoother MACD signals, reduced noise from price spikes. Optimal when asset shows frequent gaps, high volatility during specific sessions
HLC3 (High+Low+Close)/3: Weighted average emphasizing the close while including range information. Best for balanced analysis, most asset classes, medium-term trading. Mathematical effect: 33% weight to high/low, 33% to close, provides compromise between close and HL2. Use when standard close is too noisy but HL2 is too smooth
OHLC4 (Open+High+Low+Close)/4: True average of all price points, most comprehensive view. Best for complete price representation, algorithmic trading, statistical analysis. Considerations: includes opening sentiment, smoothest of all options but potentially less responsive. Optimal for markets with significant opening moves, comprehensive trend analysis
Parameter Configuration Principles:
Important Note: Different moving average algorithms have distinct mathematical characteristics and response patterns. The same parameter settings may produce vastly different results when using different algorithms. When switching algorithms, parameter settings should be re-evaluated and tested for appropriateness.
Length Parameter Considerations:
Fast Length (Default 12): Shorter periods provide faster response but may increase noise and false signals, longer periods offer more stable signals but slower response, different algorithms respond differently to the same parameters and may require adjustment
Slow Length (Default 26): Should maintain a reasonable proportional relationship with fast length, different timeframes may require different parameter configurations, algorithm characteristics influence optimal length settings
Signal Length (Default 9): Shorter lengths produce more frequent crossovers but may increase false signals, longer lengths provide better signal confirmation but slower response, should be adjusted based on trading style and chosen algorithm characteristics
Comprehensive Algorithm Selection Framework:
MACD Line Algorithm Decision Matrix:
EMA (Standard Choice): Mathematical properties: exponential weighting, recent price emphasis. Best for general use, traditional MACD behavior, backtesting compatibility. Performance characteristics: good balance of speed and smoothness, widely understood behavior
SMA (Stability Focus): Equal weighting of all periods, maximum smoothness. Best for ranging markets, noise reduction, conservative trading. Trade-offs: slower signal generation, reduced sensitivity to recent price changes
HMA (Speed Optimized): Hull Moving Average, designed for reduced lag. Best for trending markets, quick reversals, active trading. Technical advantage: square root period weighting, faster trend detection. Caution: can be more sensitive to noise
KAMA (Adaptive): Kaufman Adaptive MA, adjusts smoothing based on market efficiency. Best for varying market conditions, algorithmic trading. Mechanism: fast smoothing in trends, slow smoothing in sideways markets. Complexity: requires understanding of efficiency ratio
Signal Line Algorithm Optimization Strategies:
Matching Strategy: Use same algorithm for both MACD and signal lines. Benefits: consistent mathematical properties, predictable behavior. Best when backtesting historical strategies, maintaining traditional MACD characteristics
Contrast Strategy: Use different algorithms for optimization. Common combinations: MACD=EMA, Signal=SMA for smoother crossovers, MACD=HMA, Signal=RMA for balanced speed/stability, Advanced: MACD=KAMA, Signal=T3 for adaptive behavior with smooth signals
Market Regime Adaptation: Trending markets: both fast algorithms (EMA/HMA), Volatile markets: MACD=KALMAN_FILTER, Signal=SUPER_SMOOTHER, Range-bound: both slow algorithms (SMA/RMA)
Parameter Sensitivity Considerations:
Impact of Parameter Changes:
Length Parameter Sensitivity: Small parameter adjustments can significantly affect signal timing, while larger adjustments may fundamentally change indicator behavior characteristics
Algorithm Sensitivity: Different algorithms produce different signal characteristics. Thoroughly test the impact on your trading strategy before switching algorithms
Combined Effects: Changing multiple parameters simultaneously can create unexpected effects. Recommendation: adjust parameters one at a time and thoroughly test each change
📈 PERFORMANCE ANALYSIS & COMPETITIVE ADVANTAGES
Response Characteristics by Algorithm:
Fastest Response: ZLEMA, HMA, T3 - minimal lag but higher noise
Balanced Performance: EMA, DEMA, TEMA - good trade-off between speed and stability
Highest Stability: SMA, RMA, TMA - reduced noise but increased lag
Adaptive Behavior: KAMA, FRAMA, MCGINLEY_DYNAMIC - automatically adjust to market conditions
Noise Filtering Capabilities:
Advanced algorithms like KALMAN_FILTER and SUPER_SMOOTHER help reduce false signals compared to traditional EMA-based MACD. Noise-reducing algorithms can provide more stable signals in volatile market conditions, though results will vary based on market conditions and parameter settings.
Market Condition Adaptability:
Unlike fixed-algorithm MACD, this enhanced version allows real-time optimization. Trending markets benefit from responsive algorithms (EMA, HMA), while ranging markets perform better with stable algorithms (SMA, RMA). The ability to switch algorithms without changing indicators provides greater flexibility.
Comparative Performance vs Traditional MACD:
Algorithm Flexibility: 21 algorithms vs 1 fixed EMA
Signal Quality: Reduced false signals through noise filtering algorithms
Market Adaptability: Optimizable for any market condition vs fixed behavior
Customization Options: Independent algorithm selection for MACD and signal lines vs forced matching
Professional Features: Advanced color coding, multiple alert conditions, comprehensive parameter control
USAGE NOTES
This indicator is designed for technical analysis and educational purposes. Like all technical indicators, it has limitations and should not be used as the sole basis for trading decisions. Algorithm performance varies with market conditions, and past characteristics do not guarantee future results. Always combine with proper risk management and thorough strategy testing.

ZZ TRADERS📌 ZZ Traders ALGO – Smart Trading Companion for Every Timeframe
Introducing "ZZ Traders ALGO" – a precision-built, multi-timeframe algorithm designed for GOLD traders who value accuracy, efficiency, and real-time insights.
🔹 Universal Timeframe Compatibility:
Works seamlessly across all timeframes – from scalping the 1-minute chart to analyzing long-term trends on the daily and weekly levels.
🔹 Optimized for XAU/USD (Gold):
Specially tuned to capture the unique volatility and price behavior of gold. Get smarter entries and exits with confidence.
🔹 Algorithmic Insights:
Built on advanced price action and custom logic to detect potential reversals, trend strength, and key market zones.
🔹 Simple Yet Powerful:
Clean visuals, minimal noise – just the signals that matter. Designed for both beginner and experienced traders.
🔹 Ideal for Scalping, Intraday & Swing Trading:
Whether you're in and out quickly or holding positions, ZZ Traders ALGO adapts to your style.
📈 Developed by Professional Traders, for Traders – because precision matters.
📩 For inquiries or access, contact me on WhatsApp: +92 300 8339822

ZZ Traders ALGO📌 ZZ Traders ALGO – Smart Trading Companion for Every Timeframe
Introducing "ZZ Traders ALGO" – a precision-built, multi-timeframe algorithm designed for GOLD traders who value accuracy, efficiency, and real-time insights.
🔹 Universal Timeframe Compatibility:
Works seamlessly across all timeframes – from scalping the 1-minute chart to analyzing long-term trends on the daily and weekly levels.
🔹 Optimized for XAU/USD (Gold):
Specially tuned to capture the unique volatility and price behavior of gold. Get smarter entries and exits with confidence.
🔹 Algorithmic Insights:
Built on advanced price action and custom logic to detect potential reversals, trend strength, and key market zones.
🔹 Simple Yet Powerful:
Clean visuals, minimal noise – just the signals that matter. Designed for both beginner and experienced traders.
🔹 Ideal for Scalping, Intraday & Swing Trading:
Whether you're in and out quickly or holding positions, ZZ Traders ALGO adapts to your style.
📈 Developed by Professional Traders, for Traders – because precision matters.
📩 For inquiries or access, contact me on WhatsApp: +92 300 8339822