HV-SMA DeltaHistorical Volatility with SMA Multiplier
Concept
This indicator acts as a "volatility explosion meter" for the market. Its core principle is to compare the current volatility with its historical average to detect moments when the market begins to "swing" with significantly more force.
The main components are as follows:
① Historical Volatility (HV) This line is an indicator of the current price volatility.
If this line moves higher, it means the price is swinging wildly (high volatility).
If this line is low, it means the price is calm or moving within a narrow range (low volatility).
② SMA x Multiplier This line functions as a "threshold" or "volatility resistance" level. It is calculated from the moving average of past volatility and then multiplied by an adjustable number (smaMultiplier) to create an upper band. In simple terms, this line tells us: "Normally, volatility should not exceed this level."
③ Difference (Histogram) This is the result of subtracting the Threshold Line (②) from the HV value (①).
Appear when the HV breaks above the threshold line. This signals that "volatility has now spiked significantly above its historical average."
Appear when the HV is still below the threshold line. This indicates that volatility remains at a normal or below-average level.
.
.
How to Use
This indicator does not tell you the direction of the price. Instead, it indicates the "power" or "momentum" of the movement. Therefore, it should always be used in conjunction with other tools to confirm the direction.
① Look for "Volatility Breakout" signals.
② Use it to confirm the strength of a trend.
③ Use it for risk management.
You can try adjusting the smaLength and smaMultiplier values in the indicator's settings to fit the specific asset and timeframe you are trading. More volatile assets may require a higher Multiplier.
-----------------------------------------------------------
หลักการทำงาน (Concept)
Indicator ตัวนี้เป็น "เครื่องวัดการระเบิดของความผันผวน" ในตลาด
โดยแกนหลักเป็นการเปรียบเทียบความผันผวนในปัจจุบันกับความผันผวนโดยเฉลี่ยในอดีต
เพื่อหาจังหวะที่ตลาดเริ่ม "เหวี่ยง" แรงขึ้นอย่างมีนัยสำคัญ
ส่วนประกอบหลักๆ มีดังนี้:
① Historical Volatility (HV)
เส้นนี้คือตัวชี้วัดความผันผวนของราคา ณ ปัจจุบัน
ถ้าเส้นนี้วิ่งขึ้นสูง แปลว่าราคากำลังแกว่งตัวรุนแรง (ผันผวนสูง)
ถ้าเส้นนี้อยู่ต่ำ แปลว่าราคานิ่งๆ หรือเคลื่อนไหวในกรอบแคบๆ (ผันผวนต่ำ)
② SMA x Multiplier
เส้นนี้ทำหน้าที่เป็น "เส้นเกณฑ์" หรือ "แนวต้านของความผันผวน"
ถูกคำนวณมาจากเส้นค่าเฉลี่ยของความผันผวนในอดีต
แล้วคูณด้วยตัวเลข Adjustable (sma-Multiplier) เพื่อสร้างเป็นกรอบบน
พูดง่ายๆ คือ เส้นนี้บอกเราว่า "โดยปกติแล้ว ความผันผวนไม่ควรจะเกินระดับนี้"
③ Difference (Histogram)
เป็นผลลัพธ์จากการนำค่า HV ข้อ ① มาลบกับ เส้นเกณฑ์ ข้อ ②
เกิดขึ้นเมื่อ HV ทะลุเส้นเกณฑ์ขึ้นไป
เป็นสัญญาณว่า ณ ตอนนี้ "ความผันผวนได้พุ่งสูงกว่าค่าเฉลี่ยในอดีตอย่างมีนัยสำคัญ"
เกิดขึ้นเมื่อ HV ยังอยู่ต่ำกว่าเส้นเกณฑ์
บอกว่าความผันผวนยังอยู่ในระดับปกติหรือต่ำกว่าค่าเฉลี่ย
.
.
วิธีการนำไปใช้ (How to Use)
Indicator ตัวนี้ ไม่ได้บอกทิศทางของราคา
แต่จะบอก "พลัง" หรือ "โมเมนตัม" ของการเคลื่อนไหว
เราจึงควรใช้มันร่วมกับเครื่องมืออื่นเพื่อยืนยันทิศทางเสมอ
① มองหาสัญญาณ "การระเบิดของราคา" (Volatility Breakout)
② ใช้ยืนยันความแข็งแกร่งของเทรนด์
③ ใช้ในการบริหารความเสี่ยง
สามารถลองปรับค่า smaLength และ smaMultiplier ในการตั้งค่า Indicator
เพื่อให้เข้ากับสินทรัพย์และ Timeframe ที่เทรดได้นะ
สินทรัพย์ที่เหวี่ยงแรงๆ อาจต้องใช้ Multiplier ที่สูงขึ้น เป็นต้น
在腳本中搜尋"swing"

Aurum DCX AVE Gold and Silver StrategySummary in one paragraph
Aurum DCX AVE is a volatility break strategy for gold and silver on intraday and swing timeframes. It aligns a new Directional Convexity Index with an Adaptive Volatility Envelope and an optional USD/DXY bias so trades appear only when direction quality and expansion agree. It is original because it fuses three pieces rarely combined in one model for metals: a convexity aware trend strength score, a percentile based envelope that widens with regime heat, and an intermarket DXY filter.
Scope and intent
• Markets. Gold and silver futures or spot, other liquid commodities, major indices
• Timeframes. Five minutes to one day. Defaults to 30min for swing pace
• Default demo used in this publication. TVC:GOLD on 30m
• Purpose. Enter confirmed volatility breaks while muting chop using regime heat and USD bias
• Limits. This is a strategy. Orders are simulated on standard candles only
Originality and usefulness
• Unique fusion. DCX combines DI strength with path efficiency and curvature. AVE blends ATR with a high TR percentile and widens with DCX heat. DXY adds an intermarket bias
• Failure mode addressed. False starts inside compression and unconfirmed breakouts during USD swings
• Testability. Each component has a named input. Entry names L and S are visible in the list of trades
• Portable yardstick. Weekly ATR for stops and R multiples for targets
• Open source. Method and implementation are disclosed for community review
Method overview in plain language
You score direction quality with DCX, size an adaptive envelope with a blend of ATR and a high TR percentile, and only allow breaks that clear the band while DCX is above a heat threshold in the same direction. An optional DXY filter favors long when USD weakens and short when USD strengthens. Orders are bracketed with a Weekly ATR stop and an R multiple target, with optional trailing to the envelope.
Base measures
• Range basis. True Range and ATR over user windows. A high TR percentile captures expansion tails used by AVE
• Return basis. Not required
Components
• Directional Convexity Index DCX. Measures directional strength with DX, multiplies by path efficiency, blends a curvature term from acceleration, scales to 0 to 100, and uses a rise window
• Adaptive Volatility Envelope AVE. Midline ALMA or HMA or EMA plus bands sized by a blend of ATR and a high TR percentile. The blend weight follows volatility of volatility. Band width widens with DCX heat
• DXY Bias optional. Daily EMA trend of DXY. Long bias when USD weakens. Short bias when USD strengthens
• Risk block. Initial stop equals Weekly ATR times a multiplier. Target equals an R multiple of the initial risk. Optional trailing to AVE band
Fusion rule
• All gates must pass. DCX above threshold and rising. Directional lead agrees. Price breaks the AVE band in the same direction. DXY bias agrees when enabled
Signal rule
• Long. Close above AVE upper and DCX above threshold and DCX rising and plus DI leads and DXY bias is bearish
• Short. Close below AVE lower and DCX above threshold and DCX falling and minus DI leads and DXY bias is bullish
• Exit and flip. Bracket exit at stop or target. Optional trailing to AVE band
Inputs with guidance
Setup
• Symbol. Default TVC:GOLD (Correlation Asset for internal logic)
• Signal timeframe. Blank follows the chart
• Confirm timeframe. Default 1 day used by the bias block
Directional Convexity Index
• DCX window. Typical 10 to 21. Higher filters more. Lower reacts earlier
• DCX rise bars. Typical 3 to 6. Higher demands continuation
• DCX entry threshold. Typical 15 to 35. Higher avoids soft moves
• Efficiency floor. Typical 0.02 to 0.06. Stability in quiet tape
• Convexity weight 0..1. Typical 0.25 to 0.50. Higher gives curvature more influence
Adaptive Volatility Envelope
• AVE window. Typical 24 to 48. Higher smooths more
• Midline type. ALMA or HMA or EMA per preference
• TR percentile 0..100. Typical 75 to 90. Higher favors only strong expansions
• Vol of vol reference. Typical 0.05 to 0.30. Controls how much the percentile term weighs against ATR
• Base envelope mult. Typical 1.4 to 2.2. Width of bands
• Regime adapt 0..1. Typical 0.6 to 0.95. How much DCX heat widens or narrows the bands
Intermarket Bias
• Use DXY bias. Default ON
• DXY timeframe. Default 1 day
• DXY trend window. Typical 10 to 50
Risk
• Risk percent per trade. Reporting field. Keep live risk near one to two percent
• Weekly ATR. Default 14. Basis for stops
• Stop ATR weekly mult. Typical 1.5 to 3.0
• Take profit R multiple. Typical 1.5 to 3.0
• Trail with AVE band. Optional. OFF by default
Properties visible in this publication
• Initial capital. 20000
• Base currency. USD
• request.security lookahead off everywhere
• Commission. 0.03 percent
• Slippage. 5 ticks
• Default order size method percent of equity with value 3% of the total capital available
• Pyramiding 0
• Process orders on close ON
• Bar magnifier ON
• Recalculate after order is filled OFF
• Calc on every tick OFF
Realism and responsible publication
• No performance claims. Past results never guarantee future outcomes
• Shapes can move while a bar forms and settle on close
• Strategies use standard candles for signals and orders only
Honest limitations and failure modes
• Economic releases and thin liquidity can break assumptions behind the expansion logic
• Gap heavy symbols may prefer a longer ATR window
• Very quiet regimes can reduce signal contrast. Consider higher DCX thresholds or wider bands
• Session time follows the exchange of the chart and can change symbol to symbol
• Symbol sensitivity is expected. Use the gates and length inputs to find stable settings
Open source reuse and credits
• None
Mode
Public open source. Source is visible and free to reuse within TradingView House Rules
Legal
Education and research only. Not investment advice. You are responsible for your decisions. Test on historical data and in simulation before any live use. Use realistic costs.

Curved Radius Supertrend [BOSWaves]Curved Radius Supertrend — Adaptive Parabolic Trend Framework with Dynamic Acceleration Geometry
Overview
The Curved Radius Supertrend introduces an evolution of the classic Supertrend indicator - engineered with a dynamic curvature engine that replaces rigid ATR bands with parabolic, radius-based motion. Traditional Supertrend systems rely on static band displacement, reacting linearly to volatility and often lagging behind emerging price acceleration. The Curved Radius Supertend model redefines this by integrating controlled acceleration and curvature geometry, allowing the trend bands to adapt fluidly to both velocity and duration of price movement.
The result is a smoother, more organic trend flow that visually captures the momentum curve of price action - not just its direction. Instead of sharp pivots or whipsaws, traders experience a structurally curved trajectory that mirrors real market inertia. This makes it particularly effective for identifying sustained directional phases, detecting early trend rotations, and filtering out noise that plagues standard Supertrend methodologies.
Unlike conventional band-following systems, the Curved Radius framework is time-reactive and velocity-aware, providing a nuanced signal structure that blends geometric precision with volatility sensitivity.
Theoretical Foundation
The Curved Radius Supertrend draws from the intersection of mathematical curvature dynamics and adaptive volatility processing. Standard Supertrend algorithms extend from Average True Range (ATR) envelopes - a linear measure of volatility that moves proportionally with price deviation. However, markets do not expand or contract linearly. Trend velocity typically accelerates and decelerates in nonlinear arcs, forming natural parabolas across price phases.
By embedding a radius-based acceleration function, the indicator models this natural behavior. The core variable, radiusStrength, controls how aggressively curvature accelerates over time. Instead of simply following price distance, the band now evolves according to temporal acceleration - each bar contributes incremental velocity, bending the trend line into a radius-like curve.
This structural design allows the indicator to anticipate rather than just respond to price action, capturing momentum transitions as curved accelerations rather than binary flips. In practice, this eliminates the stutter effect typical of standard Supertrends and replaces it with fluid directional motion that better reflects actual trend geometry.
How It Works
The Curved Radius Supertrend is constructed through a multi-stage process designed to balance price responsiveness with geometric stability:
1. Baseline Supertrend Core
The framework begins with a standard ATR-derived upper and lower band calculation. These define the volatility envelope that constrains potential price zones. Directional bias is determined through crossover logic - prices above the lower band confirm an uptrend, while prices below the upper band confirm a downtrend.
2. Curvature Acceleration Engine
Once a trend direction is established, a curvature engine is activated. This system uses radiusStrength as a coefficient to simulate acceleration per bar, incrementally increasing velocity over time. The result is a parabolic displacement from the anchor price (the price level at trend change), creating a curved motion path that dynamically widens or tightens as the trend matures.
Mathematically, this acceleration behaves quadratically - each new bar compounds the previous velocity, forming an exponential rate of displacement that resembles curved inertia.
3. Adaptive Smoothing Layer
After the radius curve is applied, a smoothing stage (defined by the smoothness parameter) uses a simple moving average to regulate curve noise. This ensures visual coherence without sacrificing responsiveness, producing flowing arcs rather than jagged band steps.
4. Directional Visualization and Outer Envelope
Directional state (bullish or bearish) dictates both the color gradient and band displacement. An outer envelope is plotted one ATR beyond the curved band, creating a layered trend visualization that shows the extent of volatility expansion.
5. Signal Events and Alerts
Each directional transition triggers a 'BUY' or 'SELL' signal, clearly labeling phase shifts in market structure. Alerts are built in for automation and backtesting.
Interpretation
The Curved Radius Supertrend reframes how traders visualize and confirm trends. Instead of simply plotting a trailing stop, it maps the dynamic curvature of trend development.
Uptrend Phases : The band curves upward with increasing acceleration, reflecting the market’s growing directional velocity. As curvature steepens, conviction strengthens.
Downtrend Phases : The band bends downward in a mirrored acceleration pattern, indicating sustained bearish momentum.
Trend Change Points : When the direction flips and a new anchor point forms, the curve resets - providing a clean, early visual confirmation of structural reversal.
Smoothing and Radius Interplay : A lower radius strength produces a tighter, more reactive curve ideal for scalping or short timeframes. Higher values generate broad, sweeping arcs optimized for swing or positional analysis.
Visually, this curvature system translates market inertia into shape - revealing how trends bend, accelerate, and ultimately exhaust.
Strategy Integration
The Curved Radius Supertrend is versatile enough to integrate seamlessly into multiple trading frameworks:
Trend Following : Use BUY/SELL flips to identify emerging directional bias. Strong curvature continuation confirms sustained momentum.
Momentum Entry Filtering : Combine with oscillators or volume tools to filter entries only when the curve slope accelerates (high momentum conditions).
Pullback and Re-entry Timing : The smooth curvature of the radius band allows traders to identify shallow retracements without premature exits. The band acts as a dynamic, self-adjusting support/resistance arc.
Volatility Compression and Expansion : Flattening curvature indicates volatility compression - a potential pre-breakout zone. Rapid re-steepening signals expansion and directional conviction.
Stop Placement Framework : The curved band can serve as a volatility-adjusted trailing stop. Because the curve reflects acceleration, it adapts naturally to market rhythm - widening during momentum surges and tightening during stagnation.
Technical Implementation Details
Curved Radius Engine : Parabolic acceleration algorithm that applies quadratic velocity based on bar count and radiusStrength.
Anchor Logic : Resets curvature at each trend change, establishing a new reference base for directional acceleration.
Smoothing Layer : SMA-based curve smoothing for noise reduction.
Outer Envelope : ATR-derived band offset visualizing volatility extension.
Directional Coloring : Candle and band coloration tied to current trend state.
Signal Engine : Built-in BUY/SELL markers and alert conditions for automation or script integration.
Optimal Application Parameters
Timeframe Guidance :
1-5 min (Scalping) : 0.08–0.12 radius strength, minimal smoothing for rapid responsiveness.
15 min : 0.12–0.15 radius strength for intraday trends.
1H : 0.15–0.18 radius strength for structured short-term swing setups.
4H : 0.18–0.22 radius strength for macro-trend shaping.
Daily : 0.20–0.25 radius strength for broad directional curves.
Weekly : 0.25–0.30 radius strength for smooth macro-level cycles.
The suggested radius strength ranges provide general structural guidance. Optimal values may vary across assets and volatility regimes, and should be refined through empirical testing to account for instrument-specific behavior and prevailing market conditions.
Asset Guidance :
Cryptocurrency : Higher radius and multiplier values to stabilize high-volatility environments.
Forex : Midrange settings (0.12-0.18) for clean curvature transitions.
Equities : Balanced curvature for trending sectors or momentum rotation setups.
Indices/Futures : Moderate radius values (0.15-0.22) to capture cyclical macro swings.
Performance Characteristics
High Effectiveness :
Trending environments with directional expansion.
Markets exhibiting clean momentum arcs and low structural noise.
Reduced Effectiveness :
Range-bound or low-volatility conditions with repeated false flips.
Ultra-short-term timeframes (<1m) where curvature acceleration overshoots.
Integration Guidelines
Confluence Framework : Combine with structure tools (order blocks, BOS, liquidity zones) for entry validation.
Risk Management : Trail stops along the curved band rather than fixed points to align with adaptive market geometry.
Multi-Timeframe Confirmation : Use higher timeframe curvature as a trend filter and lower timeframe curvature for execution timing.
Curve Compression Awareness : Treat flattening arcs as potential exhaustion zones - ideal for scaling out or reducing exposure.
Disclaimer
The Curved Radius Supertrend is a geometric trend model designed for professional traders and analysts. It is not a predictive system or a guaranteed profit method. Its performance depends on correct parameter calibration and sound risk management. BOSWaves recommends using it as part of a comprehensive analytical framework, incorporating volume, liquidity, and structural context to validate directional signals.

US30 Quarter Levels (125-point grid) by FxMogul🟦 US30 Quarter Levels — Trade the Index Like the Banks
Discover the Dow’s hidden rhythm.
This indicator reveals the institutional quarter levels that govern US30 — spaced every 125 points, e.g. 45125, 45250, 45375, 45500, 45625, 45750, 45875, 46000, and so on.
These are the liquidity magnets and reaction zones where smart money executes — now visualized directly on your chart.
💼 Why You Need It
See institutional precision: The Dow respects 125-point cycles — this tool exposes them.
Catch reversals before retail sees them: Every impulse and retracement begins at one of these zones.
Build confluence instantly: Perfectly aligns with your FVGs, OBs, and session highs/lows.
Trade like a professional: Turn chaos into structure, and randomness into rhythm.
⚙️ Key Features
Automatically plots US30 quarter levels (…125 / …250 / …375 / …500 / …625 / …750 / …875 / …000).
Color-coded hierarchy:
🟨 xx000 / xx500 → major institutional levels
⚪ xx250 / xx750 → medium-impact levels
⚫ xx125 / xx375 / xx625 / xx875 → intraday liquidity pockets
Customizable window size, label spacing, and line extensions.
Works across all timeframes — from 1-minute scalps to 4-hour macro swings.
Optimized for clean visualization with no clutter.
🎯 How to Use It
Identify liquidity sweeps: Smart money hunts stops at these quarter zones.
Align structure: Combine with session opens, order blocks, or FVGs.
Set precision entries & exits: Trade reaction-to-reaction with tight risk.
Plan daily bias: Watch how New York respects these 125-point increments.
🧭 Designed For
Scalpers, day traders, and swing traders who understand that US30 doesn’t move randomly — it moves rhythmically.
Perfect for traders using ICT, SMC, or liquidity-based frameworks.
⚡ Creator’s Note
“Every 125 points, the Dow breathes. Every 1000, it shifts direction.
Once you see the rhythm, you’ll never unsee it.”
— FxMogul

Metallic Retracement LevelsThere's something that's always bothered me about how traders use Fibonacci retracements. Everyone treats the golden ratio like it's the only game in town, but mathematically speaking, it's completely arbitrary. The golden ratio is just the first member of an infinite family of metallic means, and there's no particular reason why 1.618 should be special for markets when we have the silver ratio at 2.414, the bronze ratio at 3.303, and literally every other metallic mean extending to infinity. We just picked one and decided it was magical.
The metallic means are a sequence of mathematical constants that generalize the golden ratio. They're defined by the equation x² = kx + 1, where k is any positive integer. When k equals 1, you get the golden ratio. When k equals 2, you get the silver ratio. When k equals 3, you get bronze, and so on forever. Each metallic mean generates its own set of ratios through successive powers, just like how the golden ratio gives you 0.618, 0.382, 0.236 and so forth. The silver ratio produces a completely different set of retracement levels, as does bronze, as does any arbitrary metallic number you want to choose.
This indicator calculates these metallic means using the standard alpha and beta formulas. For any metallic number k, alpha equals (k + sqrt(k² + 4)) / 2, and we generate retracement ratios by raising alpha to various negative powers. The script algorithmically generates these levels instead of hardcoding them, which is how it should have been done from the start. It's genuinely silly that most fib tools just hardcode the ratios when the math to generate them is straightforward. Even worse, traditional fib retracements use 0.5 as a level, which isn't even a fibonacci ratio. It's just thrown in there because it seems like it should be important.
The indicator works by first detecting swing points using the Sylvain Zig-Zag . The zig-zag identifies significant price swings by combining percentage change with ATR adjustments, filtering out noise and connecting major pivot points. This is what drives the retracement levels. Once a new swing is confirmed, the script calculates the range between the last two pivot points and generates metallic retracement levels from the most recent swing low or high.
You can adjust which metallic number to use (golden, silver, bronze, or any positive integer), control how many power ratios to display above and below the 1.0 level, and set how many complete retracement cycles you want drawn. The levels extend from the swing point and show you where price might react based on whichever metallic mean you've selected. The zig-zag settings let you tune the sensitivity of swing detection through ATR period, ATR multiplier, percentage reversal, and additional absolute or tick-based reversal values.
What this really demonstrates is that retracement analysis is more flexible than most traders realize. There's no mathematical law that says markets must respect the golden ratio over any other metallic mean. They're all valid mathematical constructs with the same kind of recursive properties. By making this tool, I wanted to highlight that using fibonacci retracements involves an arbitrary choice, and maybe that choice should be more deliberate or at least tested against alternatives. You can experiment with different metallic numbers and see which ones seem to work better for your particular market or timeframe, or just use this to understand that the standard fib levels everyone uses aren't as fundamental as they appear.

Forecast PriceTime Oracle [CHE] Forecast PriceTime Oracle — Prioritizes quality over quantity by using Power Pivots via RSI %B metric to forecast future pivot highs/lows in price and time
Summary
This indicator identifies potential pivot highs and lows based on out-of-bounds conditions in a modified RSI %B metric, then projects future occurrences by estimating time intervals and price changes from historical medians. It provides visual forecasts via diagonal and horizontal lines, tracks achievement with color changes and symbols, and displays a dashboard for statistical overview including hit rates. Signals are robust due to median-based aggregation, which reduces outlier influence, and optional tolerance settings for near-misses, making it suitable for anticipating reversals in ranging or trending markets.
Motivation: Why this design?
Standard pivot detection often lags or generates false signals in volatile conditions, missing the timing of true extrema. This design leverages out-of-bounds excursions in RSI %B to capture "Power Pivots" early—focusing on quality over quantity by prioritizing significant extrema rather than every minor swing—then uses historical deltas in time and price to forecast the next ones, addressing the need for proactive rather than reactive analysis. It assumes that pivot spacing follows statistical patterns, allowing users to prepare entries or exits ahead of confirmation.
What’s different vs. standard approaches?
- Reference baseline: Diverges from traditional ta.pivothigh/low, which require fixed left/right lengths and confirm only after bars close, often too late for dynamic markets.
- Architecture differences:
- Detects extrema during OOB runs rather than post-bar symmetry.
- Aggregates deltas via medians (or alternatives) over a user-defined history, capping arrays to manage resources.
- Applies tolerance thresholds for hit detection, with options for percentage, absolute, or volatility-adjusted (ATR) flexibility.
- Freezes achieved forecasts with visual states to avoid clutter.
- Practical effect: Charts show proactive dashed projections instead of retrospective dots; the dashboard reveals evolving hit rates, helping users gauge reliability over time without manual calculation.
How it works (technical)
The indicator first computes a smoothed RSI over a specified length, then applies Bollinger Bands to derive %B, flagging out-of-bounds below zero or above one hundred as potential run starts. During these runs, it tracks the extreme high or low price and bar index. Upon exit from the OOB state, it confirms the Power Pivot at that extreme and records the time delta (bars since prior) and price change percentage to rolling arrays.
For forecasts, it calculates the median (or selected statistic) of recent deltas, subtracts the confirmation delay (bars from apex to exit), and projects ahead by that adjusted amount. Price targets use the median change applied to the origin pivot value. Lines are drawn from the apex to the target bar and price, with a short horizontal at the endpoint. Arrays store up to five active forecasts, pruning oldest on overflow.
Tolerance adjusts hit checks: for highs, if the high reaches or exceeds the target (adjusted by tolerance); for lows, if the low drops to or below. Once hit, the forecast freezes, changing colors and symbols, and extends the horizontal to the hit bar. Persistent variables maintain last pivot states across bars; arrays initialize empty and grow until capped at history length.
Parameter Guide
Source: Specifies the data input for the RSI computation, influencing how price action is captured. Default is close. For conservative signals in noisy environments, switch to high; using low boosts responsiveness but may increase false positives.
RSI Length: Sets the smoothing period for the RSI calculation, with longer values helping to filter out whipsaws. Default is 32. Opt for shorter lengths like 14 to 21 on faster timeframes for quicker reactions, or extend to 50 or more in strong trends to enhance stability at the cost of some lag.
BB Length: Defines the period for the Bollinger Bands applied to %B, directly affecting how often out-of-bounds conditions are triggered. Default is 20. Align it with the RSI length: shorter periods detect more potential runs but risk added noise, while longer ones provide better filtering yet might overlook emerging extrema.
BB StdDev: Controls the multiplier for the standard deviation in the bands, where wider settings reduce false out-of-bounds alerts. Default is 2.0. Narrow it to 1.5 for highly volatile assets to catch more signals, or broaden to 2.5 or higher to emphasize only major movements.
Show Price Forecast: Enables or disables the display of diagonal and target lines along with their updates. Default is true. Turn it off for simpler chart views, or keep it on to aid in trade planning.
History Length: Determines the number of recent pivot samples used for median-based statistics, where more history leads to smoother but potentially less current estimates. Default is 50. Start with a minimum of 5 to build data; limit to 100 to 200 to prevent outdated regimes from skewing results.
Max Lookahead: Limits the number of bars projected forward to avoid overly extended lines. Default is 500. Reduce to 100 to 200 for intraday focus, or increase for longer swing horizons.
Stat Method: Selects the aggregation technique for time and price deltas: Median for robustness against outliers, Trimmed Mean (20%) for a balanced trim of extremes, or 75th Percentile for a conservative upward tilt. Default is Median. Use Median for even distributions; switch to Percentile when emphasizing potential upside in trending conditions.
Tolerance Type: Chooses the approach for flexible hit detection: None for exact matches, Percentage for relative adjustments, Absolute for fixed point offsets, or ATR for scaling with volatility. Default is None. Begin with Percentage at 0.5 percent for currency pairs, or ATR for adapting to cryptocurrency swings.
Tolerance %: Provides the relative buffer when using Percentage mode, forgiving small deviations. Default is 0.5. Set between 0.2 and 1.0 percent; higher values accommodate gaps but can overstate hit counts.
Tolerance Points: Establishes a fixed offset in price units for Absolute mode. Default is 0.0010. Tailor to the asset, such as 0.0001 for forex pairs, and validate against past wick behavior.
ATR Length: Specifies the period for the Average True Range in dynamic tolerance calculations. Default is 14. This is the standard setting; shorten to 10 to reflect more recent volatility.
ATR Multiplier: Adjusts the ATR scale for tolerance width in ATR mode. Default is 0.5. Range from 0.3 for tighter precision to 0.8 for greater leniency.
Dashboard Location: Positions the summary table on the chart. Default is Bottom Right. Consider Top Left for better visibility on mobile devices.
Dashboard Size: Controls the text scaling for dashboard readability. Default is Normal. Choose Tiny for dense overlays or Large for detailed review sessions.
Text/Frame Color: Sets the color scheme for dashboard text and borders. Default is gray. Align with your chart theme, opting for lighter shades on dark backgrounds.
Reading & Interpretation
Forecast lines appear as dashed diagonals from confirmed pivots to projected targets, with solid horizontals at endpoints marking price levels. Open targets show a target symbol (🎯); achieved ones switch to a trophy symbol (🏆) in gray, with lines fading to gray. The dashboard summarizes median time/price deltas, sample counts, and hit rates—rising rates indicate improving forecast alignment. Colors differentiate highs (red) from lows (lime); frozen states signal validated projections.
Practical Workflows & Combinations
- Trend following: Enter long on low forecast hits during uptrends (higher highs/lower lows structure); filter with EMA crossovers to ignore counter-trend signals.
- Reversal setups: Short above high projections in overextended rallies; use volume spikes as confirmation to reduce false breaks.
- Exits/Stops: Trail stops to prior pivot lows; conservative on low hit rates (below 50%), aggressive above 70% with tight tolerance.
- Multi-TF: Apply on 1H for entries, 4H for time projections; combine with Ichimoku clouds for confluence on targets.
- Risk management: Position size inversely to delta uncertainty (wider history = smaller bets); avoid low-liquidity sessions.
Behavior, Constraints & Performance
Confirmation occurs on OOB exit, so live-bar pivots may adjust until close, but projections update only on events to minimize repaint. No security or HTF calls, so no external lookahead issues. Arrays cap at history length with shifts; forecasts limited to five active, pruning FIFO. Loops iterate over small fixed sizes (e.g., up to 50 for stats), efficient on most hardware. Max lines/labels at 500 prevent overflow.
Known limits: Sensitive to OOB parameter tuning—too tight misses runs; assumes stationary pivot stats, which may shift in regime changes like low vol. Gaps or holidays distort time deltas.
Sensible Defaults & Quick Tuning
Defaults suit forex/crypto on 1H–4H: RSI 32/BB 20 for balanced detection, Median stats over 50 samples, None tolerance for exactness.
- Too many false runs: Increase BB StdDev to 2.5 or RSI Length to 50 for filtering.
- Lagging forecasts: Shorten History Length to 20; switch to 75th Percentile for forward bias.
- Missed near-hits: Enable Percentage tolerance at 0.3% to capture wicks without overcounting.
- Cluttered charts: Reduce Max Lookahead to 200; disable dashboard on lower TFs.
What this indicator is—and isn’t
This is a forecasting visualization layer for pivot-based analysis, highlighting statistical projections from historical patterns. It is not a standalone system—pair with price action, volume, and risk rules. Not predictive of all turns; focuses on OOB-derived extrema, ignoring volume or news impacts.
Disclaimer
The content provided, including all code and materials, is strictly for educational and informational purposes only. It is not intended as, and should not be interpreted as, financial advice, a recommendation to buy or sell any financial instrument, or an offer of any financial product or service. All strategies, tools, and examples discussed are provided for illustrative purposes to demonstrate coding techniques and the functionality of Pine Script within a trading context.
Any results from strategies or tools provided are hypothetical, and past performance is not indicative of future results. Trading and investing involve high risk, including the potential loss of principal, and may not be suitable for all individuals. Before making any trading decisions, please consult with a qualified financial professional to understand the risks involved.
By using this script, you acknowledge and agree that any trading decisions are made solely at your discretion and risk.
Do not use this indicator on Heikin-Ashi, Renko, Kagi, Point-and-Figure, or Range charts, as these chart types can produce unrealistic results for signal markers and alerts.
Best regards and happy trading
Chervolino

RSI Divergence Screener [Pineify]RSI Divergence Screener
Key Features
Multi-symbol and multi-timeframe support for advanced market screening.
Real-time detection and visualization of bullish and bearish RSI divergences.
Seamless integration with core technical indicators and custom divergences.
Highly customizable parameters for precise adaptation to personal trading strategies.
Comprehensive screener table for swift asset comparison and analysis.
How It Works
The RSI Divergence Screener leverages the power of Relative Strength Index (RSI) to systematically track momentum shifts across cryptocurrencies and their respective timeframes. By monitoring both fast and slow RSI calculations, the screener isolates divergence signals—key reversal points that often precede major price moves.
The indicator calculates two RSI values for each selected asset: one with a short lookback (Fast RSI) and another with a longer period (Slow RSI).
It runs a comparative algorithm to find divergences—whenever Fast RSI deviates significantly from Slow RSI, it flags the signal as bullish or bearish.
All detected divergences are dynamically presented in a table view, allowing traders to scan symbols and timeframes for optimal trading setups.
Trading Ideas and Insights
Spot early momentum reversals and preempt major price swings via divergence signals.
Combine multiple symbols and timeframes for cross-market trending opportunities.
Identify high-probability scalping and swing trading setups informed by RSI divergence logic.
Quickly compare crypto asset strength and trend exhaustion across short and long-term horizons.
How Multiple Indicators Work Together
This screener’s edge lies in its synergistic use of multi-setting RSI calculations and customizable input groups.
The dual-RSI approach (Fast vs. Slow) isolates subtle trend shifts missed by traditional single-period RSI.
Safe and reliable divergences arise only when the mathematical difference between Fast RSI and Slow RSI meets predefined thresholds, minimizing false positives.
Divergences are contextualized using tailored color codes and backgrounds, rendering insights immediately actionable.
You can expand analysis with additional moving average filters or overlays for further confirmation.
Unique Aspects
First-of-its-kind screener dedicated solely to RSI divergence, designed especially for crypto volatility.
Efficient screening of up to eight assets and multiple timeframes in one compact dashboard.
Intuitive iconography, color logic, and table layouts optimized for rapid decision-making.
Advanced input group design for fine-tuning indicator settings per symbol, timeframe, and source.
How to Use
Select up to eight cryptocurrency symbols to screen for divergence signals.
Assign individual timeframes and source prices for each asset to customize analysis.
Set Fast RSI and Slow RSI lengths according to your preferred strategy (e.g., scalping, swing, or trend following).
Review the screener table: colored cells highlight actionable bullish (green) and bearish (red) divergences.
Confirm trade setups with additional indicators or price action for robust risk management.
Customization
Symbols: Choose any crypto pair or ticker for dynamic divergence tracking.
Timeframes: Scan across 1m, 5m, 10m, 30m, and more for full market coverage.
RSI lengths: Configure Fast and Slow RSI periods based on volatility and trading style.
Visuals: Tailor table colors, fonts, and alert backgrounds per your preference.
Conclusion
The RSI Divergence Screener is a versatile, original TradingView indicator that empowers traders to scan, compare, and act on divergence signals with speed and precision. Its multi-symbol design, robust logic, and extensive customization options set a new standard for market screening tools. Integrate it into your crypto trading process to capture actionable opportunities ahead of the crowd and optimize your technical analysis workflow.

Keltner Channel Enhanced [DCAUT]█ Keltner Channel Enhanced
📊 ORIGINALITY & INNOVATION
The Keltner Channel Enhanced represents an important advancement over standard Keltner Channel implementations by introducing dual flexibility in moving average selection for both the middle band and ATR calculation. While traditional Keltner Channels typically use EMA for the middle band and RMA (Wilder's smoothing) for ATR, this enhanced version provides access to 25+ moving average algorithms for both components, enabling traders to fine-tune the indicator's behavior to match specific market characteristics and trading approaches.
Key Advancements:
Dual MA Algorithm Flexibility: Independent selection of moving average types for middle band (25+ options) and ATR smoothing (25+ options), allowing optimization of both trend identification and volatility measurement separately
Enhanced Trend Sensitivity: Ability to use faster algorithms (HMA, T3) for middle band while maintaining stable volatility measurement with traditional ATR smoothing, or vice versa for different trading strategies
Adaptive Volatility Measurement: Choice of ATR smoothing algorithm affects channel responsiveness to volatility changes, from highly reactive (SMA, EMA) to smoothly adaptive (RMA, TEMA)
Comprehensive Alert System: Five distinct alert conditions covering breakouts, trend changes, and volatility expansion, enabling automated monitoring without constant chart observation
Multi-Timeframe Compatibility: Works effectively across all timeframes from intraday scalping to long-term position trading, with independent optimization of trend and volatility components
This implementation addresses key limitations of standard Keltner Channels: fixed EMA/RMA combination may not suit all market conditions or trading styles. By decoupling the trend component from volatility measurement and allowing independent algorithm selection, traders can create highly customized configurations for specific instruments and market phases.
📐 MATHEMATICAL FOUNDATION
Keltner Channel Enhanced uses a three-component calculation system that combines a flexible moving average middle band with ATR-based (Average True Range) upper and lower channels, creating volatility-adjusted trend-following bands.
Core Calculation Process:
1. Middle Band (Basis) Calculation:
The basis line is calculated using the selected moving average algorithm applied to the price source over the specified period:
basis = ma(source, length, maType)
Supported algorithms include EMA (standard choice, trend-biased), SMA (balanced and symmetric), HMA (reduced lag), WMA, VWMA, TEMA, T3, KAMA, and 17+ others.
2. Average True Range (ATR) Calculation:
ATR measures market volatility by calculating the average of true ranges over the specified period:
trueRange = max(high - low, abs(high - close ), abs(low - close ))
atrValue = ma(trueRange, atrLength, atrMaType)
ATR smoothing algorithm significantly affects channel behavior, with options including RMA (standard, very smooth), SMA (moderate smoothness), EMA (fast adaptation), TEMA (smooth yet responsive), and others.
3. Channel Calculation:
Upper and lower channels are positioned at specified multiples of ATR from the basis:
upperChannel = basis + (multiplier × atrValue)
lowerChannel = basis - (multiplier × atrValue)
Standard multiplier is 2.0, providing channels that dynamically adjust width based on market volatility.
Keltner Channel vs. Bollinger Bands - Key Differences:
While both indicators create volatility-based channels, they use fundamentally different volatility measures:
Keltner Channel (ATR-based):
Uses Average True Range to measure actual price movement volatility
Incorporates gaps and limit moves through true range calculation
More stable in trending markets, less prone to extreme compression
Better reflects intraday volatility and trading range
Typically fewer band touches, making touches more significant
More suitable for trend-following strategies
Bollinger Bands (Standard Deviation-based):
Uses statistical standard deviation to measure price dispersion
Based on closing prices only, doesn't account for intraday range
Can compress significantly during consolidation (squeeze patterns)
More touches in ranging markets
Better suited for mean-reversion strategies
Provides statistical probability framework (95% within 2 standard deviations)
Algorithm Combination Effects:
The interaction between middle band MA type and ATR MA type creates different indicator characteristics:
Trend-Focused Configuration (Fast MA + Slow ATR): Middle band uses HMA/EMA/T3, ATR uses RMA/TEMA, quick trend changes with stable channel width, suitable for trend-following
Volatility-Focused Configuration (Slow MA + Fast ATR): Middle band uses SMA/WMA, ATR uses EMA/SMA, stable trend with dynamic channel width, suitable for volatility trading
Balanced Configuration (Standard EMA/RMA): Classic Keltner Channel behavior, time-tested combination, suitable for general-purpose trend following
Adaptive Configuration (KAMA + KAMA): Self-adjusting indicator responding to efficiency ratio, suitable for markets with varying trend strength and volatility regimes
📊 COMPREHENSIVE SIGNAL ANALYSIS
Keltner Channel Enhanced provides multiple signal categories optimized for trend-following and breakout strategies.
Channel Position Signals:
Upper Channel Interaction:
Price Touching Upper Channel: Strong bullish momentum, price moving more than typical volatility range suggests, potential continuation signal in established uptrends
Price Breaking Above Upper Channel: Exceptional strength, price exceeding normal volatility expectations, consider adding to long positions or tightening trailing stops
Price Riding Upper Channel: Sustained strong uptrend, characteristic of powerful bull moves, stay with trend and avoid premature profit-taking
Price Rejection at Upper Channel: Momentum exhaustion signal, consider profit-taking on longs or waiting for pullback to middle band for reentry
Lower Channel Interaction:
Price Touching Lower Channel: Strong bearish momentum, price moving more than typical volatility range suggests, potential continuation signal in established downtrends
Price Breaking Below Lower Channel: Exceptional weakness, price exceeding normal volatility expectations, consider adding to short positions or protecting against further downside
Price Riding Lower Channel: Sustained strong downtrend, characteristic of powerful bear moves, stay with trend and avoid premature covering
Price Rejection at Lower Channel: Momentum exhaustion signal, consider covering shorts or waiting for bounce to middle band for reentry
Middle Band (Basis) Signals:
Trend Direction Confirmation:
Price Above Basis: Bullish trend bias, middle band acts as dynamic support in uptrends, consider long positions or holding existing longs
Price Below Basis: Bearish trend bias, middle band acts as dynamic resistance in downtrends, consider short positions or avoiding longs
Price Crossing Above Basis: Potential trend change from bearish to bullish, early signal to establish long positions
Price Crossing Below Basis: Potential trend change from bullish to bearish, early signal to establish short positions or exit longs
Pullback Trading Strategy:
Uptrend Pullback: Price pulls back from upper channel to middle band, finds support, and resumes upward, ideal long entry point
Downtrend Bounce: Price bounces from lower channel to middle band, meets resistance, and resumes downward, ideal short entry point
Basis Test: Strong trends often show price respecting the middle band as support/resistance on pullbacks
Failed Test: Price breaking through middle band against trend direction signals potential reversal
Volatility-Based Signals:
Narrow Channels (Low Volatility):
Consolidation Phase: Channels contract during periods of reduced volatility and directionless price action
Breakout Preparation: Narrow channels often precede significant directional moves as volatility cycles
Trading Approach: Reduce position sizes, wait for breakout confirmation, avoid range-bound strategies within channels
Breakout Direction: Monitor for price breaking decisively outside channel range with expanding width
Wide Channels (High Volatility):
Trending Phase: Channels expand during strong directional moves and increased volatility
Momentum Confirmation: Wide channels confirm genuine trend with substantial volatility backing
Trading Approach: Trend-following strategies excel, wider stops necessary, mean-reversion strategies risky
Exhaustion Signs: Extreme channel width (historical highs) may signal approaching consolidation or reversal
Advanced Pattern Recognition:
Channel Walking Pattern:
Upper Channel Walk: Price consistently touches or exceeds upper channel while staying above basis, very strong uptrend signal, hold longs aggressively
Lower Channel Walk: Price consistently touches or exceeds lower channel while staying below basis, very strong downtrend signal, hold shorts aggressively
Basis Support/Resistance: During channel walks, price typically uses middle band as support/resistance on minor pullbacks
Pattern Break: Price crossing basis during channel walk signals potential trend exhaustion
Squeeze and Release Pattern:
Squeeze Phase: Channels narrow significantly, price consolidates near middle band, volatility contracts
Direction Clues: Watch for price positioning relative to basis during squeeze (above = bullish bias, below = bearish bias)
Release Trigger: Price breaking outside narrow channel range with expanding width confirms breakout
Follow-Through: Measure squeeze height and project from breakout point for initial profit targets
Channel Expansion Pattern:
Breakout Confirmation: Rapid channel widening confirms volatility increase and genuine trend establishment
Entry Timing: Enter positions early in expansion phase before trend becomes overextended
Risk Management: Use channel width to size stops appropriately, wider channels require wider stops
Basis Bounce Pattern:
Clean Bounce: Price touches middle band and immediately reverses, confirms trend strength and entry opportunity
Multiple Bounces: Repeated basis bounces indicate strong, sustainable trend
Bounce Failure: Price penetrating basis signals weakening trend and potential reversal
Divergence Analysis:
Price/Channel Divergence: Price makes new high/low while staying within channel (not reaching outer band), suggests momentum weakening
Width/Price Divergence: Price breaks to new extremes but channel width contracts, suggests move lacks conviction
Reversal Signal: Divergences often precede trend reversals or significant consolidation periods
Multi-Timeframe Analysis:
Keltner Channels work particularly well in multi-timeframe trend-following approaches:
Three-Timeframe Alignment:
Higher Timeframe (Weekly/Daily): Identify major trend direction, note price position relative to basis and channels
Intermediate Timeframe (Daily/4H): Identify pullback opportunities within higher timeframe trend
Lower Timeframe (4H/1H): Time precise entries when price touches middle band or lower channel (in uptrends) with rejection
Optimal Entry Conditions:
Best Long Entries: Higher timeframe in uptrend (price above basis), intermediate timeframe pulls back to basis, lower timeframe shows rejection at middle band or lower channel
Best Short Entries: Higher timeframe in downtrend (price below basis), intermediate timeframe bounces to basis, lower timeframe shows rejection at middle band or upper channel
Risk Management: Use higher timeframe channel width to set position sizing, stops below/above higher timeframe channels
🎯 STRATEGIC APPLICATIONS
Keltner Channel Enhanced excels in trend-following and breakout strategies across different market conditions.
Trend Following Strategy:
Setup Requirements:
Identify established trend with price consistently on one side of basis line
Wait for pullback to middle band (basis) or brief penetration through it
Confirm trend resumption with price rejection at basis and move back toward outer channel
Enter in trend direction with stop beyond basis line
Entry Rules:
Uptrend Entry:
Price pulls back from upper channel to middle band, shows support at basis (bullish candlestick, momentum divergence)
Enter long on rejection/bounce from basis with stop 1-2 ATR below basis
Aggressive: Enter on first touch; Conservative: Wait for confirmation candle
Downtrend Entry:
Price bounces from lower channel to middle band, shows resistance at basis (bearish candlestick, momentum divergence)
Enter short on rejection/reversal from basis with stop 1-2 ATR above basis
Aggressive: Enter on first touch; Conservative: Wait for confirmation candle
Trend Management:
Trailing Stop: Use basis line as dynamic trailing stop, exit if price closes beyond basis against position
Profit Taking: Take partial profits at opposite channel, move stops to basis
Position Additions: Add to winners on subsequent basis bounces if trend intact
Breakout Strategy:
Setup Requirements:
Identify consolidation period with contracting channel width
Monitor price action near middle band with reduced volatility
Wait for decisive breakout beyond channel range with expanding width
Enter in breakout direction after confirmation
Breakout Confirmation:
Price breaks clearly outside channel (upper for longs, lower for shorts), channel width begins expanding from contracted state
Volume increases significantly on breakout (if using volume analysis)
Price sustains outside channel for multiple bars without immediate reversal
Entry Approaches:
Aggressive: Enter on initial break with stop at opposite channel or basis, use smaller position size
Conservative: Wait for pullback to broken channel level, enter on rejection and resumption, tighter stop
Volatility-Based Position Sizing:
Adjust position sizing based on channel width (ATR-based volatility):
Wide Channels (High ATR): Reduce position size as stops must be wider, calculate position size using ATR-based risk calculation: Risk / (Stop Distance in ATR × ATR Value)
Narrow Channels (Low ATR): Increase position size as stops can be tighter, be cautious of impending volatility expansion
ATR-Based Risk Management: Use ATR-based risk calculations, position size = 0.01 × Capital / (2 × ATR), use multiples of ATR (1-2 ATR) for adaptive stops
Algorithm Selection Guidelines:
Different market conditions benefit from different algorithm combinations:
Strong Trending Markets: Middle band use EMA or HMA, ATR use RMA, capture trends quickly while maintaining stable channel width
Choppy/Ranging Markets: Middle band use SMA or WMA, ATR use SMA or WMA, avoid false trend signals while identifying genuine reversals
Volatile Markets: Middle band and ATR both use KAMA or FRAMA, self-adjusting to changing market conditions reduces manual optimization
Breakout Trading: Middle band use SMA, ATR use EMA or SMA, stable trend with dynamic channels highlights volatility expansion early
Scalping/Day Trading: Middle band use HMA or T3, ATR use EMA or TEMA, both components respond quickly
Position Trading: Middle band use EMA/TEMA/T3, ATR use RMA or TEMA, filter out noise for long-term trend-following
📋 DETAILED PARAMETER CONFIGURATION
Understanding and optimizing parameters is essential for adapting Keltner Channel Enhanced to specific trading approaches.
Source Parameter:
Close (Most Common): Uses closing price, reflects daily settlement, best for end-of-day analysis and position trading, standard choice
HL2 (Median Price): Smooths out closing bias, better represents full daily range in volatile markets, good for swing trading
HLC3 (Typical Price): Gives more weight to close while including full range, popular for intraday applications, slightly more responsive than HL2
OHLC4 (Average Price): Most comprehensive price representation, smoothest option, good for gap-prone markets or highly volatile instruments
Length Parameter:
Controls the lookback period for middle band (basis) calculation:
Short Periods (10-15): Very responsive to price changes, suitable for day trading and scalping, higher false signal rate
Standard Period (20 - Default): Represents approximately one month of trading, good balance between responsiveness and stability, suitable for swing and position trading
Medium Periods (30-50): Smoother trend identification, fewer false signals, better for position trading and longer holding periods
Long Periods (50+): Very smooth, identifies major trends only, minimal false signals but significant lag, suitable for long-term investment
Optimization by Timeframe: 1-15 minute charts use 10-20 period, 30-60 minute charts use 20-30 period, 4-hour to daily charts use 20-40 period, weekly charts use 20-30 weeks.
ATR Length Parameter:
Controls the lookback period for Average True Range calculation, affecting channel width:
Short ATR Periods (5-10): Very responsive to recent volatility changes, standard is 10 (Keltner's original specification), may be too reactive in whipsaw conditions
Standard ATR Period (10 - Default): Chester Keltner's original specification, good balance between responsiveness and stability, most widely used
Medium ATR Periods (14-20): Smoother channel width, ATR 14 aligns with Wilder's original ATR specification, good for position trading
Long ATR Periods (20+): Very smooth channel width, suitable for long-term trend-following
Length vs. ATR Length Relationship: Equal values (20/20) provide balanced responsiveness, longer ATR (20/14) gives more stable channel width, shorter ATR (20/10) is standard configuration, much shorter ATR (20/5) creates very dynamic channels.
Multiplier Parameter:
Controls channel width by setting ATR multiples:
Lower Values (1.0-1.5): Tighter channels with frequent price touches, more trading signals, higher false signal rate, better for range-bound and mean-reversion strategies
Standard Value (2.0 - Default): Chester Keltner's recommended setting, good balance between signal frequency and reliability, suitable for both trending and ranging strategies
Higher Values (2.5-3.0): Wider channels with less frequent touches, fewer but potentially higher-quality signals, better for strong trending markets
Market-Specific Optimization: High volatility markets (crypto, small-caps) use 2.5-3.0 multiplier, medium volatility markets (major forex, large-caps) use 2.0 multiplier, low volatility markets (bonds, utilities) use 1.5-2.0 multiplier.
MA Type Parameter (Middle Band):
Critical selection that determines trend identification characteristics:
EMA (Exponential Moving Average - Default): Standard Keltner Channel choice, Chester Keltner's original specification, emphasizes recent prices, faster response to trend changes, suitable for all timeframes
SMA (Simple Moving Average): Equal weighting of all data points, no directional bias, slower than EMA, better for ranging markets and mean-reversion
HMA (Hull Moving Average): Minimal lag with smooth output, excellent for fast trend identification, best for day trading and scalping
TEMA (Triple Exponential Moving Average): Advanced smoothing with reduced lag, responsive to trends while filtering noise, suitable for volatile markets
T3 (Tillson T3): Very smooth with minimal lag, excellent for established trend identification, suitable for position trading
KAMA (Kaufman Adaptive Moving Average): Automatically adjusts speed based on market efficiency, slow in ranging markets, fast in trends, suitable for markets with varying conditions
ATR MA Type Parameter:
Determines how Average True Range is smoothed, affecting channel width stability:
RMA (Wilder's Smoothing - Default): J. Welles Wilder's original ATR smoothing method, very smooth, slow to adapt to volatility changes, provides stable channel width
SMA (Simple Moving Average): Equal weighting, moderate smoothness, faster response to volatility changes than RMA, more dynamic channel width
EMA (Exponential Moving Average): Emphasizes recent volatility, quick adaptation to new volatility regimes, very responsive channel width changes
TEMA (Triple Exponential Moving Average): Smooth yet responsive, good balance for varying volatility, suitable for most trading styles
Parameter Combination Strategies:
Conservative Trend-Following: Length 30/ATR Length 20/Multiplier 2.5, MA Type EMA or TEMA/ATR MA Type RMA, smooth trend with stable wide channels, suitable for position trading
Standard Balanced Approach: Length 20/ATR Length 10/Multiplier 2.0, MA Type EMA/ATR MA Type RMA, classic Keltner Channel configuration, suitable for general purpose swing trading
Aggressive Day Trading: Length 10-15/ATR Length 5-7/Multiplier 1.5-2.0, MA Type HMA or EMA/ATR MA Type EMA or SMA, fast trend with dynamic channels, suitable for scalping and day trading
Breakout Specialist: Length 20-30/ATR Length 5-10/Multiplier 2.0, MA Type SMA or WMA/ATR MA Type EMA or SMA, stable trend with responsive channel width
Adaptive All-Conditions: Length 20/ATR Length 10/Multiplier 2.0, MA Type KAMA or FRAMA/ATR MA Type KAMA or TEMA, self-adjusting to market conditions
Offset Parameter:
Controls horizontal positioning of channels on chart. Positive values shift channels to the right (future) for visual projection, negative values shift left (past) for historical analysis, zero (default) aligns with current price bars for real-time signal analysis. Offset affects only visual display, not alert conditions or actual calculations.
📈 PERFORMANCE ANALYSIS & COMPETITIVE ADVANTAGES
Keltner Channel Enhanced provides improvements over standard implementations while maintaining proven effectiveness.
Response Characteristics:
Standard EMA/RMA Configuration: Moderate trend lag (approximately 0.4 × length periods), smooth and stable channel width from RMA smoothing, good balance for most market conditions
Fast HMA/EMA Configuration: Approximately 60% reduction in trend lag compared to EMA, responsive channel width from EMA ATR smoothing, suitable for quick trend changes and breakouts
Adaptive KAMA/KAMA Configuration: Variable lag based on market efficiency, automatic adjustment to trending vs. ranging conditions, self-optimizing behavior reduces manual intervention
Comparison with Traditional Keltner Channels:
Enhanced Version Advantages:
Dual Algorithm Flexibility: Independent MA selection for trend and volatility vs. fixed EMA/RMA, separate tuning of trend responsiveness and channel stability
Market Adaptation: Choose configurations optimized for specific instruments and conditions, customize for scalping, swing, or position trading preferences
Comprehensive Alerts: Enhanced alert system including channel expansion detection
Traditional Version Advantages:
Simplicity: Fewer parameters, easier to understand and implement
Standardization: Fixed EMA/RMA combination ensures consistency across users
Research Base: Decades of backtesting and research on standard configuration
When to Use Enhanced Version: Trading multiple instruments with different characteristics, switching between trending and ranging markets, employing different strategies, algorithm-based trading systems requiring customization, seeking optimization for specific trading style and timeframe.
When to Use Standard Version: Beginning traders learning Keltner Channel concepts, following published research or trading systems, preferring simplicity and standardization, wanting to avoid optimization and curve-fitting risks.
Performance Across Market Conditions:
Strong Trending Markets: EMA or HMA basis with RMA or TEMA ATR smoothing provides quicker trend identification, pullbacks to basis offer excellent entry opportunities
Choppy/Ranging Markets: SMA or WMA basis with RMA ATR smoothing and lower multipliers, channel bounce strategies work well, avoid false breakouts
Volatile Markets: KAMA or FRAMA with EMA or TEMA, adaptive algorithms excel by automatic adjustment, wider multipliers (2.5-3.0) accommodate large price swings
Low Volatility/Consolidation: Channels narrow significantly indicating consolidation, algorithm choice less impactful, focus on detecting channel width contraction for breakout preparation
Keltner Channel vs. Bollinger Bands - Usage Comparison:
Favor Keltner Channels When: Trend-following is primary strategy, trading volatile instruments with gaps, want ATR-based volatility measurement, prefer fewer higher-quality channel touches, seeking stable channel width during trends.
Favor Bollinger Bands When: Mean-reversion is primary strategy, trading instruments with limited gaps, want statistical framework based on standard deviation, need squeeze patterns for breakout identification, prefer more frequent trading opportunities.
Use Both Together: Bollinger Band squeeze + Keltner Channel breakout is powerful combination, price outside Bollinger Bands but inside Keltner Channels indicates moderate signal, price outside both indicates very strong signal, Bollinger Bands for entries and Keltner Channels for trend confirmation.
Limitations and Considerations:
General Limitations:
Lagging Indicator: All moving averages lag price, even with reduced-lag algorithms
Trend-Dependent: Works best in trending markets, less effective in choppy conditions
No Direction Prediction: Indicates volatility and deviation, not future direction, requires confirmation
Enhanced Version Specific Considerations:
Optimization Risk: More parameters increase risk of curve-fitting historical data
Complexity: Additional choices may overwhelm beginning traders
Backtesting Challenges: Different algorithms produce different historical results
Mitigation Strategies:
Use Confirmation: Combine with momentum indicators (RSI, MACD), volume, or price action
Test Parameter Robustness: Ensure parameters work across range of values, not just optimized ones
Multi-Timeframe Analysis: Confirm signals across different timeframes
Proper Risk Management: Use appropriate position sizing and stops
Start Simple: Begin with standard EMA/RMA before exploring alternatives
Optimal Usage Recommendations:
For Maximum Effectiveness:
Start with standard EMA/RMA configuration to understand classic behavior
Experiment with alternatives on demo account or paper trading
Match algorithm combination to market condition and trading style
Use channel width analysis to identify market phases
Combine with complementary indicators for confirmation
Implement strict risk management using ATR-based position sizing
Focus on high-quality setups rather than trading every signal
Respect the trend: trade with basis direction for higher probability
Complementary Indicators:
RSI or Stochastic: Confirm momentum at channel extremes
MACD: Confirm trend direction and momentum shifts
Volume: Validate breakouts and trend strength
ADX: Measure trend strength, avoid Keltner signals in weak trends
Support/Resistance: Combine with traditional levels for high-probability setups
Bollinger Bands: Use together for enhanced breakout and volatility analysis
USAGE NOTES
This indicator is designed for technical analysis and educational purposes. Keltner Channel Enhanced has limitations and should not be used as the sole basis for trading decisions. While the flexible moving average selection for both trend and volatility components provides valuable adaptability across different market conditions, algorithm performance varies with market conditions, and past characteristics do not guarantee future results.
Key considerations:
Always use multiple forms of analysis and confirmation before entering trades
Backtest any parameter combination thoroughly before live trading
Be aware that optimization can lead to curve-fitting if not done carefully
Start with standard EMA/RMA settings and adjust only when specific conditions warrant
Understand that no moving average algorithm can eliminate lag entirely
Consider market regime (trending, ranging, volatile) when selecting parameters
Use ATR-based position sizing and risk management on every trade
Keltner Channels work best in trending markets, less effective in choppy conditions
Respect the trend direction indicated by price position relative to basis line
The enhanced flexibility of dual algorithm selection provides powerful tools for adaptation but requires responsible use, thorough understanding of how different algorithms behave under various market conditions, and disciplined risk management.

Digital RPM HUD — 4 Feeds + Confidence + Timeline (v3)🏎️ Digital RPM HUD — 4 Feeds + Confidence + Timeline (v3)
A performance-style trading dashboard for momentum-driven traders.
The Digital RPM HUD gives you an instant visual readout of market “engine speed” — combining four customizable data feeds (Trend, Momentum, Volume, Volatility) into a single confidence score (0–100) and a color-coded timeline of regime changes.
Think of it as a racing-inspired control panel: you only “hit the throttle” when confidence is high and all systems agree.
🔧 Key Features
4 Data Feeds – assign your own logic (EMA, RSI, RVOL, ATR, etc.).
Confidence Meter – blends the four feeds into one smooth 0–100 reading.
Timeline Strip – shows recent bullish / bearish / neutral states at a glance.
Visual Trade Cues – optional on-chart LONG / SHORT / EXIT markers.
Fully Customizable – thresholds, weights, smoothing, colors, layout.
HUD Overlay – clean, minimal, and adjustable to any corner of your chart.
💡 How to Use
Configure each feed to reflect your preferred signals (e.g., trend EMA 200, momentum RSI 14, volume RVOL 20, volatility ATR 14).
Watch the Confidence gauge:
✅ Above Bull Threshold → Market acceleration / long bias.
❌ Below Bear Threshold → Momentum loss / short bias.
⚪ Between thresholds → Neutral zone; stay patient.
Use the Timeline to confirm trend consistency — more green = bullish regime, more red = bearish.
⚙️ Recommended Setups
Scalping: Trend EMA 50 + RSI 7 + RVOL 10 + ATR 7 → Fast response.
Intraday: EMA 200 + RSI 14 + RVOL 20 + ATR 14 → Balanced signal.
Swing: Multi-TF Trend + MACD + RVOL + ATR → Smooth and steady.
⚠️ Disclaimer
This script is not a trading strategy and does not execute trades.
All signals are visual aids — always confirm with your own analysis and risk management.

EMA 9, 21 & 50 Indicator with Floating Labels🟢 EMA 9, 21 & 50 Indicator with Floating Labels
📘 Overview
This indicator plots three exponential moving averages (EMAs) to visualize short-, medium-, and longer-term trend structure on any timeframe:
EMA 9 – Bright Green (short-term momentum)
EMA 21 – Bright Yellow (medium-term trend)
EMA 50 – Red (broader trend confirmation)
Each EMA has a floating label on the right edge of the chart, so line identities remain visible as new candles form.
🪶 Features
Clear, fixed colors for easy recognition (Green 9 / Yellow 21 / Red 50)
Floating labels that stay visible off the right edge
Clean overlay compatible with any chart style
Lightweight and fast to render
📈 How to Use
Trend Filter:
Price above 21 & 50 → bullish bias; look for long setups or pullbacks toward the 9/21.
Price below 21 & 50 → bearish bias; look for short setups or rallies into 9/21.
Momentum vs. Structure:
9 EMA = momentum guide for quick swings.
21 EMA = primary trend line for swing entries/exits.
50 EMA = confirmation of broader direction.
🔧 Tips
Analyze trend on Daily or 4H; fine-tune entries on 1H/15m near the 9 or 21 EMA.
Pair with volume or RSI/MACD for extra confirmation at EMA touches/crosses.

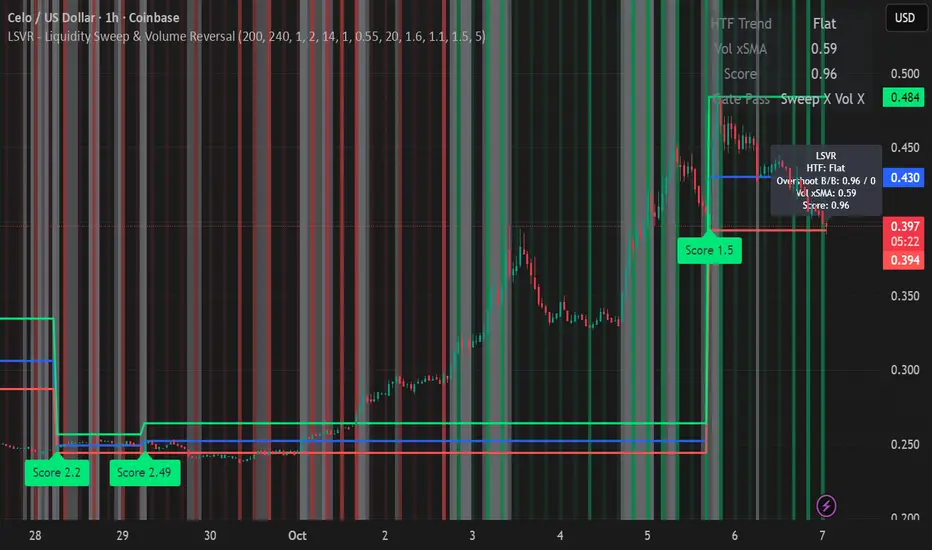
LSVR - Liquidity Sweep & Volume ReversalLSVR condenses a pro workflow into one visual overlay: Higher-Timeframe (HTF) Trend → Liquidity Sweep & Reclaim → Volume Confirmation. A signal only prints when all three gates align at bar close, and the chart shows everything you need—trend context, the sweep “trap” candle, and a projected Entry/SL/TP based on your chosen R multiple.
How it works
HTF Trend Filter: Projects a smoothed KAMA/EMA from a higher timeframe to the chart using a safe, lookahead-off request. Long signals are considered only above the HTF line; shorts only below.
Liquidity Sweep & Reclaim: Finds confirmed swing highs/lows, then detects an ATR-scaled overshoot through that swing followed by a reclaim (close back inside a configurable % of the bar range).
Volume Confirmation: Requires either a volume spike over Volume SMA × multiplier or optional OBV divergence. No participation = no signal.
Score: Each setup is scored: trend (0/1) + overshoot strength (0..1.5) + conviction (0/1). Signals fire only when the score ≥ Min Signal Score.
What you see
HTF Ribbon (subtle green/red backdrop) for bias.
Sweep Box on the signal candle (green = long, red = short).
Signal markers (“L” / “S”) with a small score label.
Projected lines that persist until the next signal: Entry (close), Stop (beyond swept swing), Target (R multiple).
Heatmap that intensifies when the score crosses your threshold.
Dashboard (top-right): HTF direction, Volume×SMA, current Score, gate pass status.
Tooltip on the last bar with quick stats.
Quick start
Apply to any liquid symbol and set HTF to ~3–6× your chart timeframe (e.g., 15m chart → 1H–4H).
Trade with the HTF trend: take L signals above the HTF line and S signals below it.
Entry = signal bar close, SL = beyond the swept swing, TP = your Projected Take-Profit (R).
Tighten or loosen selectivity with Min Signal Score, Reclaim %, Overshoot (ATR×), and Cooldown.
Recommended presets
Choppy/crypto 15m: minScore 1.25, reclaimPct 0.60–0.65, overshootATR 1.0–1.2, useOBVDiv=false, cooldown 8.
FX 5m / session trend: minScore 1.0–1.1, reclaimPct 0.50–0.55, overshootATR 0.8–1.0, useOBVDiv=true, cooldown 5.
Indices 1m (RTH): minScore 1.2, reclaimPct 0.55–0.60, useOBVDiv=false, cooldown 10.
Non-repainting by design
HTF values use lookahead_off with realtime offset.
Swings are confirmed pivots (no “forming” pivots).
Signals print at bar close only.
Notes
OBV divergence can add sensitivity on liquid markets; keep it off for stricter filtering.
Use Cooldown to avoid clustered sweeps.
This is an overlay/analysis tool, not financial advice. Test settings in Replay/Paper Trading before using live.
Key-Levels - D/W/M High-Low + Fib + MA🧭 Key-Levels – D/W/M High-Low + Fibonacci + Moving Averages
A complete multi-timeframe analysis toolkit that combines Daily, Weekly, and Monthly high/low levels, Fibonacci retracements, and customizable moving averages — all in one clean, efficient display.
Ideal for traders who want to identify key reaction zones, retracement levels, and trend alignment across multiple timeframes.
🔹 Features
1. Prior High/Low Levels
Plots Daily (PDH/PDL), Weekly (PWH/PWL), and Monthly (PMH/PML) key levels
Adjustable colors, styles (Solid / Dashed / Dotted), and line widths
Optional midline display for each timeframe
Displays live labels with price values and % difference from current close
Extend lines rightward to project future price interactions
2. Fibonacci Retracement
Auto-detects swing highs/lows using configurable pivot lengths
Smart pivot logic prioritizes major swings based on % span
Auto-orients retracements depending on trend direction
Customizable visibility and color for each Fibonacci level
Supports 0.236 → 1.618 levels, with optional auto-extension in uptrend scenarios
Displays ratio + price for each level label
3. Pivot Labels
Optionally show pivot high/low labels with customizable text and background colors
Independent control of left/right length and label style
4. Moving Averages
Up to three customizable MAs (default: 8 EMA, 21 EMA, 50 SMA)
Choose between EMA or SMA for each
Toggle individual or all moving averages
Adjustable lengths, colors, and line widths
5. Alerts
Built-in alert condition for price crossing a user-defined level
Clean alert message format with ticker symbol and live price
⚙️ Customization
Flexible style controls for lines, labels, and colors
Adjustable right-extension length for projecting levels
Font size and visibility toggles for all elements
Smart grouping for intuitive settings management
📈 Ideal For
Identifying key reversal or breakout zones
Spotting Fibonacci confluence between retracements and prior highs/lows
Tracking trend structure via multi-timeframe MAs
Swing traders, intraday traders, and technical analysts
💡 Summary
Key-Levels – D/W/M High-Low + Fib + MA is a professional-grade indicator designed to simplify complex multi-timeframe analysis.
It helps you see the bigger picture, find actionable zones, and trade with confidence.
🧩 Compatible with any market and timeframe.

Twisted Forex's Doji + Area StrategyTitle
Twisted Forex’s Doji + Area Strategy
Description
What this strategy does
This strategy looks for doji candles forming inside or near supply/demand areas . Areas are built from swing pivots and sized with ATR, then tracked for retests (“confirmations”). When a doji prints close to an area and quality checks pass, the strategy places a trade with the stop beyond the doji and a configurable R:R target.
How areas (zones) are built
• Swings are detected with a user-set pivot length.
• Each swing spawns a horizontal area centered at the pivot price with half-height = zoneHalfATR × ATR .
• Duplicates are de-duplicated by center distance (ATR-scaled).
• Areas fade when broken beyond a buffer or after an optional age (expiry).
• Retests are recorded when price touches and then bounces away from the area; repeated reactions increase the zone’s “strength”.
Signal logic (summary)
Doji detection: strict or loose body criteria with optional minimum wick fractions and ATR-scaled minimum range.
Proximity: price must be inside/near a supply or demand area (proxATR × ATR).
Side resolution: overlap is resolved by (a) which side price penetrates more, (b) fast/slow EMA trend, or (c) nearest distance. Optional “previous candle flip” can bias long after a bearish candle and short after a bullish one.
Optional 1-bar confirmation: the bar after the doji must close away from the area by confirmATR × ATR .
Quality filter (Off/Soft/Strict): four checks—(i) wick rejection past the edge, (ii) doji closes in an edge “band” of the area, (iii) fresh touch (cooldown), (iv) approach impulse over a short lookback. In Strict , thresholds auto-tighten.
Orders & exits
• Long: stop below doji low minus buffer; Short: above doji high plus buffer.
• Target = rrMultiple × risk distance .
• Pyramiding is off by default.
Position sizing
You can size from the script or from Strategy Properties:
• Script-driven (default): set Position sizing = “Risk % of equity” and choose riskPercent (e.g., 1.0%). The script applies safe floors/rounding (FX micro-lots by default) so quantity never rounds to zero.
• Properties-driven : toggle Use TV Properties → Order size ON, then pick “Percent of equity” in Properties (e.g., 1%). The header includes safe defaults so trades still place.
Key inputs to explore
• Zone building : pivotLen, zoneHalfATR, minDepartureATR, expiryBars, breakATR, leftBars, dedupeATR.
• Doji & proximity : strictDoji, dojiBodyFrac, minWickFrac, minRangeATR, proxATR, minBarsBetween.
• Overlap resolution : usePenetration, useTrend (EMA 21/55), “previous candle flip”, needNextBarConf & confirmATR.
• Quality : qualityMode (Off/Soft/Strict), minQualPass/kStrict, wickPenATR, edgeBandFrac, approachLookback, approachMinATR, freshTouchBars.
• Zone strength gating : minStrengthSoft / minStrengthStrict.
• HTF confluence (optional) : useHTFTrend (HTF EMA 34/89) and/or useHTFZoneProx (HTF swing bands).
Tips to make it cleaner / higher quality
• Turn needNextBarConf ON and use confirmATR = 0.10–0.15 .
• Increase approachMinATR (e.g., 0.35–0.45) to require a stronger pre-touch impulse.
• Raise minStrengthSoft/Strict (e.g., 4–6) so only well-reacted zones can signal.
• Use signalsOnlyConfirmed ON if you prefer trades only from zones with retests (the script falls back gracefully when none exist yet).
• Nudge proxATR to 0.5–0.6 to demand tighter proximity to the level.
• Optional: enable useHTFTrend to filter counter-trend setups.
Default settings used in this publication
• Initial capital: 100,000 (illustrative).
• Slippage: 1 tick; Commission: 0% (you can raise commission if you prefer—spread is partly modeled by slippage).
• Sizing: Risk % of equity via inputs; riskPercent = 1.0% ; FX uses micro-lot floors by default.
• Quality: Off by default (Soft/Strict available).
• HTF trend gate: Off by default.
Backtesting notes
For a meaningful sample size, test on liquid symbols/timeframes that yield 100+ trades (e.g., majors on 5–15m over 1–2 years). Backtests are modelled and broker costs/spread vary—validate on your feed and forward-test.
How to read the chart
Shaded bands are supply (above) and demand (below). Brighter bands are the nearest K per side (visual aid). BUY/SELL labels mark entries; colored dots show entry/SL/TP levels. You can hide zones or unconfirmed zones for a cleaner view.
Disclaimer
This is educational material, not financial advice. Trading involves risk. Always test and size responsibly.

Mystic Pulse V2.0 [CHE] Mystic Pulse V2.0 — Adaptive DI streaks with gradient intensity for clearer trend persistence
Summary
Mystic Pulse V2.0 measures directional persistence by counting how often the positive or negative directional index strengthens and dominates. These counts drive gradient colors for bars, wicks, and helper plots, so intensity reflects local momentum rather than absolute values. A windowed normalization and gamma control adapt the visuals to recent conditions, preventing one regime from overpowering the next. The result is an immediate, at-a-glance read of trend direction and stamina without relying on crossovers alone.
Motivation: Why this design?
Classical DI and ADX signals can flip during choppy phases or feel sluggish in calm regimes. This script focuses on persistence: it increments a positive or negative streak only when the corresponding directional pressure both strengthens compared with the prior bar and dominates the other side. Simple OHLC pre-smoothing reduces micro-noise, and local normalization keeps the scale relevant to the last segment of data, not a distant past.
What’s different vs. standard approaches?
Reference baseline: Traditional DI and ADX lines with crossovers and fixed-scale thresholds.
Architecture differences:
Wilder-style recursive smoothing on true range and directional movement.
Streak counters for positive and negative pressure that advance only on strengthening and dominance.
Windowed normalization and gamma shaping for visual intensity.
Wick coloring via `plotcandle` with forced overlay from a pane indicator.
Practical effect: Bars and wicks grow more vivid during sustained pressure and fade during indecision. The column plots show streak depth directly, which helps filter one-bar flips.
How it works (technical)
1. Pre-smoothing: Open, high, low, and close are averaged over a short simple moving window to dampen micro-ticks.
2. Directional inputs: True range and directional movement are formed from the smoothed prices, then recursively smoothed using a Wilder-style update that carries prior state forward.
3. DI comparison: The script derives positive and negative directional ratios relative to smoothed range. A side advances its streak when it increases compared with the previous bar and exceeds the opposite side. The other streak resets.
4. Trend score and color base: The difference between positive and negative streaks defines the active side.
5. Normalization and gamma: The absolute streak magnitude and each side’s streak are normalized within a rolling window. Gamma parameters reshape intensity so mid-range values are either compressed or emphasized.
6. Rendering:
Two column plots show positive and negative streak counts in the pane with gradient colors.
A square marker at the bottom uses the global gradient as a compact heat cue.
Bar colors on the main chart use either the gradient, neutral trend colors, or no paint depending on toggles.
Wick, border, and candle overlays are colored via `plotcandle` with forced overlay.
7. State handling: Smoothed values and counters persist across bars; initialization uses first available values without lookahead. No higher-timeframe requests are used, so repaint risk is limited to normal live-bar evolution.
Parameter Guide
Show neutral candles (fallback) — Paints main-chart bars in plain up or down colors when gradients are disabled — Default false — Use when you prefer simple up/down coloring.
Show last N shapes — Limits bottom square markers — Default 333 — Reduce if your chart gets cluttered.
ADX smoothing length — Controls the Wilder smoothing window for range and directional movement — Default 9 — Larger values increase stability but respond later.
OHLC SMA length — Pre-smoothing for inputs — Default 1 — Increase slightly on noisy assets to reduce flip risk.
Gradient barcolor — Enables gradient bar paint on the main chart — Default true — Turn off to use wicks only or neutral bars.
Wick coloring — Colors wicks, borders, and bodies via overlay — Default true — Disable if it conflicts with other overlays.
Gradient window — Lookback for local normalization — Default 100 — Shorter windows adapt faster; longer windows provide steadier intensity.
Gradient transparency — Overall transparency for gradient paints — Default 0 — Increase to make gradients subtler.
Gamma bars/shapes — Contrast for bar and shape intensity — Default 0.70 — Lower values brighten mid-tones; higher values compress them.
Gamma plots — Contrast for the column plots — Default 0.80 — Tune separately from bar intensity.
Wick transparency — Transparency for wick coloring — Default 0 — Raise to let price action show through.
Up/Down colors (dark and neon) — Base and accent colors for both directions — Defaults as provided — Adjust to match your chart theme.
Reading & Interpretation
Pane columns: The green column represents the positive streak count; the red column represents the negative streak count. Taller columns signal stronger persistence.
Gradient marker: The bottom square indicates the active side and persistence strength at a glance.
Main-chart bars and wicks: Color direction shows the dominant side; intensity reflects the normalized and gamma-shaped streak magnitude. Faded tones suggest weak or fading pressure.
Practical Workflows & Combinations
Trend following: Enter in the direction of the active side when the corresponding column expands over several bars. Confirm with structure such as higher highs and higher lows or lower highs and lower lows.
Exits and stops: Consider scaling out when intensity fades toward mid-range while structure stalls. Tighten stops after extended streaks or when wicks lose intensity.
Multi-asset/Multi-TF: Use defaults for liquid assets on intraday to swing timeframes. For highly volatile instruments, raise smoothing and the normalization window. For calm markets, lower them to regain sensitivity.
Behavior, Constraints & Performance
Repaint/confirmation: Values update during the live bar and stabilize after bar close. No historical repaint beyond normal live-bar updates.
security()/HTF: Not used; cross-timeframe repaint paths do not apply.
Resources: Declared `max_bars_back` two thousand; no explicit loops or arrays; plot and label limits are generous.
Known limits: Streak counters can remain elevated during slow reversals. Very short normalization windows can cause rapid intensity swings. Gaps or extreme spikes may temporarily distort intensity until the window adapts.
Sensible Defaults & Quick Tuning
Start with: ADX smoothing nine, OHLC SMA one, normalization window one hundred, gradient and wick coloring enabled, gamma around zero point seven to zero point eight.
Too many flips: Increase ADX smoothing and the normalization window; consider a small bump in OHLC SMA.
Too sluggish: Decrease ADX smoothing and the normalization window.
Colors overpower chart: Increase gradient and wick transparency or raise gamma to compress mid-tones.
What this indicator is—and isn’t
This is a visualization and signal layer that represents directional persistence and intensity. It does not issue trade entries or exits on its own and is not predictive. Use it alongside market structure, volume, and risk controls.
Disclaimer
The content, including any code, is for educational and informational purposes only and does not constitute financial advice or a recommendation to buy or sell any instrument. Trading involves substantial risk, including the possible loss of principal. Past performance is not indicative of future results. Always do your own research and consider consulting a qualified professional.

EvoTrend-X Indicator — Evolutionary Trend Learner ExperimentalEvoTrend-X Indicator — Evolutionary Trend Learner
NOTE: This is an experimental Pine Script v6 port of a Python prototype. Pine wasn’t the original research language, so there may be small quirks—your feedback and bug reports are very welcome. The model is non-repainting, MTF-safe (lookahead_off + gaps_on), and features an adaptive (fitness-based) candidate selector, confidence gating, and a volatility filter.
⸻
What it is
EvoTrend-X is adaptive trend indicator that learns which moving-average length best fits the current market. It maintains a small “population” of fast EMA candidates, rewards those that align with price momentum, and continuously selects the best performer. Signals are gated by a multi-factor Confidence score (fitness, strength vs. ATR, MTF agreement) and a volatility filter (ATR%). You get a clean Fast/Slow pair (for the currently best candidate), optional HTF filter, a fitness ribbon for transparency, and a themed info panel with a one-glance STATUS readout.
Core outputs
• Selected Fast/Slow EMAs (auto-chosen from candidates via fitness learning)
• Spread cross (Fast – Slow) → visual BUY/SELL markers + alert hooks
• Confidence % (0–100): Fitness ⊕ Distance vs. ATR ⊕ MTF agreement
• Gates: Trend regime (Kaufman ER), Volatility (ATR%), MTF filter (optional)
• Candidate Fitness Ribbon: shows which lengths the learner currently prefers
• Export plot: hidden series “EvoTrend-X Export (spread)” for downstream use
⸻
Why it’s different
• Evolutionary learning (on-chart): Each candidate EMA length gets rewarded if its slope matches price change and penalized otherwise, with a gentle decay so the model forgets stale regimes. The best fitness wins the right to define the displayed Fast/Slow pair.
• Confidence gate: Signals don’t light up unless multiple conditions concur: learned fitness, spread strength vs. volatility, and (optionally) higher-timeframe trend.
• Volatility awareness: ATR% filter blocks low-energy environments that cause death-by-a-thousand-whipsaws. Your “why no signal?” answer is always visible in the STATUS.
• Preset discipline, Custom freedom: Presets set reasonable baselines for FX, equities, and crypto; Custom exposes all knobs and honors your inputs one-to-one.
• Non-repainting rigor: All MTF calls use lookahead_off + gaps_on. Decisions use confirmed bars. No forward refs. No conditional ta.* pitfalls.
⸻
Presets (and what they do)
• FX 1H (Conservative): Medium candidates, slightly higher MinConf, modest ATR% floor. Good for macro sessions and cleaner swings.
• FX 15m (Active): Shorter candidates, looser MinConf, higher ATR% floor. Designed for intraday velocity and decisive sessions.
• Equities 1D: Longer candidates, gentler volatility floor. Suits index/large-cap trend waves.
• Crypto 1H: Mid-short candidates, higher ATR% floor for 24/7 chop, stronger MinConf to avoid noise.
• Custom: Your inputs are used directly (no override). Ideal for systematic tuning or bespoke assets.
⸻
How the learning works (at a glance)
1. Candidates: A small set of fast EMA lengths (e.g., 8/12/16/20/26/34). Slow = Fast × multiplier (default ×2.0).
2. Reward/decay: If price change and the candidate’s Fast slope agree (both up or both down), its fitness increases; otherwise decreases. A decay constant slowly forgets the distant past.
3. Selection: The candidate with highest fitness defines the displayed Fast/Slow pair.
4. Signal engine: Crosses of the spread (Fast − Slow) across zero mark potential regime shifts. A Confidence score and gates decide whether to surface them.
⸻
Controls & what they mean
Learning / Regime
• Slow length = Fast ×: scales the Slow EMA relative to each Fast candidate. Larger multiplier = smoother regime detection, fewer whipsaws.
• ER length / threshold: Kaufman Efficiency Ratio; above threshold = “Trending” background.
• Learning step, Decay: Larger step reacts faster to new behavior; decay sets how quickly the past is forgotten.
Confidence / Volatility gate
• Min Confidence (%): Minimum score to show signals (and fire alerts). Raising it filters noise; lowering it increases frequency.
• ATR length: The ATR window for both the ATR% filter and strength normalization. Shorter = faster, but choppier.
• Min ATR% (percent): ATR as a percentage of price. If ATR% < Min ATR% → status shows BLOCK: low vola.
MTF Trend Filter
• Use HTF filter / Timeframe / Fast & Slow: HTF Fast>Slow for longs, Fast threshold; exit when spread flips or Confidence decays below your comfort zone.
2) FX index/majors, 15m (active intraday)
• Preset: FX 15m (Active).
• Gate: MinConf 60–70; Min ATR% 0.15–0.30.
• Flow: Focus on session opens (LDN/NY). The ribbon should heat up on shorter candidates before valid crosses appear—good early warning.
3) SPY / Index futures, 1D (positioning)
• Preset: Equities 1D.
• Gate: MinConf 55–65; Min ATR% 0.05–0.12.
• Flow: Use spread crosses as regime flags; add timing from price structure. For adds, wait for ER to remain trending across several bars.
4) BTCUSD, 1H (24/7)
• Preset: Crypto 1H.
• Gate: MinConf 70–80; Min ATR% 0.20–0.35.
• Flow: Crypto chops—volatility filter is your friend. When ribbon and HTF OK agree, favor continuation entries; otherwise stand down.
⸻
Reading the Info Panel (and fixing “no signals”)
The panel is your self-diagnostic:
• HTF OK? False means the higher-timeframe EMAs disagree with your intended side.
• Regime: If “Chop”, ER < threshold. Consider raising the threshold or waiting.
• Confidence: Heat-colored; if below MinConf, the gate blocks signals.
• ATR% vs. Min ATR%: If ATR% < Min ATR%, status shows BLOCK: low vola.
• STATUS (composite):
• BLOCK: low vola → increase Min ATR% down (i.e., allow lower vol) or wait for expansion.
• BLOCK: HTF filter → disable HTF or align with the HTF tide.
• BLOCK: confidence → lower MinConf slightly or wait for stronger alignment.
• OK → you’ll see markers on valid crosses.
⸻
Alerts
Two static alert hooks:
• BUY cross — spread crosses up and all gates (ER, Vol, MTF, Confidence) are open.
• SELL cross — mirror of the above.
Create them once from “Add Alert” → choose the condition by name.
⸻
Exporting to other scripts
In your other Pine indicators/strategies, add an input.source and select EvoTrend-X → “EvoTrend-X Export (spread)”. Common uses:
• Build a rule: only trade when exported spread > 0 (trend filter).
• Combine with your oscillator: oscillator oversold and spread > 0 → buy bias.
⸻
Best practices
• Let it learn: Keep Learning step moderate (0.4–0.6) and Decay close to 1.0 (e.g., 0.99–0.997) for smooth regime memory.
• Respect volatility: Tune Min ATR% by asset and timeframe. FX 1H ≈ 0.10–0.20; crypto 1H ≈ 0.20–0.35; equities 1D ≈ 0.05–0.12.
• MTF discipline: HTF filter removes lots of “almost” trades. If you prefer aggressive entries, turn it off and rely more on Confidence.
• Confidence as throttle:
• 40–60%: exploratory; expect more signals.
• 60–75%: balanced; good daily driver.
• 75–90%: selective; catch the clean stuff.
• 90–100%: only A-setups; patient mode.
• Watch the ribbon: When shorter candidates heat up before a cross, momentum is forming. If long candidates dominate, you’re in a slower trend cycle.
⸻
Non-repainting & safety notes
• All request.security() calls use lookahead=barmerge.lookahead_off, gaps=barmerge.gaps_on.
• No forward references; decisions rely on confirmed bar data.
• EMA lengths are simple ints (no series-length errors).
• Confidence components are computed every bar (no conditional ta.* traps).
⸻
Limitations & tips
• Chop happens: ER helps, but sideways microstructure can still flicker—use Confidence + Vol filter as brakes.
• Presets ≠ oracle: They’re sensible baselines; always tune MinConf and Min ATR% to your venue and session.
• Theme “Auto”: Pine cannot read chart theme; “Auto” defaults to a Dark-friendly palette.
⸻
Publisher’s Screenshots Checklist
1) FX swing — EURUSD 1H
• Preset: FX 1H (Conservative)
• Params: MinConf=70, ATR Len=14, Min ATR%=0.12, MTF ON (TF=4H, 20/50)
• Show: Clear BUY cross, STATUS=OK, green regime background; Fitness Ribbon visible.
2) FX intraday — GBPUSD 15m
• Preset: FX 15m (Active)
• Params: MinConf=60, ATR Len=14, Min ATR%=0.20, MTF ON (TF=60m)
• Show: SELL cross near London session open. HTF lines enabled (translucent).
• Caption: “GBPUSD 15m • Active session sell with MTF alignment.”
3) Indices — SPY 1D
• Preset: Equities 1D
• Params: MinConf=60, ATR Len=14, Min ATR%=0.08, MTF ON (TF=1W, 20/50)
• Show: Longer trend run after BUY cross; regime shading shows persistence.
• Caption: “SPY 1D • Trend run after BUY cross; weekly filter aligned.”
4) Crypto — BINANCE:BTCUSDT 1H
• Preset: Crypto 1H
• Params: MinConf=75, ATR Len=14, Min ATR%=0.25, MTF ON (TF=4H)
• Show: BUY cross + quick follow-through; Ribbon warming (reds/yellows → greens).
• Caption: “BTCUSDT 1H • Momentum break with high confidence and ribbon turning.”

BioSwarm Imprinter™BioSwarm Imprinter™ — Agent-Based Consensus for Traders
What it is
BioSwarm Imprinter™ is a non-repainting, agent-based sentiment oscillator. It fuses many short-to-medium lookback “opinions” into one 0–100 consensus line that is easy to read at a glance (50 = neutral, >55 bullish bias, <45 bearish bias). The engine borrows from swarm intelligence: many simple voters (agents) adapt their influence over time based on how well they’ve been predicting price, so the crowd gets smarter as conditions change.
Use it to:
• Detect emerging trends sooner without overreacting to noise.
• Filter mean-reversion vs continuation opportunities.
• Gate entries with a confidence score that reflects both strength and persistence of the move.
• Combine with your execution tools (VWAP/ORB/levels) as a state filter rather than a trade signal by itself.
⸻
Why it’s different
• Swarm learning: Each agent improves or decays its “fitness” depending on whether its vote matched the next bar’s direction. High-fitness agents matter more; weak agents fade.
• Multi-horizon by design: The crowd is composed of fixed, simple lookbacks spread from lenMin to lenMax. You get a blended, robust view instead of a single fragile parameter.
• Two complementary lenses: Each agent evaluates RSI-style balance (via Wilder’s RMA) and momentum (EMA deviation). You decide the weight of each.
• No repaint, no MTF pitfalls: Everything runs on the chart’s timeframe with bar-close confirmation; no request.security() or forward references.
• Actionable UI: A clean consensus line, optional regime background, confidence heat, and triangle markers when thresholds are crossed.
⸻
What you see on the chart
• Consensus line (0–100): Smoothed to your preference; color/area makes bull/bear zones obvious.
• Regime coloring (optional): Light green in bull zone, light red in bear zone; neutral otherwise.
• Confidence heat: A small gauge/number (0–100) that combines distance from neutral and recent persistence.
• Markers (optional): Triangles when consensus crosses up through your bull threshold (e.g., 55) or down through your bear threshold (e.g., 45).
• Info panel (optional): Consensus value, regime, confidence, number of agents, and basic diagnostics.
⸻
How it works (under the hood)
1. Horizon bins: The range is divided into numBins. Each bin has a fixed, simple integer length (crucial for Pine’s safety rules).
2. Per-bin features (computed every bar):
• RSI-style balance using Wilder’s RMA (not ta.rsi()), then mapped to −1…+1.
• Momentum as (close − EMA(L)) / EMA(L) (dimensionless drift).
3. Agent vote: For its assigned bin, an agent forms a weighted score: score = wRSI*RSI_like + wMOM*Momentum. A small dead-band near zero suppresses chop; votes are +1/−1/0.
4. Fitness update (bar close): If the agent’s previous vote agreed with the next bar’s direction, multiply its fitness by learnGain; otherwise by learnPain. Fitness is clamped so it never explodes or dies.
5. Consensus: Weighted average of all votes using fitness as weights → map to 0–100 and smooth with EMA.
Why it doesn’t repaint:
• No future references, no MTF resampling, fitness updates only on confirmed bars.
• All TA primitives (RMA/EMA/deltas) are computed every bar unconditionally.
⸻
Signals & confidence
• Bullish bias: consensus ≥ bullThr (e.g., 55).
• Bearish bias: consensus ≤ bearThr (e.g., 45).
• Confidence (0–100):
• Distance score: how far consensus is from 50.
• Momentum score: how strong the recent change is versus its recent average.
• Combined into a single gate; start filtering entries at ≥60 for higher quality.
Tip: For range sessions, raise thresholds (60/40) and increase smoothing; for momentum sessions, lower smoothing and keep thresholds at 55/45.
⸻
Inputs you’ll actually tune
• Agents & horizons:
• N_agents (e.g., 64–128)
• lenMin / lenMax (e.g., 6–30 intraday, 10–60 swing)
• numBins (e.g., 12–24)
• Weights & smoothing:
• wRSI vs wMOM (e.g., 0.7/0.3 for FX & indices; 0.6/0.4 for crypto)
• deadBand (0.03–0.08)
• consSmooth (3–8)
• Thresholds & hygiene:
• bullThr/bearThr (55/45 default)
• cooldownBars to avoid signal spam
⸻
Playbooks (ready-to-use)
1) Breakout / Trend continuation
• Timeframe: 15m–1h for day/swing.
• Filter: Take longs only when consensus > 55 and confidence ≥ 60.
• Execution: Use your ORB/VWAP/pullback trigger for entry. Trail with swing lows or 1.5×ATR. Exit on a close back under 50 or when a bearish signal prints.
2) Mean reversion (fade)
• When: Sideways days or low-volatility clusters.
• Setup: Increase deadBand and consSmooth.
• Signal: Bearish fades when consensus rolls over below ≈55 but stays above 50; bullish fades when it rolls up above ≈45 but stays below 50.
• Targets: The neutral zone (~50) as the first take-profit.
3) Multi-TF alignment
• Keep BioSwarm on 1H for bias, execute on 5–15m:
• Only take entries in the direction of the 1H consensus.
• Skip counter-bias scalps unless confidence is very low (explicit mean-reversion plan).
⸻
Integrations that work
• DynamoSent Pro+ (macro bias): Only act when macro bias and swarm consensus agree.
• ORB + Session VWAP Pro: Trade London/NY ORB breakouts that retest while consensus >55 (long) or <45 (short).
• Levels/Orderflow: BioSwarm is your “go / no-go”; execution stays with your usual triggers.
⸻
Quick start
1. Drop the indicator on a 1H chart.
2. Start with: N_agents=64, lenMin=6, lenMax=30, numBins=16, deadBand=0.06, consSmooth=5, thresholds 55/45.
3. Trade only when confidence ≥ 60.
4. Add your favorite execution tool (VWAP/levels/OR) for entries & exits.
⸻
Non-repainting & safety notes
• No request.security(); no hidden lookahead.
• Bar-close confirmation for fitness and signals.
• All TA calls are unconditional (no “sometimes called” warnings).
• No series-length inputs to RSI/EMA — we use RMA/EMA formulas that accept fixed simple ints per bin.
⸻
Known limits & tips
• Too many signals? Raise deadBand, increase consSmooth, widen thresholds to 60/40.
• Too few signals? Lower deadBand, reduce consSmooth, narrow thresholds to 53/47.
• Over-fitting risk: Keep learnGain/learnPain modest (e.g., ×1.04 / ×0.96).
• Compute load: Large N_agents × numBins is heavier; scale to your device.
⸻
Example recipes
EURUSD 1H (swing):
lenMin=8, lenMax=34, numBins=16, wRSI=0.7, wMOM=0.3, deadBand=0.06, consSmooth=6, thr=55/45
Buy breakouts when consensus >55 and confidence ≥60; confirm with 5–15m pullback to VWAP or level.
SPY 15m (US session):
lenMin=6, lenMax=24, numBins=12, consSmooth=4, deadBand=0.05
On trend days, stay with longs as long as consensus >55; add on shallow pullbacks.
BTC 1H (24/7):
Increase momentum weight: wRSI=0.6, wMOM=0.4, extend lenMax to ~50. Use dynamic stops (ATR) and partials on strong verticals.
⸻
Final word
BioSwarm is a state engine: it tells you when the market is primed to continue or mean-revert. Pair it with your entries and risk framework to turn that state into trades. If you’d like, I can supply a companion strategy template that consumes the consensus and back-tests the three playbooks (Breakout/Fade/Flip) with standard risk management.

DynamoSent DynamoSent Pro+ — Professional Listing (Preview)
— Adaptive Macro Sentiment (v6)
— Export, Adaptive Lookback, Confidence, Boxes, Heatmap + Dynamic OB/OS
Preview / Experimental build. I’m actively refining this tool—your feedback is gold.
If you spot edge cases, want new presets, or have market-specific ideas, please comment or DM me on TradingView.
⸻
What it is
DynamoSent Pro+ is an adaptive, non-repainting macro sentiment engine that compresses VIX, DXY and a price-based activity proxy (e.g., SPX/sector ETF/your symbol) into a 0–100 sentiment line. It scales context by volatility (ATR%) and can self-calibrate with rolling quantile OB/OS. On top of that, it adds confidence scoring, a plain-English Context Coach, MTF agreement, exportable sentiment for other indicators, and a clean Light/Dark UI.
Why it’s different
• Adaptive lookback tracks regime changes: when volatility rises, we lengthen context; when it falls, we shorten—less whipsaw, more relevance.
• Dynamic OB/OS (quantiles) self-calibrates to each instrument’s distribution—no arbitrary 30/70 lines.
• MTF agreement + Confidence gate reduce false positives by highlighting alignment across timeframes.
• Exportable output: hidden plot “DynamoSent Export” can be selected as input.source in your other Pine scripts.
• Non-repainting rigor: all request.security() calls use lookahead_off + gaps_on; signals wait for bar close.
Key visuals
• Sentiment line (0–100), OB/OS zones (static or dynamic), optional TF1/TF2 overlays.
• Regime boxes (Overbought / Oversold / Neutral) that update live without repaint.
• Info Panel with confidence heat, regime, trend arrow, MTF readout, and Coach sentence.
• Session heat (Asia/EU/US) to match intraday behavior.
• Light/Dark theme switch in Inputs (auto-contrasted labels & headers).
⸻
How to use (examples & recipes)
1) EURUSD (swing / intraday blend)
• Preset: EURUSD 1H Swing
• Chart: 1H; TF1=1H, TF2=4H (default).
• Proxies: Defaults work (VIX=D, DXY=60, Proxy=D).
• Dynamic OB/OS: ON at 20/80; Confidence ≥ 55–60.
• Playbook:
• When sentiment crosses above 50 + margin with Δ ≥ signalK and MTF agreement ≥ 0.5, treat as trend breakout.
• In Oversold with rising Coach & TF agreement, take fade longs back toward mid-range.
• Alerts: Enable Breakout Long/Short and Fade; keep cooldown 8–12 bars.
2) SPY (daytrading)
• Preset: SPY 15m Daytrade; Chart: 15m.
• VIX (D) matters more; preset weights already favor it.
• Start with static 30/70; later try dynamic 25/75 for adaptive thresholds.
• Use Coach: in US session, when it says “Overbought + MTF agree → sell rallies / chase breakouts”, lean momentum-continuation after pullbacks.
3) BTCUSD (crypto, 24/7)
• Preset: BTCUSD 1H; Chart: 1H.
• DXY and BTC.D inform macro tone; keep Carry-forward ON to bridge sparse ticks.
• Prefer Dynamic OB/OS (15/85) for wider swings.
• Fade signals on weekend chop; Breakout when Confidence > 60 and MTF ≥ 1.0.
4) XAUUSD (gold, macro blend)
• Preset: XAUUSD 4H; Chart: 4H.
• Weights tilt to DXY and US10Y (handled by preset).
• Coach + MTF helps separate trend legs from news pops.
⸻
Best practices
• Theme: Switch Light/Dark in Inputs; the panel adapts contrast automatically.
• Export: In another script → Source → DynamoSent Pro+ → DynamoSent Export. Build your own filters/strategies atop the same sentiment.
• Dynamic vs Static OB/OS:
• Static 30/70: fast, universal baseline.
• Dynamic (quantiles): instrument-aware; use 20/80 (default) or 15/85 for choppy markets.
• Confidence gate: Start at 50–60% to filter noise; raise when you want only A-grade setups.
• Adaptive Lookback: Keep ON. For ultra-liquid indices, you can switch it OFF and set a fixed lookback.
⸻
Non-repainting & safety notes
• All request.security() calls use lookahead=barmerge.lookahead_off and gaps=barmerge.gaps_on.
• No forward references; signals & regime flips are confirmed on bar close.
• History-dependent funcs (ta.change, ta.percentile_linear_interpolation, etc.) are computed each bar (not conditionally).
• Adaptive lookback is clamped ≥ 1 to avoid lowest/highest errors.
• Missing-data warning triggers only when all proxies are NA for a streak; carry-forward can bridge small gaps without repaint.
⸻
Known limits & tips
• If a proxy symbol isn’t available on your plan/exchange, you’ll see the NA warning: choose a different symbol via Symbol Search, or keep Carry-forward ON (it defaults to neutral where needed).
• Intraday VIX is sparse—using Daily is intentional.
• Dynamic OB/OS needs enough history (see dynLenFloor). On short histories it gracefully falls back to static levels.
Thanks for trying the preview. Your comments drive the roadmap—presets, new proxies, extra alerts, and integrations.

[delta2win] ShockSentinel Early Warnings🚀 ShockSentinel Early Warnings — Advanced Multi-Symbol Shock Detection System
📊 UNIQUE METHODOLOGY:
This indicator implements a proprietary concordance-based shock detection system that goes beyond simple price movement analysis. Unlike basic pump/dump detectors, it uses a sophisticated multi-symbol correlation algorithm to validate signals across multiple assets simultaneously, significantly reducing false positives while maintaining sensitivity to genuine market shocks.
🔬 TECHNICAL APPROACH:
• Adaptive Threshold System: Automatically adjusts detection sensitivity based on timeframe using proprietary scaling algorithms:
- 1m: 0.5% threshold (ultra-sensitive for scalping)
- 3m: 1.0% threshold (high-frequency trading)
- 5m: 2.0% threshold (short-term momentum)
- 15m: 3.0% threshold (intraday swings)
- 1h: 6.0% threshold (daily moves)
- 4h+: 10.0% threshold (swing trading)
• Dual Detection Modes:
- Percent Mode: Calculates maximum percentage change within configurable lookback window (1-6 bars) using the formula: max(|(close - close ) / close * 100|) for i = 1 to window
- ATR-Normalized Mode: Uses Average True Range for volatility-adjusted detection across different market regimes: max(|close - close | / ATR) for i = 1 to window
• Concordance Algorithm: Proprietary multi-symbol validation system that requires minimum correlation count across up to 4 additional symbols, ensuring signals are validated by market-wide participation rather than isolated price movements
• Non-Repainting Architecture: Optional bar-close confirmation prevents false signals from intraday noise while maintaining real-time alert capability for immediate response
🎯 MATHEMATICAL FOUNDATION:
The core algorithm implements a sliding window maximum change detection:
Percent Change Calculation:
For each bar, the system calculates the maximum absolute percentage change over the specified window:
- PctChange = (close - close ) / close * 100
- MaxPct = max(|PctChange |) for i = 1 to window
- Signal triggers when MaxPct >= threshold
ATR-Normalized Calculation:
For volatility-adjusted detection:
- ATRChange = (close - close ) / ATR
- MaxATR = max(|ATRChange |) for i = 1 to window
- Signal triggers when MaxATR >= ATR_multiplier
Concordance Validation:
- Requires minimum N symbols showing same directional movement
- Validates signal strength through market participation
- Reduces false signals from isolated price movements
- Improves signal quality through correlation analysis
⚙️ ADVANCED FEATURES:
• Preset System: 7 pre-configured strategies with optimized parameters:
- Scalp (Ultra-Fast): 0.6x scaling, 2-bar window, real-time alerts
- Aggressive: 0.7x scaling, 2-bar window, real-time alerts
- Balanced: 1.0x scaling, 3-bar window, confirmed signals
- Conservative: 1.3x scaling, 4-bar window, confirmed signals
- Volatility-Adaptive: ATR mode, 7-period ATR, 2.5x multiplier
- Momentum (Intraday): ATR mode, 10-period ATR, 2.0x multiplier
- Swing (Slow): ATR mode, 14-period ATR, 2.8x multiplier
• Real-time vs Confirmed: Choose between immediate alerts or bar-close confirmation
• Visual Analytics: Integrated signal history table with concordance gauges and performance metrics
• Professional Alerts: Multi-format alert system (Compact, Extended, Plain, CSV) with Telegram integration and customizable messaging
💡 UNIQUE VALUE PROPOSITION:
Unlike simple price change detectors, this system provides:
1. Multi-Symbol Validation: Validates signals across multiple correlated assets, ensuring market-wide participation
2. Adaptive Thresholds: Automatically adjusts sensitivity based on timeframe and market conditions
3. Dual Signal Types: Provides both real-time and confirmed signal options for different trading styles
4. Comprehensive Analytics: Includes signal history, concordance gauges, and performance tracking
5. Advanced Concordance: Uses sophisticated correlation algorithms for signal validation
6. Professional Integration: Built-in Telegram support with customizable message formats
🔧 USAGE INSTRUCTIONS:
1. Select Preset: Choose appropriate strategy for your trading style and timeframe
2. Configure Symbols: Add up to 4 additional symbols for concordance validation
3. Set Concordance: Adjust minimum count (higher = more selective, lower = more sensitive)
4. Choose Mode: Select between real-time or confirmed signals based on your risk tolerance
5. Enable Alerts: Configure notification preferences and message formats
6. Monitor Performance: Use integrated tables to track signal quality and concordance
📈 PERFORMANCE CHARACTERISTICS:
• Optimized for Crypto: Designed specifically for high-volatility cryptocurrency markets
• Multi-Timeframe: Effective across all timeframes from 1-minute to 4-hour charts
• False Signal Reduction: Multi-symbol validation significantly reduces false positives
• Flexible Sensitivity: Adjustable thresholds allow customization for different market conditions
• Real-time Capability: Provides immediate alerts for fast-moving markets
• Confirmation Option: Bar-close confirmation for conservative trading approaches
⚠️ TECHNICAL CONSIDERATIONS:
• Real-time Mode: May generate multiple alerts per bar; use cooldown settings to manage frequency
• Data Dependencies: Concordance requires data availability for all configured symbols
• Market Regimes: ATR mode provides better performance in varying volatility conditions
• Signal Quality: Higher concordance requirements reduce false signals but may miss opportunities
• Latency: request.security calls depend on data provider latency and availability
🎯 TARGET MARKETS:
• Cryptocurrency Trading: High-volatility crypto markets with frequent shock events
• Scalping: Short-term trading strategies requiring immediate signal detection
• Swing Trading: Medium-term strategies benefiting from confirmed signals
• Portfolio Management: Multi-asset correlation analysis for risk management
• Algorithmic Trading: Systematic strategies requiring reliable signal validation
📊 SIGNAL INTERPRETATION:
• Green Arrows (Pump): Upward price shock with sufficient concordance
• Red Arrows (Dump): Downward price shock with sufficient concordance
• Large Markers: Confirmed signals with high concordance
• Small Markers: Early signals with lower concordance
• Background Colors: Visual intensity based on concordance strength
• Tables: Historical signal tracking with performance metrics

Omega ATR Indicator📖 Introduction
The Ω ATR Indicator was created to provide a more complete and professional framework for volatility analysis than the classic Average True Range (ATR).
While the traditional ATR is a useful tool, it has limitations: it delivers a simple rolling average of volatility, but it does not adapt to market regimes, it does not highlight extreme events, and it often leaves the trader with incomplete information about risk.
The Ω ATR takes the same foundation and elevates it into a multi-dimensional volatility dashboard, adding statistical layers, adaptive calculations, and clear visual references that allow traders to interpret volatility in a way that is immediately actionable.
🔎 What makes it different from a standard ATR?
This indicator introduces several features beyond the classic formula:
True Range Core – plots the raw True Range (TR) for each bar, providing a direct, bar-by-bar view of volatility impulses.
Standard & Adjusted ATR – includes both the conventional ATR (smoothed average) and an Adjusted ATR that automatically corrects for extreme conditions by incorporating percentile rescaling.
Percentile Volatility Levels – dynamically calculated extreme thresholds (99.8%, 75%, 50%, 25%), plotted as dotted levels across the chart. These act as reference lines for “normal” vs. “abnormal” volatility, useful for spotting unusual price expansions or contractions.
Linear Regression Volatility Trend – overlays a regression line of volatility, showing whether the market is moving toward expansion (rising vol), contraction (falling vol), or stability.
Monetary Value Translation – the indicator converts volatility into points, ticks, and dollar values (based on the instrument’s point value). This allows futures traders and high-value instruments users to immediately see how much volatility is “worth” in cash terms.
Interactive Table Display – a real-time statistics table is displayed directly on the chart, showing:
SMA of ATR in $ and points
Percentile-based volatility range (VAR) in $ and points
Tick equivalences, for quick position sizing
⚡ How traders can use it
The Ω ATR Indicator is designed to be versatile, fitting both discretionary traders and systematic strategy developers.
Risk Management: ATR-based stop losses and position sizing are significantly improved by using the adjusted ATR and percentile thresholds. Traders can size their positions according to volatility regimes, not just raw averages.
Breakout & Exhaustion Detection: When TR or ATR values spike above the 99.8% or 95% percentile levels, this often corresponds to breakout conditions or volatility exhaustion — useful for breakout strategies, mean-reversion setups, and volatility fades.
Market Regime Identification: The regression line helps distinguish if volatility is rising (trending environment, larger swings expected) or compressing (range-bound environment, lower risk opportunities).
Multi-Asset Flexibility: Works equally well on equities, futures, crypto, and FX. Its point/tick/dollar conversion makes it especially powerful for futures traders who need to quantify risk precisely.
Scalping to Swing Trading: On lower timeframes, it acts as a micro-volatility detector; on higher timeframes, it functions as a strategic risk gauge for position management.
⚙️ Settings and Customization
Length: The ATR lookback period (default = 34).
Shorter lengths (14–21) for intraday traders who want fast response.
Longer lengths (34–55) for swing/position traders who want smoother readings.
AVG / ADJ AVG: Toggle to display the standard ATR or the adjusted ATR.
Volatility Levels: Enable/disable up to 4 percentile-based levels (1st = 25%, 2nd = 50%, 3rd = 75%, 4th = 99.8%). Recommended: keep 3 levels active for clarity.
Color Controls: All plots and levels are fully customizable to match your chart style.
Table Display: Positioned on the chart (default: middle-right) with key values updated in real time.
🧭 Best Practices for Use
Combine with Trend Tools: Volatility readings are most powerful when combined with trend filters or volume analysis. For example, a breakout with both high volatility and trend confirmation is stronger than either alone.
ATR Stops: Use the Adjusted ATR rather than the standard one when trailing stops in highly volatile instruments like crypto or Nasdaq futures, as it adapts to outlier spikes.
Dollar Risk Translation: Use the dollar-value outputs to predefine maximum acceptable risk per trade (e.g., “I only risk $250 per position”). This bridges volatility to portfolio risk management.
Event Monitoring: Around economic events or earnings, expect volatility spikes above higher percentile levels. The indicator makes these moves instantly visible.
📌 Summary
The Ω ATR Indicator is not just “another ATR.” It is a comprehensive volatility framework that transforms volatility from a simple statistic into an actionable trading signal.
By combining:
the classic ATR,
an adjusted ATR,
percentile extremes,
regression-based volatility trends,
and real-time dollar conversions,
…this tool allows traders to precisely understand, visualize, and act on volatility in ways that a standard ATR simply cannot provide.
Whether you are scalping intraday moves, swing trading equities, or managing futures positions, the Ω ATR equips you with a professional-grade volatility dashboard that clarifies risk, highlights opportunity, and adapts across all markets and timeframes.
👉 Designed and developed by OmegaTools for traders who demand precision, clarity, and adaptability in their volatility analysis.

Quantile Regression Bands [BackQuant]Quantile Regression Bands
Tail-aware trend channeling built from quantiles of real errors, not just standard deviations.
What it does
This indicator fits a simple linear trend over a rolling lookback and then measures how price has actually deviated from that trend during the window. It then places two pairs of bands at user-chosen quantiles of those deviations (inner and outer). Because bands are based on empirical quantiles rather than a symmetric standard deviation, they adapt to skewed and fat-tailed behaviour and often hug price better in trending or asymmetric markets.
Why “quantile” bands instead of Bollinger-style bands?
Bollinger Bands assume a (roughly) symmetric spread around the mean; quantiles don’t—upper and lower bands can sit at different distances if the error distribution is skewed.
Quantiles are robust to outliers; a single shock won’t inflate the bands for many bars.
You can choose tails precisely (e.g., 1%/99% or 5%/95%) to match your risk appetite.
How it works (intuitive)
Center line — a rolling linear regression approximates the local trend.
Residuals — for each bar in the lookback, the indicator looks at the gap between actual price and where the line “expected” price to be.
Quantiles — those gaps are sorted; you select which percentiles become your inner/outer offsets.
Bands — the chosen quantile offsets are added to the current end of the regression line to draw parallel support/resistance rails.
Smoothing — a light EMA can be applied to reduce jitter in the line and bands.
What you see
Center (linear regression) line (optional).
Inner quantile bands (e.g., 25th/75th) with optional translucent fill.
Outer quantile bands (e.g., 1st/99th) with a multi-step gradient to visualise “tail zones.”
Optional bar coloring: bars trend-colored by whether price is rising above or falling below the center line.
Alerts when price crosses the outer bands (upper or lower).
How to read it
Trend & drift — the slope of the center line is your local trend. Persistent closes on the same side of the center line indicate directional drift.
Pullbacks — tags of the inner band often mark routine pullbacks within trend. Reaction back to the center line can be used for continuation entries/partials.
Tails & squeezes — outer-band touches highlight statistically rare excursions for the chosen window. Frequent outer-band activity can signal regime change or volatility expansion.
Asymmetry — if the upper band sits much further from the center than the lower (or vice versa), recent behaviour has been skewed. Trade management can be adjusted accordingly (e.g., wider take-profit upslope than downslope).
A simple trend interpretation can be derived from the bar colouring
Good use-cases
Volatility-aware mean reversion — fade moves into outer bands back toward the center when trend is flat.
Trend participation — buy pullbacks to the inner band above a rising center; flip logic for shorts below a falling center.
Risk framing — set dynamic stops/targets at quantile rails so position sizing respects recent tail behaviour rather than fixed ticks.
Inputs (quick guide)
Source — price input used for the fit (default: close).
Lookback Length — bars in the regression window and residual sample. Longer = smoother, slower bands; shorter = tighter, more reactive.
Inner/Outer Quantiles (τ) — choose your “typical” vs “tail” levels (e.g., 0.25/0.75 inner, 0.01/0.99 outer).
Show toggles — independently toggle center line, inner bands, outer bands, and their fills.
Colors & transparency — customize band and fill appearance; gradient shading highlights the tail zone.
Band Smoothing Length — small EMA on lines to reduce stair-step artefacts without meaningfully changing levels.
Bar Coloring — optional trend tint from the center line’s momentum.
Practical settings
Swing trading — Length 75–150; inner τ = 0.25/0.75, outer τ = 0.05/0.95.
Intraday — Length 50–100 for liquid futures/FX; consider 0.20/0.80 inner and 0.02/0.98 outer in high-vol assets.
Crypto — Because of fat tails, try slightly wider outers (0.01/0.99) and keep smoothing at 2–4 to tame weekend jumps.
Signal ideas
Continuation — in an uptrend, look for pullback into the lower inner band with a close back above the center as a timing cue.
Exhaustion probe — in ranges, first touch of an outer band followed by a rejection candle back inside the inner band often precedes mean-reversion swings.
Regime shift — repeated closes beyond an outer band or a sharp re-tilt in the center line can mark a new trend phase; adjust tactics (stop-following along the opposite inner band).
Alerts included
“Price Crosses Upper Outer Band” — potential overextension or breakout risk.
“Price Crosses Lower Outer Band” — potential capitulation or breakdown risk.
Notes
The fit and quantiles are computed on a fixed rolling window and do not repaint; bands update as the window moves forward.
Quantiles are based on the recent distribution; if conditions change abruptly, expect band widths and skew to adapt over the next few bars.
Parameter choices directly shape behaviour: longer windows favour stability, tighter inner quantiles increase touch frequency, and extreme outer quantiles highlight only the rarest moves.
Final thought
Quantile bands answer a simple question: “How unusual is this move given the current trend and the way price has been missing it lately?” By scoring that question with real, distribution-aware limits rather than one-size-fits-all volatility you get cleaner pullback zones in trends, more honest “extreme” tags in ranges, and a framework for risk that matches the market’s recent personality.

Confluence Engine Confluence Engine is a practical, non-repainting decision aid that scores market conditions from −100…+100 by combining six proven modules: Trend, Momentum, Volatility, Volume, Structure, and an HTF confirmation. It’s designed for crypto, forex, indices, and stocks, and it fires entries only on confirmed bar closes.
What’s inside
Trend: EMA 20/50/200 alignment plus a Supertrend/KAMA toggle (you choose the baseline).
Momentum: RSI + MACD with confirmed-pivot divergence detection.
Volatility: ATR% and Bollinger Band width vs its average to favor expansion over chop.
Volume: OBV-style cumulative flow slope + volume surge vs SMA×multiplier.
Market Structure: Confirmed pivots, BOS (break of structure) and CHOCH (change of character).
HTF Filter: Closed higher-timeframe context via request.security(..., barmerge.gaps_on, barmerge.lookahead_off).
Why it does not repaint
Signals are computed and plotted on closed bars only.
Pivots/divergences use confirmed pivot points (no forward look).
HTF series are fetched with lookahead_off and use the last closed HTF bar in realtime.
No future bar references are used for entries or alerts.
How to use (3 steps)
Pick a timeframe pair: use a 4–6× HTF multiplier (5m→30m, 15m→1h, 1h→4h, 4h→1D, 1D→1W).
Trade with the HTF: take longs only when the HTF filter is bullish; shorts only when bearish.
Prefer expansion: act when BB width > its average and ATR% is elevated; skip most signals in compression.
Suggested presets (start here)
Crypto (BTC/ETH): 15m→1h, 1h→4h. stLen=10, stMult=3.0, bbLen=20, surgeMul=1.8–2.2, thresholds +40 / −40 (intraday can try +35 / −35).
Forex majors: 15m→1h, 1h→4h. stLen=10–14, stMult=2.5–3.0, surgeMul=1.5–1.8, thresholds +35 / −35 (swing: +45 / −45).
US equities (liquid): 5m→30m/1h, 15m→1h/2h. stMult=3.0–3.5, surgeMul=1.6–2.0, thresholds +45 / −45 to reduce chop.
Indices (ES/NQ): 5m→30m, 15m→1h. Defaults are fine; start at +40 / −40.
Gold/Oil: 15m→1h, 1h→4h. Thresholds +35 / −35, surgeMul=1.6–1.9.
Inputs (plain English)
Use Supertrend (off = KAMA): choose the trend baseline.
EMA Fast/Mid/Slow: 20/50/200 by default for classic stack.
RSI/MACD + divergence pivots: momentum and exhaustion context.
ATR Length & BB Length: volatility regime detection.
Volume SMA & Surge Multiplier: defines “meaningful” volume spikes.
Pivot left/right & “Confirm BOS/CHOCH on Close”: structure strictness.
Enable HTF & Higher Timeframe: confirms the lower timeframe direction.
Thresholds (+long / −short): when the score crosses these, you get signals.
Signals & alerts (IDs preserved)
Entry shapes plot at bar close when the score crosses thresholds.
Alerts you can enable:
CONFLUENCE LONG — long entry signal
CONFLUENCE SHORT — short entry signal
BULLISH BIAS — score turned positive
BEARISH BIAS — score turned negative
Best practices
Focus on signals with HTF agreement and volatility expansion; require volume participation (surge or rising OBV slope) for higher quality.
Raise thresholds (+45/−45 or +50/−50) to reduce whipsaws in choppy sessions.
Lower thresholds (+35/−35) only if you also require volatility/volume filters.
Performance & scope
Works across crypto/FX/equities/indices; no broker data or special feeds required.
No repainting by design; signals/alerts are computed on closed bars.
As with any tool, results vary by regime; always combine with risk management.
Disclosure
This script is for educational purposes only and is not financial advice. Trading involves risk. Test on historical data and paper trade before using live.

Technical Summary VWAP | RSI | VolatilityTechnical Summary VWAP | RSI | Volatility
The Quantum Trading Matrix is a multi-dimensional market-analysis dashboard designed as an educational and idea-generation tool to help traders read price structure, participation, momentum and volatility in one compact view. It is not an automated execution system; rather, it aggregates lightweight “quantum” signals — VWAP position, momentum oscillator behaviour, multi-EMA trend scoring, volume flow and institutional activity heuristics, market microstructure pivots and volatility measures — and synthesizes them into a single, transparent score and signal recommendation. The primary goal is to make explicit why a given market looks favourable or unfavourable by showing the individual ingredients and how they combine, enabling traders to learn, test and form rules based on observable market mechanics.
Each module of the matrix answers a distinct market question. VWAP and its percentage distance indicate whether the current price is trading above or below the intraday volume-weighted average — a proxy for intraday institutional control and value. The quantum momentum oscillator (fast and slow EMA difference scaled to percent) captures short-to-intermediate momentum shifts, providing a quickly responsive view of directional pressure. Multi-EMA trend scoring (8/21/50) produces a simple, transparent trend score by counting conditions such as price above EMAs and cross-EMAs ordering; this score is used to categorize market trend into descriptive buckets (e.g., STRONG UP, WEAK UP, NEUTRAL, DOWN). Volume analysis compares current volume to a recent moving average and computes a Z-score to detect spikes and unusual participation; additional buy/sell pressure heuristics (buyingPressure, sellingPressure, flowRatio) estimate whether upside or downside participation dominates the bar. Institutional activity is approximated by flagging large orders relative to volume baseline (e.g., volume > 2.5× MA) and estimating a dark pool proxy; this is a heuristic to highlight bars that likely had large players involved.
The dashboard also performs market-structure detection with small pivot windows to identify recent local support/resistance areas and computes price position relative to the daily high/low (dailyMid, pricePosition). Volatility is measured via ATR divided by price and bucketed into LOW/NORMAL/HIGH/EXTREME categories to help you adapt stop sizing and expectational horizons. Finally, all these pieces feed an interpretable scoring function that rewards alignment: VWAP above, strong flow ratio, bullish trend score, bullish momentum, and favorable RSI zone add to the overall score which is presented as a 0–100 metric and a colored emoji indicator for at-a-glance assessment.
The mashup is purposeful: each indicator covers a failure mode of the other. For example, momentum readings can be misleading during volatility spikes; VWAP informs whether institutions are on the bid or offer; volume Z-score detects abnormal participation that can validate a breakout; multi-EMA score mitigates single-EMA whipsaws by requiring a combination of price/EMA conditions. Combining these signals increases information content while keeping each component explainable — a key compliance requirement. The script intentionally emphasizes transparency: when it shows a BUY/SELL/HOLD recommendation, the dashboard shows the underlying sub-components so a trader can see whether VWAP, momentum, volume, trend or structure primarily drove the score.
For practical use, adopt a clear workflow: (1) check the matrix score and read the component tiles (VWAP position, momentum, trend and volume) to understand the drivers; (2) confirm market-structure support/resistance and pricePosition relative to the daily range; (3) require at least two corroborating components (for example, VWAP ABOVE + Momentum BULLISH or Volume spike + Trend STRONG UP) before considering entries; (4) use ATR-based stops or daily pivot distance for stop placement and size positions such that the trade risks a small, pre-defined percent of capital; (5) for intraday scalps shorten holding time and tighten stops, for swing trades increase lookback lengths and require multi-timeframe (higher TF) agreement. Treat the matrix as an idea filter and replay lab: when an alert triggers, replay the bars and observe which components anticipated the move and which lagged.
Parameter tuning matters. Shortening the momentum length makes the oscillator more sensitive (useful for scalping), while lengthening it reduces noise for swing contexts. Volume profile bars and MA length should match the instrument’s liquidity — increase the MA for low-liquidity stocks to reduce false institutional flags. The trend multiplier and signal sensitivity parameters let you calibrate how aggressively the matrix counts micro evidence into the score. Always backtest parameter sets across multiple periods and instruments; run walk-forward tests and keep a simple out-of-sample validation window to reduce overfitting risk.
Limitations and failure modes are explicit: institutional flags and dark-pool estimates are heuristics and cannot substitute for true tape or broker-level order flow; volume split by price range is an approximation and will not perfectly reflect signed volume; pivot detection with small windows may miss larger structural swings; VWAP is typically intraday-centric and less meaningful across multi-day swing contexts; the score is additive and may not capture non-linear relationships between features in extreme market regimes (e.g., flash crashes, circuit breaker events, or overnight gaps). The matrix is also susceptible to false signals during major news releases when price and volume behavior dislocate from typical patterns. Users should explicitly test behavior around earnings, macro data and low-liquidity periods.
To learn with the matrix, perform these experiments: (A) collect all BUY/SELL alerts over a 6-month period and measure median outcome at 5, 20 and 60 bars; (B) require additional gating conditions (e.g., only accept BUY when flowRatio>60 and trendScore≥4) and compare expectancy; (C) vary the institutional threshold (2×, 2.5×, 3× volumeMA) to see how many true positive spikes remain; (D) perform multi-instrument tests to ensure parameters are not tuned to a single ticker. Document every test and prefer robust, slightly lower returns with clearer logic rather than tuned “optimal” results that fail out of sample.
Originality statement: This script’s originality lies in the curated combination of intraday value (VWAP), multi-EMA trend scoring, momentum percent oscillator, volume Z-score plus buy/sell flow heuristics and a compact, interpretable scoring system. The script is not a simple indicator mashup; it is a didactic ensemble specifically designed to make internal rationale visible so traders can learn how each market characteristic contributes to actionable probability. The tool’s novelty is its emphasis on interpretability — showing the exact contributing signals behind a composite score — enabling reproducible testing and educational value.
Finally, for TradingView publication, include a clear description listing the modules, a short non-technical summary of how they interact, the tunable inputs, limitations and a risk disclaimer. Remove any promotional content or external contact links. If you used trademark symbols, either provide registration details or remove them. This transparent documentation satisfies TradingView’s requirement that mashups justify their composition and teach users how to use them.
Quantum Trading Matrix — multi-factor intraday dashboard (educational use only).
Purpose: Combines intraday VWAP position, a fast/slow EMA momentum percent oscillator, multi-EMA trend scoring (8/21/50), volume Z-score and buy/sell flow heuristics, pivot-based microstructure detection, and ATR-based volatility buckets to produce a transparent, componentized market score and trade-idea indicator. The mashup is intentional: VWAP identifies intraday value, momentum detects short bursts, EMAs provide structural trend bias, and volume/flow confirm participation. Signals require alignment of at least two components (for example, VWAP ABOVE + Momentum BULLISH + positive flow) for higher confidence.
Inputs: momentum period, volume MA/profile length, EMA configuration (8/21/50), trend multiplier, signal sensitivity, color and display options. Use shorter momentum lengths for scalps and longer for swing analysis. Increase volume MA for thinly traded instruments.
Limitations: Institutional/dark-pool estimates and flow heuristics are approximations, not actual exchange tape. VWAP is intraday-focused. Expect false signals during major news or low-liquidity sessions. Backtest and paper-trade before applying real capital.
Risk Disclaimer: For education and analysis only. Not financial advice. Use proper risk management. The author is not responsible for trading losses.
________________________________________
Risk & Misuse Disclaimer
This indicator is provided for education, analysis and idea generation only. It is not investment or financial advice and does not guarantee profits. Institutional activity flags, dark-pool estimates and flow heuristics are approximations and should not be treated as exchange tape. Backtest thoroughly and use demo/paper accounts before trading real capital. Always apply appropriate position sizing and stop-loss rules. The author is not responsible for any trading losses resulting from the use or misuse of this tool.
________________________________________
Risk Disclaimer: This tool is provided for education and analysis only. It is not financial advice and does not guarantee returns. Users assume all risk for trades made based on this script. Back test thoroughly and use proper risk management.

ADX Tide ZonesADX Tide Zones – Adaptive Momentum & Trend Strength Framework
Overview
ADX Tide Zones – Professional is a dynamic trend-strength visualizer designed for traders who want to interpret momentum with precision and context. By combining the Average Directional Index (ADX) with adaptive threshold logic, the indicator segments price action into distinct “tide zones” that reflect varying levels of market strength: Calm, Rising, Strong, and Falling Tides. These zones transform raw ADX readings into an interpretable framework that highlights when markets are consolidating, building momentum, trending strongly, or losing strength.
Unlike standard ADX readings, which can be difficult to interpret in real time, ADX Tide Zones translate momentum shifts into a continuous, color-coded system that traders can instantly read. Whether applied to scalping, intraday, or swing trading, the indicator offers a consistent methodology for identifying actionable opportunities across assets and timeframes.
How It Works
The foundation of ADX Tide Zones lies in momentum analysis via the ADX. By measuring the strength (not direction) of a trend, ADX provides an objective read on when markets are gaining or losing energy. ADX Tide Zones enhances this by applying threshold logic to classify ADX values into four distinct states:
Calm Tide : Low ADX values indicate sideways or consolidating conditions.
Rising Tide : ADX increases past a threshold, signaling momentum building.
Strong Tide : ADX remains elevated, confirming robust and sustained trend strength.
Falling Tide : ADX declines after strength, hinting at exhaustion or early reversal setups.
These states are displayed on the chart through adaptive visualizations (zones, bar colors, or overlays), offering real-time clarity on when to expect expansion, continuation, or contraction in price action.
Interpretation
Trend Analysis : By mapping transitions between tides, traders can instantly gauge whether markets are in accumulation, expansion, or exhaustion phases. Rising/Strong Tides reinforce trend continuation, while Falling Tides highlight weakening conditions.
Volatility & Risk Assessment : Shifts between Calm → Rising Tide often precede volatility expansions. Falling Tides can signal a period of compression or corrective moves, warning traders to manage risk proactively.
Market Context : The indicator does not dictate direction; instead, it overlays strength on top of price action, allowing traders to combine it with directional tools such as moving averages, order blocks, or liquidity zones for confirmation.
Strategy Integration
ADX Tide Zones adapts seamlessly to a wide range of trading strategies by translating momentum dynamics into actionable frameworks:
Trend Following : Traders can align with dominant flows by entering positions when the indicator confirms a Rising Tide or Strong Tide. These conditions signal persistent directional strength, making them ideal for continuation setups. Combining directional bias with ADX confirmation reduces the risk of trading against prevailing momentum.
Breakout Trading : When the market transitions from Calm Tide into a Rising Tide, it often precedes a volatility expansion. This shift highlights breakout conditions where accumulation gives way to impulsive price movement. Traders can use this transition as a timing tool to catch early entries into new momentum phases.
Exhaustion Reversals : Strong Tide phases don’t last forever—when they begin to fade into Falling Tide, it can mark trend fatigue or liquidity exhaustion. This offers contrarian traders an early edge in spotting overextended moves and positioning for corrective pullbacks or full reversals.
Multi-Timeframe Analysis : By overlaying higher timeframe tide zones on intraday or scalping charts, traders can filter noise and trade in alignment with larger flows. For example, combining a daily Rising Tide bias with a 15-minute breakout confirmation can significantly improve entry precision while reducing exposure to false signals.
Advanced Techniques
For traders seeking an extra edge, ADX Tide Zones can be pushed further with advanced methods:
Volume & Liquidity Confirmation : Pair the tide transitions with volume spikes, order flow, or liquidity sweep tools. When directional strength confirmed by the ADX coincides with institutional activity, it validates setups and increases probability of follow-through.
Cross-Asset Synchronization : Momentum rarely exists in isolation. Monitoring tide shifts across correlated instruments (e.g., majors vs. USD, or indices vs. risk assets) can uncover synchronized volatility events. These correlations help traders identify whether a move is isolated noise or part of a broader systemic trend.
Threshold Optimization : The sensitivity of ADX Tide Zones can be fine-tuned for different trading objectives. Lower thresholds heighten responsiveness, capturing micro-moves suitable for scalpers. Higher thresholds filter minor fluctuations, isolating major structural swings that align with swing or position trading.
Contextual Trade Management : Instead of using static stops or targets, traders can adapt risk management dynamically by tracking tide progression. For example, a trade initiated during Rising Tide may remain valid as long as conditions sustain, but partial profits or tighter stops can be applied once the zone shifts to Calm Tide.
Inputs & Customization
ADX Length : Define the lookback period for ADX calculation.
Threshold Levels : Adjust sensitivity for Calm, Rising, Strong, and Falling Tides.
Zone Visualization : Choose between bar coloring, background shading, or overlays.
Color Customization : Configure bullish, bearish, neutral, and tide-specific colors.
Multi-Timeframe Options : Enable tide readings from higher timeframes for confirmation.
Why Use ADX Tide Zones
ADX Tide Zones turns the complexity of momentum analysis into a visual system that highlights when markets are gearing up for moves, trending with conviction, or running out of steam. By combining adaptive ADX interpretation with customizable thresholds, traders can:
Anticipate breakouts before volatility expands.
Confirm the strength behind price trends.
Spot exhaustion phases early to secure profits or prepare for reversals.
Adapt strategies seamlessly between scalping, intraday, and swing trading.
With its balance of simplicity and depth, ADX Tide Zones provides a structured lens for reading market momentum, equipping traders with the clarity needed to execute with discipline and confidence.
