2022 Model ICT Entry Strategy [TradingFinder] One Setup For Life🔵 Introduction
The ICT 2022 model, introduced by Michael Huddleston, is an advanced trading strategy rooted in liquidity and price imbalance, where time and price serve as the core elements. This ICT 2022 trading strategy is an algorithmic approach designed to analyze liquidity and imbalances in the market. It incorporates concepts such as Fair Value Gap (FVG), Liquidity Sweep, and Market Structure Shift (MSS) to help traders identify liquidity movements and structural changes in the market, enabling them to determine optimal entry and exit points for their trades.
This Full ICT Day Trading Model empowers traders to pinpoint the Previous Day High/Low as well as the highs and lows of critical sessions like the London and New York sessions. These levels act as Liquidity Zones, which are frequently swept prior to a market structure shift (MSS) or a retracement to areas such as Optimal Trade Entry (OTE).
Bullish :
Bearish :
🔵 How to Use
The ICT 2022 model is a sophisticated trading strategy that focuses on identifying key liquidity levels and price movements. It operates based on two main principles. In the first phase, the price approaches liquidity zones and sweeps critical levels such as the previous day’s high or low and key session levels.
This movement is known as a Liquidity Sweep. In the second phase, following the sweep, the price retraces to areas like the FVG (Fair Value Gap), creating ideal entry points for trades. Below is a detailed explanation of how to apply this strategy in bullish and bearish setups.
🟣 Bullish ICT 2022 Model Setup
To use the ICT 2022 model in a bullish setup, start by identifying the Previous Day High/Low or key session levels, such as those of the London or New York sessions. In a bullish setup, the price usually moves downward first, sweeping the Liquidity Low. This move, known as a Liquidity Sweep, reflects the collection of buy orders by major market participants.
After the liquidity sweep, the price should shift market structure and start moving upward; this shift, referred to as Market Structure Shift (MSS), signals the beginning of an upward trend. Following MSS, areas like FVG, located within the Discount Zone, are identified. At this stage, the trader waits for the price to retrace to these zones. Once the price returns, a long trade is executed.
Finally, the stop-loss should be set below the liquidity low to manage risk, while the take-profit target is usually placed above the previous day’s high or other identified liquidity levels. This structure enables traders to take advantage of the upward price movement after the liquidity sweep.
🟣 Bearish ICT 2022 Model Setup
To identify a bearish setup in the ICT 2022 model, begin by marking the Previous Day High/Low or key session levels, such as the London or New York sessions. In this scenario, the price typically moves upward first, sweeping the Liquidity High. This move, known as a Liquidity Sweep, signifies the collection of sell orders by key market players.
After the liquidity sweep, the price should shift market structure downward. This movement, called the Market Structure Shift (MSS), indicates the start of a downtrend. Following MSS, areas such as FVG, found within the Premium Zone, are identified. At this stage, the trader waits for the price to retrace to these areas. Once the price revisits these zones, a short trade is executed.
In this setup, the stop-loss should be placed above the liquidity high to control risk, while the take-profit target is typically set below the previous day’s low or another defined liquidity level. This approach allows traders to capitalize on the downward price movement following the liquidity sweep.
🔵 Settings
Swing period : You can set the swing detection period.
Max Swing Back Method : It is in two modes "All" and "Custom". If it is in "All" mode, it will check all swings, and if it is in "Custom" mode, it will check the swings to the extent you determine.
Max Swing Back : You can set the number of swings that will go back for checking.
FVG Length : Default is 120 Bar.
MSS Length : Default is 80 Bar.
FVG Filter : This refines the number of identified FVG areas based on a specified algorithm to focus on higher quality signals and reduce noise.
Types of FVG filters :
Very Aggressive Filter: Adds a condition where, for an upward FVG, the last candle's highest price must exceed the middle candle's highest price, and for a downward FVG, the last candle's lowest price must be lower than the middle candle's lowest price. This minimally filters out FVGs.
Aggressive Filter: Builds on the Very Aggressive mode by ensuring the middle candle is not too small, filtering out more FVGs.
Defensive Filter: Adds criteria regarding the size and structure of the middle candle, requiring it to have a substantial body and specific polarity conditions, filtering out a significant number of FVGs.
Very Defensive Filter: Further refines filtering by ensuring the first and third candles are not small-bodied doji candles, retaining only the highest quality signals.
🔵 Conclusion
The ICT 2022 model is a comprehensive and advanced trading strategy designed around key concepts such as liquidity, price imbalance, and market structure shifts (MSS). By focusing on the sweep of critical levels such as the previous day’s high/low and important trading sessions like London and New York, this strategy enables traders to predict market movements with greater precision.
The use of tools like FVG in this model helps traders fine-tune their entry and exit points and take advantage of bullish and bearish trends after liquidity sweeps. Moreover, combining this strategy with precise timing during key trading sessions allows traders to minimize risk and maximize returns.
In conclusion, the ICT 2022 model emphasizes the importance of time and liquidity, making it a powerful tool for both professional and novice traders. By applying the principles of this model, you can make more informed trading decisions and seize opportunities in financial markets more effectively.
在腳本中搜尋"take profit"

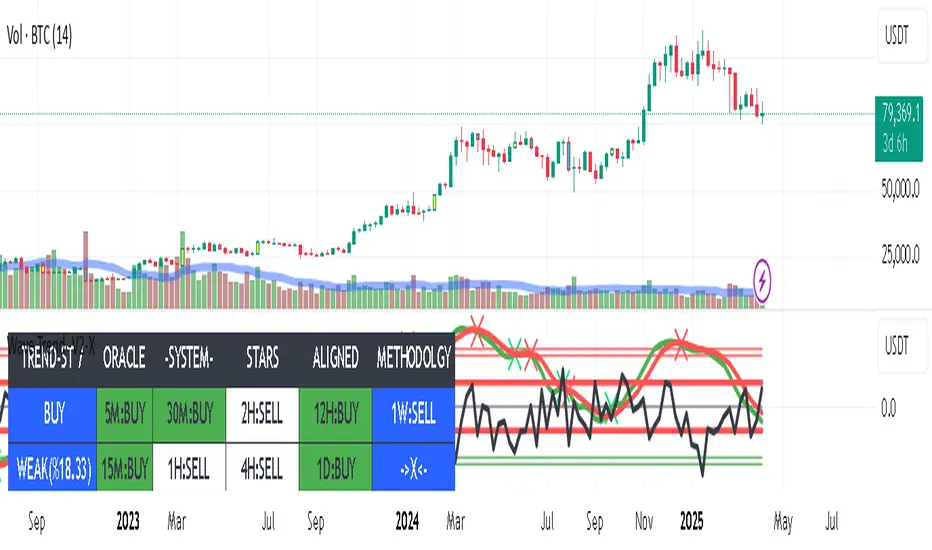
Wave Trend -V2Wave Trend -V2 is here to give you a serious edge.
This upgraded version of the popular LazyBear script takes wave trend analysis to the next level.
Here's the deal:
Multi-Timeframe Analysis: Beyond Short-Term Noise:
Novice traders often focus solely on the current timeframe (let's say, the 5-minute chart).
Wave Trend -V2 breaks free from this limitation by analyzing price action across multiple timeframes (1-minute to 1-week).
---This holistic view helps you:
Identify larger trends: Are we in a bullish uptrend on the daily chart, even if the hourly chart is showing some short-term weakness? Wave Trend -V2 helps you see the bigger picture.
Avoid false breakouts: Short-term price spikes can create false signals. By looking at higher timeframes, you can filter out these "noise" and focus on sustainable trends.
---Pressure Analysis: Gauging Market Strength:
Wave Trend -V2 goes beyond simple trend identification.
It incorporates "pressure" analysis to gauge the strength and direction of the current market trend.
This helps you:
Enter trades with confidence: When the trend is strong and the pressure is high, you can enter trades with greater conviction.
Minimize risk: If the pressure is waning or conflicting signals arise, you can avoid entering trades or adjust your risk parameters accordingly.
Impact Point Analysis: Predicting Future Price Moves:
Wave Trend -V2 analyzes the price impact of the last four wave trend crossovers.
Let's say the last impact point was "X", the previous one "X-1", the one before that "X-2", and so on.
The indicator calculates the average price movement between these points using the following simplified formula:
Average Impact = (X - X-1) + (X-1 - X-2) + (X-2 - X-3) / 3
This average provides a valuable estimate of the potential price movement of the next crossover.
Multiple Take Profit Levels: Setting Strategic Targets:
Wave Trend -V2 offers three dynamic take profit levels (TP1, TP2, TP3).
TP1: Based on the estimated average impact.
TP2: Twice the estimated average impact.
TP3: Three times the estimated average impact.
This allows you to set your profit targets strategically, maximizing potential gains while managing risk effectively.
Why don't use the Estmated impact point to stop the trade?
In order to eliminated the WHIPSAW effect! There is no other way...
Wave Trend -V2 is designed for traders who seek a deeper understanding of trend dynamics and desire a more sophisticated approach to trading. By combining multi-timeframe analysis, pressure assessment, and advanced impact point calculations, this indicator empowers you to make more informed trading decisions and potentially improve your trading outcomes.
The indicator work best with combination of other trend type indicators.
Please dont forget that indicators are not miracle medicines , it cannot give you exact results , market was always volative , use at your own discretion.
Smart Money Breakout Signals [AlgoAlpha]Introducing the Smart Money Breakout Signals, a cutting-edge trading indicator designed to identify key structural shifts and breakout opportunities in the market. This tool leverages a blend of smart money concepts like Break of Structure (BOS) and Change of Character (CHoCH) to provide traders with actionable insights into market direction and potential entry or exit points.
Key Features :
✨ Market Structure Analysis : Automatically detects and labels BOS and CHoCH for trend confirmation and reversals.
🎨 Customizable Visualization : Tailor bullish and bearish colors for breakout lines and signals to suit your preferences.
📊 Dynamic Take-Profit Targets : Displays three tiered take-profit levels based on breakout volatility.
🔔 Real-Time Alerts : Stay ahead of the game with notifications for bullish and bearish breakouts.
📋 Performance Dashboard : Monitor signal statistics, including win rates and total signals, directly on your chart.
How to Use :
Add the Indicator : Add the script to your favourites ⭐ and customize settings like market structure horizon and confirmation type.
Monitor Breakouts : Observe BOS and CHoCH labels to identify potential trend shifts. Use the breakout lines and tiered take-profit levels to plan trades effectively.
Set Alerts : Enable alerts for bullish or bearish breakouts to act on opportunities without constant monitoring.
How It Works :
The indicator identifies market structure by analyzing pivot highs and lows over a user-defined time horizon. A breakout is confirmed based on either candle closes or wicks surpassing previous pivot points. Upon detection, the script generates signals with breakout lines and calculates take-profit targets based on the distance from the breakout level. A built-in dashboard tracks performance metrics like total signals and win rates, giving traders real-time feedback on strategy effectiveness.

Position Size Calculator (MOEX Futures)Описание на русском языке
Этот скрипт для TradingView создан специально для трейдеров, работающих с фьючерсами на Московской бирже. Его основная цель – помочь трейдерам быстро и точно рассчитывать параметры позиции, такие как количество контрактов, риск на сделку, общий размер маржи, а также цены стоп-лосса и тейк-профита.
Функционал:
Расчет цены контракта: учитывает цену актива (в пунктах) и стоимость одного пункта.
Риск на сделку: определяется как процент от общего капитала.
Размер позиции: рассчитывается на основе риска на сделку и стоп-лосса.
Количество контрактов: округляется до целого числа вниз.
Общий размер маржи: определяется исходя из количества контрактов и маржи на один контракт.
Цены стоп-лосса и тейк-профита: вычисляются как для лонг-, так и для шорт-позиций.
Интерактивная таблица: статично отображается в правом верхнем углу графика и обновляется автоматически при изменении входных данных.
Скрипт заточен исключительно под специфику фьючерсов Московской биржи и позволяет трейдерам оптимизировать расчёты, минимизировать ошибки и экономить время.
Description in English
This TradingView script is specifically designed for traders working with futures on the Moscow Exchange. Its primary purpose is to help traders quickly and accurately calculate position parameters, such as the number of contracts, risk per trade, total margin size, and stop-loss and take-profit prices.
Features:
Contract price calculation: Takes into account the asset price (in points) and the price per point.
Risk per trade: Defined as a percentage of the total capital.
Position size: Calculated based on the risk per trade and stop-loss percentage.
Number of contracts: Rounded down to the nearest whole number.
Total margin size: Determined based on the number of contracts and margin per contract.
Stop-loss and take-profit prices: Calculated for both long and short positions.
Interactive table: Statically displayed in the top-right corner of the chart and dynamically updated when input parameters change.
This script is tailored exclusively to the specifics of futures trading on the Moscow Exchange, enabling traders to optimize calculations, minimize errors, and save time.

RSI MACD Combined Color StrategyOverview
This indicator combines RSI and MACD signals to create a powerful visual trading system, inspired by TrendSpider's AI Strategy Coder examples. It colors candles based on the alignment of three key technical conditions, providing clear visual signals for potential trend strength and direction.
Technical Components
Core Conditions
RSI (Relative Strength Index) > 50
Indicates bullish momentum when price is trading above the centerline
Traditional indicator of trend strength
MACD Line > Signal Line
Shows positive momentum
Classic signal for potential upward movement
MACD Line > 0
Confirms bullish territory
Indicates overall positive momentum
Color Coding System
🟢 Green Candles: All three conditions are met
Strongest bullish signal
Suggests high probability trading opportunities
⚪ Grey Candles: One or two conditions are met
Neutral or transitioning market
Suggests caution or waiting for stronger confirmation
🔴 Red Candles: No conditions are met
Bearish signal
Suggests potential downward pressure
How to Use This Indicator
For Entry Signals
Look for transitions from red or grey to green candles
Green candles suggest strong bullish alignment
Consider entering long positions when candles turn green
For Exit Signals
Watch for color transitions from green to grey or red
Consider taking profits when candles change from green to grey
Consider stop losses when candles turn red
Risk Management
Use color transitions as part of your broader strategy
Don't rely solely on color changes for trading decisions
Combine with other technical analysis tools and risk management practices
Customizable Parameters
RSI Length (default: 14)
MACD Fast Length (default: 12)
MACD Slow Length (default: 26)
MACD Signal Length (default: 9)
Best Practices
Use multiple timeframes for confirmation
Look for confluences with support/resistance levels
Consider volume and market context
Start with default settings and adjust based on your trading style
Backtest different parameter combinations
Notes
This indicator works best in trending markets
Grey candles can indicate transition periods
Consider market conditions and volatility when interpreting signals
Credits
Inspired by TrendSpider's AI Strategy Coder examples and adapted for TradingView using Pine Script v5.
Disclaimer
This technical indicator is for informational purposes only. Always conduct your own analysis and consider risk management principles before making trading decisions. Past performance does not guarantee future results.

Volume Footprint POC for Every CandleCalculating and plotting the Point of Control (POC) for every candle on a volume footprint chart can provide valuable insights for traders. Here are some interpretations and uses of this information:
1. Identify Key Price Levels
Highest Traded Volume: The POC represents the price level with the highest traded volume for each candle. This level often acts as a significant support or resistance level.
Confluence Zones: When multiple POCs align at similar price levels over several candles, it indicates strong support or resistance zones.
2. Gauge Market Sentiment
Buyer and Seller Activity: High volume at certain price levels can indicate where buyers and sellers are most active. A rising POC suggests stronger buying activity, while a falling POC suggests stronger selling activity.
Volume Profile: Analyzing the volume profile helps in understanding the distribution of traded volume across different price levels, providing insights into market sentiment and potential reversals.
3. Spot Trends and Reversals
Trend Continuation: Consistent upward or downward shifts in POC levels can indicate a trend continuation. Traders can use this information to stay in trending positions.
Reversal Signals: A sudden change in the POC direction may signal a potential reversal. This can be used to take profits or enter new positions.
4. Intraday Trading Strategies
Short-Term Trading: Intraday traders can use the POC to make informed decisions on entry and exit points. For example, buying near the POC during an uptrend or selling near the POC during a downtrend.
Scalping Opportunities: High-frequency traders can use shifts in the POC to scalp small profits from price movements around these key levels.
5. Volume-Based Indicators
Confirmation of Other Indicators: The POC can be used in conjunction with other technical indicators (e.g., moving averages, RSI) to confirm signals and improve trading accuracy.
Support and Resistance: Combining the POC with traditional support and resistance levels can provide a more comprehensive view of the market dynamics.
In summary, the Point of Control (POC) is a valuable tool for traders to understand market behavior, identify key levels, and make more informed trading decisions. If you have specific questions or need further details on how to use this information in your trading strategy, feel free to ask! 😊

Sunil 2 Bar Breakout StrategyDetailed Explanation of the Sunil 2 Bar Breakout Strategy
Introduction
The Sunil 2 Bar Breakout Strategy is a simple yet effective price-action-based approach designed to identify breakout opportunities in financial markets. This strategy analyzes the movement of the last three candles to detect momentum and initiates trades in the direction of the breakout. It is equipped with a built-in stop-loss mechanism to protect capital, making it suitable for traders looking for a structured and disciplined trading system.
The strategy works well across different timeframes and asset classes, including indices, stocks, forex, and cryptocurrencies. Its versatility makes it ideal for both intraday and swing trading.
Core Concept
The strategy revolves around two primary conditions: breakout identification and risk management.
Breakout Identification:
Long Trade Setup: The strategy identifies bullish breakouts when:
The current candle's closing price is higher than the previous candle's closing price.
The high of the previous candle is greater than the highs of the two candles before it.
Short Trade Setup: The strategy identifies bearish breakouts when:
The current candle's closing price is lower than the previous candle's closing price.
The low of the previous candle is lower than the lows of the two candles before it.
Risk Management:
Stop-Loss: For each trade, a stop-loss is automatically set:
For long trades, the stop-loss is set to the low of the previous candle.
For short trades, the stop-loss is set to the high of the previous candle.
This ensures that losses are minimized if the breakout fails.
Exit Logic:
The trade is closed automatically when the stop-loss is hit.
This approach maintains discipline and prevents emotional trading.
Strategy Workflow
Entry Criteria:
Long Entry: A long trade is triggered when:
The current close is greater than the previous close.
The high of the previous candle exceeds the highs of the two candles before it.
Short Entry: A short trade is triggered when:
The current close is less than the previous close.
The low of the previous candle is below the lows of the two candles before it.
Stop-Loss Placement:
For long trades, the stop-loss is set at the low of the previous candle.
For short trades, the stop-loss is set at the high of the previous candle.
Trade Management:
Trades are exited automatically if the stop-loss level is hit.
The strategy avoids re-entering trades until new breakout conditions are met.
Default Settings
Position Sizing:
The default position size is set to 1% of the account equity. This ensures proper risk management and prevents overexposure to the market.
Stop-Loss:
Stop-loss levels are automatically calculated based on the previous candle’s high or low.
Timeframes:
The strategy is versatile and works across multiple timeframes. However, it is recommended to test it on 15-minute, 1-hour, and daily charts for optimal performance.
Key Features
Automated Trade Execution:
The strategy handles both trade entry and exit automatically based on pre-defined conditions.
Built-In Risk Management:
The automatic stop-loss placement ensures losses are minimized on failed breakouts.
Works Across Markets:
The strategy is compatible with a wide range of instruments, including indices, stocks, forex, and cryptocurrencies.
Clear Signals:
Entry and exit points are straightforward and based on objective conditions, reducing ambiguity.
Versatility:
Can be used for both day trading and swing trading, depending on the chosen timeframe.
Best Practices for Using This Strategy
Backtesting:
Test the strategy on your chosen instrument and timeframe using TradingView's Strategy Tester to evaluate its performance.
Market Conditions:
The strategy performs best in trending markets or during periods of high volatility. Avoid using it in range-bound or choppy markets.
Position Sizing:
Use the default position size (1% of equity) or adjust based on your risk tolerance and account size.
Instrument Selection:
Focus on instruments with good liquidity and volatility, such as indices (e.g., NIFTY, BANKNIFTY), forex pairs, or major cryptocurrencies (e.g., Bitcoin, Ethereum).
Potential Enhancements
To make the strategy even more robust, consider adding the following optional features:
Stop-Loss Multiplier:
Allow users to customize the stop-loss distance as a multiple of the default level (e.g., 1.5x the low or high of the previous candle).
Take-Profit Levels:
Add user-defined take-profit levels, such as a fixed risk-reward ratio (e.g., 1:2).
Time Filter:
Include an option to restrict trading to specific market hours (e.g., avoid low-liquidity times).
Conclusion
The Sunil 2 Bar Breakout Strategy is an excellent tool for traders looking to capitalize on breakout opportunities while maintaining disciplined risk management. Its simplicity, combined with its effectiveness, makes it suitable for traders of all experience levels. By adhering to the clearly defined rules, traders can achieve consistent results while avoiding emotional trading decisions.
This strategy is a reliable addition to any trader’s toolbox and is designed to work seamlessly across different market conditions and instruments.

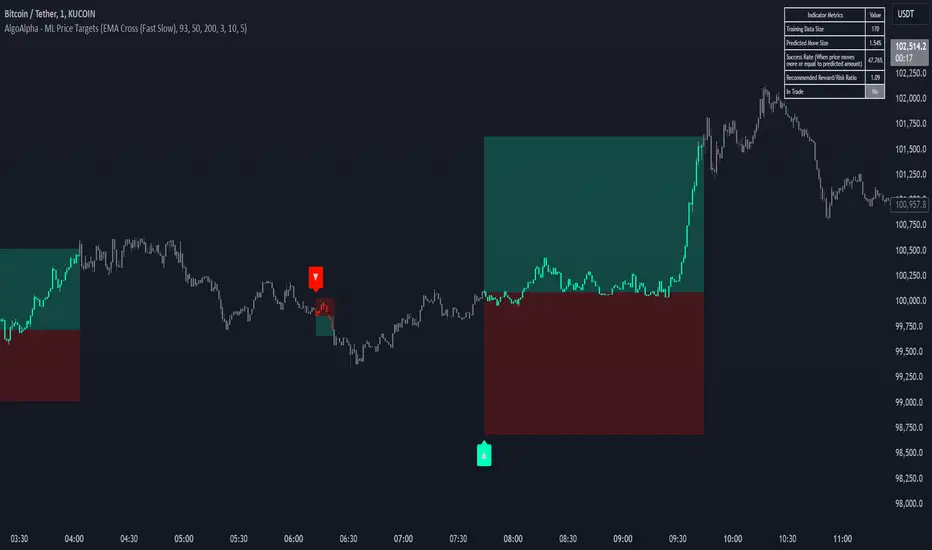
Machine Learning Price Target Prediction Signals [AlgoAlpha]Introducing the Machine Learning Price Target Predictions, a cutting-edge trading tool that leverages kernel regression to provide accurate price targets and enhance your trading strategy. This indicator combines trend-based signals with advanced machine learning techniques, offering predictive insights into potential price movements. Perfect for traders looking to make data-driven decisions with confidence.
What is Kernel Regression and How It Works
Kernel regression is a non-parametric machine learning technique that estimates the relationship between variables by weighting data points based on their similarity to a given input. The similarity is determined using a kernel function, such as the Gaussian (RBF) kernel, which assigns higher weights to closer data points and progressively lower weights to farther ones. This allows the model to make smooth and adaptive predictions, balancing recent data and historical trends.
Key Features
🎯 Predictive Price Targets : Uses kernel regression to estimate the magnitude of price movements.
📈 Dynamic Trend Analysis : Multiple trend detection methods, including EMA crossovers, Hull Moving Average, and SuperTrend.
🔧 Customizable Settings : Adjust bandwidth for kernel regression and tweak trend indicator parameters to suit your strategy.
📊 Visual Trade Levels : Displays take-profit and stop-loss levels directly on the chart with customizable colors.
📋 Performance Metrics : Real-time win rate, recommended risk-reward ratio, and training data size displayed in an on-chart table.
🔔 Alerts : Get notified for new trends, take-profit hits, and stop-loss triggers.
How to Use
🛠 Add the Indicator : Add it to your favorites and apply it to your chart. Configure the trend detection method (SuperTrend, HMA, or EMA crossover) and other parameters based on your preferences.
📊 Analyze Predictions : Observe the predicted move size, recommended risk-reward ratio, and trend direction. Use the displayed levels for trade planning.
🔔 Set Alerts : Enable alerts for trend signals, take-profit hits, or stop-loss triggers to stay informed without constant monitoring.
How It Works
The indicator calculates features such as price volatility, relative strength, and trend signals, which are stored during training periods. When a trend change is detected, the kernel regression model predicts the likely price move based on these features. Predictions are smoothed using the specified bandwidth to avoid overfitting while ensuring timely responses to feature changes. Visualized take-profit and stop-loss levels help traders optimize risk management. Real-time metrics like win rate and recommended risk-reward ratios provide actionable insights for decision-making.
metaconnectorLibrary "metaconnector"
metaconnector
buy_market_order(License_ID, symbol, lot)
Places a buy market order
Parameters:
License_ID (string) : Unique license ID of the user
symbol (string) : Trading symbol
lot (int) : Number of lots to buy
Returns: String syntax for the buy market order
sell_market_order(License_ID, symbol, lot)
Places a sell market order
Parameters:
License_ID (string) : Unique license ID of the user
symbol (string) : Trading symbol
lot (int) : Number of lots to sell
Returns: String syntax for the sell market order
buy_limit_order(License_ID, symbol, lot, price)
Places a buy limit order
Parameters:
License_ID (string) : Unique license ID of the user
symbol (string) : Trading symbol
lot (int) : Number of lots to buy
price (float) : Limit price for the order
Returns: String syntax for the buy limit order
sell_limit_order(License_ID, symbol, lot, price)
Places a sell limit order
Parameters:
License_ID (string) : Unique license ID of the user
symbol (string) : Trading symbol
lot (int) : Number of lots to sell
price (float) : Limit price for the order
Returns: String syntax for the sell limit order
stoploss_for_buy_order(License_ID, symbol, lot, stoploss_price)
Places a stop-loss order for a buy position
Parameters:
License_ID (string) : Unique license ID of the user
symbol (string) : Trading symbol
lot (int) : Number of lots to buy
stoploss_price (float)
Returns: String syntax for the buy stop-loss order
stoploss_for_sell_order(License_ID, symbol, lot, stoploss_price)
Places a stop-loss order for a sell position
Parameters:
License_ID (string) : Unique license ID of the user
symbol (string) : Trading symbol
lot (int) : Number of lots to sell
stoploss_price (float)
Returns: String syntax for the sell stop-loss order
takeprofit_for_buy_order(License_ID, symbol, lot, target_price)
Places a take-profit order for a buy position
Parameters:
License_ID (string) : Unique license ID of the user
symbol (string) : Trading symbol
lot (int) : Number of lots to buy
target_price (float)
Returns: String syntax for the buy take-profit order
takeprofit_for_sell_order(License_ID, symbol, lot, target_price)
Places a take-profit order for a sell position
Parameters:
License_ID (string) : Unique license ID of the user
symbol (string) : Trading symbol
lot (int) : Number of lots to sell
target_price (float)
Returns: String syntax for the sell take-profit order
buy_stop_order(License_ID, symbol, lot, price)
Places a buy stop order above the current market price
Parameters:
License_ID (string) : Unique license ID of the user
symbol (string) : Trading symbol
lot (int) : Number of lots to buy
price (float) : Stop order price
Returns: String syntax for the buy stop order
sell_stop_order(License_ID, symbol, lot, price)
Places a sell stop order below the current market price
Parameters:
License_ID (string) : Unique license ID of the user
symbol (string) : Trading symbol
lot (int) : Number of lots to sell
price (float) : Stop order price
Returns: String syntax for the sell stop order
close_all_positions(License_ID, symbol)
Closes all positions for a specific symbol
Parameters:
License_ID (string) : Unique license ID of the user
symbol (string) : Trading symbol
Returns: String syntax for closing all positions
close_buy_positions(License_ID, symbol)
Closes all buy positions for a specific symbol
Parameters:
License_ID (string) : Unique license ID of the user
symbol (string) : Trading symbol
Returns: String syntax for closing all buy positions
close_sell_positions(License_ID, symbol)
Closes all sell positions for a specific symbol
Parameters:
License_ID (string) : Unique license ID of the user
symbol (string) : Trading symbol
Returns: String syntax for closing all sell positions
close_partial_buy_position(License_ID, symbol, lot)
Closes a partial buy position for a specific symbol
Parameters:
License_ID (string) : Unique license ID of the user
symbol (string) : Trading symbol
lot (int) : Number of lots to close
Returns: String syntax for closing a partial buy position
close_partial_sell_position(License_ID, symbol, lot)
Closes a partial sell position for a specific symbol
Parameters:
License_ID (string) : Unique license ID of the user
symbol (string) : Trading symbol
lot (int) : Number of lots to close
Returns: String syntax for closing a partial sell position

Bitcoin 1H-15M Breakout StrategyKey Features
1H and 15M Timeframes:
The script uses the 1-hour timeframe for the range and 15-minute timeframe for breakout conditions.
request.security is used to fetch the higher timeframe data.
Risk Management:
Variables entry_price, sl_price, and tp_price are declared explicitly as float with na initialization to handle dynamic assignment.
Stop-loss and take-profit levels are calculated based on the specified Risk-Reward Ratio (RRR) and buffer (in pips).
Trade Logic:
Long trade triggered when the 15-minute candle closes above the 1-hour high.
Short trade triggered when the 15-minute candle closes below the 1-hour low.
Visualization:
The range_high and range_low (previous 1-hour high and low) are plotted on the chart using dashed lines.
Debugging:
Enabling the show_debug input displays labels showing stop-loss and take-profit values for easier troubleshooting.

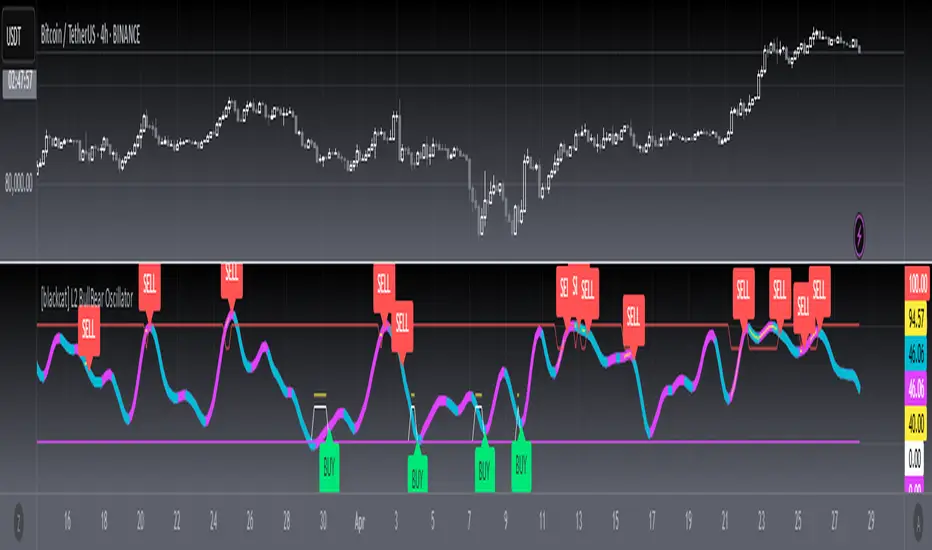
[blackcat] L2 BullBear OscillatorOVERVIEW
The " L2 BullBear Oscillator" is a custom trading indicator for TradingView that helps traders identify market trends, potential tops and bottoms, and the strength of trends using various moving averages and price relationships.
FEATURES
Calculates a base oscillator based on the close price relative to the highest and lowest prices over the past 60 periods.
Smoothes the oscillator using exponential moving averages (EMAs).
Determines market strength through relative strength indicators and moving averages.
Identifies potential tops and strong support levels based on specific conditions involving oscillators and price actions.
Plots several signals to help traders make informed decisions.
HOW TO USE
Install the script on your TradingView chart.
Customize the settings in the "Inputs" section:
Set the periods for the short-term and long-term EMAs.
Set the periods for the three SMAs used in calculations.
Interpret the plots:
BullBear Signal (Fuchsia Line): Indicates the overall market trend. Uptrends suggest buying opportunities, while downtrends suggest selling.
Decreasing BullBear Signal (Aqua Line): Highlights periods when the trend is weakening or turning bearish, signaling possible selling opportunities.
Potential Top Condition (Yellow Plot): Signals possible trend reversals from bullish to bearish, indicating times to consider taking profits or preparing for a downtrend.
High Price Condition (Yellow Plot): Indicates strong bullish momentum but also potentially overbought conditions, which might precede a correction.
Earning Condition (Red Line): Possibly signifies strong bullish signals, indicating good times to enter long positions.
Strong Support Condition (White Arrows): Signals potential bottoms or support levels, indicating buying opportunities.
Start Hiding Condition (Fuchsia Plot): Might indicate times to exit positions or reduce exposure due to unfavorable market conditions.
ALGORITHMS
Moving Averages:
Simple Moving Averages (SMAs): Used to calculate averages of price data over specified periods.
Exponential Moving Averages (EMAs): Used to give more weight to recent prices, making the moving averages more responsive to new data.
Oscillator Calculation:
The base oscillator is calculated based on the close price's position within the highest and lowest prices over 60 periods, normalized to a 0-100 scale.
This oscillator is then smoothed using EMAs to reduce noise and make trends more visible.
Relative Strength Indicator:
Calculated based on the close price's position within the highest and lowest prices over 20 periods, also normalized to a 0-100 scale.
This is smoothed using SMAs to get a more stable signal.
Condition Checks:
Various conditions are checked to identify potential tops, strong support, and other market states based on the relationships between these indicators and price actions.
LIMITATIONS
The script is based on historical data and does not guarantee future performance.
It is recommended to use the script in conjunction with other analysis tools.
The effectiveness of the strategy may vary depending on the market conditions and asset being traded.
NOTES
The script is designed for educational purposes and should not be considered financial advice.
Users are encouraged to backtest the strategy on a demo account before applying it to live trades.
THANKS
Special thanks to the TradingView community for their support and feedback.
Enhanced VIP-like IndicatorSettings Breakdown Tutorial: Optimizing a Trading Strategy
This guide explains the key trading strategy settings and how to customize them based on your trading style and goals. Each parameter is essential for tailoring the strategy to market conditions and your risk appetite.
1. Short Moving Average Length (Default: 9)
• Purpose: Tracks short-term trends using a small number of candles.
• Settings Tips:
• Smaller Values (e.g., 9): Quickly react to price changes, useful for fast-moving markets.
• Larger Values (e.g., 12-15): Generate smoother signals for less volatile trades.
2. Long Moving Average Length (Default: 21)
• Purpose: Identifies long-term trends.
• Settings Tips:
• Higher Values (e.g., 50): Spot broader trends at the expense of slower signals.
• Trend Analysis: The interaction of short and long MAs helps determine bullish or bearish trends (e.g., bullish when short MA crosses above long MA).
3. Higher Timeframe MA Length (Default: 200)
• Purpose: Filters long-term trends on a higher timeframe (e.g., daily).
• Settings Tips:
• 200 Periods: Standard for defining bullish (price above) or bearish (price below) markets.
• Adjustable: Use 100 for faster responses or stick with 200 for reliability.
4. Higher Timeframe (Default: 1 Day)
• Purpose: Defines the timeframe for the higher moving average.
• Settings Tips:
• Shorter Timeframes (e.g., 4 Hours): More frequent trading signals.
• Daily Timeframe: Best for swing trading and identifying macro trends.
5. RSI Length (Default: 14)
• Purpose: Measures momentum over a specific number of candles.
• Settings Tips:
• Lower Values (e.g., 7): More sensitive to price changes, ideal for quick trades.
• Higher Values (e.g., 20): Smooth signals for more stable markets.
6. RSI Overbought (70) and Oversold (30) Levels
• Purpose: Marks thresholds for overbought and oversold conditions.
• Settings Tips:
• Stricter Levels (e.g., 80/20): Fewer, higher-quality signals.
• Looser Levels (e.g., 65/35): More frequent signals, suitable for active trading.
7. Pivot Left Bars (5) and Pivot Right Bars (5)
• Purpose: Confirms pivot points (support/resistance) based on surrounding candles.
• Settings Tips:
• Higher Values (e.g., 10): Stronger but less frequent pivot points.
• Lower Values: More responsive, for traders seeking quick pivots.
8. Take Profit Percentage (Default: 2%)
• Purpose: Defines the profit level to exit trades.
• Settings Tips:
• Higher Values (e.g., 5%): For swing traders holding positions longer.
• Lower Values (e.g., 1%): For scalpers focusing on quick trades.
9. Minimum Volume (Default: 1,000,000)
• Purpose: Ensures sufficient liquidity for trading.
• Settings Tips:
• Lower Values: For lower-volume markets.
• Higher Values: Reduces risk in high-liquidity assets.
10. Stop Loss Percentage (Default: 1%)
• Purpose: Sets the maximum acceptable loss per trade.
• Settings Tips:
• Lower Values (e.g., 0.5%): Reduces risk, suited for conservative trading.
• Higher Values (e.g., 2%): Allows more price fluctuation, ideal for volatile markets.
11. Entry Conditions
• Options:
• MA Crossover & RSI: Combines trend-following and momentum for well-rounded signals.
• Pivot Breakout: Focuses on support/resistance breakouts for high-impact trades.
• Settings Tips:
• Trend-Following Traders: Use MA Crossover & RSI.
12. Exit Conditions
• Options:
• Opposite Signal: Exits when the trade’s opposite condition occurs (e.g., bullish to bearish).
• Fixed Take Profit/Stop Loss: Exits based on predefined profit/loss thresholds.
• Settings Tips:
• Opposite Signal: Ideal for trend-following strategies.
Summary
Customizing these settings aligns the strategy with your trading goals. Test configurations in a demo environment before live trading to refine the approach and optimize results. Always balance profit potential with risk management.
• Fixed Levels: Better for strict risk management.
• Breakout Traders: Opt for Pivot Breakout.

Stop Loss & TargetHow to Use the SL/TP Indicator
The SL/TP indicator is a versatile tool designed for traders to easily visualize entry, stop-loss (SL), and take-profit (TP) levels on their charts. This guide will walk you through the steps to configure and use the indicator effectively.
Features:
Configure Long Trades and Short Trades independently.
Define Entry Price, Stop Loss, and up to three Take Profit levels for each trade.
Customize line colors for better visualization.
Works for both risk-reward and target-based trading.
Adding the Indicator:
Open the TradingView platform.
Search for the indicator name: SL/TP.
Click the Add to Chart button to apply it.
Configuration:
1. Long Trade Settings
Enable Long Trade: Check this option to activate long trade lines on the chart.
Long Entry Price: Input the price at which you plan to enter the long trade.
Long Stop Loss: Input your stop-loss level for the long trade.
Line Colors: You can customize the colors for the Entry, SL, and TP lines in the Long Trade settings group.
Take Profit Levels (Calculated Automatically):
TP1: 1:1 Risk-Reward ratio (difference between Entry and SL added to Entry).
TP2: 1:2 Risk-Reward ratio.
TP3: 1:3 Risk-Reward ratio.
2. Short Trade Settings
Enable Short Trade: Check this option to activate short trade lines on the chart.
Short Entry Price: Input the price at which you plan to enter the short trade.
Short Stop Loss: Input your stop-loss level for the short trade.
Line Colors: You can customize the colors for the Entry, SL, and TP lines in the Short Trade settings group.
Take Profit Levels (Calculated Automatically):
TP1: 1:1 Risk-Reward ratio (difference between Entry and SL subtracted from Entry).
TP2: 1:2 Risk-Reward ratio.
TP3: 1:3 Risk-Reward ratio.
Visualizing on the Chart:
Once you configure the settings and enable the trade, the indicator will draw horizontal lines on the chart for:
Entry Price
Stop Loss
Take Profit Levels (TP1, TP2, TP3)
Each line will extend to three bars ahead of the current bar index.
Customization:
Adjust colors for better visibility depending on your chart theme.
The width and style of lines can also be modified in the source code if needed.
Example Usage:
Long Trade Example:
Enable Long Trade: Check the box.
Set Entry Price: 100.
Set Stop Loss: 95.
The indicator will draw the following lines:
Entry Line: At 100 (customizable color).
Stop Loss Line: At 95 (customizable color).
TP1 Line: At 105 (1:1 Risk-Reward).
TP2 Line: At 110 (1:2 Risk-Reward).
TP3 Line: At 115 (1:3 Risk-Reward).
Short Trade Example:
Enable Short Trade: Check the box.
Set Entry Price: 200.
Set Stop Loss: 205.
The indicator will draw the following lines:
Entry Line: At 200 (customizable color).
Stop Loss Line: At 205 (customizable color).
TP1 Line: At 195 (1:1 Risk-Reward).
TP2 Line: At 190 (1:2 Risk-Reward).
TP3 Line: At 185 (1:3 Risk-Reward).
Notes:
Ensure that you input valid and realistic price levels for Entry and Stop Loss.
The indicator will only display lines if both the Entry Price and Stop Loss are non-zero.
Use this indicator for planning trades visually but always confirm levels with your trading strategy.
Disclaimer: This indicator is a tool to assist in trading. Use it with proper risk management and your own due diligence.

Autonomous 5-Minute RobotKey Components of the Strategy:
Trend Detection:
A 50-period simple moving average (SMA) is used to define the market trend. If the current close is above the SMA, the market is considered to be in an uptrend (bullish), and if it's below, it's considered a downtrend (bearish).
The strategy also looks at the trend over the last 30 minutes (6 candles in a 5-minute chart). The strategy compares the previous close with the current close to detect an uptrend or downtrend.
Volume Analysis:
The strategy calculates buyVolume and sellVolume based on price movement within each candle.
The condition for entering a long position is when the market is in an uptrend, and the buy volume is greater than the sell volume.
The condition for entering a short position is when the market is in a downtrend, and the sell volume is greater than the buy volume.
Trade Execution:
The strategy enters a long position when the trend is up and the buy volume is higher than the sell volume.
The strategy enters a short position when the trend is down and the sell volume is higher than the buy volume.
Positions are closed based on stop-loss and take-profit conditions.
Stop-loss is set at 3% below the entry price.
Take-profit is set at 29% above the entry price.
Exit Conditions:
Long trades will be closed if the price falls 3% below the entry price or rises 29% above the entry price.
Short trades will be closed if the price rises 3% above the entry price or falls 29% below the entry price.
Visuals:
The SMA (50-period) is plotted on the chart to show the trend.
Buy and sell signals are marked with labels on the chart for easy identification.
With this being said this algo is still being worked on to be autonomous
Analyze the Market Direction: Determine whether the market is in an uptrend or downtrend over the past 30 minutes (using the last 6 candles in a 5-minute chart).
Use Trend Indicators and Volume: Implement trend-following indicators like moving averages or the SMA/EMA crossover and consider volume to decide when to enter or exit a trade.
Enter and Exit Trades: The robot will enter long positions when the trend is up and short positions when the trend is down. Additionally, it will close positions based on volume signals and price action (e.g., volume spikes, price reversals).

Poisson Projection of Price Levels### **Poisson Projection of Price Levels**
**Overview:**
The *Poisson Projection of Price Levels* is a cutting-edge technical indicator designed to identify and visualize potential support and resistance levels based on historical price interactions. By leveraging the Poisson distribution, this tool dynamically adjusts the significance of each price level's past "touches" to project future interactions with varying degrees of probability. This probabilistic approach offers traders a nuanced view of where price levels may hold or react in upcoming bars, enhancing both analysis and trading strategies.
---
**🔍 **Math & Methodology**
1. **Strata Levels:**
- **Definition:** Strata are horizontal lines spaced evenly around the current closing price.
- **Calculation:**
\
where \(i\) ranges from 0 to \(\text{Strata Count} - 1\).
2. **Forecast Iterations:**
- **Structure:** The indicator projects five forecast iterations into the future, each spaced by a Fibonacci sequence of bars: 2, 3, 5, 8, and 13 bars ahead. This spacing is inspired by the Fibonacci sequence, which is prevalent in financial market analysis for identifying key levels.
- **Purpose:** Each iteration represents a distinct forecast point where the price may interact with the strata, allowing for a multi-step projection of potential price levels.
3. **Touch Counting:**
- **Definition:** A "touch" occurs when the closing price of a bar is within half the increment of a stratum level.
- **Process:** For each stratum and each forecast iteration, the indicator counts the number of touches within a specified lookback window (e.g., 80 bars), offset by the forecasted position. This ensures that each iteration's touch count is independent and contextually relevant to its forecast horizon.
- **Adjustment:** Each forecast iteration analyzes a unique segment of the lookback window, offset by its forecasted position to ensure independent probability calculations.
4. **Poisson Probability Calculation:**
- **Formula:**
\
\
- **Interpretation:** \(p(k=1)\) represents the probability of exactly one touch occurring within the lookback window for each stratum and iteration.
- **Application:** This probability is used to determine the transparency of each stratum line, where higher probabilities result in more opaque (less transparent) lines, indicating stronger historical significance.
5. **Transparency Mapping:**
- **Calculation:**
\
- **Purpose:** Maps the Poisson probability to a visual transparency level, enhancing the readability of significant strata levels.
- **Outcome:** Strata with higher probabilities (more historical touches) appear more opaque, while those with lower probabilities appear fainter.
---
**📊 **Comparability to Standard Techniques**
1. **Support and Resistance Levels:**
- **Traditional Approach:** Traders identify support and resistance based on historical price reversals, pivot points, or psychological price levels.
- **Poisson Projection:** Automates and quantifies this process by statistically analyzing the frequency of price interactions with specific levels, providing a probabilistic measure of significance.
2. **Statistical Modeling:**
- **Standard Models:** Techniques like Moving Averages, Bollinger Bands, or Fibonacci Retracements offer dynamic and rule-based levels but lack direct probabilistic interpretation.
- **Poisson Projection:** Introduces a discrete event probability framework, offering a unique blend of statistical rigor and visual clarity that complements traditional indicators.
3. **Event-Based Analysis:**
- **Financial Industry Practices:** Event studies and high-frequency trading models often use Poisson processes to model order arrivals or price jumps.
- **Indicator Application:** While not identical, the use of Poisson probabilities in this indicator draws inspiration from event-based modeling, applying it to the context of price level interactions.
---
**💡 **Strengths & Advantages**
1. **Innovative Visualization:**
- Combines statistical probability with traditional support/resistance visualization, offering a fresh perspective on price level significance.
2. **Dynamic Adaptability:**
- Parameters like strata increment, lookback window, and probability threshold are user-defined, allowing customization across different markets and timeframes.
3. **Independent Probability Calculations:**
- Each forecast iteration calculates its own Poisson probability, ensuring that projections are contextually relevant and independent of other iterations.
4. **Clear Visual Cues:**
- Transparency-based coloring intuitively highlights significant price levels, making it easier for traders to identify key areas of interest at a glance.
---
**⚠️ **Limitations & Considerations**
1. **Poisson Assumptions:**
- Assumes that touches occur independently and at a constant average rate (\(\lambda\)), which may not always align with market realities characterized by trends and volatility clustering.
2. **Computational Intensity:**
- Managing multiple iterations and strata can be resource-intensive, potentially affecting performance on lower-powered devices or with very high lookback windows.
3. **Interpretation Complexity:**
- While transparency offers visual clarity, understanding the underlying probability calculations requires a basic grasp of Poisson statistics, which may be a barrier for some traders.
---
**📢 **How to Use It**
1. **Add to TradingView:**
- Open TradingView and navigate to the Pine Script Editor.
- Paste the script above and click **Add to Chart**.
2. **Configure Inputs:**
- **Strata Increment:** Set the desired price step between strata (e.g., `0.1` for 10 cents).
- **Lookback Window:** Define how many past bars to consider for calculating Poisson probabilities (e.g., `80`).
- **Probability Transparency Threshold (%):** Set the threshold percentage to map probabilities to line transparency (e.g., `25%`).
3. **Understand the Forecast Iterations:**
- The indicator projects five forecast points into the future at bar spacings of 2, 3, 5, 8, and 13 bars ahead.
- Each iteration independently calculates its Poisson probability based on the touch counts within its specific lookback window offset by its forecasted position.
4. **Interpret the Visualization:**
- **Opaque Lines:** Indicate higher Poisson probabilities, suggesting historically significant price levels that are more likely to interact again.
- **Fainter Lines:** Represent lower probabilities, indicating less historically significant levels that may be less likely to interact.
- **Forecast Spacing:** The spacing of 2, 3, 5, 8, and 13 bars ahead aligns with Fibonacci principles, offering a natural progression in forecast horizons.
5. **Apply to Trading Strategies:**
- **Support/Resistance Identification:** Use the opaque lines as potential support and resistance levels for placing trades.
- **Entry and Exit Points:** Anticipate price interactions at forecasted levels to plan strategic entries and exits.
- **Risk Management:** Utilize the transparency mapping to determine where to place stop-loss and take-profit orders based on the probability of price interactions.
6. **Customize as Needed:**
- Adjust the **Strata Increment** to fit different price ranges or volatility levels.
- Modify the **Lookback Window** to capture more or fewer historical touches, adapting to different timeframes or market conditions.
- Tweak the **Probability Transparency Threshold** to control the sensitivity of transparency mapping to Poisson probabilities.
**📈 **Practical Applications**
1. **Identifying Key Levels:**
- Quickly visualize which price levels have historically had significant interactions, aiding in the identification of potential support and resistance zones.
2. **Forecasting Price Reactions:**
- Use the forecast iterations to anticipate where price may interact in the near future, assisting in planning entry and exit points.
3. **Risk Management:**
- Determine areas of high probability for price reversals or consolidations, enabling better placement of stop-loss and take-profit orders.
4. **Market Analysis:**
- Assess the strength of market levels over different forecast horizons, providing a multi-layered understanding of market structure.
---
**🔗 **Conclusion**
The *Poisson Projection of Price Levels* bridges the gap between statistical modeling and traditional technical analysis, offering traders a sophisticated tool to quantify and visualize the significance of price levels. By integrating Poisson probabilities with dynamic transparency mapping, this indicator provides a unique and insightful perspective on potential support and resistance zones, enhancing both analysis and trading strategies.
---
**📞 **Contact:**
For support or inquiries, please contact me on TradingView!
---
**📢 **Join the Conversation!**
Have questions, feedback, or suggestions for further enhancements? Feel free to comment below or reach out directly. Your input helps refine and evolve this tool to better serve the trading community.
---
**Happy Trading!** 🚀

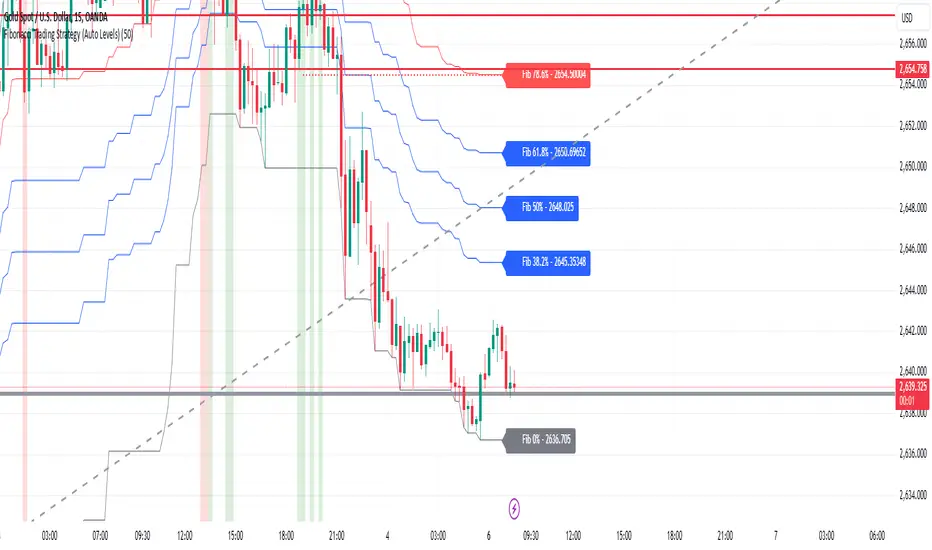
Fibonacci Trading Strategy (Auto Levels)How It Works
Swing Highs and Lows Detection:
The script identifies the highest high and lowest low over a specified lookback period (default: 50 candles). These points are used as the basis for Fibonacci calculations.
Fibonacci Levels:
Fibonacci retracement levels: 0%, 38.2%, 50%, 61.8%, 78.6%, and 100%.
Fibonacci extension levels: 127.2%, 161.8%, 200%, 261.8%, and 361.8%.
Each level is plotted on the chart with a specific color and labeled with the corresponding price.
Entry Zones:
Pullback Area: Between the 50% and 61.8% retracement levels. This area is highlighted in green, indicating a potential entry for conservative traders.
Full Margin Area: Between the 61.8% and 78.6% retracement levels. This area is highlighted in red, suggesting a higher-risk entry for aggressive traders.
Stop Loss (SL):
The Stop Loss is placed at the 78.6% Fibonacci retracement level. A dotted red line is drawn at this level to provide a visual reference for risk management.
Entry labels include the Stop Loss price for clarity.
Take Profit (TP) Levels:
Multiple take-profit targets are identified using Fibonacci extension levels (127.2%, 161.8%, 200%, 261.8%, and 361.8%).
Each level is labeled with the price and target percentage.
Visual Aids:
The script dynamically labels each Fibonacci level with its corresponding price.
Entry points (Pullback and Full Margin) are marked with clear labels, including the recommended Stop Loss.
Background highlights help distinguish the Pullback and Full Margin areas.
Strategy Highlights
Risk Management:
Incorporates a well-defined Stop Loss at the 78.6% level to limit downside risk.
Multiple take-profit levels help traders scale out of positions gradually.
Automation:
Automatically recalculates levels when new swing highs or lows are detected, ensuring accuracy in dynamic markets.
Customizability:
Users can adjust the lookback period to suit different timeframes or trading styles.
Clarity:
Clean visuals and detailed labels ensure the strategy is easy to interpret and apply.
When to Use
The strategy is suitable for trend-following traders looking to enter during pullbacks in an established trend.
It works best in trending markets where Fibonacci levels often act as strong support or resistance.
Example Scenario
Bullish Setup:
Price retraces to the 50%-61.8% area (Pullback Area) after a swing high.
A buy order is placed in this zone, with the Stop Loss at the 78.6% level.
Profit targets are set at the 127.2%, 161.8%, and higher Fibonacci extensions.
Bearish Setup:
In a downtrend, price retraces upward to the 50%-61.8% zone.
A sell order is placed, with the Stop Loss at the 78.6% level and take-profit levels below.
Average Candle RangeThis indicator calculates and displays the average trading range of candles over a specified period, helping traders identify volatility patterns and potential trading opportunities.
Features:
- Customizable lookback period (1-500 bars)
- Clean visual display in a top-right table overlay
- High-precision calculation showing 10 decimal places
- Real-time updates with each new bar
How it Works:
The indicator calculates the range of each candle (High - Low) and then computes the Simple Moving Average (SMA) of these ranges over your specified lookback period. The result is displayed in an easy-to-read table overlay.
Use Cases:
- Volatility Analysis: Monitor market volatility trends
- Position Sizing: Help determine position sizes based on average price movements
- Trading Strategy Development: Use as a reference for setting stop losses and take profits
- Market Phase Identification: Help identify high vs low volatility market phases
Settings:
- Lookback Period: Default is 140 bars, adjustable from 1 to 500
Note:
The indicator displays values with 10 decimal places for high-precision analysis, particularly useful in markets with small price movements.

PreannFXExplanation of the PreannFX indicator:
Candle Body Size:
The body of the current candle is larger than the previous candle.
Bullish Engulfing:
The current candle closes higher than the previous candle's high.
The body size is larger than the previous candle.
Bearish Engulfing:
The current candle closes lower than the previous candle's low.
The body size is larger than the previous candle.
Entry and Exit:
Bullish: Enter at the previous candle's open or high, stop loss at the previous low, and take profit is 1:1 with the stop loss.
Bearish: Enter at the previous candle's open or low, stop loss at the previous high, and take profit is 1:1 with the stop loss.
Visualization:
Green upward arrows for bullish engulfing patterns.
Red downward arrows for bearish engulfing patterns.

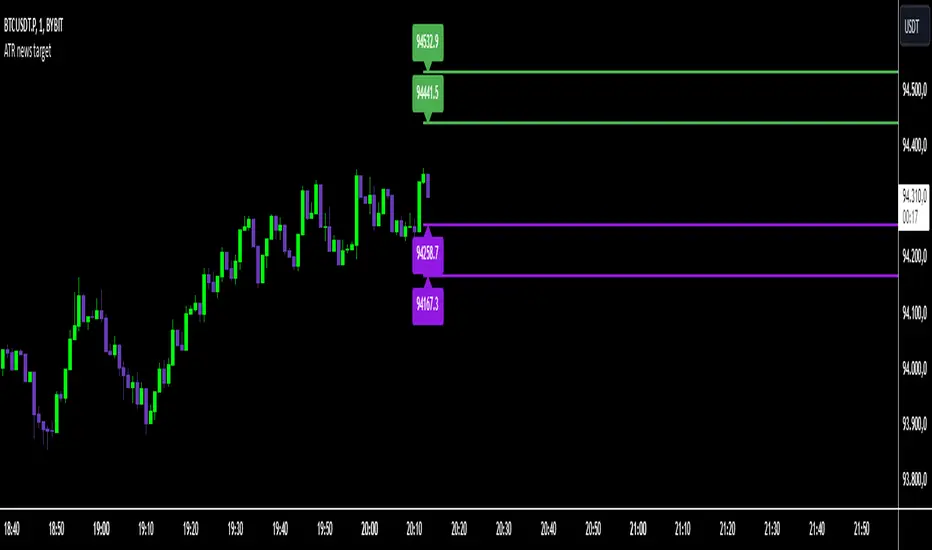
ATR news targetThis indicator is based on the calculation of the ATR and the use of multipliers to define specific price levels. It is crucial that it is fixed to the price axis.
During periods of high volatility, such as during the release of macroeconomic data, it is essential to understand the magnitude of price movements.
By multiplying the ATR (customizable period) by specific multipliers (customizable variables), exit targets (stop loss and take profit) are determined based on the current volatility, ensuring greater adaptability to the market.
The directionality will be determined by the news, but thanks to the indicator (calculated on the last closed candle), you will have the ability to precisely determine stop loss, take profit, and retracement points.
Adaptive Range Scalper - KetBotAIThe Adaptive Scalper is designed to dynamically adjust entry, take-profit (TP), and stop-loss (SL) levels based on the latest market price. It combines multiple tools to provide traders with actionable insights, suitable for a range of trading styles and timeframes.
How the Indicator Works
Dynamic Levels:
- Yellow Dotted Line: Represents the entry level, following the latest price dynamically.
- Green Line: The Take Profit (TP) level, calculated as a multiple of the current price, adapts in real-time.
- Red Line: The Stop Loss (SL) level, placed below the price and also dynamically adjusts.
Bollinger Bands:
Provides context for market volatility and potential overbought/oversold zones.
Narrowing bands signal consolidation, while expanding bands indicate increased volatility.
Buy and Sell Signals:
Buy Signal: Triggered when the price crosses above the lower Bollinger Band.
Sell Signal: Triggered when the price crosses below the upper Bollinger Band.
These signals help traders time entries and exits based on momentum shifts.
Risk/Reward Analysis:
Visual shading shows the favorable risk/reward zone between the stop loss and take profit levels.
Timeframe Suggestions
Short-Term Traders (Scalping):
Use on 5-minute to 15-minute charts.
Focus on high-volatility periods for quick entries and exits.
Intraday Traders:
Ideal for 30-minute to 1-hour charts.
Provides more stable signals and less noise.
Swing Traders:
Best suited for 4-hour or daily charts.
Captures broader trends with fewer signals, allowing for larger moves.
Tool Combination
Volume Profile:
Combine with volume-based tools to confirm key support/resistance zones around TP and SL levels.
Trend Indicators:
Use with Moving Averages (e.g., 20-period or 50-period) to identify the broader trend direction.
Example: Only take buy signals in an uptrend and sell signals in a downtrend.
Momentum Oscillators:
Pair with tools like RSI or MACD to avoid entering overbought/oversold conditions.
Support/Resistance Lines:
Manually mark significant levels to confirm alignment with the indicator’s TP and SL zones.
Useful Advice for Traders
Risk Management:
- Always assess the risk/reward ratio; aim for at least 1:2 (risking 1 to gain 2).
- Adjust the multiplier to match your trading style (e.g., higher multiplier for swing trades, lower for scalping).
Avoid Overtrading:
Use the indicator in conjunction with clear rules to avoid false signals during low-volatility periods.
Monitor market volatility:
Pay attention to narrowing Bollinger Bands, which signal consolidations. Avoid trading until a breakout occurs.
Test on Demo Accounts:
Practice using the indicator on a demo account to understand its behavior across different assets and timeframes.
Focus on High-Liquidity Markets:
For the best results, trade highly liquid instruments like major currency pairs, gold, or stock indices.
Summary
The Adaptive Range Indicator dynamically adjusts to market conditions, offering clear entry and exit levels. By combining it with Bollinger Bands and other tools, traders can better navigate market trends and avoid noise. It’s versatile across multiple timeframes and assets, making it a valuable addition to any trader’s toolkit.

Smart Wick Concept (SWC)Smart Wick Concept (SWC)
The Smart Wick Concept (SWC) is a unique trend-following strategy designed to capture precise entry points in trending markets. This indicator identifies trade opportunities based on higher timeframe trends and wick behavior on lower timeframes, making it an effective tool for intraday and swing traders.
Key Features:
Trend Identification:
SWC uses the H1 timeframe to define the primary market trend (bullish or bearish), ensuring alignment with the overall market direction.
Precise Entry Signals:
Entry opportunities are generated on the M15 timeframe when a candle's wick interacts with the prior candle's range. This approach minimizes false signals and enhances accuracy.
Stop Loss and Take Profit Levels:
The indicator automatically calculates suggested stop loss and take profit levels based on market dynamics, providing traders with a clear risk-reward framework.
Customizable Parameters:
SWC allows traders to adjust key settings, such as the higher timeframe and minimum trend range, to align with their trading preferences and market conditions.
How It Works:
Bullish Entry:
Higher timeframe trend must be bullish.
A M15 candle must dip below the previous candle’s low and close back above it, signaling a potential buy opportunity.
Bearish Entry:
Higher timeframe trend must be bearish.
A M15 candle must exceed the previous candle’s high and close back below it, signaling a potential sell opportunity.
Risk Management:
Stop loss is placed at the low (for buys) or high (for sells) of the current M15 candle.
Take profit targets are calculated at twice the risk, ensuring a favorable risk-reward ratio.
Benefits:
Aligns trades with market momentum.
Reduces noise by filtering out weak or sideways trends.
Provides a structured approach to trading XAUUSD and other volatile instruments.
Use Cases:
The Smart Wick Concept is ideal for traders looking for a disciplined and data-driven approach to trading. While it is optimized for XAUUSD, it can also be applied to other trending markets such as major currency pairs or indices with some parameter adjustments.
Disclaimer:
This indicator is a trading tool and should not be used as a standalone strategy. Always backtest the indicator thoroughly and use proper risk management to protect your capital. Past performance does not guarantee future results.

Mean Reversion V-FThis strategy workings on high volatile stock or crypto assets
It using 5 dynamic band's to get in the long position.
In same time depends on the band increases the units of the asset to get in the next position.
The unit's of the asset can be adjusted. Make sure to adjust the unit for different asset.
The bands are determined of main SMA.
There is no stop loss.
Take profit is trialing - HMA or % or average price + take profit - note if you use % trailing back test is not realistic but is working on real time.
Deviations can be adjust depends on the asset volatility.

EMA RSI Trend Reversal Ver.1Overview:
The EMA RSI Trend Reversal indicator combines the power of two well-known technical indicators—Exponential Moving Averages (EMAs) and the Relative Strength Index (RSI)—to identify potential trend reversal points in the market. The strategy looks for key crossovers between the fast and slow EMAs, and uses the RSI to confirm the strength of the trend. This combination helps to avoid false signals during sideways market conditions.
How It Works:
Buy Signal:
The Fast EMA (9) crosses above the Slow EMA (21), indicating a potential shift from a downtrend to an uptrend.
The RSI is above 50, confirming strong bullish momentum.
Visual Signal: A green arrow below the price bar and a Buy label are plotted on the chart.
Sell Signal:
The Fast EMA (9) crosses below the Slow EMA (21), indicating a potential shift from an uptrend to a downtrend.
The RSI is below 50, confirming weak or bearish momentum.
Visual Signal: A red arrow above the price bar and a Sell label are plotted on the chart.
Key Features:
EMA Crossovers: The Fast EMA crossing above the Slow EMA signals potential buying opportunities, while the Fast EMA crossing below the Slow EMA signals potential selling opportunities.
RSI Confirmation: The RSI helps confirm trend strength—values above 50 indicate bullish momentum, while values below 50 indicate bearish momentum.
Visual Cues: The strategy uses green arrows and red arrows along with Buy and Sell labels for clear visual signals of when to enter or exit trades.
Signal Interpretation:
Green Arrow / Buy Label: The Fast EMA (9) has crossed above the Slow EMA (21), and the RSI is above 50. This is a signal to buy or enter a long position.
Red Arrow / Sell Label: The Fast EMA (9) has crossed below the Slow EMA (21), and the RSI is below 50. This is a signal to sell or exit the long position.
Strategy Settings:
Fast EMA Length: Set to 9 (this determines how sensitive the fast EMA is to recent price movements).
Slow EMA Length: Set to 21 (this smooths out price movements to identify the broader trend).
RSI Length: Set to 14 (default setting to track momentum strength).
RSI Level: Set to 50 (used to confirm the strength of the trend—above 50 for buy signals, below 50 for sell signals).
Risk Management (Optional):
Use take profit and stop loss based on your preferred risk-to-reward ratio. For example, you can set a 2:1 risk-to-reward ratio (2x take profit for every 1x stop loss).
Backtesting and Optimization:
Backtest the strategy on TradingView by opening the Strategy Tester tab. This will allow you to see how the strategy would have performed on historical data.
Optimization: Adjust the EMA lengths, RSI period, and risk-to-reward settings based on your asset and time frame.
Limitations:
False Signals in Sideways Markets: Like any trend-following strategy, this indicator may generate false signals during periods of low volatility or sideways movement.
Not Suitable for All Market Conditions: This indicator performs best in trending markets. It may underperform in choppy or range-bound markets.
Strategy Example:
XRP/USD Example:
If you're trading XRP/USD and the Fast EMA (9) crosses above the Slow EMA (21), while the RSI is above 50, the indicator will signal a Buy.
Conversely, if the Fast EMA (9) crosses below the Slow EMA (21), and the RSI is below 50, the indicator will signal a Sell.
Bitcoin (BTC/USD):
On the BTC/USD chart, when the indicator shows a green arrow and a Buy label, it’s signaling a potential long entry. Similarly, a red arrow and Sell label indicate a short entry or exit from a previous long position.
Summary:
The EMA RSI Trend Reversal Indicator helps traders identify potential trend reversals with clear buy and sell signals based on the EMA crossovers and RSI confirmations. By using green arrows and red arrows, along with Buy and Sell labels, this strategy offers easy-to-understand visual signals for entering and exiting trades. Combine this with effective risk management and backtesting to optimize your trading performance.
