Smart Money Breakouts [ChartPrime]The " Smart Money Breakouts " indicator is designed to identify breakouts based on changes in character (CHOCH) or breaks of structure (BOS) patterns, facilitating automated trading with user-defined Take Profit (TP) level.
the indicator incorporates essential elements such as volume analysis and a data table to assist traders in optimizing their strategies.
🔸 Breakout Detection:
The indicator scans price movements for "Change in Character" (CHOCH) and "Break of Structure" (BOS) patterns, signaling potential breakout opportunities in the market.
🔸User-Defined TP :
Traders can customize the Take Profit (TP) through the indicator settings, with these levels dynamically calculated based on the Average True Range (ATR). This allows for precise risk management and profit targets that adapt to market volatility.
🔸 Volume Analysis and Trade Direction Specific Analysis:
The indicator includes a volume checker that provides valuable insights into the strength of the breakout, taking into account trade direction.
🔸If the volume label is red and the trade is long, it suggests a higher likelihood of hitting the Stop Loss (SL).
🔸If the volume label is green and the trade is long, it indicates a higher probability of hitting the Take Profit (TP).
🔸For short trades, a red volume label suggests a higher likelihood of hitting TP, while a green label suggests a higher likelihood of hitting SL.
🔸A yellow volume label suggests that the volume is inconclusive, neither favoring bullish nor bearish movements.
🔸Data Table:
The indicator features a data table that keeps track of the number of winning and losing trades for specific timeframes or configurations.
This table serves as a valuable tool for traders to analyze performance and discover optimal settings and timeframes.
The "Smart Money Breakouts" indicator provides traders with a comprehensive solution for breakout trading, combining technical analysis of changes in character and breaks of structure, volume insights, and performance tracking while dynamically adjusting TP and SL levels based on market volatility through the ATR.
在腳本中搜尋"take profit"

IU Break of any session StrategyHow this script works:
1. This script is an intraday trading strategy script which buy and sell on the bases of user-defined intraday session range breakout and gives alert(if the alert is set) message too when the new position is open.
2. It calculate the session as per the user inputs or user defined custom session.
3. The script stores the highest and lowest value of the whole session.
4. It take a long position on the first break and close above the highest value.
5. It take a short position on the break and close below the lowest value.
6. The script takes one position in one day.
7. The stop loss for this script is the previous low(if long) or high(if short).
8. Take profit is 1:2 and it's adjustable.
9. This script work on every kind of market.
How The Useful For The User :
1. User can backtest any session range breakout he wants to trade.
2. User can get alert when the new position is open.
3. User can change the Risk to Reward in order to find the best Risk to Reward.
4. User can see the highest and lowest value of the session with respect to analyzing his trading objective.
5. This strategy script highlights which session range breakout performs best and which performs worst.

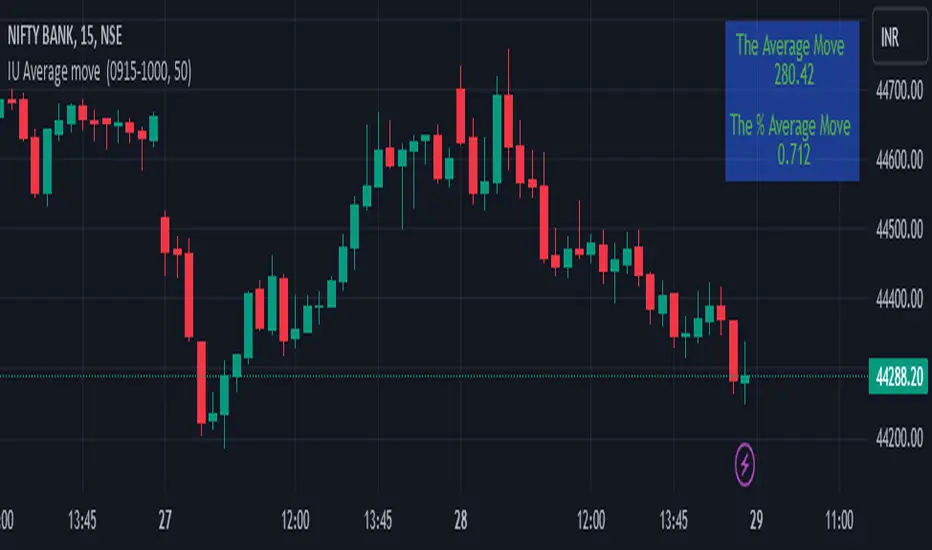
IU Average move How The Script Works :
1. This script calculate the average movement of the price in a user defined custom session and plot the data in a table from on top left corner of the chart.
2. The script takes highest and lowest value of that custom session and store their difference into an array.
3. Then the script average the array thus gets the average price.
4. Addition to that the script converter the price pip change into percentage in order to calculate the value in percentage form.
5. This script is pure price action based the script only take price value and doesn't take any indicator for calculation.
6. The script works on every type of market.
7. If the session is invalid it returns nothing
8. The background color, text color and transparency is changeable.
How User Can Benefit From This Script:
1. User can understand the volatility of any session that he/she wish to trade.
2. It can be helpful for understanding the average price moment of any tradeble asset.
3. It will give the average price movement both in percentage and points bases.
4. By understanding the volatility user can adjust his stop loss or take profit with respect his risk management.
Supertrend Targets [ChartPrime]The Supertrend Targets indicator combines the concepts of trend-following with dynamic volatility-based target levels. It takes core simple and classical concepts and provides actionable insights. The core of this indicator revolves around the "Supertrend" algorithm, which essentially uses the Average True Range (ATR) and a multiplier to determine if the price of a financial instrument is in an uptrend or downtrend. The indicator generates various plot points on the trading chart, which traders can use to make informed trading decisions.
Users can set several input parameters such as the source price, custom levels, multiplier scale, length of the average true range, and the window length. Traders can also opt to enable a table that shows numeric target data by percentiles, risk ratio, take profit and stop loss points.
The generated plots and fills on the chart represent various levels of potential gains and drawdowns, acting as potential targets for taking profit or stopping losses. These include the 25th, 50th, 75th, 90th, and 100th percentiles, which are adjustable by scale. There are also plots for average gain and drawdown levels, enhanced by standard deviation curves if enabled.
The Supertrend line indicators are color-coded for ease of understanding: blue for bullish performance and orange for bearish performance. The "Center Line" represents the point at which traders might consider entering a position.
Lastly, the script presents a summary table (when enabled) at the right side of the chart displaying numeric data of the plotted targets. This data provides additional insights on the risk-reward balance for each percentile, helping traders to execute their strategies more effectively.
Here's a comprehensive breakdown of its functionalities and features:
Inputs:
Source: Determines the price series type (e.g., Close, Open, High, Low, etc.).
Show Trailing Stop: Option to display the trailing stop on the chart.
Levels: Sets the number of target levels you want to display. Can range from -5 to 5.
Scale: A scaling factor for adjusting targets, can be between 1 to 100.
Window Length: Length for the target computation, determines how many bars will be considered.
Unique: Ensures every data point used in calculations is unique.
Multiplier: Multiplier for the ATR (Average True Range) to compute the SuperTrend.
ATR Length: Period for the ATR computation.
Custom Level: Allows users to set their own levels using various statistics like Average, Average + STDEV, Percentile, or can be disabled.
Percent Rank: Determines the percentile rank for targeting.
Enable Table: Enables or disables a table display.
Methods:
Flag: Identifies bullish and bearish trend reversals.
Target Percent: Determines the expected price movement (both gains and drawdowns) based on historical trend reversals.
Value Percent: Computes the percentage difference between the current price and the entry price during trend reversals.
Plots:
Multiple target lines are plotted on the chart to visualize potential gain and drawdown levels. These levels are adjusted based on user settings. Additionally, the main Supertrend line is plotted to indicate the prevailing trend direction.
Gain Levels: Target levels which show potential upside from the current price.
Drawdown Levels: Target levels which represent potential downside from the current price.
SuperTrend Line: A line that adjusts based on price volatility and trend direction, acting as a dynamic support or resistance.
In conclusion, the "Supertrend Targets " indicator is a powerful tool that combines the principle of trend-following with dynamic targets, providing traders with insights into potential future price movements. The range of customization options allows traders to adapt the indicator to different trading strategies and market conditions.

TraderJoe TickMarket sentiment and market breadth are important factors for traders to consider when making trading decisions.
The TICK index , which reflects the buying and selling activity of an entire index, can provide valuable insights into market sentiment and breadth.
1. Assessing Market Sentiment:
- Positive TICK: When the TICK index is consistently positive (indicating more stocks are being bought at or above the asking price), it suggests overall bullish sentiment in the market.
- Negative TICK: Conversely, a consistently negative TICK indicates bearish sentiment, where more stocks are being sold at or below the asking price.
2. Market Breadth:
- Look at the TICK readings for various market indexes, not just one. If all major market indexes are experiencing the same sentiment (e.g., all have aggressive buyers), it's a stronger signal of a broader market trend.
3. Using the TICK for Entry and Exit:
- Positive TICK can be an entry signal for long positions. Traders might consider going long when the TICK index is consistently positive, indicating strong buying pressure in the market.
- Negative TICK can be an entry signal for short positions. When the TICK is consistently negative, it suggests selling pressure, making shorting more attractive.
- Exit positions or take profits when the TICK starts to show signs of reversing from its extreme levels. An excessively positive TICK might indicate overbought conditions, while an overly negative TICK may signal oversold conditions.
4. Combining TICK with Other Indicators:
- It's often beneficial to combine TICK analysis with other technical and fundamental indicators to increase the accuracy of your trading decisions. For example, you could use moving averages, RSI, or support and resistance levels to confirm your entry and exit points.
5. Low Float Stocks and TICK:
- Low float stocks can be more volatile, making TICK analysis even more crucial. In these cases, watch for extreme TICK readings, as they can trigger rapid price movements.
- Be cautious when trading low float stocks, as they can be susceptible to price manipulation due to limited liquidity. Use proper risk management techniques, like setting stop-loss orders.
6. Stay Informed:
- Keep an eye on news and events that might explain sudden shifts in market sentiment. Unexpected news, economic releases, or geopolitical events can quickly change market dynamics.

Signal ComposerThis Signal Composer script can compose existing signals from other "Signal Indicators" into one and can forward it to the "Template Trailing Strategy".
It allows the user to combine the logic of two signals and define the conditions that will trigger the start, end, cancel start, and cancel end deals of the produced signal. A signal will be composed from those user-defined conditions.
For example, one signal indicator may have the main logic and the other the filter logic. If you want to combine more signals you may add two Signal Composer scripts and pipe the output of the first composer to the second one.
This is the "main building block" of creating a bit more complex strategies without writing any code.
The "indicator on indicator" feature is needed so you can forward the resulting signal to the "Template Trailing Strategy" so that you can set take profits, stop losses, custom alerts, and all other nifty features this framework provides.
Thus, you should be a Plus or Premium user to get its full potential. It is very convenient for those who want to create a strategy without coding their own signal indicator and for those who want to fast-prototype various ideas based on simple but composable conditions.
It can nicely be combined with the "Signal Adapter" which combines simple (non-signal) indicators and produces a signal. This is a recipe to build fast and backtest more complex strategy logic.
This approach has a fail-fast mentality! Keep, in mind that you can code a single signal indicator with your composed logic later on only if the idea turns out to be "good enough".

JK - Q SuiteThis indicator is primarily for identifying pauses in Stage 2 uptrends, modelled on Qullamaggie's style of trading, but fits well with many traders including William O' Neil. or Mark Minervini.
I built this for my own purposes, and have gradually added range of tools into a single suite. My goal has also to be as clean as possible, while providing clear, actionable information.
This suite includes all of the following:
Moving averages (10, 20, 50, 200)
Coloured bars showing tightening price (blue under 75% of ADR, orange under 50% of ADR)
A 'markets' dashboard (top-right), showing the major indexes. Red if 10<20MA, or price <20MA
A 'sectors' dashboard (top-right, below markets). Red if 5<10MA, or price <10MA - see note below
Strength / Weakness information - two cells at the top, bottom-right. See below
Stock information - glanceable stock info as quick filters. The thresholds for ADR, Average volume, and Dollar Volume can be customised.
NOTE - if the 'tightening coloured candles' are not showing, the indicator needs to be at the top of the stack. Click the triple squares at the very bottom-right of the TradingView interface, and drag the indicator to the top, should work then!
=============
Sectors
These are based on the 11 official Sectors, tracked using index funds (XLY, XLK etc). HOWEVER, TradingView does NOT use the official 11 sectors - therefore I've done my best to match TradingViews ones to the official ones, but doesn't always work... e.g. 'Electronic Technology' is typically semiconductors, which are classes as 'Industrials', but Apple is the same sector in TV, but classed as 'Technology' using the official 11 Sectors.
If TradingView move to use the official 11 I'll update this, but for now it's a best guess and will sometimes be wrong, sorry!
Strength / Weakness information
This was an experiment in trying not to give too much back to the market! Typically the strategy would be to sell if price closes below 10MA (Weakness), however there may be large pops that can be advantageous to sell into.
The 'Strength' information (top cell, bottom-right), checks how far the price is extended above 10MA - this is customisable as a multiple of ADR. You may find that in weak markets (like now), it can be best to take profits quickly - in good markets, you could increase this as stocks make bigger or more sustained moves.
=============
While I'm not the best coder - and I've hacked and tried and changed different things - this has been a labour of love and essential for me.
If you have any suggestions, while I may or may not be able to implement them, I'm certainly open to ideas!

Are stop orders making money? [yohtza]Who is this indicator for and what does it do?
This is an indicator that helps price action traders in determining the strength of the trend and potential counter trend traps that present themselves during the move. It highlights the background of the bar at which counter trend traders that trade with stop orders (breakout entries) were able to achieve the same amount of reward as was their risk for that trade.
What is it based on?
When there is a strong trend in effect, the counter trend traders are unable to buy above(in bear trend) or sell below (in bull trend) a bar with a stop order and get an equal reward for the risk they are taking.
The first time counter trend traders are able to buy and make money in bear or sell and make money in bull it is a warning sign that market is likely transitioning into trading range phase of the market cycle.
Another application of the indicator is for discovering potential traps. If market comes very close to the take profit level of counter trend traders and reverses, they will usually try to get out with as much profit or as small of a loss as possible and that will often create a fast move (also called giving up) and a good with trend entry.
How does it work?
The indicator is using exponential moving average as a filter for when the market is trending and then scans for signals where counter trend traders enter. Next it looks if the stoploss or profit target was hit for that trade. If the profit target was hit it draws a box around the bar on which the traders entered, the box height is based on stoploss and profit target price levels.
Indicator inputs
- Scan for doji signal bars
When this option is selected, bars that have small bodies (less than 50% of their height) are also included as bars on which counter traders enter. If the option is not selected it only looks for bull trend bars (bodies are greater than 50% of their height) below the moving average and bear trend bars above the moving average.
- Border and background colors and border style
It is possible to select different colors and chose between solid, dashed and dotted borders
- Ema period
Default setting is 20 bar exponential moving average but feel free to use which you prefer
- Tick value
This is the value of the minimal movement of the chart you are trading on. For example for S&P 500 E-mini futures the value is 0.25 and that is the default setting.
Value At RiskThe Value at Risk Channel (VaR Channel) is a trading indicator designed to assist traders in managing their risk exposure effectively. By allowing users to select a specific time period and a probability value, this indicator generates upper and lower limits that the price might potentially attain within the chosen timeframe and probability range.
CONCEPTS
This indicator employs the concept of Value at Risk (VaR) calculation, a crucial metric in risk management. VaR quantifies the potential financial loss within a position, portfolio, or company over a defined time period. Financial institutions like banks and investment firms use VaR to estimate the extent and likelihood of potential losses in their portfolios.
The "historical method" is utilized to compute VaR within the indicator. This method analyzes the historical performance of returns and constructs a histogram representing the statistical distribution of past returns. Assuming returns adhere to a normal distribution, probabilities are assigned to different return values based on their position in the distribution percentile.
HOW TO USE
Suppose you wish to plot upper and lower price limits for a 4-hour period with a 5% probability. Access the indicator's Settings tab and set the Timeframe parameter to "4 hours" while configuring the Probability parameter to 5.0.
The indicator serves as a tool to determine appropriate Stop-Loss levels triggering with low probability. Additionally, it helps gauge the likelihood of triggering such levels.
Likewise, you can assess the probability of your desired Take-Profit level being reached within a specified time frame. For instance, if you anticipate your target to be achieved within a week, set the Timeframe parameter to "1 week" and adjust the Probability parameter to align the VaR channel's limits with your Take-Profit level. The resulting Probability parameter value reflects the likelihood of your target being met within the expected time frame.
This indicator proves valuable for evaluating and managing risk, as well as refining trading strategies. If you discover other applications for this indicator, feel free to share them in the comments!
SETTINGS
Timeframe: Designates the time period within which the price might touch the VaR channel's upper or lower boundary, considering the specified Probability parameter.
Probability: Defines the likelihood of the price reaching the VaR channel's upper or lower limit during the timeframe determined by the Timeframe parameter.
Window: Establishes the historical period (number of past bars) utilized for VaR calculation.

Average Range LinesThis Average Range Lines indicator identifies high and low price levels based on a chosen time period (day, week, month, etc.) and then uses a simple moving average over the length of the lookback period chosen to project support and resistance levels, otherwise referred to as average range. The calculation of these levels are slightly different than Average True Range and I have found this to be more accurate for intraday price bounces.
Lines are plotted and labeled on the chart based on the following methodology:
+3.0: 3x the average high over the chosen timeframe and lookback period.
+2.5: 2.5x the average high over the chosen timeframe and lookback period.
+2.0: 2x the average high over the chosen timeframe and lookback period.
+1.5: 1.5x the average high over the chosen timeframe and lookback period.
+1.0: The average high over the chosen timeframe and lookback period.
+0.5: One-half the average high over the chosen timeframe and lookback period.
Open: Opening price for the chosen time period.
-0.5: One-half the average low over the chosen timeframe and lookback period.
-1.0: The average low over the chosen timeframe and lookback period.
-1.5: 1.5x the average low over the chosen timeframe and lookback period.
-2.0: 2x the average low over the chosen timeframe and lookback period.
-2.5: 2.5x the average low over the chosen timeframe and lookback period.
-3.0: 3x the average low over the chosen timeframe and lookback period.
Look for price to find support or resistance at these levels for either entries or to take profit. When price crosses the +/- 2.0 or beyond, the likelihood of a reversal is very high, especially if set to weekly and monthly levels.
This indicator can be used/viewed on any timeframe. For intraday trading and viewing on a 15 minute or less timeframe, I recommend using the 4 hour, 1 day, and/or 1 week levels. For swing trading and viewing on a 30 minute or higher timeframe, I recommend using the 1 week, 1 month, or longer timeframes. I don’t believe this would be useful on a 1 hour or less timeframe, but let me know if the comments if you find otherwise.
Based on my testing, recommended lookback periods by timeframe include:
Timeframe: 4 hour; Lookback period: 60 (recommend viewing on a 5 minute or less timeframe)
Timeframe: 1 day; Lookback period: 10 (also check out 25 if your chart doesn’t show good support/resistance at 10 days lookback – I have found 25 to be useful on charts like SPX)
Timeframe: 1 week; Lookback period: 14
Timeframe: 1 month; Lookback period: 10
The line style and colors are all editable. You can apply a global coloring scheme in the event you want to add this indicator to your chart multiple times with different time frames like I do for the weekly and monthly.
I appreciate your comments/feedback on this indicator to improve. Also let me know if you find this useful, and what settings/ticker you find it works best with!
Also check out my profile for more indicators!

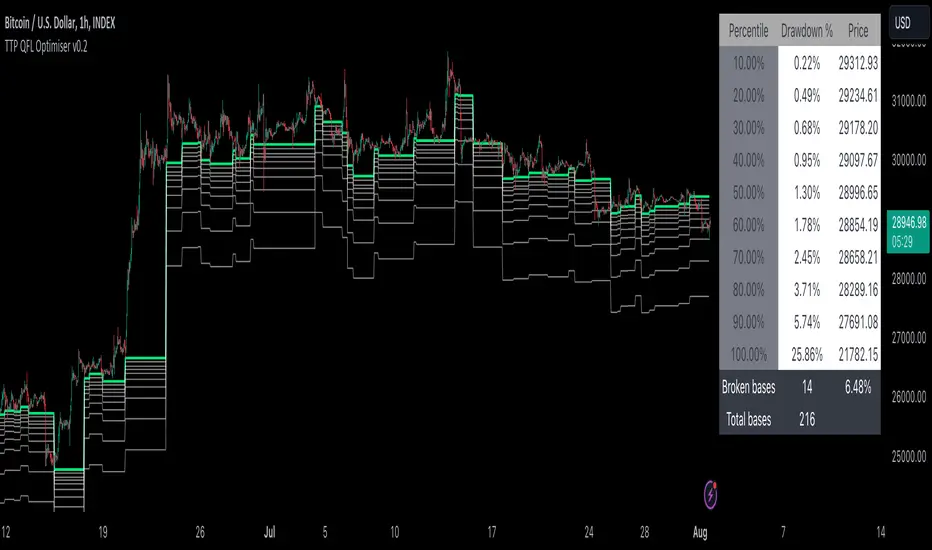
TTP QFL OptimiserThis tool is designed to help finding the best take profit and stop loss levels when trading with QFL bases (Quick Fingers Luc).
You can use it to see the average drawdown among all historic bases broken for an asset and then find the drawdowns that are more frequent using the percentile parameters provided.
For example, by knowing that 98% of the bases got broken with a drawdown of up to 5% can become extremely useful for deciding where to place your take profit or stop loss levels.
It supports QFL 1H, 2H and 4H but make sure to set the chart timeframe to a lower timeframe than QFL to obtain valid results.
Two percentiles are provided to be able to evaluate potential TP and SL at the same time.
Steps:
- Load an asset in the 15min TF
- Select the QFL version: 1H more deals / lower quality vs 4H less deals/ better quality
- Find a percentile that triggers enough deals (example: 70) and then another percentile that doesn't get hit too much (example: 98)
- Confirm the values p1 and p2 provided in the table and the white and grey lines for the results of which drawdown percentages correspond to such selection of percentiles
Once having p1 and p2 use your backtesting and forward testing tools to confirm and adjust accordingly.
TradingToolsLibraryLibrary "TradingToolsLibrary"
Easily create advanced entries, exits, filters and qualifiers to simulate strategies. Supports DCA (Dollar Cost Averaging) Lines, Stop Losses, Take Profits (with trailing or without) & ATR.
method deepCopy(this)
This creates a deep copy instead of a shallow copy of an entry_position. This does NOT deep copy the self_pyramiding_positions array reference, since only the master entry_position needs this to track the rest of its copies for efficiency reasons. This is to prevent a feedback loop.
Namespace types: entry_position
Parameters:
this (entry_position)
Returns: entry_position
method precision_fix(this, precision)
Convert a floating point number to a precise floating point number with digit precision to avoid floating point errors in quantity calculations.
Namespace types: series float, simple float, input float, const float
Parameters:
this (float)
precision (int)
Returns: float
xSellBuyMidInterpolation(_x, _high, _low, _sellRange, _buyRange)
Creates an interpolation for a sell range and buy range but with an emphasis on reaching the _low the closer to the middle of the _sell and _buy range you go.
Parameters:
_x (float) : is the value you want to use to control interpolation bewteen the _high and _low value. This will return the lowest percentage at the mid between high and low and highest percentage at the _high and _low.
_high (float)
_low (float)
_sellRange (float)
_buyRange (float)
Returns: an interpolated float between the _high and _low supplied.
xSellBuyInterpolation(_x, _high, _low, _sellRange, _buyRange)
Creates an interpolation a sell range and buy range
Parameters:
_x (float) : is the value you want to use to control interpolation bewteen the _high and _low value.
_high (float)
_low (float)
_sellRange (float)
_buyRange (float)
Returns: an interpolated float between the _high and _low supplied.
activate_entries_and_exits(_entries, _exits, _filters, _qualifiers, _equity)
Determines activation for entries or exits. Does not place the actual orders.
Parameters:
_entries (entry_position )
_exits (exit_position )
_filters (filter )
_qualifiers (qualifier )
_equity (equity_management)
Returns: void
create_entries_and_exits(_entries, _exits, _equity)
Creates actual entry and exit orders if activated
Parameters:
_entries (entry_position )
_exits (exit_position )
_equity (equity_management)
Returns: void
filter
Fields:
disabled (series__bool)
filter_for_entries_or_exits (series__string)
filter_for_groups (series__string)
condition (series__bool)
dynamic_condition (series__bool)
use_dynamic_condition (series__bool)
use_override_default_condition (series__bool)
dynamic_condition_operator (series__string)
dynamic_condition_source (series__float)
dynamic_compare_source (series__float)
dynamic_condition_source_prior (series__float)
dynamic_compare_source_prior (series__float)
use_dynamic_compare_source (series__bool)
dynamic_condition_activate_value (series__string)
expire_condition_activate_value (series__string)
expire_condition_source (series__float)
expire_condition_source_prior (series__float)
expire_compare_source (series__float)
expire_compare_source_prior (series__float)
use_expire_compare_source (series__bool)
expire_condition_operator (series__string)
qualifier
Fields:
disabled (series__bool)
qualify_for_entries_or_exits (series__string)
qualify_for_groups (series__string)
disqualify (series__bool)
condition (series__bool)
dynamic_condition (series__bool)
use_dynamic_condition (series__bool)
use_override_default_condition (series__bool)
dynamic_condition_operator (series__string)
dynamic_condition_source (series__float)
dynamic_compare_source (series__float)
dynamic_condition_source_prior (series__float)
dynamic_compare_source_prior (series__float)
use_dynamic_compare_source (series__bool)
dynamic_condition_activate_value (series__string)
expire_after_x_bars (series__integer)
use_expire_after_x_bars (series__bool)
use_expire_condition (series__bool)
use_override_expire_condition (series__bool)
expire_condition_operator (series__string)
expire_condition_source (series__float)
expire_compare_source (series__float)
expire_condition_source_prior (series__float)
expire_compare_source_prior (series__float)
use_expire_compare_source (series__bool)
expire_condition_activate_value (series__string)
active (series__bool)
expire_after_bars_bar_index (series__integer)
expire_after_bars_bar_index_prior (series__integer)
expire_bar_count (series__integer)
expire_bar_changed (series__bool)
entry_position
Fields:
disabled (series__bool)
activate (series__bool)
active (series__bool)
override_occured (series__bool)
passDebug (array__bool)
initial_activation_price (series__float)
dca_done (series__bool)
condition (series__bool)
dynamic_condition (series__bool)
use_dynamic_condition (series__bool)
use_override_default_condition (series__bool)
dynamic_condition_operator (series__string)
dynamic_condition_source (series__float)
dynamic_compare_source (series__float)
dynamic_condition_source_prior (series__float)
dynamic_compare_source_prior (series__float)
use_dynamic_compare_source (series__bool)
dynamic_condition_activate_value (series__string)
use_cash (series__bool)
use_percent_equity (series__bool)
percent_equity_amount (series__float)
cash_amount (series__float)
position_size (series__float)
total_position_size (series__float)
prior_total_position_size (series__float)
equity_remaining (series__float)
prior_equity_remaining (series__float)
initial_equity (series__float)
use_martingale (series__bool)
martingale_win_ratio (series__float)
martingale_lose_ratio (series__float)
martingale_win_limit (series__integer)
martingale_lose_limit (series__integer)
martingale_limit_reset_mode (series__string)
use_dynamic_percent_equity (series__bool)
dynamic_percent_equity_amount (series__float)
initial_dynamic_percent_equity_amount (series__float)
dynamic_percent_equity_source (series__float)
dynamic_percent_equity_min (series__float)
dynamic_percent_equity_max (series__float)
dynamic_percent_equity_source_sell_range (series__float)
dynamic_percent_equity_source_buy_range (series__float)
dynamic_equity_interpolation_method (series__string)
total_bars (series__integer)
bar_index_at_activate (series__integer)
bars_since_active (series__integer)
time_at_activate (series__integer)
time_since_active (series__integer)
bar_index_at_activated (series__integer)
bar_index_at_pyramid_change (series__integer)
name (series__string)
id (series__string)
group (series__string)
pyramiding_limit (series__integer)
self_pyramiding_limit (series__integer)
self_pyramiding_positions (array__|entry_position|#OBJ)
new_pyramid_cancels_dca (series__bool)
num_active_long_positions (series__integer)
num_active_short_positions (series__integer)
num_active_positions (series__integer)
position_remaining (series__float)
prior_position_remaining (series__float)
direction (series__string)
allow_flip_position (series__bool)
flip_occurred (series__bool)
ignore_flip (series__bool)
use_dca (series__bool)
dca_use_limit (series__bool)
dca_num_positions (series__integer)
dca_positions (array__float)
dca_deviation_percentage (series__float)
dca_scale (series__float)
dca_percentages (series__string)
dca_close_cancels (series__bool)
dca_active_positions (series__integer)
use_atr_deviation (series__bool)
dca_atr_length (series__integer)
dca_atr_mult (series__float)
dca_atr_updates_dca_positions (series__bool)
close_price_at_order (series__float)
dca_use_deviation_atr_min (series__bool)
dca_position_quantities (array__float)
use_dca_dynamic_percent_equity (series__bool)
dca_in_use (array__bool)
dca_activated (array__bool)
dca_money_used (array__float)
dca_lines (array__line)
dca_color (series__color)
show_dca_lines (series__bool)
atr_value (series__float)
atr_value_at_activation (series__float)
use_cooldown_bars (series__bool)
cooldown_bars (series__integer)
cooldown_bar_changed (series__bool)
cooldown_bar_index (series__integer)
cooldown_bar_index_prior (series__integer)
cooldown_bar_change_count (series__integer)
expire_condition_activate_value (series__string)
expire_condition_source (series__float)
expire_condition_source_prior (series__float)
expire_compare_source (series__float)
expire_compare_source_prior (series__float)
use_expire_compare_source (series__bool)
expire_condition_operator (series__string)
exit_position
Fields:
disabled (series__bool)
id (series__string)
group (series__string)
exit_for_entries (series__string)
exit_for_groups (series__string)
total_bars (series__integer)
name (series__string)
condition (series__bool)
dynamic_condition (series__bool)
use_dynamic_condition (series__bool)
use_override_default_condition (series__bool)
dynamic_condition_operator (series__string)
dynamic_condition_source (series__float)
dynamic_compare_source (series__float)
dynamic_condition_source_prior (series__float)
dynamic_compare_source_prior (series__float)
use_dynamic_compare_source (series__bool)
dynamic_condition_activate_value (series__string)
activate (series__bool)
active (series__bool)
reset_equity (series__bool)
use_limit (series__bool)
use_alerts (series__bool)
reset_entry_cooldowns (series__bool)
prevent_new_entries_on_partial_close (series__bool)
show_activation_zone (series__bool)
use_average_position (series__bool)
source_value (series__float)
trigger_x_times (series__integer)
amount_of_times_triggered (series__integer)
quantity_percent (series__float)
trade_qty (series__float)
exit_amount (series__float)
entries_exiting_for (array__|entry_position|#OBJ)
atr_value (series__float)
update_atr (series__bool)
use_activate_after_bars (series__bool)
show_activate_after_bars (series__bool)
activate_after_bars (series__integer)
activate_after_bars_bar_changed (series__bool)
activate_after_bars_bar_index (series__integer)
activate_after_bars_bar_index_prior (series__integer)
activate_after_bars_bar_change_count (series__integer)
all_conditions_pass (series__bool)
use_close_if_profit_only (series__bool)
profit_value (series__float)
exit_type (series__string)
exit_modifier (series__string)
update_atr_with_new_pyramid (series__bool)
percentage (series__float)
activation_percentage (series__float)
atr_multiplier (series__float)
use_cancel_if_percent (series__bool)
cancel_if_percent (series__float)
activation_value (series__float)
activation_value_crossed (series__bool)
exit_value (series__float)
hypo_long_exit_value (series__float)
hypo_short_exit_value (series__float)
close_exit_value (series__float)
debug (series__float)
expire_condition_activate_value (series__string)
expire_condition_source (series__float)
expire_condition_source_prior (series__float)
expire_compare_source (series__float)
expire_compare_source_prior (series__float)
use_expire_compare_source (series__bool)
expire_condition_operator (series__string)
equity_management
Fields:
equity (series__float)
prior_equity (series__float)
position_used (series__float)
prior_position_used (series__float)
prevent_future_entries (series__bool)
minimum_order_size (series__float)
decimal_rounding_precision (series__integer)
direction (series__string)
show_order_info_in_comments (series__bool)
show_order_info_in_labels (series__bool)
allow_longs (series__bool)
allow_shorts (series__bool)
override_occured (series__bool)
flip_occured (series__bool)
num_concurrent_wins (series__integer)
num_concurrent_losses (series__integer)
first_entry (|entry_position|#OBJ)
num_win_trades (series__integer)
num_losing_trades (series__integer)

Quantitative Trend Strategy- Uptrend longTrend Strategy #1
Indicators:
1. SMA
2. Pivot high/low functions derived from SMA
3. Step lines to plot support and resistance based on the pivot points
4. If the close is over the resistance line, green arrows plot above, and vice versa for red arrows below support.
Strategy:
1. Long Only
2. Mutable 2% TP/1.5% SL
3. 0.01% commission
4. When the close is greater than the pivot point of the sma pivot high, and the close is greater than the resistance step line, a long position is opened.
*At times, the 2% take profit may not trigger IF; the conditions for reentry are met at the time of candle closure + no exit conditions have been triggered.
5. If the position is in the green and the support step line crosses over the resistance step line, positions are exited.
How to use it and what makes it unique:
Use this strategy to trade an up-trending market using a simple moving average to determine the trend. This strategy is meant to capture a good risk/reward in a bullish market while staying active in an appropriate fashion. This strategy is unique due to it's inclusion of the step line function with statistics derived from myself.
This description tells the indicators combined to create a new strategy, with commissions and take profit/stop loss conditions included, and the process of strategy execution with a description on how to use it. If you have any questions feel free to PM me and boost if you enjoyed it. Thank you, pineUSERS!

Average True Range Trailing Mean [Alifer]Upgrade of the Average True Range default indicator by TradingView. It adds and plots a trailing mean to show periods of increased volatility more clearly.
ATR TRAILING MEAN
A trailing mean, also known as a moving average, is a statistical calculation used to smooth out data over time and identify trends or patterns in a time series.
In our indicator, it clearly shows when the ATR value spikes outside of it's average range, making it easier to identify periods of increased volatility.
Here's how the ATR Trailing Mean (atr_mean) is calculated:
atr_mean = ta.cum(atr) / (bar_index + 1) * atr_mult
The ta.cum() function calculates the cumulative sum of the ATR over all bars up to the current bar.
(bar_index + 1) represents the number of bars processed up to the current bar, including the current one.
By dividing the cumulative ATR ta.cum(atr) by (bar_index + 1) and then multiplying it by atr_mult (Multiplier), we obtain the ATR Trailing Mean value.
If atr_mult is set to 1.0, the ATR Trailing Mean will be equal to the simple average of the ATR values, and it will follow the ATR's general trend.
However, if atr_mult is increased, the ATR Trailing Mean will react more strongly to the ATR's recent changes, making it more sensitive to short-term fluctuations.
On the other hand, reducing atr_mult will make the ATR Trailing Mean less responsive to recent changes in ATR, making it smoother and less prone to reacting to short-term volatility.
In summary, adjusting the atr_mult input allows traders to fine-tune the ATR Trailing Mean's responsiveness based on their preferred level of sensitivity to recent changes in market volatility.
IMPLEMENTATION IN A STRATEGY
You can easily implement this indicator in an existing strategy, to only enter positions when the ATR is above the ATR Trailing Mean (with Multiplier-adjusted sensitivity). To do so, add the following lines of codes.
Under Inputs:
length = input.int(title="Length", defval=20, minval=1)
atr_mult = input.float(defval=1.0, step = 0.1, title = "Multiplier", tooltip = "Adjust the sensitivity of the ATR Trailing Mean line.")
smoothing = input.string(title="Smoothing", defval="RMA", options= )
ma_function(source, length) =>
switch smoothing
"RMA" => ta.rma(source, length)
"SMA" => ta.sma(source, length)
"EMA" => ta.ema(source, length)
=> ta.wma(source, length)
This will allow you to define the Length of the ATR (lookback length over which the ATR is calculated), the Multiplier to adjust the Trailing Mean's sensitivity and the type of Smoothing to be used for the ATR.
Under Calculations:
atr= ma_function(ta.tr(true), length)
atr_mean = ta.cum(atr) / (bar_index+1) * atr_mult
This will calculate the ATR based on Length and Smoothing, and the resulting ATR Trailing Mean.
Under Entry Conditions, add the following to your existing conditions:
and atr > atr_mean
This will make it so that entries are only triggered when the ATR is above the ATR Trailing Mean (adjusted by the Multiplier value you defined earlier).
ATR - DEFINITION AND HISTORY
The Average True Range (ATR) is a technical indicator used to measure market volatility, regardless of the direction of the price. It was developed by J. Welles Wilder and introduced in his book "New Concepts in Technical Trading Systems" in 1978. ATR provides valuable insights into the degree of price movement or volatility experienced by a financial asset, such as a stock, currency pair, commodity, or cryptocurrency, over a specific period.
ATR - CALCULATION AND USAGE
The ATR calculation involves three components:
1 — True Range (TR): The True Range is a measure of the asset's price movement for a given period. It takes into account the following factors:
The difference between the high and low prices of the current period.
The absolute value of the difference between the high price of the current period and the closing price of the previous period.
The absolute value of the difference between the low price of the current period and the closing price of the previous period.
Mathematically, the True Range (TR) for the current period is calculated as follows:
TR = max(high - low, abs(high - previous_close), abs(low - previous_close))
2 — ATR Calculation: The ATR is calculated as a Moving Average (MA) of the True Range over a specified period.
The ATR is calculated as follows:
ATR = MA(TR, length)
3 — ATR Interpretation: The ATR value represents the average volatility of the asset over the chosen period. Higher ATR values indicate higher volatility, while lower ATR values suggest lower volatility.
Traders and investors can use ATR in various ways:
Setting Stop Loss and Take Profit Levels: ATR can help determine appropriate stop-loss and take-profit levels in trading strategies. A larger ATR value might require wider stop-loss levels to allow for the asset's natural price fluctuations, while a smaller ATR value might allow for tighter stop-loss levels.
Identifying Market Volatility: A sharp increase in ATR might indicate heightened market uncertainty or the potential for significant price movements. Conversely, a decreasing ATR might suggest a period of low volatility and possible consolidation.
Comparing Volatility Between Assets: Since ATR uses absolute values, it shouldn't be used to compare volatility between different assets, as assets with higher prices will consistently have higher ATR values, while assets with lower prices will consistently have lower ATR values. However, the addition of a trailing mean makes such a comparison possible. An asset whose ATR is consistently close to its ATR Trailing Mean will have a lower volatility than an asset whose ATR continuously moves far above and below its ATR Trailing Mean. This can help traders and investors decide which markets to trade based on their risk tolerance and trading strategies.
Determining Position Size: ATR can be used to adjust position sizes, taking into account the asset's volatility. Smaller position sizes might be appropriate for more volatile assets to manage risk effectively.

Normalized Close IndicatorThe central aspect of this indicator is the computation of a normalized close price. The normalized close price is computed by first determining the highest and lowest closing prices over a specified historical period. This highest and lowest value form the boundaries of the historical price range.
Once these bounds are established, the current closing price's position within this range is calculated. This is done by subtracting the lowest close from the current close and dividing the result by the range (the highest close minus the lowest close). This yields a value between 0 and 1, which is then multiplied by 100 to provide a percentage. This is not calculating percentile rank, but often it overlaps.
This percentage represents where the current close price stands relative to the historical price range. If the value is near 0, it indicates that the current close price is near the historical low, potentially signaling an oversold condition. Conversely, if the value is near 100, it suggests that the current close price is near the historical high, possibly indicating an overbought condition.
By using this approach, the indicator helps identify points at which the price may be considered relatively high (overbought) or low (oversold) compared to its recent historical range.
Additionally alerts are to switch from long to short and vice versa, for the most part, my strategy that incorporates this indicator is either long or short, sometimes though, the opposite bounds (high level for longs and low level for shorts) are not reached, then stop loss and take profit levels are needed.
I discovered it works fine on markets that spend most of time in a range like BTC/USD, adjustment needs to be done in user inputs and in Pine Script (length) for different exchanges, in current configuration works fine for me on Deribit Perpetuals (BTCUSD.P and ETHUSD.P), on 5 minute and 3 minute timeframes with a stop loss of 1.5% and take profit of 4.5% for BTCUSD.P and 1.7% and 5.1% for ETHUSD.P.

EMA Buy/Sell Alerts with ATR-based TP/SLI wanted to fill a void in the Tradingview FREE indicators. I have searched far and wide on a moving average alert with ATR based take profits and stop loss. I have attempted a rudimentary version of what I hope to improve upon in the future. Will try and add different moving average options such as simple, hull, RMA, JMA, SSL, WMA, etc. For now, a basic EMA with 3 TP and a SL based on the current ATR should suffice.
I grow tired of the ATR take profits being hidden behind a paywall. Please use the script and add to your favorite indicators as you please.
Please leave feedback for future development.
