WhalenatorThis custom TradingView indicator combines multiple analytic techniques to help identify potential market trends, areas of support and resistance, and zones of heightened trading activity. It incorporates a SuperTrend-like line based on ATR, Keltner Channels for volatility-based price envelopes, and dynamic order blocks derived from significant volume and pivot points. Additionally, it highlights “whale” activities—periods of exceptionally large volume—along with an estimated volume profile level and approximate bid/ask volume distribution. Together, these features aim to offer traders a more comprehensive view of price structure, volatility, and institutional participation.
This custom TradingView indicator integrates multiple trading concepts into a single, visually descriptive tool. Its primary goal is to help traders identify directional bias, volatility levels, significant volume events, and potential support/resistance zones on a price chart. Below are the main components and their functionalities:
SuperTrend-Like Line (Trend Bias):
At the core of the indicator is a trend-following line inspired by the SuperTrend concept, which uses Average True Range (ATR) to adaptively set trailing stop levels. By comparing price to these levels, the line attempts to indicate when the market is in an uptrend (price above the line) or a downtrend (price below the line). The shifting levels can provide a dynamic sense of direction and help traders stay with the predominant trend until it shifts.
Keltner Channels (Volatility and Range):
Keltner Channels, based on an exponential moving average and Average True Range, form volatility-based envelopes around price. They help traders visualize whether price is extended (touching or moving outside the upper/lower band) or trading within a stable range. This can be useful in identifying low-volatility consolidations and high-volatility breakouts.
Dynamic Order Blocks (Approximations of Supply/Demand Zones):
By detecting pivot highs and lows under conditions of significant volume, the indicator approximates "order blocks." Order blocks are areas where institutional buying or selling may have occurred, potentially acting as future support or resistance zones. Although these approximations are not perfect, they offer a visual cue to areas on the chart where price might react strongly if revisited.
Volume Profile Proxy and Whale Detection:
The indicator highlights price levels associated with recent maximum volume activity, providing a rough "volume profile" reference. Such levels often become key points of price interaction.
"Whale" detection logic attempts to identify bars where exceptionally large volume occurs (beyond a defined threshold). By tracking these "whale bars," traders can infer where heavy participation—often from large traders or institutions—may influence market direction or create zones of interest.
Approximate Bid/Ask Volume and Dollar Volume Tracking:
The script estimates whether volume within each bar leans more towards the bid or the ask side, aiming to understand which participant (buyers or sellers) might have been more aggressive. Additionally, it calculates dollar volume (close price multiplied by volume) and provides an average to gauge the relative participation strength over time.
Labeling and Visual Aids:
Dynamic labels display Whale Frequency (the ratio of bars with exceptionally large volume), average dollar volume, and approximate ask/bid volume metrics. This gives traders at-a-glance insights into current market conditions, participation, and sentiment.
Strengths:
Multifaceted Analysis:
By combining trend, volatility, volume, and order block logic in one place, the indicator saves chart space and simplifies the analytical process. Traders gain a holistic view without flipping between multiple separate tools.
Adaptable to Market Conditions:
The use of ATR and Keltner Channels adapts to changing volatility conditions. The SuperTrend-like line helps keep traders aligned with the prevailing trend, avoiding constant whipsaws in choppy markets.
Volume-Based Insights:
Integrating whale detection and a crude volume profile proxy helps traders understand where large players might be interacting. This perspective can highlight critical levels that might not be evident from price action alone.
Convenient Visual Cues and Labels:
The indicator provides quick reference points and textual information about the underlying volume dynamics, making decision-making potentially faster and more informed.
Weaknesses:
Heuristic and Approximate Nature:
Many of the indicator’s features, like the "order blocks," "whale detection," and the approximate bid/ask volume, rely on heuristics and assumptions that may not always be accurate. Without actual Level II data or true volume profiles, the insights are best considered as supplementary, not definitive signals.
Lagging Components:
Indicators that rely on past data, like ATR-based trends or moving averages for Keltner Channels, inherently lag behind price. This can cause delayed signals, particularly in fast-moving markets, potentially missing some early opportunities or late in confirming market reversals.
No Guaranteed Predictive Power:
As with any technical tool, it does not forecast the future with certainty. Strong volume at a certain level or a bullish SuperTrend reading does not guarantee price will continue in that direction. Market conditions can change unexpectedly, and false signals will occur.
Complexity and Overreliance Risk:
With multiple signals combined, there’s a risk of information overload. Traders might feel compelled to rely too heavily on this one tool. Without complementary analysis (fundamentals, news, or additional technical confirmation), overreliance on the indicator could lead to misguided trades.
Conclusion:
This integrated indicator offers a comprehensive visual guide to market structure, volatility, and activity. Its strength lies in providing a multi-dimensional viewpoint in a single tool. However, traders should remain aware of its approximations, inherent lags, and the potential for conflicting signals. Sound risk management, position sizing, and the use of complementary analysis methods remain essential for trading success.
Risks Associated with Trading:
No indicator can guarantee profitable trades or accurately predict future price movements. Market conditions are inherently unpredictable, and reliance on any single tool or combination of tools carries the risk of financial loss. Traders should practice sound risk management, including the use of stop losses and position sizing, and should not trade with funds they cannot afford to lose. Ultimately, decisions should be guided by a thorough trading plan and possibly supplemented with other forms of market analysis or professional advice.
Risks and Important Considerations:
• Not a Standalone Tool:
• This indicator should not be used in isolation. It is essential to incorporate additional technical analysis tools, fundamental analysis, and market context when making trading decisions.
• Relying solely on this indicator may lead to incomplete assessments of market conditions.
• Market Volatility and False Signals:
• Financial markets can be highly volatile, and indicators based on historical data may not accurately predict future movements.
• The indicator may produce false signals due to sudden market changes, low liquidity, or atypical trading activity.
• Risk Management:
• Always employ robust risk management strategies, including setting stop-loss orders, diversifying your portfolio, and not over-leveraging positions.
• Understand that no indicator guarantees success, and losses are a natural part of trading.
• Emotional Discipline:
• Avoid making impulsive decisions based on indicator signals alone.
• Emotional trading can lead to significant financial losses; maintain discipline and adhere to a well-thought-out trading plan.
• Continuous Learning and Adaptation:
• Stay informed about market news, economic indicators, and global events that may impact trading conditions.
• Continuously evaluate and adjust your trading strategies as market dynamics evolve.
• Consultation with Professionals:
• Consider seeking advice from financial advisors or professional traders to understand better how this indicator can fit into your overall trading strategy.
• Professional guidance can provide personalized insights based on your financial goals and risk tolerance.
Disclaimer:
Trading financial instruments involves substantial risk and may not be suitable for all investors. Past performance is not indicative of future results. This indicator is provided for informational and educational purposes only and should not be considered investment advice. Always conduct your own research and consult with a licensed financial professional before making any trading decisions.
Note: The effectiveness of any technical indicator can vary based on market conditions and individual trading styles. It's crucial to test indicators thoroughly using historical data and possibly paper trading before applying them in live trading scenarios.
在腳本中搜尋"technical"

EMA Volatility Channel [QuantAlgo]EMA Volatility Channel 🌊📈
The EMA Volatility Channel by QuantAlgo is an advanced technical indicator designed to capture price volatility and trend dynamics through adaptive channels based on exponential moving averages. This sophisticated system combines EMA-based trend analysis with dynamic volatility-adjusted bands to help traders and investors identify trend direction, potential reversals, and market volatility conditions. By evaluating both price momentum and volatility together, this tool enables users to make informed trading decisions while adapting to changing market conditions.
💫 Dynamic Channel Architecture
The EMA Volatility Channel provides a unique framework for assessing market trends through a blend of exponential moving averages and volatility-based channel calculations. Unlike traditional channel indicators that use fixed-width bands, this system incorporates dynamic volatility measurements to adjust channel width automatically, helping users determine whether price movements are significant relative to current market conditions. By combining smooth EMA trends with adaptive volatility bands, it evaluates both directional movement and market volatility, while the smoothing parameters ensure stable yet responsive channel adjustments. This adaptive approach allows users to identify trending conditions while remaining aware of volatility expansions and contractions, enhancing both trend-following and reversal strategies.
📊 Indicator Components & Mechanics
The EMA Volatility Channel is composed of several technical components that create a dynamic channel system:
EMA Midline: Calculates a smoothed exponential moving average that serves as the channel's centerline, providing a clear reference for trend direction.
Volatility Measurement: Computes average price movement to determine dynamic channel width, adapting to changing market conditions automatically.
Smooth Band Calculation: Applies additional smoothing to the channel bands, reducing noise while maintaining responsiveness to significant price movements.
📈 Key Indicators and Features
The EMA Volatility Channel combines various technical tools to deliver a comprehensive analysis of market conditions.
The indicator utilizes exponential moving averages with customizable length and smoothing parameters to adapt to different trading styles. Volatility calculations are applied to determine channel width, providing context-aware boundaries for price movement. The trend detection component evaluates price action relative to the channel bands, helping validate trends and identify potential reversals.
The indicator incorporates multi-layered visualization with color-coded channels and bars to signal both trend direction and market position. These adaptive visual cues, combined with programmable alerts for channel breakouts, help traders and investors track both trend changes and volatility conditions, supporting both trend-following and mean-reversion strategies.
⚡️ Practical Applications and Examples
✅ Add the Indicator: Add the indicator to your TradingView chart by clicking on the star icon to add it to your favorites ⭐️
👀 Monitor Channel Position: Watch the price position relative to the channel bands to identify trend direction and potential reversals. When price moves outside the channel, consider potential trend changes or extreme conditions.
🔔 Set Alerts: Configure alerts for channel breakouts and trend changes, ensuring you can act on significant technical developments promptly.
🌟 Summary and Tips
The EMA Volatility Channel by QuantAlgo is a versatile technical tool, designed to support both trend following and volatility analysis across different market environments. By combining smooth EMA trends with dynamic volatility-based channels, it helps traders and investors identify significant price movements while measuring market volatility, providing reliable technical signals. The tool's adaptability across timeframes makes it suitable for both trend-following and reversal strategies, allowing users to capture opportunities while maintaining awareness of changing market conditions.

Top-Down Trend and Key Levels with Swing Points//by antaryaami0
Overview
The “Top-Down Trend and Key Levels with Swing Points” indicator is a comprehensive tool designed to enhance your technical analysis by integrating multiple trading concepts into a single, easy-to-use script. It combines higher timeframe trend analysis, key price levels, swing point detection, and ranging market identification to provide a holistic view of market conditions. This indicator is particularly useful for traders who employ multi-timeframe analysis, support and resistance levels, and price action strategies.
Key Features
1. Higher Timeframe Trend Background Shading:
• Purpose: Identifies the prevailing trend on a higher timeframe to align lower timeframe trading decisions with the broader market direction.
• How it Works: The indicator compares the current higher timeframe close with the previous one to determine if the trend is up, down, or ranging.
• Customization:
• Trend Timeframe: Set your preferred higher timeframe (e.g., Daily, Weekly).
• Up Trend Color & Down Trend Color: Customize the background colors for uptrends and downtrends.
• Ranging Market Color: A separate color to indicate when the market is moving sideways.
2. Key Price Levels:
• Previous Day High (PDH) and Low (PDL):
• Purpose: Identifies key support and resistance levels from the previous trading day.
• Visualization: Plots horizontal lines at PDH and PDL with labels.
• Customization: Option to show or hide these levels and customize their colors.
• Pre-Market High (PMH) and Low (PML):
• Purpose: Highlights the price range during the pre-market session, which can indicate potential breakout levels.
• Visualization: Plots horizontal lines at PMH and PML with labels.
• Customization: Option to show or hide these levels and customize their colors.
3. First 5-Minute Marker (F5H/F5L):
• Purpose: Marks the high or low of the first 5 minutes after the market opens, which is significant for intraday momentum.
• How it Works:
• If the first 5-minute high is above the Pre-Market High (PMH), an “F5H” label is placed at the first 5-minute high.
• If the first 5-minute high is below the PMH, an “F5L” label is placed at the first 5-minute low.
• Visualization: Labels are placed at the 9:35 AM candle (closing of the first 5 minutes), colored in purple by default.
• Customization: Option to show or hide the marker and adjust the marker color.
4. Swing Points Detection:
• Purpose: Identifies significant pivot points in price action to help recognize trends and reversals.
• How it Works: Uses left and right bars to detect pivot highs and lows, then determines if they are Higher Highs (HH), Lower Highs (LH), Higher Lows (HL), or Lower Lows (LL).
• Visualization: Plots small markers (circles) with labels (HH, LH, HL, LL) at the corresponding swing points.
• Customization: Adjust the number of left and right bars for pivot detection and the size of the markers.
5. Ranging Market Detection:
• Purpose: Identifies periods when the market is consolidating (moving sideways) within a defined price range.
• How it Works: Calculates the highest high and lowest low over a specified period and determines if the price range is within a set percentage threshold.
• Visualization: Draws a gray box around the price action during the ranging period and labels the high and low prices at the end of the range.
• Customization: Adjust the range detection period and threshold, as well as the box color.
6. Trend Coloring on Chart:
• Purpose: Provides a visual cue for the short-term trend based on a moving average.
• How it Works: Colors the candles green if the price is above the moving average and red if below.
• Customization: Set the moving average length and customize the uptrend and downtrend colors.
How to Use the Indicator
1. Adding the Indicator to Your Chart:
• Copy the Pine Script code provided and paste it into the Pine Script Editor on TradingView.
• Click “Add to Chart” to apply the indicator.
2. Configuring Inputs and Settings:
• Access Inputs:
• Click on the gear icon next to the indicator’s name on your chart to open the settings.
• Customize Key Levels:
• Show Pre-Market High/Low: Toggle on/off.
• Show Previous Day High/Low: Toggle on/off.
• Show First 5-Minute Marker: Toggle on/off.
• Set Trend Parameters:
• Trend Timeframe for Background: Choose the higher timeframe for trend analysis.
• Moving Average Length for Bar Color: Set the period for the moving average used in bar coloring.
• Adjust Ranging Market Detection:
• Range Detection Period: Specify the number of bars to consider for range detection.
• Range Threshold (%): Set the maximum percentage range for the market to be considered ranging.
• Customize Visuals:
• Colors: Adjust colors for trends, levels, markers, and ranging market boxes.
• Label Font Size: Choose the size of labels displayed on the chart.
• Level Line Width: Set the thickness of the lines for key levels.
3. Interpreting the Indicator:
• Background Shading:
• Green Shade: Higher timeframe is in an uptrend.
• Red Shade: Higher timeframe is in a downtrend.
• Gray Box: Market is ranging (sideways movement).
• Key Levels and Markers:
• PDH and PDL Lines: Represent resistance and support from the previous day.
• PMH and PML Lines: Indicate potential breakout levels based on pre-market activity.
• F5H/F5L Labels: Early indication of intraday momentum after market open.
• Swing Point Markers:
• HH (Higher High): Suggests bullish momentum.
• LH (Lower High): May indicate a potential bearish reversal.
• HL (Higher Low): Supports bullish continuation.
• LL (Lower Low): Indicates bearish momentum.
• Ranging Market Box:
• Gray Box Around Price Action: Highlights consolidation periods where breakouts may occur.
• Range High and Low Labels: Provide the upper and lower bounds of the consolidation zone.
4. Applying the Indicator to Your Trading Strategy:
• Trend Alignment:
• Use the higher timeframe trend shading to align your trades with the broader market direction.
• Key Levels Trading:
• Watch for price reactions at PDH, PDL, PMH, and PML for potential entry and exit points.
• Swing Points Analysis:
• Identify trend continuations or reversals by observing the sequence of HH, HL, LH, and LL.
• Ranging Market Strategies:
• During ranging periods, consider range-bound trading strategies or prepare for breakout trades when the price exits the range.
• Intraday Momentum:
• Use the F5H/F5L marker to gauge early market sentiment and potential intraday trends.
Practical Tips
• Adjust Settings to Your Trading Style:
• Tailor the indicator’s inputs to match your preferred timeframes and trading instruments.
• Combine with Other Indicators:
• Use in conjunction with volume indicators, oscillators, or other technical tools for additional confirmation.
• Backtesting:
• Apply the indicator to historical data to observe how it performs and refine your settings accordingly.
• Stay Updated on Market Conditions:
• Be aware of news events or economic releases that may impact market behavior and the effectiveness of technical levels.
Customization Options
• Time Zone Adjustment:
• The script uses “America/New_York” time zone by default. Adjust the timezone variable in the script if your chart operates in a different time zone.
var timezone = "Your/Timezone"
• Session Times:
• Modify the Regular Trading Session and Pre-Market Session times in the indicator settings to align with the trading hours of different markets or exchanges.
• Visual Preferences:
• Colors: Personalize the indicator’s colors to suit your visual preferences or to enhance visibility.
• Label Sizes: Adjust label sizes if you find them too intrusive or not prominent enough.
• Marker Sizes: Further reduce or enlarge the swing point markers by modifying the swing_marker_size variable.
Understanding the Indicator’s Logic
1. Higher Timeframe Trend Analysis:
• The indicator retrieves the closing prices of a higher timeframe using the request.security() function.
• It compares the current higher timeframe close with the previous one to determine the trend direction.
2. Key Level Calculation:
• Previous Day High/Low: Calculated by tracking the highest and lowest prices of the previous trading day.
• Pre-Market High/Low: Calculated by monitoring price action during the pre-market session.
3. First 5-Minute Marker Logic:
• At 9:35 AM (end of the first 5 minutes after market open), the indicator evaluates whether the first 5-minute high is above or below the PMH.
• It then places the appropriate label (F5H or F5L) on the chart.
4. Swing Points Detection:
• The script uses ta.pivothigh() and ta.pivotlow() functions to detect pivot points.
• It then determines the type of swing point based on comparisons with previous swings.
5. Ranging Market Detection:
• The indicator looks back over a specified number of bars to find the highest high and lowest low.
• It calculates the percentage difference between these two points.
• If the difference is below the set threshold, the market is considered to be ranging, and a box is drawn around the price action.
Limitations and Considerations
• Indicator Limitations:
• Maximum Boxes and Labels: Due to Pine Script limitations, there is a maximum number of boxes and labels that can be displayed simultaneously.
• Performance Impact: Adding multiple visual elements (boxes, labels, markers) can affect the performance of the script on lower-end devices or with large amounts of data.
• Market Conditions:
• False Signals: Like any technical tool, the indicator may produce false signals, especially during volatile or erratic market conditions.
• Not a Standalone Solution: This indicator should be used as part of a comprehensive trading strategy, including risk management and other forms of analysis.
Conclusion
The “Top-Down Trend and Key Levels with Swing Points” indicator is a versatile tool that integrates essential aspects of technical analysis into one script. By providing insights into higher timeframe trends, highlighting key price levels, detecting swing points, and identifying ranging markets, it equips traders with valuable information to make more informed trading decisions. Whether you are a day trader looking for intraday opportunities or a swing trader aiming to align with the broader trend, this indicator can enhance your chart analysis and trading strategy.
Disclaimer
Trading involves significant risk, and it’s important to understand that past performance is not indicative of future results. This indicator is a tool to assist in analysis and should not be solely relied upon for making trading decisions. Always conduct thorough research and consider seeking advice from financial professionals before engaging in trading activities.

MultiLayer Awesome Oscillator Saucer Strategy [Skyrexio]Overview
MultiLayer Awesome Oscillator Saucer Strategy leverages the combination of Awesome Oscillator (AO), Williams Alligator, Williams Fractals and Exponential Moving Average (EMA) to obtain the high probability long setups. Moreover, strategy uses multi trades system, adding funds to long position if it considered that current trend has likely became stronger. Awesome Oscillator is used for creating signals, while Alligator and Fractal are used in conjunction as an approximation of short-term trend to filter them. At the same time EMA (default EMA's period = 100) is used as high probability long-term trend filter to open long trades only if it considers current price action as an uptrend. More information in "Methodology" and "Justification of Methodology" paragraphs. The strategy opens only long trades.
Unique Features
No fixed stop-loss and take profit: Instead of fixed stop-loss level strategy utilizes technical condition obtained by Fractals and Alligator to identify when current uptrend is likely to be over (more information in "Methodology" and "Justification of Methodology" paragraphs)
Configurable Trading Periods: Users can tailor the strategy to specific market windows, adapting to different market conditions.
Multilayer trades opening system: strategy uses only 10% of capital in every trade and open up to 5 trades at the same time if script consider current trend as strong one.
Short and long term trend trade filters: strategy uses EMA as high probability long-term trend filter and Alligator and Fractal combination as a short-term one.
Methodology
The strategy opens long trade when the following price met the conditions:
1. Price closed above EMA (by default, period = 100). Crossover is not obligatory.
2. Combination of Alligator and Williams Fractals shall consider current trend as an upward (all details in "Justification of Methodology" paragraph)
3. Awesome Oscillator shall create the "Saucer" long signal (all details in "Justification of Methodology" paragraph). Buy stop order is placed one tick above the candle's high of last created "Saucer signal".
4. If price reaches the order price, long position is opened with 10% of capital.
5. If currently we have opened position and price creates and hit the order price of another one "Saucer" signal another one long position will be added to the previous with another one 10% of capital. Strategy allows to open up to 5 long trades simultaneously.
6. If combination of Alligator and Williams Fractals shall consider current trend has been changed from up to downtrend, all long trades will be closed, no matter how many trades has been opened.
Script also has additional visuals. If second long trade has been opened simultaneously the Alligator's teeth line is plotted with the green color. Also for every trade in a row from 2 to 5 the label "Buy More" is also plotted just below the teeth line. With every next simultaneously opened trade the green color of the space between teeth and price became less transparent.
Strategy settings
In the inputs window user can setup strategy setting: EMA Length (by default = 100, period of EMA, used for long-term trend filtering EMA calculation). User can choose the optimal parameters during backtesting on certain price chart.
Justification of Methodology
Let's go through all concepts used in this strategy to understand how they works together. Let's start from the easies one, the EMA. Let's briefly explain what is EMA. The Exponential Moving Average (EMA) is a type of moving average that gives more weight to recent prices, making it more responsive to current price changes compared to the Simple Moving Average (SMA). It is commonly used in technical analysis to identify trends and generate buy or sell signals. It can be calculated with the following steps:
1.Calculate the Smoothing Multiplier:
Multiplier = 2 / (n + 1), Where n is the number of periods.
2. EMA Calculation
EMA = (Current Price) × Multiplier + (Previous EMA) × (1 − Multiplier)
In this strategy uses EMA an initial long term trend filter. It allows to open long trades only if price close above EMA (by default 50 period). It increases the probability of taking long trades only in the direction of the trend.
Let's go to the next, short-term trend filter which consists of Alligator and Fractals. Let's briefly explain what do these indicators means. The Williams Alligator, developed by Bill Williams, is a technical indicator designed to spot trends and potential market reversals. It uses three smoothed moving averages, referred to as the jaw, teeth, and lips:
Jaw (Blue Line): The slowest of the three, based on a 13-period smoothed moving average shifted 8 bars ahead.
Teeth (Red Line): The medium-speed line, derived from an 8-period smoothed moving average shifted 5 bars forward.
Lips (Green Line): The fastest line, calculated using a 5-period smoothed moving average shifted 3 bars forward.
When these lines diverge and are properly aligned, the "alligator" is considered "awake," signaling a strong trend. Conversely, when the lines overlap or intertwine, the "alligator" is "asleep," indicating a range-bound or sideways market. This indicator assists traders in identifying when to act on or avoid trades.
The Williams Fractals, another tool introduced by Bill Williams, are used to pinpoint potential reversal points on a price chart. A fractal forms when there are at least five consecutive bars, with the middle bar displaying the highest high (for an up fractal) or the lowest low (for a down fractal), relative to the two bars on either side.
Key Points:
Up Fractal: Occurs when the middle bar has a higher high than the two preceding and two following bars, suggesting a potential downward reversal.
Down Fractal: Happens when the middle bar shows a lower low than the surrounding two bars, hinting at a possible upward reversal.
Traders often combine fractals with other indicators to confirm trends or reversals, improving the accuracy of trading decisions.
How we use their combination in this strategy? Let’s consider an uptrend example. A breakout above an up fractal can be interpreted as a bullish signal, indicating a high likelihood that an uptrend is beginning. Here's the reasoning: an up fractal represents a potential shift in market behavior. When the fractal forms, it reflects a pullback caused by traders selling, creating a temporary high. However, if the price manages to return to that fractal’s high and break through it, it suggests the market has "changed its mind" and a bullish trend is likely emerging.
The moment of the breakout marks the potential transition to an uptrend. It’s crucial to note that this breakout must occur above the Alligator's teeth line. If it happens below, the breakout isn’t valid, and the downtrend may still persist. The same logic applies inversely for down fractals in a downtrend scenario.
So, if last up fractal breakout was higher, than Alligator's teeth and it happened after last down fractal breakdown below teeth, algorithm considered current trend as an uptrend. During this uptrend long trades can be opened if signal was flashed. If during the uptrend price breaks down the down fractal below teeth line, strategy considered that uptrend is finished with the high probability and strategy closes all current long trades. This combination is used as a short term trend filter increasing the probability of opening profitable long trades in addition to EMA filter, described above.
Now let's talk about Awesome Oscillator's "Sauser" signals. Briefly explain what is the Awesome Oscillator. The Awesome Oscillator (AO), created by Bill Williams, is a momentum-based indicator that evaluates market momentum by comparing recent price activity to a broader historical context. It assists traders in identifying potential trend reversals and gauging trend strength.
AO = SMA5(Median Price) − SMA34(Median Price)
where:
Median Price = (High + Low) / 2
SMA5 = 5-period Simple Moving Average of the Median Price
SMA 34 = 34-period Simple Moving Average of the Median Price
Now we know what is AO, but what is the "Saucer" signal? This concept was introduced by Bill Williams, let's briefly explain it and how it's used by this strategy. Initially, this type of signal is a combination of the following AO bars: we need 3 bars in a row, the first one shall be higher than the second, the third bar also shall be higher, than second. All three bars shall be above the zero line of AO. The price bar, which corresponds to third "saucer's" bar is our signal bar. Strategy places buy stop order one tick above the price bar which corresponds to signal bar.
After that we can have the following scenarios.
Price hit the order on the next candle in this case strategy opened long with this price.
Price doesn't hit the order price, the next candle set lower low. If current AO bar is increasing buy stop order changes by the script to the high of this new bar plus one tick. This procedure repeats until price finally hit buy order or current AO bar become decreasing. In the second case buy order cancelled and strategy wait for the next "Saucer" signal.
If long trades has been opened strategy use all the next signals until number of trades doesn't exceed 5. All trades are closed when the trend changes to downtrend according to combination of Alligator and Fractals described above.
Why we use "Saucer" signals? If AO above the zero line there is a high probability that price now is in uptrend if we take into account our two trend filters. When we see the decreasing bars on AO and it's above zero it's likely can be considered as a pullback on the uptrend. When we see the stop of AO decreasing and the first increasing bar has been printed there is a high probability that this local pull back is finished and strategy open long trade in the likely direction of a main trend.
Why strategy use only 10% per signal? Sometimes we can see the false signals which appears on sideways. Not risking that much script use only 10% per signal. If the first long trade has been open and price continue going up and our trend approximation by Alligator and Fractals is uptrend, strategy add another one 10% of capital to every next saucer signal while number of active trades no more than 5. This capital allocation allows to take part in long trades when current uptrend is likely to be strong and use only 10% of capital when there is a high probability of sideways.
Backtest Results
Operating window: Date range of backtests is 2023.01.01 - 2024.11.25. It is chosen to let the strategy to close all opened positions.
Commission and Slippage: Includes a standard Binance commission of 0.1% and accounts for possible slippage over 5 ticks.
Initial capital: 10000 USDT
Percent of capital used in every trade: 10%
Maximum Single Position Loss: -5.10%
Maximum Single Profit: +22.80%
Net Profit: +2838.58 USDT (+28.39%)
Total Trades: 107 (42.99% win rate)
Profit Factor: 3.364
Maximum Accumulated Loss: 373.43 USDT (-2.98%)
Average Profit per Trade: 26.53 USDT (+2.40%)
Average Trade Duration: 78 hours
These results are obtained with realistic parameters representing trading conditions observed at major exchanges such as Binance and with realistic trading portfolio usage parameters.
How to Use
Add the script to favorites for easy access.
Apply to the desired timeframe and chart (optimal performance observed on 3h BTC/USDT).
Configure settings using the dropdown choice list in the built-in menu.
Set up alerts to automate strategy positions through web hook with the text: {{strategy.order.alert_message}}
Disclaimer:
Educational and informational tool reflecting Skyrex commitment to informed trading. Past performance does not guarantee future results. Test strategies in a simulated environment before live implementation

Adapted RSI w/ Multi-Asset Regime Detection v1.1The relative strength index (RSI) is a momentum indicator used in technical analysis. RSI measures the speed and magnitude of an asset's recent price changes to detect overbought or oversold conditions in the price of said asset.
In addition to identifying overbought and oversold assets, the RSI can also indicate whether your desired asset may be primed for a trend reversal or a corrective pullback in price. It can signal when to buy and sell.
The RSI will oscillate between 0 and 100. Traditionally, an RSI reading of 70 or above indicates an overbought condition. A reading of 30 or below indicates an oversold condition.
The RSI is one of the most popular technical indicators. I intend to offer a fresh spin.
Adapted RSI w/ Multi-Asset Regime Detection
Our Adapted RSI makes necessary improvements to the original Relative Strength Index (RSI) by combining multi-timeframe analysis with multi-asset monitoring and providing traders with an efficient way to analyse market-wide conditions across different timeframes and assets simultaneously. The indicator automatically detects market regimes and generates clear signals based on RSI levels, presenting this data in an organised, easy-to-read format through two dynamic tables. Simplicity is key, and having access to more RSI data at any given time, allows traders to prepare more effectively, especially when trading markets that "move" together.
How we calculate the RSI
First, the RSI identifies price changes between periods, calculating gains and losses from one look-back period to the next. This look-back period averages gains and losses over 14 periods, which in this case would be 14 days, and those gains/losses are calculated based on the daily closing price. For example:
Average Gain = Sum of Gains over the past 14 days / 14
Average Loss = Sum of Losses over the past 14 days / 14
Then we calculate the Relative Strength (RS):
RS = Average Gain / Average Loss
Finally, this is converted to the RSI value:
RSI = 100 - (100 / (1 + RS))
Key Features
Our multi-timeframe RSI indicator enhances traditional technical analysis by offering synchronised Daily, Weekly, and Monthly RSI readings with automatic regime detection. The multi-asset monitoring system allows tracking of up to 10 different assets simultaneously, with pre-configured major pairs that can be customised to any asset selection. The signal generation system provides clear market guidance through automatic regime detection and a five-level signal system, all presented through a sophisticated visual interface with dynamic RSI line colouring and customisable display options.
Quick Guide to Use it
Begin by adding the indicator to your chart and configuring your preferred assets in the "Asset Comparison" settings.
Position the two information tables according to your preference.
The main table displays RSI analysis across three timeframes for your current asset, while the asset table shows a comparative analysis of all monitored assets.
Signals are colour-coded for instant recognition, with green indicating bullish conditions and red for bearish conditions. Pay special attention to regime changes and signal transitions, using multi-timeframe confluence to identify stronger signals.
How it Works (Regime Detection & Signals)
When we say 'Regime', a regime is determined by a persistent trend or in this case momentum and by leveraging this for RSI, which is a momentum oscillator, our indicator employs a relatively simple regime detection system that classifies market conditions as either Bullish (RSI > 50) or Bearish (RSI < 50). Our benchmark between a trending bullish or bearish market is equal to 50. By leveraging a simple classification system helps determine the probability of trend continuation and the weight given to various signals. Whilst we could determine a Neutral regime for consolidating markets, we have employed a 'neutral' signal generation which will be further discussed below...
Signal generation occurs across five distinct levels:
Strong Buy (RSI < 15)
Buy (RSI < 30)
Neutral (RSI 30-70)
Sell (RSI > 70)
Strong Sell (RSI > 85)
Each level represents different market conditions and probability scenarios. For instance, extreme readings (Strong Buy/Sell) indicate the highest probability of mean reversion, while neutral readings suggest equilibrium conditions where traders should focus on the overall regime bias (Bullish/Bearish momentum).
This approach offers traders a new and fresh spin on a popular and well-known tool in technical analysis, allowing traders to make better and more informed decisions from the well presented information across multiple assets and timeframes. Experienced and beginner traders alike, I hope you enjoy this adaptation.

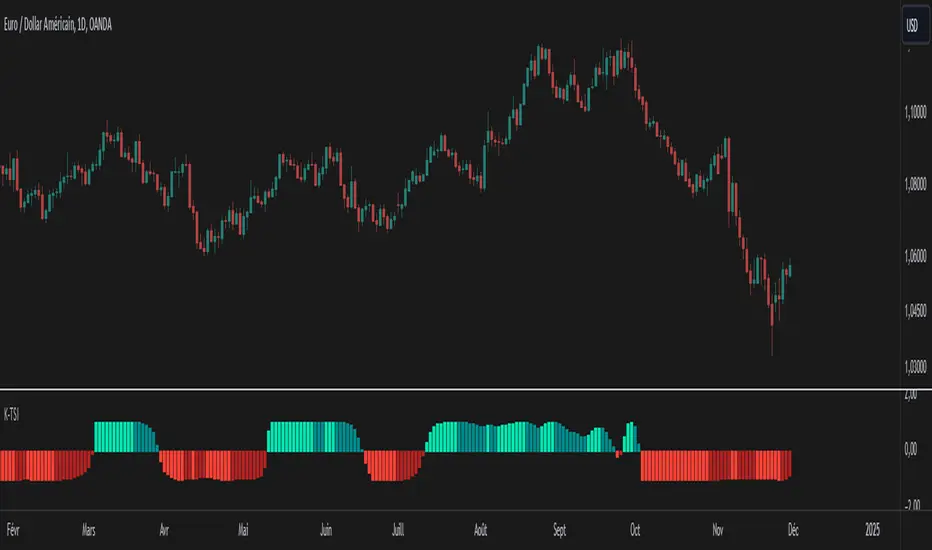
Kalman Trend Strength Index (K-TSI)The Kalman Trend Strength Index (K-TSI) is an innovative technical indicator that combines the Kalman filter with correlation analysis to measure trend strength in financial markets. This sophisticated tool aims to provide traders with a more refined method for trend analysis and market dynamics interpretation.
The use of the Kalman filter is a key feature of the K-TSI. This advanced algorithm is renowned for its ability to extract meaningful signals from noisy data. In financial markets, this translates to smoothing out price action while maintaining responsiveness to genuine market movements. By applying the Kalman filter to price data before performing correlation analysis, the K-TSI potentially offers more stable and reliable trend signals.
The synergy between the Kalman-filtered price data and correlation analysis creates an oscillator that attempts to capture market dynamics more effectively. The correlation component contributes by measuring the strength and consistency of price movements relative to time, while the Kalman filter adds robustness by reducing the impact of market noise. Basing these calculations on Kalman-filtered data may help reduce false signals and provide a clearer picture of underlying market trends.
A notable aspect of the K-TSI is its normalization process. This approach adjusts the indicator's values to a standardized range (-1 to 1), allowing for consistent interpretation across different market conditions and timeframes. This flexibility, combined with the noise-reduction properties of the Kalman filter, positions the K-TSI as a potentially useful tool for various market environments.
In practice, traders might find that the K-TSI offers several potential benefits:
Smoother trend identification, which could aid in detecting the start and end of trends more accurately.
Possibly reduced false signals, particularly in choppy or volatile markets.
Potential for improved trend strength assessment, which might lead to more confident trading decisions.
Consistent performance across different timeframes, due to the adaptive nature of the Kalman filter and the normalization process.
The K-TSI's visual representation as a color-coded histogram further enhances its utility. The changing colors and intensities provide an intuitive way to gauge both the direction and strength of trends, making it easier for traders to quickly assess market conditions.
While the K-TSI builds upon existing concepts in technical analysis, its integration of the Kalman filter with correlation analysis offers traders an interesting tool for market analysis. It represents an attempt to address common challenges in technical analysis, such as noise reduction and trend strength quantification.
As with any technical indicator, the K-TSI should be used as part of a broader trading strategy rather than in isolation. Its effectiveness will depend on how well it aligns with a trader's individual approach and market conditions. For traders looking to explore a more refined trend strength oscillator, the Kalman Trend Strength Index could be a worthwhile addition to their analytical toolkit.
Triple CCI Strategy MFI Confirmed [Skyrexio]Overview
Triple CCI Strategy MFI Confirmed leverages 3 different periods Commodity Channel Index (CCI) indicator in conjunction Money Flow Index (MFI) and Exponential Moving Average (EMA) to obtain the high probability setups. Fast period CCI is used for having the high probability to enter in the direction of short term trend, middle and slow period CCI are used for confirmation, if market now likely in the mid and long-term uptrend. MFI is used to confirm trade with the money inflow/outflow with the high probability. EMA is used as an additional trend filter. Moreover, strategy uses exponential moving average (EMA) to trail the price when it reaches the specific level. More information in "Methodology" and "Justification of Methodology" paragraphs. The strategy opens only long trades.
Unique Features
Dynamic stop-loss system: Instead of fixed stop-loss level strategy utilizes average true range (ATR) multiplied by user given number subtracted from the position entry price as a dynamic stop loss level.
Configurable Trading Periods: Users can tailor the strategy to specific market windows, adapting to different market conditions.
Four layers trade filtering system: Strategy utilizes two different period CCI indicators, MFI and EMA indicators to confirm the signals produced by fast period CCI.
Trailing take profit level: After reaching the trailing profit activation level scrip activate the trailing of long trade using EMA. More information in methodology.
Methodology
The strategy opens long trade when the following price met the conditions:
Fast period CCI shall crossover the zero-line.
Slow and Middle period CCI shall be above zero-lines.
Price shall close above the EMA. Crossover is not obligatory
MFI shall be above 50
When long trade is executed, strategy set the stop-loss level at the price ATR multiplied by user-given value below the entry price. This level is recalculated on every next candle close, adjusting to the current market volatility.
At the same time strategy set up the trailing stop validation level. When the price crosses the level equals entry price plus ATR multiplied by user-given value script starts to trail the price with EMA. If price closes below EMA long trade is closed. When the trailing starts, script prints the label “Trailing Activated”.
Strategy settings
In the inputs window user can setup the following strategy settings:
ATR Stop Loss (by default = 1.75)
ATR Trailing Profit Activation Level (by default = 2.25)
CCI Fast Length (by default = 14, used for calculation short term period CCI)
CCI Middle Length (by default = 25, used for calculation short term period CCI)
CCI Slow Length (by default = 50, used for calculation long term period CCI)
MFI Length (by default = 14, used for calculation MFI
EMA Length (by default = 50, period of EMA, used for trend filtering EMA calculation)
Trailing EMA Length (by default = 20)
User can choose the optimal parameters during backtesting on certain price chart.
Justification of Methodology
Before understanding why this particular combination of indicator has been chosen let's briefly explain what is CCI, MFI and EMA.
The Commodity Channel Index (CCI) is a momentum-based technical indicator that measures the deviation of a security's price from its average price over a specific period. It helps traders identify overbought or oversold conditions and potential trend reversals.
The CCI formula is:
CCI = (Typical Price − SMA) / (0.015 × Mean Deviation)
Typical Price (TP): This is calculated as the average of the high, low, and closing prices for the period.
Simple Moving Average (SMA): This is the average of the Typical Prices over a specific number of periods.
Mean Deviation: This is the average of the absolute differences between the Typical Price and the SMA.
The result is a value that typically fluctuates between +100 and -100, though it is not bounded and can go higher or lower depending on the price movement.
The Money Flow Index (MFI) is a technical indicator that measures the strength of money flowing into and out of a security. It combines price and volume data to assess buying and selling pressure and is often used to identify overbought or oversold conditions. The formula for MFI involves several steps:
1. Calculate the Typical Price (TP):
TP = (high + low + close) / 3
2. Calculate the Raw Money Flow (RMF):
Raw Money Flow = TP × Volume
3. Determine Positive and Negative Money Flow:
If the current TP is greater than the previous TP, it's Positive Money Flow.
If the current TP is less than the previous TP, it's Negative Money Flow.
4. Calculate the Money Flow Ratio (MFR):
Money Flow Ratio = Sum of Positive Money Flow (over n periods) / Sum of Negative Money Flow (over n periods)
5. Calculate the Money Flow Index (MFI):
MFI = 100 − (100 / (1 + Money Flow Ratio))
MFI above 80 can be considered as overbought, below 20 - oversold.
The Exponential Moving Average (EMA) is a type of moving average that places greater weight and significance on the most recent data points. It is widely used in technical analysis to smooth price data and identify trends more quickly than the Simple Moving Average (SMA).
Formula:
1. Calculate the multiplier
Multiplier = 2 / (n + 1) , Where n is the number of periods.
2. EMA Calculation
EMA = (Current Price) × Multiplier + (Previous EMA) × (1 − Multiplier)
This strategy leverages Fast period CCI, which shall break the zero line to the upside to say that probability of short term trend change to the upside increased. This zero line crossover shall be confirmed by the Middle and Slow periods CCI Indicators. At the moment of breakout these two CCIs shall be above 0, indicating that there is a high probability that price is in middle and long term uptrend. This approach increases chances to have a long trade setup in the direction of mid-term and long-term trends when the short-term trend starts to reverse to the upside.
Additionally strategy uses MFI to have a greater probability that fast CCI breakout is confirmed by this indicator. We consider the values of MFI above 50 as a higher probability that trend change from downtrend to the uptrend is real. Script opens long trades only if MFI is above 50. As you already know from the MFI description, it incorporates volume in its calculation, therefore we have another one confirmation factor.
Finally, strategy uses EMA an additional trend filter. It allows to open long trades only if price close above EMA (by default 50 period). It increases the probability of taking long trades only in the direction of the trend.
ATR is used to adjust the strategy risk management to the current market volatility. If volatility is low, we don’t need the large stop loss to understand the there is a high probability that we made a mistake opening the trade. User can setup the settings ATR Stop Loss and ATR Trailing Profit Activation Level to realize his own risk to reward preferences, but the unique feature of a strategy is that after reaching trailing profit activation level strategy is trying to follow the trend until it is likely to be finished instead of using fixed risk management settings. It allows sometimes to be involved in the large movements. It’s also important to make a note, that script uses another one EMA (by default = 20 period) as a trailing profit level.
Backtest Results
Operating window: Date range of backtests is 2022.04.01 - 2024.11.25. It is chosen to let the strategy to close all opened positions.
Commission and Slippage: Includes a standard Binance commission of 0.1% and accounts for possible slippage over 5 ticks.
Initial capital: 10000 USDT
Percent of capital used in every trade: 50%
Maximum Single Position Loss: -4.13%
Maximum Single Profit: +19.66%
Net Profit: +5421.21 USDT (+54.21%)
Total Trades: 108 (44.44% win rate)
Profit Factor: 2.006
Maximum Accumulated Loss: 777.40 USDT (-7.77%)
Average Profit per Trade: 50.20 USDT (+0.85%)
Average Trade Duration: 44 hours
These results are obtained with realistic parameters representing trading conditions observed at major exchanges such as Binance and with realistic trading portfolio usage parameters.
How to Use
Add the script to favorites for easy access.
Apply to the desired timeframe and chart (optimal performance observed on 2h BTC/USDT).
Configure settings using the dropdown choice list in the built-in menu.
Set up alerts to automate strategy positions through web hook with the text: {{strategy.order.alert_message}}
Disclaimer:
Educational and informational tool reflecting Skyrex commitment to informed trading. Past performance does not guarantee future results. Test strategies in a simulated environment before live implementation

Kalman Synergy Oscillator (KSO)The Kalman Synergy Oscillator (KSO) is an innovative technical indicator that combines the Kalman filter with two well-established momentum oscillators: the Relative Strength Index (RSI) and Williams %R. This combination aims to provide traders with a more refined tool for market analysis.
The use of the Kalman filter is a key feature of the KSO. This sophisticated algorithm is known for its ability to extract meaningful signals from noisy data. In financial markets, this translates to smoothing out price action while maintaining responsiveness to genuine market movements. By applying the Kalman filter to price data before calculating the RSI and Williams %R, the KSO potentially offers more stable and reliable signals.
The synergy between the Kalman-filtered price data and the two momentum indicators creates an oscillator that attempts to capture market dynamics more effectively. The RSI contributes its strength in measuring the magnitude and speed of price movements, while Williams %R adds sensitivity to overbought and oversold conditions. Basing these calculations on Kalman-filtered data may help reduce false signals and provide a clearer picture of underlying market trends.
A notable aspect of the KSO is its dynamic weighting system. This approach adjusts the relative importance of the RSI and Williams %R based on their current strengths, allowing the indicator to emphasize the most relevant information as market conditions change. This flexibility, combined with the noise-reduction properties of the Kalman filter, positions the KSO as a potentially useful tool for different market conditions.
In practice, traders might find that the KSO offers several potential benefits:
Smoother oscillator movements, which could aid in trend identification and reversal detection.
Possibly reduced whipsaws, particularly in choppy or volatile markets.
Potential for improved divergence detection, which might lead to more timely reversal signals.
Consistent performance across different timeframes, due to the adaptive nature of the Kalman filter.
While the KSO builds upon existing concepts in technical analysis, its integration of the Kalman filter with traditional momentum indicators offers traders an interesting tool for market analysis. It represents an attempt to address common challenges in technical analysis, such as noise reduction and false signal minimization.
As with any technical indicator, the KSO should be used as part of a broader trading strategy rather than in isolation. Its effectiveness will depend on how well it aligns with a trader's individual approach and market conditions. For traders looking to explore a more refined momentum oscillator, the Kalman Synergy Oscillator could be a worthwhile addition to their analytical toolkit.

Wick Length Display + Alert conditionsDescription of the Wick Length Display (Advanced) script
Originality and purpose of the script
The Wick Length Display (Advanced) script is an innovative tool for traders who want to gain detailed insights into the length of candle wicks. It stands out for its versatility and user-friendly customization options. It combines precise technical calculations with visual representation to provide important information about market movements and dynamics right on the chart.
Functionality
The script calculates and displays the length of the upper and lower wicks of each candle on the chart. It also provides additional visual cues such as:
• “Bull pressure”: When green candles do not have upper wicks, this indicates strong buying pressure.
• “Bear pressure”: When red candles do not have lower wicks, this indicates strong selling pressure.
• Threshold conditions: Only displays wicks that exceed a certain threshold (optional).
• Display in pips: Allows you to display wick lengths in pips, which is useful for forex traders.
How it works
The script analyzes each candle using the following calculations:
1. Wick length calculation:
◦ Upper wick length = High - (top of the body)
◦ Lower wick length = (bottom of the body) - Low
2. Display conditions:
◦ It distinguishes between bullish and bearish candles.
◦ It checks if the calculated wicks exceed the defined thresholds before displaying them.
3. Dynamic labels:
◦ Labels are placed above or below the respective candles.
◦ Size, color and type of labels are fully customizable.
4. Limitation of labels:
◦ To ensure clarity, a maximum number of labels is defined.
Usage
1. Customization:
◦ Open the script in the Pine Script Editor in TradingView.
◦ Use the input options to customize parameters such as color selection, label size, thresholds and other details according to your requirements.
2. Enable thresholds:
◦ Enable thresholds to show labels only for relevant wicks (default is 6).
◦ Define the minimum wick lengths for bullish (green) and bearish (red) candles.
3. Show in pips:
◦ Enable the “Show wick length in pips” option to show the results in pips (especially suitable for Forex).
4. Edit pressure labels:
◦ Turn the “Bull Pressure” and “Bear Pressure” features on or off depending on your analysis settings.
Concepts behind the calculations
• Technical market analysis: Wick lengths can indicate buying or selling pressure and provide important information on market psychology.
• Thresholds and filtering: The script uses thresholds to avoid visual overload and highlight only essential data.
• Label display: Dynamic labels improve chart readability and give the user instant feedback on market developments.
Usage
This script is great for:
• Intraday trading: Analyzing short-term movements using wick lengths.
• Forex trading: Tracking market momentum using the pip indicator.
• Swing trading: Identifying buying or selling pressure in key markets.
• Visual support: Ideal for traders who prefer a graphical display.
Description of the Wick Length Display (Advanced) script
Originality and purpose of the script
The Wick Length Display (Advanced) script is an innovative tool for traders who want to gain detailed insights into the length of candle wicks. It stands out for its versatility and user-friendly customization options. It combines precise technical calculations with visual representation to provide important information about market movements and dynamics right on the chart.
Functionality
The script calculates and displays the length of the upper and lower wicks of each candle on the chart. It also provides additional visual cues such as:
• “Bull pressure”: When green candles do not have upper wicks, this indicates strong buying pressure.
• “Bear pressure”: When red candles do not have lower wicks, this indicates strong selling pressure.
• Threshold conditions: Only displays wicks that exceed a certain threshold (optional).
• Display in pips: Allows you to display wick lengths in pips, which is useful for forex traders.
How it works
The script analyzes each candle using the following calculations:
1. Wick length calculation:
◦ Upper wick length = High - (top of the body)
◦ Lower wick length = (bottom of the body) - Low
2. Display conditions:
◦ It distinguishes between bullish and bearish candles.
◦ It checks if the calculated wicks exceed the defined thresholds before displaying them.
3. Dynamic labels:
◦ Labels are placed above or below the respective candles.
◦ Size, color and type of labels are fully customizable.
4. Limitation of labels
Alert conditions:
Alerts are triggered when the wick length of a bullish or bearish candle exceeds the defined thresholds.
Alert function:
alert() is used to issue messages with a frequency of once per candle when the conditions are met.
How to set up alerts
Save the script and add it to your chart.
Open the alert settings in TradingView.
Select the script's custom message as a trigger.
Adjust the frequency and notification type (popup, email, etc.).
Now you have a powerful tool with visual analysis and alert function!

Indicator DashboardThis script creates an 'Indicator Dashboard' designed to assist you in analyzing financial markets and making informed decisions. The indicator provides a summary of current market conditions by presenting various technical analysis indicators in a table format. The dashboard evaluates popular indicators such as Moving Averages, RSI, MACD, and Stochastic RSI. Below, we'll explain each part of this script in detail and its purpose:
### Overview of Indicators
1. **Moving Averages (MA)**:
- This indicator calculates Simple Moving Averages (“SMA”) for 5, 14, 20, 50, 100, and 200 periods. These averages provide a visual summary of price movements. Depending on whether the price is above or below the moving average, it determines the market direction as either “Bullish” or “Bearish.”
2. **RSI (Relative Strength Index)**:
- The RSI helps identify overbought or oversold market conditions. Here, the RSI is calculated for a 14-period window, and this value is displayed in the table. Additionally, the 14-period moving average of the RSI is also included.
3. **MACD (Moving Average Convergence Divergence)**:
- The MACD indicator is used to determine trend strength and potential reversals. This script calculates the MACD line, signal line, and histogram. The MACD condition (“Bullish,” “Bearish,” or “Neutral”) is displayed alongside the MACD and signal line values.
4. **Stochastic RSI**:
- Stochastic RSI is used to identify momentum changes in the market. The %K and %D lines are calculated to determine the market condition (“Bullish” or “Bearish”), which is displayed along with the calculated values for %K and %D.
### Table Layout and Presentation
The dashboard is presented in a vertical table format in the top-right corner of the chart. The table contains two columns: “Indicator” and “Status,” summarizing the condition of each technical indicator.
- **Indicator Column**: Lists each of the indicators being tracked, such as SMA values, RSI, MACD, etc.
- **Status Column**: Displays the current status of each indicator, such as “Bullish,” “Bearish,” or specific values like the RSI or MACD.
The table also includes rounded indicator values for easier interpretation. This helps traders quickly assess market conditions and make informed decisions based on multiple indicators presented in a single location.
### Detailed Indicator Status Calculations
1. **SMA Status**: For each moving average (5, 14, 20, 50, 100, 200), the script checks if the current price is above or below the SMA. The status is determined as “Bullish” if the price is above the SMA and “Bearish” if below, with the value of the SMA also displayed.
2. **RSI and RSI Average**: The RSI value for a 14-period is displayed along with its 14-period SMA, which provides an average reading of the RSI to smooth out volatility.
3. **MACD Indicator**: The MACD line, signal line, and histogram are calculated using standard parameters (12, 26, 9). The status is shown as “Bullish” when the MACD line is above the signal line, and “Bearish” when it is below. The exact values for the MACD line, signal line, and histogram are also included.
4. **Stochastic RSI**: The %K and %D lines of the Stochastic RSI are used to determine the trend condition. If %K is greater than %D, the condition is “Bullish,” otherwise it is “Bearish.” The actual values of %K and %D are also displayed.
### Conclusion
The 'Indicator Dashboard' provides a comprehensive overview of multiple technical indicators in a single, easy-to-read table. This allows traders to quickly gauge market conditions and make more informed decisions. By consolidating key indicators like Moving Averages, RSI, MACD, and Stochastic RSI into one dashboard, it saves time and enhances the efficiency of technical analysis.
This script is particularly useful for traders who prefer a clean and organized overview of their favorite indicators without needing to plot each one individually on the chart. Instead, all the crucial information is available at a glance in a consolidated format.

Ichimoku Cloud +Ichimoku Cloud Plus - Advanced Technical Analysis Indicator
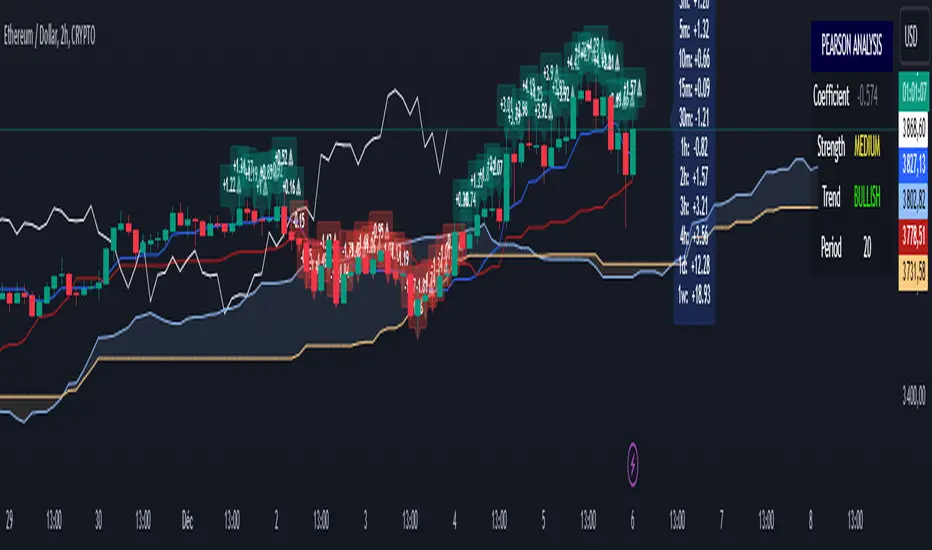
Ichimoku Cloud Plus is an advanced technical analysis tool that combines the traditional Ichimoku Cloud system with Pearson correlation analysis and multi-timeframe momentum tracking. This innovative approach provides traders with a comprehensive view of market trends, momentum, and potential reversal points across multiple time frames.
Core Components
Enhanced Ichimoku Cloud Analysis
The traditional Ichimoku Cloud components have been preserved and enhanced with customizable visual parameters:
The indicator includes:
- Conversion Line (Tenkan-sen) - Short-term trend identifier
- Base Line (Kijun-sen) - Medium-term trend identifier
- Leading Span A and B (Senkou Span A and B) - Future cloud projections
- Lagging Span (Chikou Span) - Historical price momentum confirmation
The cloud (Kumo) formations provide dynamic support and resistance levels, with color-coding to instantly identify bullish and bearish market conditions.
Pearson Correlation Analysis
A sophisticated Pearson correlation coefficient calculation has been integrated to provide statistical validation of trend strength and direction. This component:
- Calculates correlation between price movement and time
- Provides real-time correlation coefficients
- Identifies trend strength through correlation thresholds
- Generates signals for trend changes and potential reversals
Multi-Timeframe Momentum Tracking
The indicator incorporates a unique multi-timeframe analysis system that:
- Displays momentum calculations across five timeframes (15m, 30m, 1h, 4h, 1d)
- Provides percentage-based momentum values
- Includes volatility adjustment capabilities
- Offers volume-weighted calculations for enhanced accuracy
Advanced Features
Statistical Analysis Panel
A comprehensive statistical panel provides real-time analysis including:
- Current Pearson coefficient value
- Correlation strength classification
- Trend direction identification
- Analysis period information
Dynamic Alert System
The indicator includes sophisticated alert conditions for:
- Bearish trend initiation (positive correlation threshold breach)
- Bullish trend initiation (negative correlation threshold breach)
- Trend direction changes (zero-line crossovers)
Visual Optimization
Advanced visualization features include:
- Customizable color schemes for all components
- Adjustable label sizes and positions
- Transparency controls for better chart visibility
- Warning indicators for potential trend weakening
Technical Implementation
The indicator combines multiple calculation methods:
- Donchian Channel calculations for Ichimoku components
- Pearson correlation coefficient computation with customizable periods
- EMA smoothing for momentum calculations
- Volume-weighted averaging capabilities
- Volatility adjustment mechanisms
Trading Applications
This indicator is particularly effective for:
1. Trend Direction Confirmation
- Multiple timeframe analysis provides comprehensive trend validation
- Pearson correlation adds statistical confidence to trend identification
- Ichimoku cloud formations confirm support and resistance levels
2. Entry and Exit Point Identification
- Cloud breakouts combined with correlation strength indicate potential entry points
- Multi-timeframe momentum alignment helps identify high-probability trades
- Warning indicators assist in timing market exits
3. Risk Management
- Dynamic support and resistance levels from the cloud
- Statistical trend strength measurement
- Multi-timeframe confirmation reduces false signals
Performance Considerations
The indicator uses efficient calculations to maintain good performance while providing comprehensive analysis. The smoothing parameters and analysis periods can be adjusted to balance between responsiveness and reliability.
Future Applications and Research
This combination of indicators opens possibilities for:
- Machine learning integration for pattern recognition
- Additional statistical measures for trend validation
- Enhanced alert systems based on multiple condition combinations
- Further optimization of calculation methods
The innovative combination of traditional Ichimoku analysis with modern statistical methods and multi-timeframe momentum tracking provides traders with a powerful tool for market analysis and decision-making.
Non-Psychological Levels🟩 Non-Psychological Levels is a structural analysis tool that segments price action into objective ranges, identifying Broken and Unbroken levels without relying on psychological or time-based assumptions. By emphasizing mechanically derived price behavior, it provides traders with a clear framework for analyzing support and resistance in a consistent and unbiased manner across various market conditions.
This indicator introduces a new approach to understanding market structure by focusing on price movement within defined segments, free from behavioral patterns, round numbers, or specific time intervals. While the indicator is time-agnostic in design, it works within the natural time progression of the chart, ensuring that segmentation aligns with the inherent structure of price movement. Broken levels, where price has breached a structural boundary, and Unbroken levels, which remain intact, are visualized with horizontal lines. These structural zones are complemented by dynamically boxed segments that contextualize both historical and ongoing price behavior.
By offering an objective perspective, the Non-Psychological Levels indicator complements psychology-based tools, helping traders explore market dynamics from multiple angles. When structural levels align with psychological zones, they reinforce critical price areas; when they differ, they provide opportunities to analyze price behavior from an alternative lens. This indicator is designed as both an educational framework and a practical tool, encouraging a deeper understanding of structural price behavior in technical analysis.
⭕ THEORY AND CONCEPT ⭕
The Non-Psychological Levels indicator is grounded in the principle of analyzing price behavior without reliance on psychological assumptions or time-based factors. Its primary purpose is to provide a structural framework for identifying support and resistance levels by focusing solely on price movement within mechanically defined segments. By removing external influences such as sentiment, time intervals, or market sessions, the indicator offers an unbiased lens through which traders can observe price dynamics.
Non-psychology, as defined here, refers to an approach that excludes behavioral and emotional patterns—like fear, greed, or herd mentality—from price analysis. Traditional tools often depend on these patterns to identify zones such as pivots or Fibonacci retracements, but these methods can be inconsistent in volatile markets. In contrast, the Non-Psychological Levels indicator focuses entirely on what price is doing, free from assumptions about trader behavior or external time constraints.
The indicator’s time-agnostic and mechanically driven design segments price action into consistent ranges, highlighting "Broken" levels (where price breaches structural boundaries) and "Unbroken" levels (where price holds). These structural zones remain unaffected by subjective or external influences, ensuring clarity and consistency across different markets and timeframes. By doing so, the indicator reveals a pure view of price structure, independent of psychological biases.
Importantly, the Non-Psychological Levels indicator is not intended to replace psychology-based tools but to complement them. When its structural levels align with psychological zones like round numbers or session highs/lows, the significance of these areas is reinforced. Conversely, when the levels differ, the contrast provides traders with alternative insights into market dynamics. This dual perspective—blending mechanical objectivity with behavioral analysis—enhances the depth and flexibility of market evaluation.
The following principles outline the theoretical foundation of the indicator and its unique contribution to structural price analysis:
Time-Agnostic Design : The indicator avoids reliance on time-based factors like daily opens, session intervals, or specific events. Instead, it segments price action using bar indexes, ensuring that structural levels are identified independently of external time variables. While the x-axis of a chart inherently represents time, this indicator abstracts away its influence, allowing traders to focus purely on price movement without the bias of temporal context.
Mechanical and Neutral Framework : Every calculation within the indicator is predetermined by a set of mechanical rules, ensuring no subjective input or interpretation affects the results. This objectivity guarantees that levels are derived solely from observed price behavior, providing a reliable framework that traders can trust to remain consistent across different assets, timeframes, and market conditions.
Broken and Unbroken Levels : Broken levels represent zones where price has breached a structural boundary, while Unbroken levels highlight areas where price has consistently respected its range. This distinction provides a clear and systematic method for identifying key support and resistance levels, offering insights into where future price interactions are most likely to occur.
Neutral Price Behavior : By dividing price action into equal segments, the indicator removes the influence of external factors like trader sentiment or psychological expectations. Each segment independently determines significant levels based purely on price action, enabling a structural view of the market that abstracts away behavioral or emotional biases.
Complement to Psychological Tools : While the indicator itself avoids behavioral assumptions, its levels can align with psychological zones like round numbers, pivots, or Fibonacci levels. When these structural and psychological levels overlap, it reinforces the importance of key areas, while divergences offer opportunities to examine price behavior from a new perspective.
Educational Value : The indicator encourages traders to explore the contrast between structural and psychological analysis. By introducing a framework that isolates price behavior from external influences, it challenges traditional methods of technical analysis, fostering deeper insights into market structure and behavior.
🔍 UNDERSTANDING STRUCTURAL LEVELS 🔍
The Non-Psychological Levels indicator offers a straightforward yet powerful way to understand market structure by segmenting price action into mechanically defined ranges. This segmentation highlights two key elements: "Broken" levels, where price has breached structural boundaries, and "Unbroken" levels, which remain intact and respected by price action. Together, these components create a framework for identifying potential areas of support and resistance.
Broken Levels : These are structural boundaries that price has surpassed, indicating areas where previous support or resistance failed. Broken levels often signal transitions in price behavior, such as shifts in momentum or the start of trending movements. They provide insight into zones where price has already tested and moved beyond.
Unbroken Levels : These levels remain intact within a given price segment, marking areas where price has consistently respected boundaries. Unbroken levels are particularly useful for identifying potential reversal points or zones of continued support or resistance. Their persistence across price action often makes them reliable indicators of market structure.
The visual segmentation of price action into distinct ranges allows traders to observe how price transitions between structural zones. For example:
- Clusters of Unbroken levels near the current price may suggest strong support or resistance, offering areas of interest for reversals or breakouts.
- Gaps between Unbroken levels highlight areas of price inefficiency or low interaction, which may become significant if revisited.
By focusing solely on structural price behavior, the Non-Psychological Levels indicator enables traders to analyze price independently of time or psychological factors. This makes it a valuable tool for understanding price dynamics objectively, whether used on its own or alongside other indicators.
🛠️ SETTINGS 🛠️
The Non-Psychological Levels indicator offers various customizable settings to help users tailor its visualization to their specific trading style and market conditions. These settings allow adjustments to sensitivity, level projection, and the source of price calculations (e.g., wicks or closing prices). Below, we outline each setting and its impact on the chart, along with examples to illustrate their functionality.
Custom Settings
Sensitivity : This setting adjusts the balance between detailed and broader structural levels by controlling the number of segments. Higher values result in more segments, revealing finer price levels, while lower values consolidate segments to highlight major price movements.
Source : Allows the user to choose between 'Wick' or 'Close' for detecting levels. Selecting 'Wick' emphasizes the absolute highs and lows of price action, while 'Close' focuses on closing prices within each segment.
Level Labels : Configures the visual representation of price levels, allowing users to toggle between price values, symbols (▲ ▼), or disabling labels altogether. This setting ensures clarity in how Broken and Unbroken levels are displayed on the chart.
Unbroken Levels : - - - Users can customize the colors and label styles for Unbroken levels, which highlight areas where price has respected structural boundaries.
Broken Levels : -|- Similar to Unbroken levels, users can specify the visual appearance of Broken levels, including color customization for Broken highs and lows. These settings help distinguish areas where price has breached a structural boundary.
Projection Options : This setting allows users to control how broken and unbroken levels are visually extended on the chart. The Future option projects lines forward to the right of the current price, showing potential future relevance of levels. The All option extends lines both forward and backward, providing a comprehensive view of how levels align with historical and potential future price action. The None option disables projections, keeping the chart focused solely on current segment levels without any extensions.
Segments : Includes options for customizing the segment visualization:
- Live Segment : Toggles the display of a highlighted box representing the current developing segment, helping users focus on ongoing price action.
- Boxes : Allows users to display filled boxes around each segment for additional visual emphasis.
- Segment Colors : Users can define separate colors for support (lower) and resistance (upper) segments, making it easier to interpret directional trends.
- Boundaries : Enables or disables vertical lines to mark segment boundaries, providing a clearer view of structural divisions.
Repaint : This setting allows users to enable or disable triangle labels within the live segment. When enabled, the triangles dynamically update to reflect real-time price behavior during the live bar but will repaint until the bar is fully confirmed. Disabling this option prevents the triangles from appearing during the live bar, reducing potential confusion as they may otherwise flash on and off during price updates. This setting ensures users can choose their preferred visualization while maintaining clarity in real-time analysis.
Color Settings : Offers extensive customization for all visual elements, including Broken and Unbroken levels, segment boundaries, and live segments. These settings ensure the indicator can adapt to individual preferences for chart readability.
🖼️ CHART EXAMPLES 🖼️
The following chart examples illustrate different configurations and features of the Non-Psychological Levels indicator. These examples highlight how the indicator’s settings influence the visualization of structural price behavior, helping traders understand its functionality in various scenarios.
Broken and Unbroken Levels : Orange prices are Broken HIghs. Blue prices are Broken Lows. Green and Red are Unbroken.
Boundaries : Enable Boundaries to visualize segments.
High Sensitivity Setting : A high sensitivity setting produces fewer segments and levels, emphasizing broader price ranges and major structural zones. This configuration is better suited for higher timeframes or identifying overarching trends.
Low Sensitivity Setting : A low sensitivity setting results in a greater number of segments and levels, offering a granular view of price structure. This configuration is ideal for analyzing detailed price movements on lower timeframes.
Live Segment with Triangles Enabled : This example shows the live segment box with triangle labels enabled. These triangles update dynamically during the live bar but may repaint until the bar is confirmed, helping traders observe real-time price behavior.
Broken and Unbroken Levels : This example highlights Broken levels (where price has breached structural boundaries and are drawn through subsequent price action) and Unbroken levels (where price has respected structural boundaries). These distinctions visually identify areas of potential support and resistance.
Broken and Unbroken Levels with Projection: All : This example demonstrates the "Project All" feature, where broken and unbroken levels are extended both forward and backward on the chart. This visualization highlights historical and potential future support and resistance zones, helping traders better understand how price interacts with these structural levels over time.
Segment Boxes with Boundaries : Filled boxes around individual segments visually distinguish each price interval, offering clarity in observing structural price transitions.
📊 SUMMARY 📊
The Non-Psychological Levels indicator provides a unique framework for analyzing structural price behavior through the identification of Broken and Unbroken levels. These levels act as a mechanical representation of support and resistance, independent of psychological biases or time-based factors. By focusing purely on price movement within defined segments, the indicator offers a neutral and consistent approach to understanding market dynamics.
This method complements traditional tools by providing an unbiased perspective. When structural levels align with psychological zones—such as round numbers or session-based highs and lows—they reinforce the significance of these areas as key price zones. When they diverge, the indicator introduces an alternative view, prompting further exploration of price behavior. This dual perspective enhances the depth of analysis by combining the mechanical and behavioral aspects of price action.
The Non-Psychological Levels indicator is not designed to generate trading signals or predict future price movements but serves as a visual and educational tool. Its adaptability across all markets and timeframes allows traders to integrate it into their broader strategies. By highlighting structural price dynamics, the indicator offers a fresh perspective on market analysis while remaining compatible with other technical tools.
⚙️ COMPATIBILITY AND LIMITATIONS ⚙️
Asset Compatibility :
The Non-Psychological Levels indicator is compatible with all asset classes, including cryptocurrencies, forex, stocks, and commodities. It can be applied to any chart or timeframe, making it a flexible tool for structural price analysis. Users should adjust the Sensitivity setting to ensure the segmentation aligns with the price behavior of the specific asset being analyzed. For instance, higher sensitivity values are more suitable for assets with large price ranges, while lower values work well for assets with tighter ranges.
Visual Range Dependency :
The indicator is optimized to perform calculations only within the visible range of the chart. This is a significant advantage, as it prevents unnecessary calculations and maintains efficient performance. However, because of this dependency, levels may appear to "recalculate" when the chart is zoomed in or out quickly or shifted abruptly. While this does not affect the integrity of the levels, it may cause a temporary lag as the indicator adjusts to the new visual range.
Persistence of Levels Beyond Visibility :
Even if levels are not visible on the chart due to zoom or scroll settings, they still exist in the background and are recalculated when revisited. This ensures that the structural price analysis remains consistent, regardless of the chart view.
Box Limitations in Pine Script :
The indicator is subject to Pine Script's inherent limitation of 500 boxes. This means that no more than 500 segments or level boxes can be drawn on the chart simultaneously. For most configurations, this limitation is mitigated by focusing on the visual range, but users employing very low sensitivity settings may exceed the limit. In such cases, only the most recent 500 boxes will be displayed, potentially omitting earlier segments.
Lag with Low Sensitivity Settings :
When sensitivity is set to a low value, the indicator creates many more segments, resulting in finer granularity and a higher number of boxes. While this provides detailed structural levels, it may increase the likelihood of exceeding Pine Script’s 500-box limit or cause a temporary lag when rendering a dense set of boxes over a wide visual range. Users should adjust sensitivity to balance detail with performance, especially on assets with high volatility or broad price ranges.
Live Segment Caution :
The live segment box updates in real time to reflect price movements as the segment is still developing. Since the segment high and segment low are not yet finalized, users should interpret this feature as a dynamic visualization of current price behavior rather than a definitive structural analysis. This ensures clarity during ongoing price action while maintaining the integrity of the indicator's framework.
Cross-Market Versatility :
The indicator’s time-agnostic and mechanical design ensures that it functions identically across all markets and timeframes. However, users should consider the unique characteristics of different markets when interpreting the results, as certain assets (e.g., highly volatile cryptocurrencies) may require sensitivity adjustments for optimal segmentation.
Visual Range Dependency: Levels recalculate efficiently within the chart's visible range but may lag temporarily when zooming or scrolling quickly.
These considerations ensure that the Non-Psychological Levels indicator remains robust and versatile while highlighting some inherent limitations of Pine Script and real-time recalculations. Users can mitigate these constraints by carefully adjusting sensitivity and understanding how the visual range dependency affects performance.
⚠️ DISCLAIMER ⚠️
The Non-Psychological Levels indicator is a visual analysis tool and is not designed as a predictive or trading signal indicator. Its primary purpose is to highlight structural price levels, providing an objective framework for understanding support and resistance within mechanically segmented price action.
The indicator operates within the visible range of the chart to ensure efficiency and adaptiveness, but this recalculation should not be interpreted as a forecast of future price behavior. While the structural levels may align with significant price zones in hindsight, they are purely a reflection of observed price dynamics and should not be used as standalone trading signals.
This indicator is intended as an educational and visual aid to complement other analysis methods. Users are encouraged to integrate it into a broader trading strategy and make adjustments to the settings based on their individual needs and market conditions.
🧠 BEYOND THE CODE 🧠
The Non-Psychological Levels indicator, like other xxattaxx indicators , is designed with education and community collaboration in mind. Its open-source nature encourages exploration, experimentation, and the development of new approaches to price analysis. By focusing on structural price behavior rather than psychological or time-based factors, this indicator introduces a fresh perspective for users to study.
Beyond its visual utility, the indicator serves as an educational framework for understanding the concept of non-psychological analysis. It offers traders an opportunity to explore price dynamics in a purely mechanical way, challenging conventional methods and fostering deeper insights into structural behavior. This approach is especially valuable for those interested in exploring new concepts or seeking alternative perspectives on market analysis.
Your comments, suggestions, and discussions are invaluable in shaping the future of this project. We actively encourage your feedback and contributions, which will directly help us refine and improve the Non-Psychological Levels indicator. We look forward to seeing the creative ways in which you use and enhance this tool. MVS

4-Hour Moving AveragesTitle: 4-Hour Moving Averages Indicator
Description:
The "4-Hour Moving Averages" indicator is designed to help traders easily visualize key moving averages derived from the 4-hour timeframe, regardless of the chart interval they are using. This indicator plots four moving averages: a 15-period SMA (Short-Term), a 35-period SMA (Intermediate-Term), an 80-period SMA (Long-Term), and a 130-period SMA (Confirmation).
These moving averages provide a balanced approach for identifying short, medium, and long-term trends, as well as confirming significant market movements. Ideal for swing traders and those looking for clear trend signals, the indicator can be used for various markets, including stocks, forex, and cryptocurrencies.
The 4-hour moving averages overlay directly on the price chart, allowing for easy analysis of current price movements relative to important trend indicators. Use this script to enhance your trading decisions, identify opportunities, and avoid market traps by relying on consistent moving average trends.
Features:
- 15 SMA for Short-Term Trends (in red)
- 35 SMA for Intermediate-Term Trends (in orange)
- 80 SMA for Long-Term Trends (in green)
- 130 SMA for Confirmation (in blue)
Feel free to modify the settings to suit your specific strategy and market conditions.

Inner Bar Strength (IBS)Inner Bar Strength (IBS) Indicator
The Inner Bar Strength (IBS) indicator is a technical analysis tool designed to measure the position of the closing price relative to the day's price range. It provides insights into market sentiment by indicating where the close occurs within the high and low of a specific timeframe. The IBS value ranges from 0 to 1, where values near 1 suggest bullish momentum (close near the high), and values near 0 indicate bearish momentum (close near the low).
How It Works
The IBS is calculated using the following formula:
IBS = (Close−Low) / (High−Low)
IBS = (High−Low) / (Close−Low)
Close: Closing price of the selected timeframe.
Low: Lowest price of the selected timeframe.
High: Highest price of the selected timeframe.
The indicator allows you to select the timeframe for calculation (default is daily), providing flexibility to analyze different periods based on your trading strategy.
Key Features
Inner Bar Strength (IBS) Indicator
The Inner Bar Strength (IBS) indicator is a technical analysis tool designed to measure the position of the closing price relative to the day's price range. It provides insights into market sentiment by indicating where the close occurs within the high and low of a specific timeframe. The IBS value ranges from 0 to 1, where values near 1 suggest bullish momentum (close near the high), and values near 0 indicate bearish momentum (close near the low).
How It Works
The IBS is calculated using the following formula:
IBS=Close−LowHigh−Low
IBS=High−LowClose−Low
Close: Closing price of the selected timeframe.
Low: Lowest price of the selected timeframe.
High: Highest price of the selected timeframe.
The indicator allows you to select the timeframe for calculation (default is daily), providing flexibility to analyze different periods based on your trading strategy.
Key Features
Timeframe Selection: Customize the timeframe to daily, weekly, monthly, or any other period that suits your analysis.
Adjustable Thresholds: Input fields for upper and lower thresholds (defaulted at 0.9 and 0.1) help identify overbought and oversold conditions.
Visual Aids: Dashed horizontal lines at the threshold levels make it easy to visualize critical levels on the chart.
How to Use the IBS Indicator
When the IBS value exceeds the upper threshold (e.g., 0.9), it suggests the asset is closing near its high and may be overbought.
When the IBS value falls below the lower threshold (e.g., 0.1), it indicates the asset is closing near its low and may be oversold.
Use RSI to confirm overbought or oversold conditions identified by the IBS.
Incorporate moving averages to identify the overall trend and filter signals.
High trading volume can strengthen signals provided by the IBS.
If the price is making lower lows while the IBS is making higher lows, it may signal a potential upward reversal.
If the price is making higher highs and the IBS is making lower highs, a downward reversal might be imminent.
Conclusion
The Inner Bar Strength (IBS) indicator is a valuable tool for traders seeking to understand intraday momentum and potential reversal points. By measuring where the closing price lies within the day's range, it provides immediate insights into market sentiment. When used alongside other technical analysis tools, the IBS can enhance your trading strategy by identifying overbought or oversold conditions, confirming breakouts, and highlighting potential divergence signals.

Enhanced Volume Flow Analysis Pro ♾️ IFEnhanced Volume Flow Analysis Pro (EVFA Pro)
A Comprehensive Guide to Understanding and Using Volume Flow Analysis
Introduction
The Enhanced Volume Flow Analysis Pro (EVFA Pro) represents a sophisticated approach to understanding market dynamics through the lens of volume analysis. This advanced technical indicator has been designed to peel back the layers of market activity, revealing the intricate dance between institutional and retail traders. By combining volume analysis, participant behavior patterns, and market condition recognition, EVFA Pro provides traders with a deeper understanding of market movements and potential opportunities.
Understanding the Core Framework
At its heart, EVFA Pro works by analyzing and categorizing trading volume based on several key characteristics. The indicator examines not just the raw volume, but also the context in which that volume occurs. It considers factors such as price movement, historical patterns, and market conditions to classify trading activity as either institutional or retail in nature.
The framework adapts dynamically to different market environments. Whether you're trading stocks, ETFs, cryptocurrencies, or commodities, the indicator automatically adjusts its parameters to match the typical behavior patterns of each asset class. This adaptability extends to different trading styles as well, with optimizations for everything from quick-paced scalping to longer-term position trading.
Market Participant Analysis
One of the most powerful aspects of EVFA Pro is its ability to distinguish between institutional and retail trading activity. The indicator accomplishes this through a sophisticated analysis of volume patterns, order flow, and price action. Institutional trading typically leaves distinct footprints in the market - large, well-organized volume patterns that often occur at strategic price levels. EVFA Pro identifies these patterns and separates them from the more scattered, emotion-driven patterns typical of retail trading.
The indicator maintains a constant watch on participation rates from both groups. When institutional participation rises above normal levels, it could signal the beginning of a significant move. Similarly, spikes in retail activity, especially when combined with certain price patterns, might indicate potential market turning points.
Reading Market Conditions
Market conditions are not static, and EVFA Pro recognizes this fundamental truth. The indicator continuously evaluates market conditions, classifying them into four main categories: normal, volatile, ranging, and trending. This classification isn't merely descriptive - it directly influences how the indicator interprets various patterns and signals.
In volatile markets, the indicator becomes more conservative in its pattern recognition, requiring stronger confirmation before signaling potential opportunities. During ranging periods, it adjusts to look for shorter-term movements and potential breakout scenarios. In trending markets, the focus shifts to finding continuation patterns and potential exhaustion points.
Pattern Recognition and Signal Generation
Pattern recognition in EVFA Pro goes beyond simple technical patterns. The indicator looks for complex interactions between volume, price, and participant behavior. It identifies accumulation patterns - periods where institutional buyers are actively building positions, often while keeping price movements relatively subtle to avoid drawing attention. Similarly, it recognizes distribution patterns, where larger players are gradually reducing positions.
Signal generation involves a sophisticated weighing of multiple factors. Volume strength, institutional participation, trend alignment, and price momentum all play roles in determining signal strength. This multi-factor approach helps reduce false signals and provides a more reliable indication of potential market moves.
Visual Analysis Tools
The visual components of EVFA Pro have been carefully designed to present complex information in an intuitive format. The main chart overlay uses color-coded volume bars to show the relative participation of institutional and retail traders. The intensity of these colors varies with volume significance, helping traders quickly identify potentially important market activity.
The information table provides a real-time summary of market conditions, participant activity, and detected patterns. This dashboard-style display allows traders to quickly assess market conditions and potential opportunities without needing to analyze multiple indicators.
Practical Application in Trading
To use EVFA Pro effectively, traders should integrate it into a comprehensive trading strategy. The indicator works best when its signals are considered alongside other forms of analysis and risk management tools. Strong signals from EVFA Pro might suggest potential opportunities, but traders should always consider the broader market context, their own risk tolerance, and their overall trading plan.
The indicator's alerts system can help traders stay informed of potentially significant market developments. However, these alerts should be viewed as starting points for analysis rather than automatic trading signals. Each alert provides specific information about the type of pattern or condition detected, allowing traders to quickly assess whether further investigation is warranted.
Advanced Features and Customization
EVFA Pro offers extensive customization options to suit different trading styles and preferences. Traders can adjust sensitivity levels, color schemes, and display options to match their needs. The indicator also includes special considerations for different trading sessions, allowing for more accurate analysis during pre-market, regular trading hours, and after-hours periods.
Market Application and Interpretation
Success with EVFA Pro comes from understanding not just what it shows, but why it shows what it does. The indicator's patterns and signals reflect real market dynamics - the actions and reactions of different types of traders. By understanding these underlying dynamics, traders can make more informed decisions about market opportunities and risks.
Disclaimer
This indicator and documentation are provided for educational and informational purposes only. Trading in financial markets involves substantial risk of loss and is not suitable for every investor. The analysis provided by the Enhanced Volume Flow Analysis Pro indicator should not be considered as financial advice or a recommendation to make any specific trade or investment. Users of this indicator should understand that:
1. Past performance is not indicative of future results
2. All trading decisions and their outcomes are the responsibility of the individual trader
3. This tool should be used as part of a comprehensive trading strategy that includes proper risk management and due diligence
4. Markets can be highly unpredictable, and no technical analysis tool can guarantee success
Users should carefully consider their investment objectives, level of experience, and risk appetite before using this indicator. It is strongly recommended to consult with a qualified financial advisor before making any investment decisions.
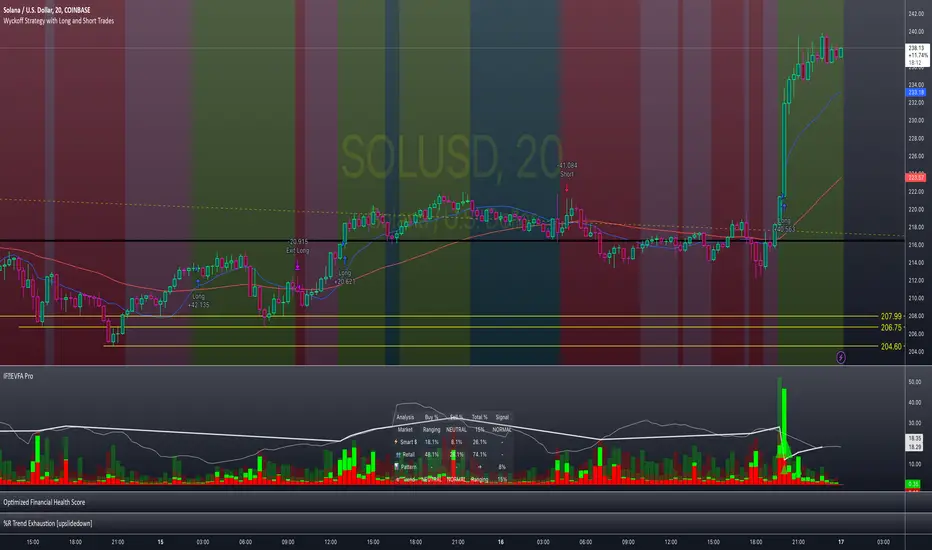
Multi-Symbol Scanner: Advanced EMA-RSI-Volume Strategy# Multi-Symbol Tech Stock Scanner: Advanced EMA-RSI-Volume Strategy
## Technical Analysis Methodology
This scanner implements a sophisticated multi-timeframe analysis approach combining three key technical elements:
### 1. Dual EMA System (Primary Trend Detection)
- **Long-term EMA (820 periods)**: Acts as the primary trend identifier
- Chosen specifically for tech stocks' longer-term price waves
- Helps filter out minor market noise while capturing major trend changes
- 820 periods approximately represents 3.2 years of trading days
- **Medium-term EMA (320 periods)**: Serves as trend confirmation
- Approximately 1.25 years of trading data
- Provides earlier entry signals while maintaining trend reliability
- Helps identify potential trend reversals before the major trend shift
### 2. Volume Analysis Component
The script employs a dynamic volume analysis system:
- Calculates 20-period moving average of volume as baseline
- Requires 1.5x surge above baseline for signal confirmation
- Volume surge requirement helps filter out weak moves and potential false breakouts
- Different from standard volume indicators as it uses adaptive thresholds
### 3. RSI Momentum Filter
Implements a specialized RSI configuration:
- 14-period RSI with dynamic overbought/oversold levels
- Oversold threshold: 30 (customizable)
- Overbought threshold: 70 (customizable)
- Used as a confirmation tool rather than primary signal generator
## Signal Generation Logic
### Buy Signal Requirements
1. Price must cross above 820 EMA (PRIMARY CONDITION)
2. Current price must be above 320 EMA (CONFIRMATION)
3. RSI must be above 30 but below 70 (MOMENTUM CHECK)
4. Volume must be 1.5x above 20-period average (STRENGTH VALIDATION)
### Sell Signal Requirements
1. Price must cross below 820 EMA (PRIMARY CONDITION)
2. Current price must be below 320 EMA (CONFIRMATION)
3. RSI must be above 30 but below 70 (MOMENTUM CHECK)
4. Volume must be 1.5x above 20-period average (STRENGTH VALIDATION)
## Risk Management Integration
The script automatically calculates key risk levels based on volatility:
1. **Stop Loss Calculation**:
- Default: 2% below entry for buys
- Dynamically adjusted based on price point
- Can be modified through input parameters
2. **Take Profit Targets**:
- Primary target: 6% above entry (3:1 reward-risk ratio)
- Based on historical tech stock movement patterns
- Adjustable through input parameters
## Multi-Symbol Implementation
The scanner monitors 6 symbols simultaneously using:
- Separate security calls for each data point
- Optimized data requests to prevent overload
- Individual signal processing for each symbol
- Synchronized alert generation system
## Technical Implementation Details
1. **Data Processing**:
```
- Security data requests on 10-minute timeframe
- Individual EMA calculations per symbol
- Separate volume analysis threads
- RSI calculations with standard deviation normalization
```
2. **Signal Processing**:
```
- Cross-verification of all conditions
- Time-based signal validation
- Volume surge confirmation
- Trend alignment check
```
3. **Alert System**:
```
- Bar-close confirmation required
- Multi-condition validation
- Detailed price level inclusion
- Risk parameter integration
```
## Optimization Features
1. **Memory Usage**:
- Optimized security calls
- Efficient data structure
- Reduced redundant calculations
2. **Processing Efficiency**:
- Single-pass data analysis
- Combined indicator calculations
- Streamlined alert generation
## Practical Application
The system is designed for:
1. Swing Trading (primary use)
2. Position Trading (secondary use)
3. Technical Breakout Trading
Optimal timeframes:
- Primary: 4H charts
- Secondary: Daily charts
- Verification: 1H charts
## Default Configuration
The scanner is preset to monitor key tech stocks:
- TSLA: High-volatility tech leader
- NVDA: Semiconductor sector benchmark
- AVGO: Stable tech infrastructure
- TSM: Global chip manufacturer
- META: Social media sector leader
- AMZN: E-commerce/Cloud computing leader
Each symbol can be modified through input parameters.
## Version Information
- Current Version: 1.3
- Last Updated: November 2024
- Compatibility: TradingView Pro/Pro+/Premium
## Limitations & Considerations
- Limited to 6 symbols due to TradingView security request limits
- Requires consistent market volume for optimal performance
- Best suited for liquid stocks with significant daily volume
- May need parameter adjustments during extreme market conditions

Reversal Signals [AlgoAlpha]📈🔄 Reversal Signals – Master Market Reversals with Precision! 🚀✨
Elevate your trading strategy with the Reversal Signals indicator by AlgoAlpha. This advanced tool is designed to pinpoint potential bullish and bearish reversals by analyzing price action and, optionally, volume confirmations. It seamlessly combines reversal detection with trend analysis, giving you a comprehensive view of market dynamics to make informed trading decisions.
Key Features
🔎 Price Action Reversal Detection : Identifies potential reversal points by comparing current price movements against historical candle patterns within a customizable lookback period.
📊 Volume Confirmation : Optionally integrates volume analysis to confirm the strength of reversal signals, enhancing their reliability.
📈 Stepped Moving Average Trend Indicator : Employs a stepped moving average that adjusts at set intervals to reflect underlying market trends.
⚙️ Customizable Settings : Tailor the indicator to your trading style with adjustable parameters for lookback periods, confirmation windows, moving average types, and more.
🎨 Visual Signals and Trend Coloring : Clear on-chart labels for reversal signals and color-coded trend areas to quickly identify bullish and bearish conditions.
🔔 Alerts for Key Market Events : Set up custom alerts for reversal signals and trend shifts to stay ahead of market movements.
Quick Guide to Using the Reversal Signals Indicator :
🛠 Add the Indicator : Add the indicator to your favorites by pressing the star icon. Customize settings like Candle Lookback, Confirm Within, and Use Volume Confirmation to fit your trading style.
📊 Market Analysis : Observe the "𝓡" labels on the chart indicating bullish and bearish reversal signals. Look for labels below the bars for bullish signals and above the bars for bearish signals. Use the color-filled areas between the stepped moving average and the center line to assess market trends.
🔔 Alerts : Enable notifications for reversal signals and trend shifts to stay informed about market movements without constantly monitoring the chart.
How It Works
The Reversal Signals indicator operates by conducting a thorough analysis of price action over a user-defined lookback period. For a bullish reversal, the indicator checks if the current closing price is lower than the lows of the preceding candles within the lookback window, suggesting a potential oversold condition. If this criterion is met, it marks the candle as a potential reversal point and waits for confirmation within a specified number of subsequent candles. Confirmation occurs when the price rises above the high of the identified candle, signaling a bullish reversal. An optional volume confirmation can be enabled to ensure that the reversal is supported by higher-than-average trading volume, adding an extra layer of validation to the signal. The process is mirrored for bearish reversals, where the indicator looks for the closing price exceeding previous highs and awaits confirmation of a downward move.
Complementing the reversal signals, the indicator features a stepped moving average that serves as a dynamic trend indicator. This moving average updates at intervals defined by the MA Step Period and shifts direction based on price crossings. If the price remains above the stepped MA, it indicates a bullish trend, coloring the area between the MA and the center line in green. Conversely, if the price falls below the stepped MA, a bearish trend is signaled, and the area is shaded red. This visual representation helps traders quickly assess the prevailing market trend and align their trading decisions accordingly.
Experience a new level of market insight with the Reversal Signals indicator. Add it to your TradingView chart today and enhance your ability to detect and act on key ma

Fibonacci Moving Average PlusFibonacci Moving Average Plus is a sophisticated technical indicator that employs the first 15 numbers of the Fibonacci sequence to create dynamic moving average channels. This indicator aims to capture both immediate and long-term price movements by calculating Exponential Moving Averages (EMAs) based on these Fibonacci values. By using Fibonacci-based moving averages for both high and low price points, the indicator generates a visual channel that reflects the ebb and flow of market trends, acting as potential zones of support and resistance. Additionally, the indicator provides midline, retracement, and extension levels rooted in Fibonacci ratios, which are frequently observed as key levels for reversals or trend continuation.
Ideology Behind Using Fibonacci Sequence-Based Moving Averages
The Fibonacci sequence, known for its mathematical harmony and prevalence in natural patterns, is widely utilized in technical analysis to identify potential turning points in markets. In this indicator, the first 15 Fibonacci numbers (5, 8, 13, 21, etc.) are used as the lookback periods for EMAs to capture different layers of market sentiment. These moving averages represent timeframes that are theoretically in alignment with the natural rhythms of market cycles, where key levels—often coinciding with Fibonacci numbers—can act as magnetic points for price.
The Fibonacci high and low channels aim to encapsulate price action, giving traders a sense of whether the market is trending, consolidating, or experiencing reversal pressure. These levels, grounded in both mathematics and market psychology, help traders spot areas where price might face resistance or find support.
Key Features
Fibonacci Moving Average High and Low: This indicator calculates the high and low EMAs based on Fibonacci sequence numbers (e.g., 5, 8, 13, etc.) for enhanced trend analysis.
Golden Pocket Retracement (GPR) and Extension (GPE) Bands: Displays common Fibonacci retracement and extension levels (0.618, 0.65 for retracement, and 1.618, 1.65 for extension).
Midline: Plots the average of the Fibonacci high and low to act as an additional reference level.
Stop-Loss Levels: Provides suggested stop-loss levels based on Fibonacci levels for both long and short positions.
Basic User Guide
Adjust Input Settings:
Input Timeframe: Set a specific timeframe for the Fibonacci moving average calculation, separate from the chart's primary timeframe.
Show Fibonacci MA High/Low: Toggle the visibility of the high and low Fibonacci moving averages.
Show Mid Line: Display a midline for added trend reference.
Show Golden Pocket Bands: Choose to display retracement or extension bands for potential support or resistance zones.
Show Stop-Loss Levels: Enable to visualize potential stop-loss levels for both long and short trades.
Interpretation:
Fibonacci MA High and Low: Use these lines to gauge the general trend. When the price is above both, it may indicate an uptrend; below both, a downtrend.
Golden Pocket Retracement: This zone (between 0.618 and 0.65) is often a key level for potential reversals or support/resistance.
Golden Pocket Extension: The 1.618 and 1.65 levels can indicate potential profit-taking or trend exhaustion points.
Stop-Loss Levels: The calculated stop-loss levels (long SL below and short SL above) can aid in risk management.
Customization:
You can customize the appearance and visibility of each component through the input settings to fit your specific strategy and visual preferences.
This indicator should be used alongside other technical analysis tools to provide a more comprehensive trading approach.
This Indicator would not exist without the original contributions and blessing from Sofien Kaabar

Volume Flow ConfluenceVolume Flow Confluence (CMF-KVO Integration)
Core Function:
The Volume Flow Confluence Indicator combines two volume-analysis methods: Chaikin Money Flow (CMF) and the Klinger Volume Oscillator (KVO). It displays a histogram only when both indicators align in their respective signals.
Signal States:
• Green Bars: CMF is positive (> 0) and KVO is above its signal line
• Red Bars: CMF is negative (< 0) and KVO is below its signal line
• No Bars: When indicators disagree
Technical Components:
Chaikin Money Flow (CMF):
Measures the relationship between volume and price location within the trading range:
• Calculates money flow volume using close position relative to high/low range
• Aggregates and normalizes over specified period
• Default period: 20
Klinger Volume Oscillator (KVO):
Evaluates volume in relation to price movement:
• Tracks trend changes using HLC3
• Applies volume force calculation
• Uses two EMAs (34/55) with a signal line (13)
Practical Applications:
1. Signal Identification
- New colored bars after blank periods show new agreement between indicators
- Color intensity differentiates new signals from continuations
- Blank spaces indicate lack of agreement
2. Trend Analysis
- Consecutive colored bars show continued indicator agreement
- Transitions between colors or to blank spaces show changing conditions
- Can be used alongside other technical analysis tools
3. Risk Considerations
- Signals are not predictive of future price movement
- Should be used as one of multiple analysis tools
- Effectiveness may vary across different markets and timeframes
Technical Specifications:
Core Algorithm
CMF = Σ(((C - L) - (H - C))/(H - L) × V)n / Σ(V)n
KVO = EMA(VF, 34) - EMA(VF, 55)
Where VF = V × |2(dm/cm) - 1| × sign(Δhlc3)
Signal Line = EMA(KVO, 13)
Signal Logic
Long: CMF > 0 AND KVO > Signal
Short: CMF < 0 AND KVO < Signal
Neutral: All other conditions
Parameters
CMF Length = 20
KVO Fast = 34
KVO Slow = 55
KVO Signal = 13
Volume = Regular/Actual Volume
Data Requirements
Price Data: OHLC
Volume Data: Required
Minimum History: 55 bars
Recommended Timeframe: ≥ 1H
Credits:
• Marc Chaikin - Original CMF development
• Stephen Klinger - Original KVO development
• Alex Orekhov (everget) - CMF script implementation
• nj_guy72 - KVO script implementation
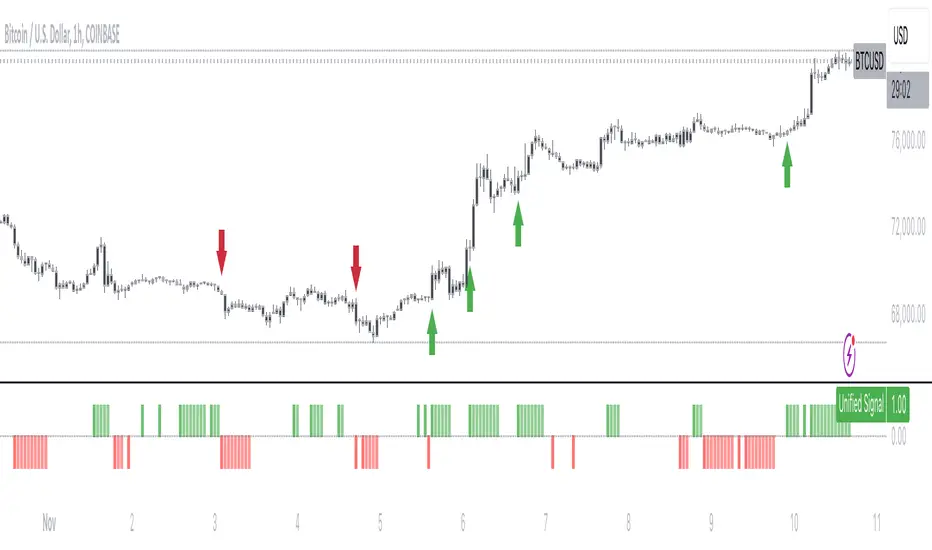
Enhanced Market Analyzer with Adaptive Cognitive LearningThe "Enhanced Market Analyzer with Advanced Features and Adaptive Cognitive Learning" is an advanced, multi-dimensional trading indicator that leverages sophisticated algorithms to analyze market trends and generate predictive trading signals. This indicator is designed to merge traditional technical analysis with modern machine learning techniques, incorporating features such as adaptive learning, Monte Carlo simulations, and probabilistic modeling. It is ideal for traders who seek deeper market insights, adaptive strategies, and reliable buy/sell signals.
Key Features:
Adaptive Cognitive Learning:
Utilizes Monte Carlo simulations, reinforcement learning, and memory feedback to adapt to changing market conditions.
Adjusts the weighting and learning rate of signals dynamically to optimize predictions based on historical and real-time data.
Hybrid Technical Indicators:
Custom RSI Calculation: An RSI that adapts its length based on recursive learning and error adjustments, making it responsive to varying market conditions.
VIDYA with CMO Smoothing: An advanced moving average that incorporates Chander Momentum Oscillator for adaptive smoothing.
Hamming Windowed VWMA: A volume-weighted moving average that applies a Hamming window for smoother calculations.
FRAMA: A fractal adaptive moving average that responds dynamically to price movements.
Advanced Statistical Analysis:
Skewness and Kurtosis: Provides insights into the distribution and potential risk of market trends.
Z-Score Calculations: Identifies extreme market conditions and adjusts trading thresholds dynamically.
Probabilistic Monte Carlo Simulation:
Runs thousands of simulations to assess potential price movements based on momentum, volatility, and volume factors.
Integrates the results into a probabilistic signal that informs trading decisions.
Feature Extraction:
Calculates a variety of market metrics, including price change, momentum, volatility, volume change, and ATR.
Normalizes and adapts these features for use in machine learning algorithms, enhancing signal accuracy.
Ensemble Learning:
Combines signals from different technical indicators, such as RSI, MACD, Bollinger Bands, Stochastic Oscillator, and statistical features.
Weights each signal based on cumulative performance and learning feedback to create a robust ensemble signal.
Recursive Memory and Feedback:
Stores and averages past RSI calculations in a memory array to provide historical context and improve future predictions.
Adaptive memory factor adjusts the influence of past data based on current market conditions.
Multi-Factor Dynamic Length Calculation:
Determines the length of moving averages based on volume, volatility, momentum, and rate of change (ROC).
Adapts to various market conditions, ensuring that the indicator is responsive to both high and low volatility environments.
Adaptive Learning Rate:
The learning rate can be adjusted based on market volatility, allowing the system to adapt its speed of learning and sensitivity to changes.
Enhances the system's ability to react to different market regimes.
Monte Carlo Simulation Engine:
Simulates thousands of random outcomes to model potential future price movements.
Weights and aggregates these simulations to produce a final probabilistic signal, providing a comprehensive risk assessment.
RSI with Dynamic Adjustments:
The initial RSI length is adjusted recursively based on calculated errors between true RSI and predicted RSI.
The adaptive RSI calculation ensures that the indicator remains effective across various market phases.
Hybrid Moving Averages:
Short-Term and Long-Term Averages: Combines FRAMA, VIDYA, and Hamming VWMA with specific weights for a unique hybrid moving average.
Weighted Gradient: Applies a color gradient to indicate trend strength and direction, improving visual clarity.
Signal Generation:
Generates buy and sell signals based on the ensemble model and multi-factor analysis.
Uses percentile-based thresholds to determine overbought and oversold conditions, factoring in historical data for context.
Optional settings to enable adaptation to volume and volatility, ensuring the indicator remains effective under different market conditions.
Monte Carlo and Learning Parameters:
Users can customize the number of Monte Carlo simulations, learning rate, memory factor, and reward decay for tailored performance.
Applications:
Scalping and Day Trading:
The fast response of the adaptive RSI and ensemble learning model makes this indicator suitable for short-term trading strategies.
Swing Trading:
The combination of long-term moving averages and probabilistic models provides reliable signals for medium-term trends.
Volatility Analysis:
The ATR, Bollinger Bands, and adaptive moving averages offer insights into market volatility, helping traders adjust their strategies accordingly.
Half Trend Regression [AlgoAlpha]Introducing the Half Trend Regression indicator by AlgoAlpha, a cutting-edge tool designed to provide traders with precise trend detection and reversal signals. This indicator uniquely combines linear regression analysis with ATR-based channel offsets to deliver a dynamic view of market trends. Ideal for traders looking to integrate statistical methods into their analysis to improve trade timing and decision-making.
Key Features
🎨 Customizable Appearance : Adjust colors for bullish (green) and bearish (red) trends to match your charting preferences.
🔧 Flexible Parameters : Configure amplitude, channel deviation, and linear regression length to tailor the indicator to different time frames and trading styles.
📈 Dynamic Trend Line : Utilizes linear regression of high, low, and close prices to calculate a trend line that adapts to market movements.
🚀 Trend Direction Signals : Provides clear visual signals for potential trend reversals with plotted arrows on the chart.
📊 Adaptive Channels : Incorporates ATR-based channel offsets to account for market volatility and highlight potential support and resistance zones.
🔔 Alerts : Set up alerts for bullish or bearish trend changes to stay informed of market shifts in real-time.
How to Use
🛠 Add the Indicator : Add the Half Trend Regression indicator to your chart from the TradingView library. Access the settings to customize parameters such as amplitude, channel deviation, and linear regression length to suit your trading strategy.
📊 Analyze the Trend : Observe the plotted trend line and the filled areas under it. A green fill indicates a bullish trend, while a red fill indicates a bearish trend.
🔔 Set Alerts : Use the built-in alert conditions to receive notifications when a trend reversal is detected, allowing you to react promptly to market changes.
How It Works
The Half Trend Regression indicator calculates linear regression lines for the high, low, and close prices over a specified period to determine the general direction of the market. It then computes moving averages and identifies the highest and lowest points within these regression lines to establish a dynamic trend line. The trend direction is determined by comparing the moving averages and previous price levels, updating as new data becomes available. To account for market volatility, the indicator calculates channels above and below the trend line, offset by a multiple of half the Average True Range (ATR). These channels help visualize potential support and resistance zones. The area under the trend line is filled with color corresponding to the current trend direction—green for bullish and red for bearish. When the trend direction changes, the indicator plots arrows on the chart to signal a potential reversal, and alerts can be set up to notify you. By integrating linear regression and ATR-based channels, the indicator provides a comprehensive view of market trends and potential reversal points, aiding traders in making informed decisions.
Enhance your trading strategy with the Half Trend Regression indicator by AlgoAlpha and gain a statistical edge in the markets! 🌟📊
Implied Fair Value Gap (IFVG) ICT [TradingFinder] Hidden FVG OTE🔵 Introduction
The Implied Fair Value Gap (IFVG) is distinctive due to its unique three-candlestick formation, which differentiates it from conventional Fair Value Gaps.
Implied fair value represents an estimated worth of an asset—often a business or its goodwill—based on the price likely to be received in a structured transaction between market participants at a specific point in time.
In the ever-evolving world of technical analysis, pinpointing price reversal points and market anomalies can significantly enhance trading strategies and decision-making for traders and investors. Among the advanced concepts gaining traction in this field is the Implied Fair Value Gap (IFVG), introduced by the renowned analyst Inner Circle Trader (ICT).
This tool has proven to be an effective method for identifying hidden supply and demand zones in financial markets, offering a unique edge to traders looking for high-probability setups.
Unlike traditional gaps that are visible on price charts, IFVG is a hidden gap that doesn’t appear explicitly on the chart and thus requires specialized technical analysis tools for accurate identification.
This hidden gap can signal potential price reversals and offers traders insight into high-liquidity areas where price is likely to react. This article will guide you through using the ICT Implied Fair Value Gap Indicator effectively, covering its settings, usage strategies, and key features to help you make informed decisions in the market.
🟣 Bullish Implied FVG
🟣 Bearish Implied FVG
🔵 How to Use
The IFVG indicator is designed to assist traders in recognizing hidden support and resistance zones by identifying Bullish and Bearish IFVG patterns. With this tool, traders can make better-informed decisions about suitable entry and exit points for their trades based on these patterns.
🟣 Bullish Implied Fair Value Gap
This pattern occurs in an uptrend when a large bullish candlestick forms, with the wicks of the previous and following candles overlapping the body of the central candlestick.
This overlap creates a demand zone or a hidden support level, which can act as an ideal entry point for buy trades. Often, when the price returns to this area, it is likely to resume its upward trend, presenting a profitable buying opportunity.
🟣 Bearish Implied Fair Value Gap
This pattern is similar but forms in downtrends. Here, a large bearish candlestick appears on the chart, with the wicks of adjacent candles overlapping its body. This overlap defines a supply zone or a hidden resistance level and serves as a signal for potential sell trades.
When the price returns to this zone, it often continues its downward trend, providing an optimal point for entering sell trades.
The IFVG indicator also includes various filters that traders can use to refine their analysis based on market conditions. These filters, including Very Aggressive, Aggressive, Defensive, and Very Defensive, allow users to customize the IFVG zones' width, offering flexibility according to the trader’s risk tolerance and trading style.
🟣 Example Trading Scenarios
Suppose you’re in a strong uptrend and the IFVG indicator identifies a Bullish IFVG zone. In this scenario, you could consider entering a buy trade when the price retraces to this zone, expecting the uptrend to resume. Conversely, in a downtrend, a Bearish IFVG zone can signal a favorable entry point for short trades when the price revisits this area.
🔵 Settings
Implied Block Validity Period: This parameter specifies the validity period of each identified block, taking into account the number of bars that have passed since its formation. Proper adjustment of this period helps traders focus only on relevant zones, increasing the accuracy of the analysis.
Mitigation Level OB : This option defines the mitigation level for supply and demand blocks (Order Blocks), with settings including Proximal, 50% OB, and Distal.
Depending on the selected level, the indicator will focus on closer, mid-range, or farther points for block identification, allowing traders to adjust for the level of precision required.
Implied Filter : Activating this filter allows traders to apply conditions based on the width of the IFVG zones. With options like Very Aggressive and Very Defensive, traders can control the width of IFVG zones to suit their risk management strategy—whether they prefer high-risk setups or low-risk setups.
Display and Color Settings : This section enables users to customize the appearance of the IFVG zones on their charts. Traders can set different colors for Bullish and Bearish zones, allowing for easier distinction and improved visualization.
Alert Settings : One of the standout features of the IFVG indicator is the alert system. By setting up alerts, users can be notified whenever the price approaches a demand or supply zone.
Alerts can be customized to trigger Once Per Bar (one alert per bar) or Per Bar Close (alert at the close of each bar), ensuring that traders stay updated on critical price movements without needing to monitor the chart continuously.
🔵 Conclusion
The ICT Implied Fair Value Gap (IFVG) indicator is a powerful and sophisticated tool in technical analysis, allowing professional traders to identify hidden supply and demand zones and use them as entry and exit points for buy and sell trades.
This indicator’s automatic detection of IFVG zones helps traders uncover hidden trading opportunities that can enhance their analysis.
While the IFVG indicator offers numerous advantages, it is important to use it in conjunction with other technical analysis tools and sound risk management practices.
IFVG alone does not guarantee profitability in trading; it works best when combined with other indicators such as volume analysis and trend-following indicators for a comprehensive trading strategy.

Zig Zag with Adaptive ProjectionThe "Zig Zag with Adaptive Projection" is an advanced technical analysis tool designed for TradingView's Pine Script platform. This indicator builds upon the traditional ZigZag concept by incorporating adaptive projection capabilities, offering traders a more sophisticated approach to identifying significant price movements and forecasting potential future price levels.
At its core, the indicator utilizes a user-defined period to calculate and display the ZigZag pattern on the chart. This pattern connects significant highs and lows, effectively filtering out minor price fluctuations and highlighting the overall trend structure. Users can customize the appearance of the ZigZag lines, including their color, style (solid, dashed, or dotted), and width, allowing for easy visual integration with other chart elements.
What sets this indicator apart is its adaptive projection feature. By analyzing historical ZigZag patterns, the indicator calculates average lengths and slopes of both bullish and bearish trends. This data is then used to project potential future price movements, adapting to the current market context. The projection lines extend from the most recent ZigZag point, offering traders a visual representation of possible price targets based on historical behavior.
The adaptive nature of the projections is particularly noteworthy. The indicator considers the current trend direction, the length of the most recent ZigZag segment, and compares it to historical averages. This approach allows for more nuanced projections that account for recent market dynamics. If the current trend is stronger than average, the projection will extend further, and vice versa.
From a technical standpoint, the indicator leverages Pine Script v5's capabilities, utilizing arrays for efficient data management and implementing dynamic line drawing for both the ZigZag and projection lines. This ensures smooth performance even when analyzing large datasets.
Traders can fine-tune the indicator to their preferences with several customization options. The ZigZag period can be adjusted from 10 to 100, allowing for sensitivity adjustments to match different trading timeframes. The projection lines can be toggled on or off and their appearance customized, providing flexibility in how the forecast is displayed.
In essence, the "Zig Zag with Adaptive Projection" indicator combines traditional trend analysis with forward-looking projections. It offers traders a tool to not only identify significant price levels but also to anticipate potential future movements based on historical patterns. This blend of retrospective analysis and adaptive forecasting makes it a valuable addition to a trader's technical analysis toolkit, particularly for those interested in trend-following strategies or looking for potential reversal points.
