在腳本中搜尋"the script"
RSI Trendchange for BTC by OSHELLThe script indicates typical turning points on RSI for bitcoin. Buying indicator is more reliable especially for short term trades.

Golden Ratio Multiplier: Multiplied Moving AveragesThe script for plotting DMAs from the study made by @PositiveCrypto (twitter)

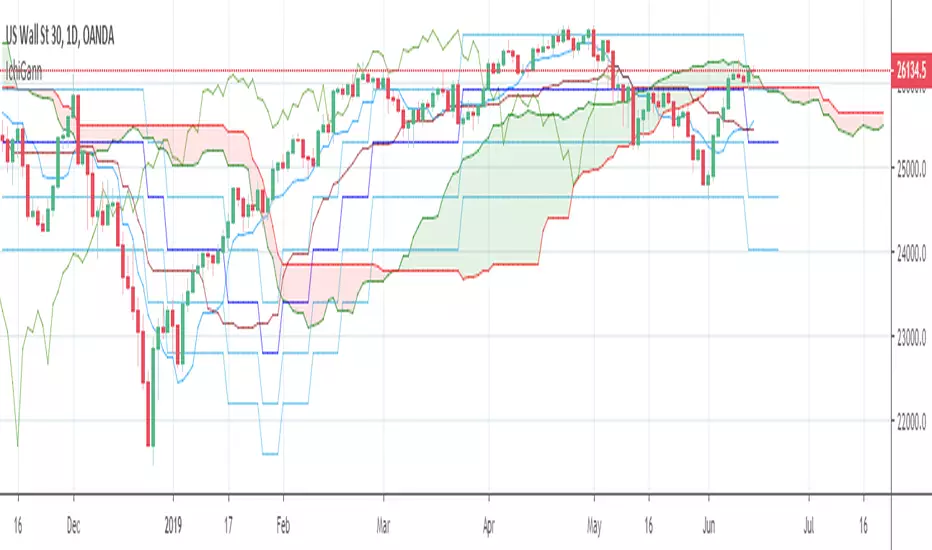
Ichmoku + GannThe script combines Ichimoku Clouds with Gann levels. Kijunsen is used as basis of calculation of 4 Gann levels above and below it. By default Gann Leves at 360 degrees are plotted but one can choose the desired degrees separation.
Doji's/Engulfing Candles/Supertrend v1.0The Script locates Bearish/Bullish Engulfing Candlesticks and Dojis in combination with Supertrend v1.0.
Original Authors: HPotter + Rajandran R


Volume Power K2The script is reading the accumulation and distribution then the RSI read these values.


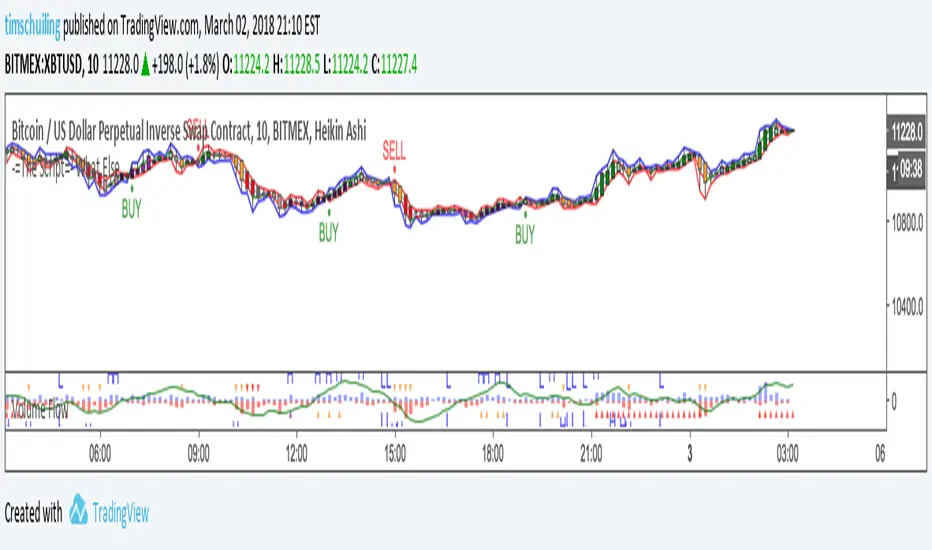
Buy Sell Signal & IchimokuThe script totally based on technical analysis. Indication of "Buy" will appear once the conditions are matched. Please don't follow "Buy" indication if it appear at top of chart.
Yellow candle is a pre-alert for any momentum coming together with increasing of price.
Yellow circle at volume bar is to show that the momentum was there.
Orange line is support & resistance.


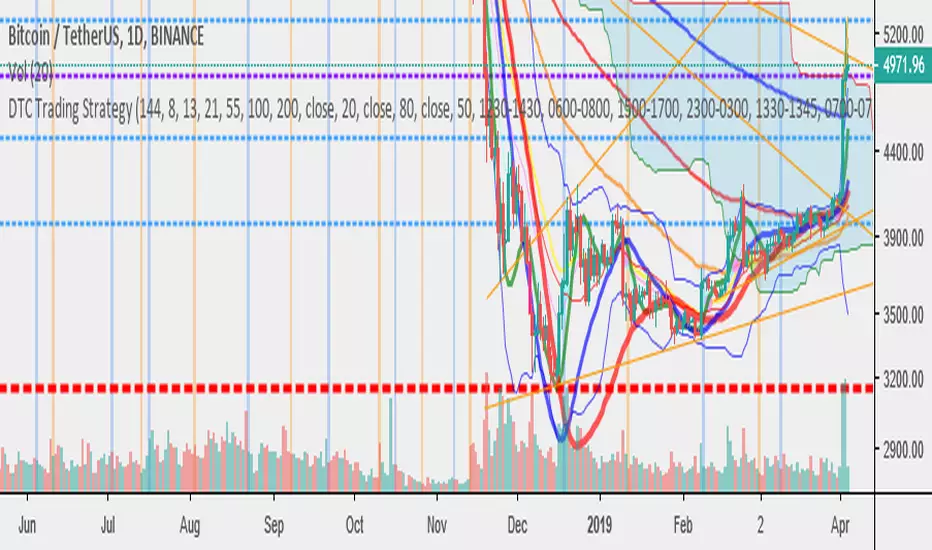
DTC Trading StrategyThe script contains various commonly used indicators, such as:
Bollingerbands
Ichi cloud
HMA
MA
FIB levels
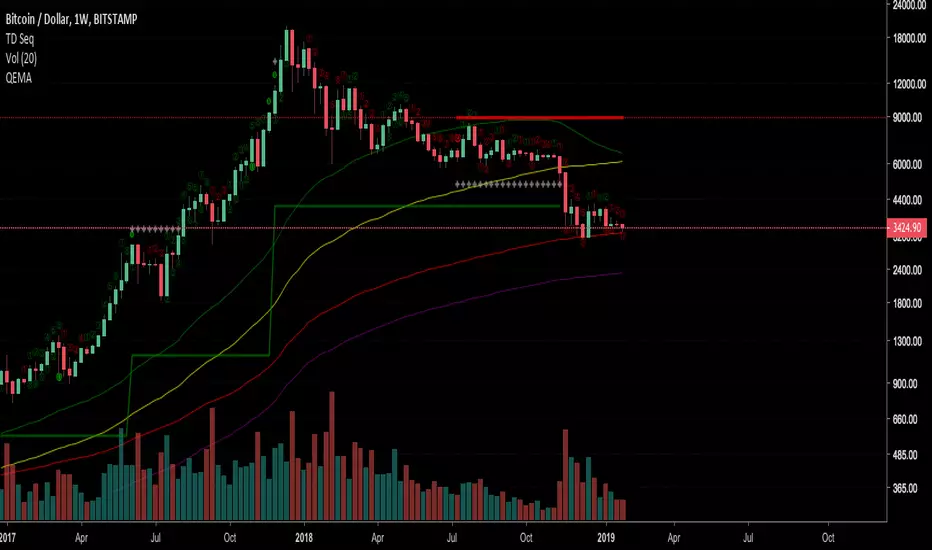
QEMA - Quadruple Moving Averages (50,100,200,300)The script combines the common moving averages 50,100 and 200 and adds an additional MA300 to the graph.
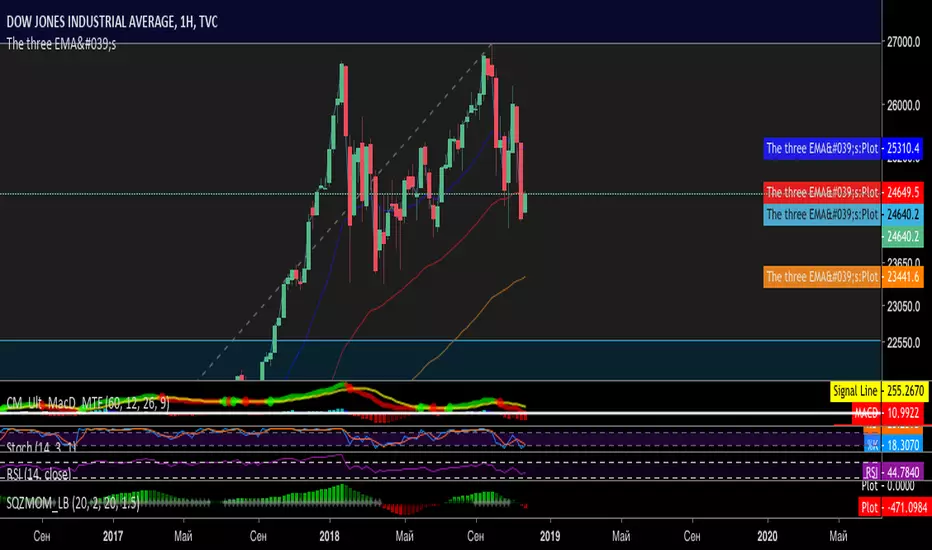
The Three EMA'sThe script is three EMA's that are fit into one indicator. Can be well used in EMA trading system for short and long term.
Bitcoin StableCoins Histogram -- @CryptoNTezThe script will let you see the histogram volume of TrueUSD -- USDTether -- USD or the combination of them.
The values are being pulled from all the available pairs in Tradingview. Once new pairs hit the site I will be adding them aswell
enjoy :)

Bitfinex Open Interest ChangeThe script shows changes in Bitfinex open interest from the previous candle.
Key:
Positive green bar = Open interest increase, predominantly longs opening.
Positive red bar = Open interest increase, predominantly shorts opening.
Negative green bar = Open interest decrease, predominantly longs closing.
Negative red bar = Open interest decrease, predominantly shorts closing.
Token selection between top trading pairs is in the options.


Ichimoku Breakout StrategyThe Script generates signels and alerts on Kumo breakouts ,Tenkan and Kijun Crossover. It helps to catch the big moves when combined with other Indicators and Oscillators.
Note: There are possibilities for false breakouts alerts as no indicators and oscillators are 100% accurate . So please ensure to have additional Indicators and Oscillators before entering the trade.

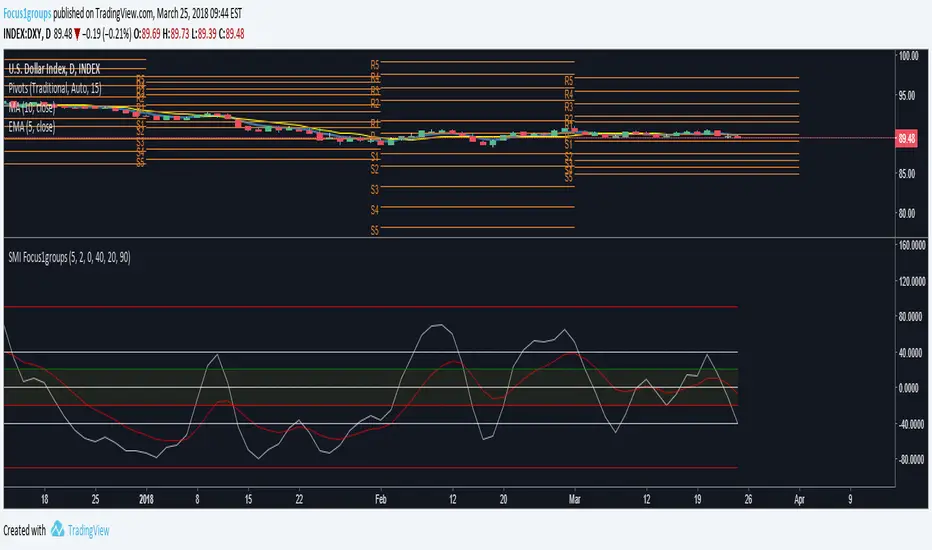
SMI Focus1groupsThe script is different because it enables the trader to identify possible buy and sell signals in a noisy market.