[blackcat] L2 Ehlers Early Onset TrendLevel: 2
Background
John F. Ehlers introuced Early Onset Trend Indicator in Aug, 2014.
Function
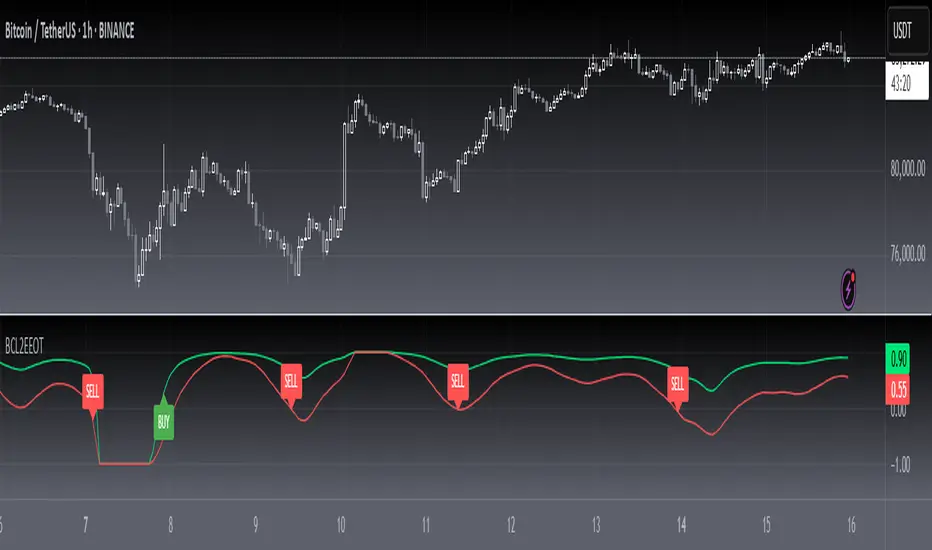
In “The Quotient Transform” in Aug, 2014, John Ehlers described an early trend detection method, the idea of the quotient transform, that was designed to reduce the lag often found in other trend indicators. I provided a script with pine v4 code here for the early-onset trend-detection indicator and also describes an approach for creating a strategy based on this indicator as an example.
The entry points displayed in blue on the price chart are defined by the top Onset Trend Detector upper quotient crossing above a threshold value e.g zero or 0.25/-0.25 here in this script. In the article, Ehlers suggested using a different K value for the exit, so the exit points are determined by the lower Onset Trend Detector quotient crossing below a threshold e.g. zero or -0.25/0.25 here in this script.
Key Signal
Quotient1 --> upper quotient in yellow which determines long entry
Quotient2 --> lower quotient in fuchsia which determines short entry
long ---> long entry signal
short ---> short entry signal
Pros and Cons
100% John F. Ehlers definition translation, even variable names are the same. This help readers who would like to use pine to read his book.
Remarks
The 82th script for Blackcat1402 John F. Ehlers Week publication.
Readme
In real life, I am a prolific inventor. I have successfully applied for more than 60 international and regional patents in the past 12 years. But in the past two years or so, I have tried to transfer my creativity to the development of trading strategies. Tradingview is the ideal platform for me. I am selecting and contributing some of the hundreds of scripts to publish in Tradingview community. Welcome everyone to interact with me to discuss these interesting pine scripts.
The scripts posted are categorized into 5 levels according to my efforts or manhours put into these works.
Level 1 : interesting script snippets or distinctive improvement from classic indicators or strategy. Level 1 scripts can usually appear in more complex indicators as a function module or element.
Level 2 : composite indicator/strategy. By selecting or combining several independent or dependent functions or sub indicators in proper way, the composite script exhibits a resonance phenomenon which can filter out noise or fake trading signal to enhance trading confidence level.
Level 3 : comprehensive indicator/strategy. They are simple trading systems based on my strategies. They are commonly containing several or all of entry signal, close signal, stop loss, take profit, re-entry, risk management, and position sizing techniques. Even some interesting fundamental and mass psychological aspects are incorporated.
Level 4 : script snippets or functions that do not disclose source code. Interesting element that can reveal market laws and work as raw material for indicators and strategies. If you find Level 1~2 scripts are helpful, Level 4 is a private version that took me far more efforts to develop.
Level 5 : indicator/strategy that do not disclose source code. private version of Level 3 script with my accumulated script processing skills or a large number of custom functions. I had a private function library built in past two years. Level 5 scripts use many of them to achieve private trading strategy.
在腳本中搜尋"the script"
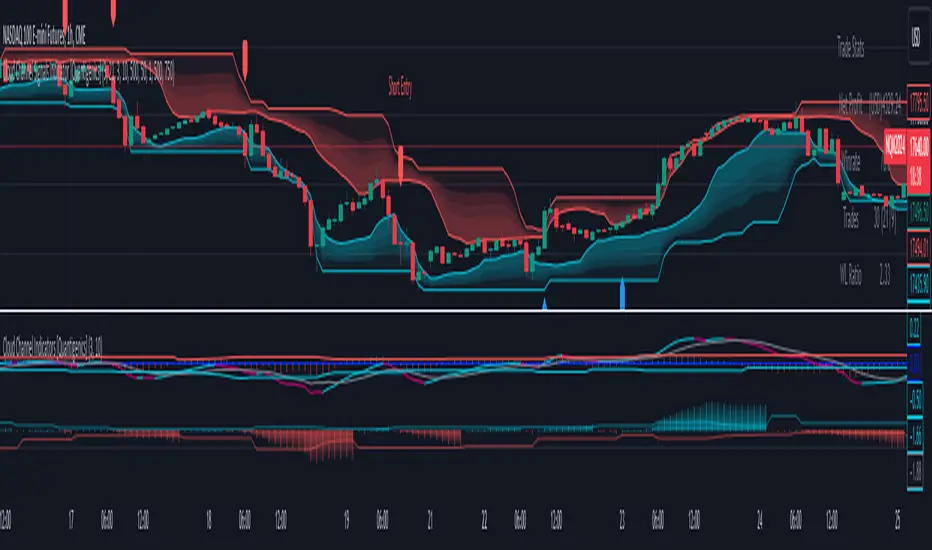
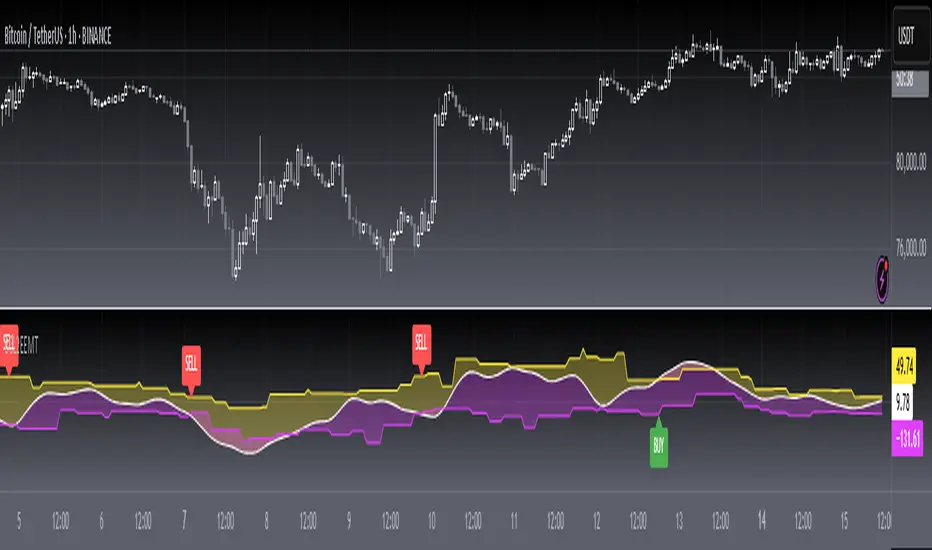
Cloud Channel Indicators [Quantigenics]The "Cloud Channel Indicators " script forms an integral part of a sophisticated trading approach, offering in-depth market analysis through its High Precision Oscillator and Trend Bias Indicator. These components provide traders with nuanced insights into market momentum and overall trend direction, making them invaluable for informed trading decisions. This script is further enhanced when used alongside its intended counterpart, the "Cloud Channel Signals " script, which displays the “cloud” indicator and Buy/Sell signals on charts. This combination creates a comprehensive and integrated trading system, suitable for various market conditions and trading styles.
The "Cloud Channel Indicators” script is a detailed trading indicator that merges advanced data analysis techniques with user-customizable features. It combines oscillators, dynamic levels, trend bias, and color settings, allowing users to tailor its functionality and visual representation. Unique to this script is its use of Gaussian and Rational Quadratic kernel estimates for data smoothing, enhancing the calculation of oscillator values. It dynamically adjusts OverBought and OverSold levels based on the oscillator's behavior and leverages array operations for tracking market peaks and lows. The script also integrates a Trend Bias indicator using highest highs, lowest lows, and exponential moving averages (EMAs), all of which are displayed through a range of plotting and visual elements. This synthesis of sophisticated techniques provides a multifaceted tool for technical market analysis.
As with all of our scripts, the "Cloud Channel Indicators"script, is designed to work on ANY symbol and time frame. The input parameters can be adjusted to fit your specific trading style.
Technical Composition :
High Precision Oscillator : This component focuses on capturing market momentum and identifying critical turning points. It uses advanced kernel-based estimations combined with a unique oscillator line and signal line setup to pinpoint market extremes, offering traders insights into potential entry and exit points.
Trend Bias Indicator : This indicator offers a broad view of the market's overall direction. It employs a combination of high and low-price averages, smoothed with an EMA, to indicate the prevailing market trend. The indicator is essential for verifying and complementing the insights provided by the High Precision Oscillator, ensuring that trades align with the broader market trend.
How to Use :
Integration with "Cloud Channel Signals" Script : For optimal use, synchronize this script with the "Cloud Channel Signals " script. This is essential for the script to provide meaningful analysis and insights.
Please note: The signals and cloud indicator displayed in this screenshot are part of the companion 'Cloud Channel Signals' script, which is not included in the 'Cloud Channel Indicators' script you are currently viewing.
The 'Cloud Channel Signals' script can be found here:
Analyzing Market Momentum with High Precision Oscillator : Utilize the High Precision Oscillator to identify market momentum and critical turning points. Look for extreme values on the oscillator line and signal line to pinpoint potential entry and exit points.
Understanding Market Trend with Trend Bias Indicator : Use the Trend Bias Indicator to get a broad view of the market's overall direction. This indicator helps confirm the insights provided by the High Precision Oscillator, aligning trades with the market trend.
Customizing Indicator Settings : Tailor the script to your trading style by adjusting the input parameters such as Oscillator Length, Trend Bias Length, and levels for top and bottom bounds. Ensure these settings match those in the "Cloud Channel Signals" script.
Interpreting Oscillator and Trend Bias : Monitor the High Precision Oscillator for overbought or oversold conditions. Use the Trend Bias Indicator to determine if the market is in an uptrend or downtrend and align your trades accordingly.
Using Dynamic Levels : Activate the Dynamic Level feature for an adaptive analysis that adjusts to current market conditions.
Visual Analysis : Pay attention to the color changes and histogram patterns in the script's visualization to quickly assess market conditions and momentum.
Risk Management : Combine these insights with proper risk management strategies, adjusting positions based on oscillator extremes and trend bias indications. Additionally, further risk management and stop loss levels are provided when used with the "Cloud Channel Signals” script (see description for "Cloud Channel Signals”)
Input Parameter Settings :
Important Usage Guidance : For seamless integration with its counterpart, the "Cloud Channel Signals" script, it's crucial to align the input parameter settings across both scripts. When adjusting values from their defaults, ensure that corresponding parameters in both scripts are identically set. This synchronization is key to achieving a cohesive and accurate representation on your charts.
Show Indicator Name (ShowName) : Toggles the display of the indicator names on the chart.
Show Oscillator Indicator (ShowOscillator) : Controls the visibility of the High Precision Oscillator.
Oscillator Length (OscillatorLength) : Sets the period for the oscillator's kernel estimation.
Top Level and Bottom Level (TopLevel, BottomLevel) : Defines the upper and lower bounds for the oscillator, indicating overbought and oversold conditions.
Dynamic Level Toggle (Dynamic_Level_OnOff) : Enables the use of dynamic levels for more adaptive analysis.
Show Trend Bias Indicator (ShowTrendBias) : Toggles the display of the Trend Bias Indicator.
Trend Bias Length (TrendBiasLength) : Adjusts the calculation period for the Trend Bias Indicator.
Show Peak/Valley EMA Lines (ShowEmaLines) : Controls the display of additional EMA lines for peak and valley analysis.
Color Customization : Offers options to customize the color of various elements like Top Level, Bottom Level, Zero Line, and more. These parameters provide traders with extensive control and customization of the indicators, allowing for tailored analysis and application in various market conditions and trading styles.
The "Cloud Channel Indicators " script is a versatile and advanced tool designed for traders who seek a deep understanding of market trends and momentum. Its combination of the High Precision Oscillator and Trend Bias Indicator offers a multi-dimensional view of market behavior. The scripts was designed and intended to be used with the "Cloud Channel Signals " script, which complements the "Cloud Channel Indicators" by showing the “cloud” indicator as well as Buy/Sell signals on the charts.
Traders are advised to familiarize themselves with the functionalities of these indicators for effective application in their trading strategies. As with all trading tools, remember that trading involves risk and past performance is not indicative of future results.
You can see the “Author’s instructions" below to get immediate access to Cloud Channel Indicators & the rest of the “Quantigenics Premium Indicator Suite.
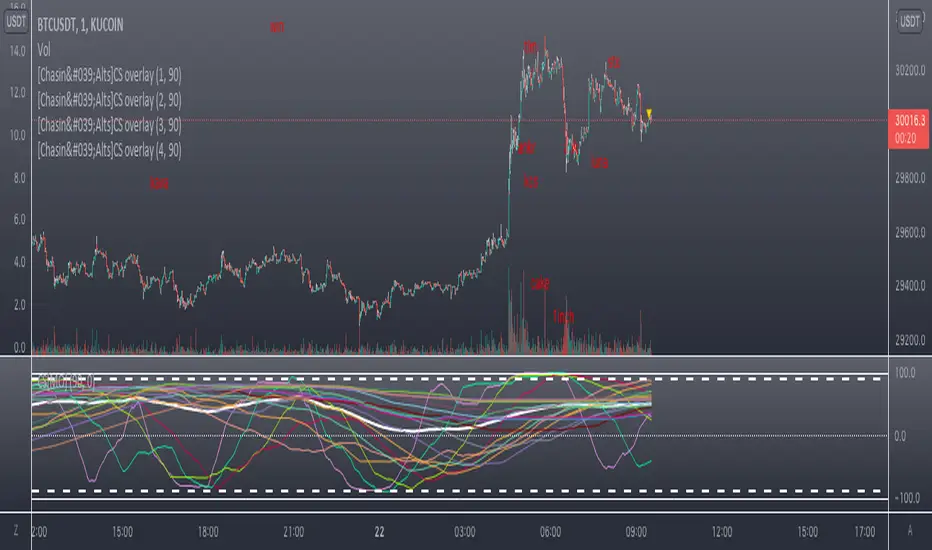
Counting Stars Overlay [Market Overview Series]Hi fellow tradeurs,
So it's always been my goal to provide one of my best scripts. This is from what I call my "Market Overview" series. It is a scanner for my second best script to date. Market Overview bc of its origins as a scanner of the Kucoin Margin Coins. I realize that there are more coins that there are more margin coins that Kucoin has but I wanted to have a solid 40 coins on each coin "set". If you are unfamiliar with what I mean by 'sets' then you can view my other scanner scripts on this account for futher elaboration but to sum it up....there are 4 sets of coins I have to choose from in the settings. Each set has 40 coins in them (as there is a cap of 40 security calls that can be made per each iteration of the script on the chart). That being said...if you have the capabilities then add this script 4 times to your chart and select a diff set for each copy of the script. This has the scanner in a way that I've yet to present in my others scripts. When the alert for a coin goes off then the coins name will be printed as a label over the main chart. BTW, this was built for the 1 min timeframe and have used it EXTENSIVELY and this is the best TF for how the settings are set. I will also publish another script that will be a visual aid for this one but will rather show all the plots associated with the code that is in this scanner. Know that for the scanner it'll be best to choose a coin that has at least 1 trade/update/printed candle per minute (to be safe use BTC or ETH chart or else some of the signals will be printed if the signal arrives at a point in time where the coin on the screen does not print a candle bc no new trade or update to trades occur in TradingView. For the visual aid script that I will add right after this, there will be 20 different plots that appear. When the AVG of all of these plots is beyond the OverBought line and then the AVG line is falling for 2 bars...THEN the long signal for that coin is generated (and vise versa for short signals) Lastly regarding the visual aid script, THAT ONE will ONLY show the 20 plots that are associated with the coin that the chart is selected for. So that one is not a scanner and is just a stand alone script (again) to show whats going on in the background of this scanner. Now, once you add it however many time you want to see however many sets of coins you want, I recommend merging the scales so that they are all on one scale. I prefer mine being on the left side but all you have to do is select the 3 dots in the scripts settings in the chart window and select the scale location line and it'll open another set of lines at which point you can select "merge to scale Z" (that will be the left scale) and will put all the scales together on the left. I forgot ****If you want to see a whole diff exchange's coins you much make changes to this original script and it is further described how to do so in one of my first publications**** I REALLY hope it becomes of some benefit to you in your trading as it abundantly has in my own. It is after all one of the best of my best. Ohh, I forgot to add alerts to this but will do so immediately following this. To finish, this script DOES NOT REPAINT as far as I have EVER seen (and I have extensively searched for it bc of how good the signals were, I figured I MUST HAVE made a mistake and it did so...but alas...it does not. If you notice something on the contrary do notify me immediately with the coin, exchange, TF, and time of the occurrence and we can go from there. If anyone has any great ideas for the script then please do also let me know and if I find anyone with some abilities that mingle well with my own then lets talk as I'm always looking for good ol chaps to help me out with other scripts bc if you think this is good....well....you must imagine that I've got better that I have not/am not publishing. Aaaaaanywho, goodluck to you all. I wish you the best. ***I've got good info on how to look out for false signals but I want to see what yall come up with first before I give away all my alpha.
AND if anyone asks questions that Ive already touched on in this description or already in the comments sections then maybe someone there would be willing to waste their time answering them bc I've done quite a bit of work here that I am HAPPY to hand over to the general public but if you are not willing to do the work in reading to possibly answer your inquiries that have already been answered then I am not willing to do that work for you again. Peace and love people...peace and love. Im out.
Realtime 5D Profile [LucF]█ OVERVIEW
This indicator displays a realtime profile that can be configured to visualize five dimensions: volume, price, time, activity and age. For each price level in a bar or timeframe, you can display total or delta volume or ticks. The tick count measures activity on a level. The thickness of each level's line indicates its age, which helps you identify the most recent levels.
█ WARNING
The indicator only works in real time. Contrary to TradingView's line of volume profile indicators , it does not show anything on historical bars or closed markets, and it cannot display volume information if none exists for the data feed the chart is using. A realtime indicator such as this one only displays information accumulated while it is running on a chart. The information it calculates cannot be saved on charts, nor can it be recalculated from historical bars. If you refresh the chart, or the script must re-execute for some reason, as when you change inputs, the accumulated information will be lost.
Because "Realtime 5D Profile" requires time to accumulate information on the chart, it will be most useful to traders working on small timeframes who trade only one instrument and do not frequently change their chart's symbol or timeframe. Traders working on higher timeframes or constantly changing charts will be better served by TradingView's volume profiles. Before using this indicator, please see the "Limitations" section further down for other important information.
█ HOW TO USE IT
Load the indicator on an active chart (see here if you don't know how).
The default configuration displays:
• A double-sided volume profile showing at what price levels activity has occurred.
• The left side shows "down" volume, the right side shows "up" volume.
• The value corresponding to each level is displayed.
• The width of lines reflects their relative value.
• The thickness of lines reflects their age. Four thicknesses are used, with the thicker lines being the most recent.
• The total value of down/up values for the profile appears at the top.
To understand how to use profiles in your trading, please research the subject. Searches on "volume profile" or "market profile" will yield many useful results. I provide you with tools — I do not teach trading. To understand more about this indicator, read on. If you choose not to do so, please don't ask me to answer questions that are already answered here, nor to make videos; I don't.
█ CONCEPTS
Delta calculations
Volume is slotted in up or down slots depending on whether the price of each new chart update is higher or lower than the previous update's price. When price does not move between chart updates, the last known direction is used. In a perfect world, Pine scripts would have access to bid and ask levels, as this would allow us to know for sure if market orders are being filled on upticks (at the ask) or downticks (at the bid). Comparing the price of successive chart updates provides the most precise way to calculate volume delta on TradingView, but it is still a compromise. Order books are in constant movement; in some cases, order cancellations can cause sudden movements of both the bid and ask levels such that the next chart update can occur on an uptick at a lower price than the previous one (or vice versa). While this update's volume should be slotted in the up slot because a buy market order was filled, it will erroneously be slotted in the down slot because the price of the chart's update is lower than that of the previous one. Luckily, these conditions are relatively rare, so they should not adversely affect calculations.
Levels
A profile is a tool that displays information organized by price levels. You can select the maximum quantity of levels this indicator displays by using the script's "Levels" input. If the profile's height is small enough for level increments to be less than the symbol's tick size, a smaller quantity of levels is used until the profile's height grows sufficiently to allow your specified quantity of levels to be displayed. The exact position of levels is not tethered to the symbol's tick increments. Activity for one level is that which happens on either side of the level, halfway between its higher or lower levels. The lowest/highest levels in the profile thus appear higher/lower than the profile's low/high limits, which are determined by the lowest/highest points reached by price during the profile's life.
Level Values and Length
The profile's vertical structure is dynamic. As the profile's height changes with the price range, it is rebalanced and the price points of its levels may be recalculated. When this happens, past updates will be redistributed among the new profile's levels, and the level values may thus change. The new levels where updates are slotted will of course always be near past ones, but keep this fluidity in mind when watching level values evolve.
The profile's horizontal structure is also dynamic. The maximum length of level lines is controlled by the "Maximum line length" input value. This maximum length is always used for the largest level value in the profile, and the length of other levels is determined by their value relative to that maximum.
Updates vs Ticks
Strictly speaking, a tick is the record of a transaction between two parties. On TradingView, these are detected on seconds charts. On other charts, ticks are aggregated to form a chart update . I use the broader "update" term when it names both events. Note that, confusingly, tick is also used to name an instrument's minimal price increment.
Volume Quality
If you use volume, it's important to understand its nature and quality, as it varies with sectors and instruments. My Volume X-ray indicator is one way you can appraise the quality of an instrument's intraday volume.
█ FEATURES
Double-Sided Profiles
When you choose one of the first two configuration selections in the "Configuration" field's dropdown menu, you are asking the indicator to display a double-sided profile, i.e., where the down values appear on the left and the up ones on the right. In this mode, the formatting options in the top section of inputs apply to both sides of the profile.
Single-Sided Profiles
The six other selections down the "Configuration" field's dropdown menu select single-sided profiles, where one side aggregates the up/down values for either volume or ticks. In this mode, the formatting options in the top section of inputs apply to the left profile. The ones in the following "Right format" section apply to the right profile.
Calculation Mode
The "Calculation" input field allows the selection of one of two modes which applies to single-sided profiles only. Values can represent the simple total of volume or ticks at each level, or their delta. The mode has no effect when a double-sided profile is used because then, the total is represented by the sum of the left and right sides. Note that when totals are selected, all levels appear in the up color.
Age
The age of each level is always displayed as one of four line thicknesses. Thicker lines are used for the youngest levels. The age of levels is determined by averaging the times of the updates composing that level. When viewing double-sided profiles, the age of each side is calculated independently, which entails you can have a down level on the left side of the profile appear thinner than its corresponding up side level line on the right side because the updates composing the up side are more recent. When calculating the age of single-sided profiles, the age of the up/down values aggregated to calculate the side are averaged. Since they may be different, the averaged level ages will not be as responsive as when using a double-sided profile configuration, where the age of levels on each side is calculated independently and follows price action more closely. Moreover, when displaying two single-sided profiles (volume on one side and ticks on the other), the age of both sides will match because they are calculated from the same realtime updates.
Profile Resets
The profile can reset on timeframes or trend changes. The usual timeframe selections are available, including the chart's, in which case the profile will reset on each new chart bar. One of two trend detection logics can be used: Supertrend or the one used by LazyBear in his Weis Wave indicator . Settings for the trend logics are in the bottommost section of the inputs, where you can also control the display of trend changes and states. Note that the "Timeframe" field's setting also applies to the trend detection mechanism. Whatever the timeframe used for trend detection, its logic will not repaint.
Format
Formatting a profile for charts is often a challenge for traders, and this one is no exception. Varying zoom factors on your chart and the frequency of profile resets will require different profile formats. You can achieve a reasonable variety of effects by playing with the following input fields:
• "Resets on" controls how frequently new profiles are drawn. Spacing out profiles between bars can help make them more usable.
• "Levels" determines the maximum quantity of levels displayed.
• "Offset" allows you to shift the profile horizontally.
• "Profile size" affects the global size of the profile.
• Another "Size" field provides control over the size of the totals displayed above the profile.
• "Maximum line length" controls how far away from the center of the bar the lines will stretch left and right.
Colors
The color and brightness of levels and totals always allows you to determine the winning side between up and down values. On double-sided profiles, each side is always of one color, since the left side is down values and the right side, up values. However, the losing side is colored with half its brightness, so the emphasis is put on the winning side. When there is no winner, the toned-down version of each color is used for both sides. Single-sided profiles use the up and down colors in full brightness on the same side. Which one is used reflects the winning side.
Candles
The indicator can color candle bodies and borders independently. If you choose to do so, you may want to disable the chart's bars by using the eye icon near the symbol's name.
Tooltips
A tooltip showing the value of each level is available. If they do not appear when hovering over levels, select the indicator by clicking on its chart name. This should get the tooltips working.
Data Window
As usual, I provide key values in the Data Window, so you can track them. If you compare total realtime volumes for the profile and the built-in "Volume" indicator, you may see variations at some points. They are due to the different mechanisms running each program. In my experience, the values from the built-in don't always update as often as those of the profile, but they eventually catch up.
█ LIMITATIONS
• The levels do not appear exactly at the position they are calculated. They are positioned slightly lower than their actual price levels.
• Drawing a 20-level double-sided profile with totals requires 42 labels. The script will only display the last 500 labels,
so the number of levels you choose affects how many past profiles will remain visible.
• The script is quite taxing, which will sometimes make the chart's tab less responsive.
• When you first load the indicator on a chart, it will begin calculating from that moment; it will not take into account prior chart activity.
• If you let the script run long enough when using profile reset criteria that make profiles last for a long time, the script will eventually run out of memory,
as it will be tracking unmanageable amounts of chart updates. I don't know the exact quantity of updates that will cause this,
but the script can handle upwards of 60K updates per profile, which should last 1D except on the most active markets. You can follow the number of updates in the Data Window.
• The indicator's nature makes it more useful at very small timeframes, typically in the sub 15min realm.
• The Weis Wave trend detection used here has nothing to do with how David Weis detects trend changes.
LazyBear's version was a port of a port, so we are a few generations removed from the Weis technique, which uses reversals by a price unit.
I believe the version used here is useful nonetheless because it complements Supertrend rather well.
█ NOTES
The aggregated view that volume and tick profiles calculate for traders is a good example of one of the most useful things software can do for traders: look at things from a methodical, mathematical perspective, and present results in a meaningful way. Profiles are powerful because, if the volume data they use is of good enough quality, they tell us what levels are important for traders, regardless of the nature or rationality of the methods traders have used to determine those levels. Profiles don't care whether traders use the news, fundamentals, Fib numbers, pivots, or the phases of the moon to find "their" levels. They don't attempt to forecast or explain markets. They show us real stuff containing zero uncertainty, i.e., what HAS happened. I like this.
The indicator's "VPAA" chart name represents four of the five dimensions the indicator displays: volume, price, activity and age. The time dimension is implied by the fact it's a profile — and I couldn't find a proper place for a "T" in there )
I have not included alerts in the script. I may do so in the future.
For the moment, I have no plans to write a profile indicator that works on historical bars. TradingView's volume profiles already do that, and they run much faster than Pine versions could, so I don't see the point in spending efforts on a poor ersatz.
For Pine Coders
• The script uses labels that draw varying quantities of characters to break the limitation constraining other Pine plots/lines to bar boundaries.
• The code's structure was optimized for performance. When it was feasible, global arrays, "input" and other variables were used from functions,
sacrificing function readability and portability for speed. Code was also repeated in some places, to avoid the overhead of frequent function calls in high-traffic areas.
• I wrote my script using the revised recommendations in the Style Guide from the Pine v5 User Manual.
█ THANKS
• To Duyck for his function that sorts an array while keeping it in synch with another array.
The `sortTwoArrays()` function in my script is derived from the Pine Wizard 's code.
• To the one and only Maestro, RicardoSantos , the creative volcano who worked hard to write a function to produce fixed-width, figure space-padded numeric values.
A change in design made the function unnecessary in this script, but I am grateful to you nonetheless.
• To midtownskr8guy , another Pine Wizard who is also a wizard with colors. I use the colors from his Pine Color Magic and Chart Theme Simulator constantly.
• Finally, thanks to users of my earlier "Delta Volume" scripts. Comments and discussions with them encouraged me to persist in figuring out how to achieve what this indicator does.

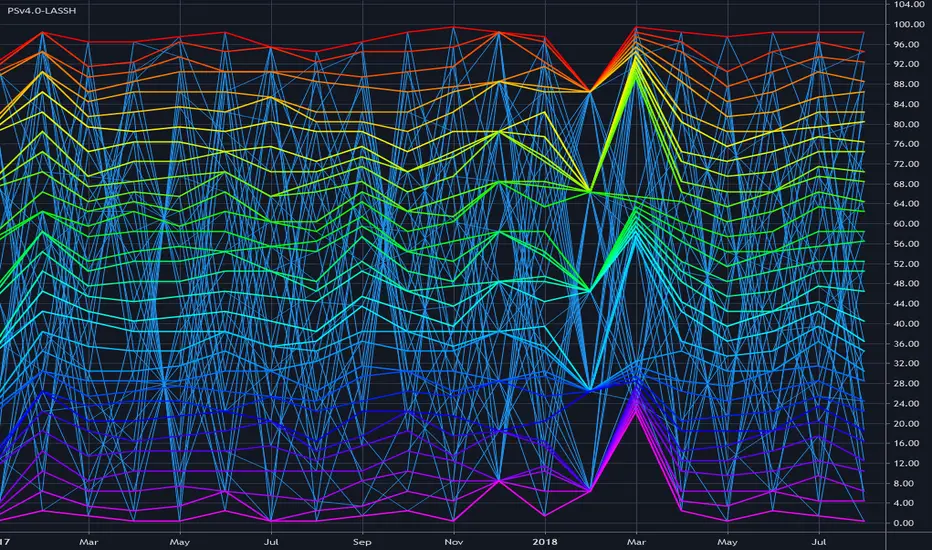
PSv4.0 Limited Array Support Super HackThis is my "PSv4.0 Limited Array Support Super Hack", derived from MichelT's Workaround for Arrays in pine and Bubble sort script, except this utilizes line.new() to obtain one array with up to 100 indices. I provided functions that may be syntactically comparable in operation to the array class we should get with PSv5.0 when that arrives. I have no clue when that ETA shall be either, so your guess is as good as mine. Due to the complexity of the script, I would ONLY recommend this script's functions for reuse by advanced Pine programmers, not newcomers to Pine Script.
Notice: FYI, support for these functions will be limited to only errata with the included functions. Honestly, I don't have an abundance of time on a daily basis to assist members with incorporation into their newly developed scripts. I hope you will understand.
The intention of this script is to provide Pine developers with one large array having up to 100 indices until we have full native array support in the future. Availability of full use of the array is only obtained when bar_index is indicesCount-1, so bear that in mind. This script is so computationally expensive, I would only advise using it "as is" on 5Y and All Charts at it's current initial release. On smaller sampling rates such as 1D, 5D and 1M... it has a tendency to encounter runtime errors such as this message: "Calculation timed out. Remove the indicator and reapply it to the chart". I just switch to a larger sampling interval - 5Y or All. I believe this is occurring due mostly to prng() generating thousands of random floating point numbers, PLUS the overhead of using line.new() for something it wasn't originally intended for. It does also use 64 plots in full color, maxing out the plotting capabilities of Pine as well. With usage of the array functions alone in your code, I anticipate those scripts to be more server friendly.
Basically this scripts functionality, as is, generates 32 pseudorandom numbers per bar in a sky blue birds nest of random numbers. It then sorts them numerically and plots them once again in a visually stunning rainbow spectrum. You will notice the plot()s colors will invert when the sorting order is changed in Settings. I commented out a lot of plot()s because we are limited to a maximum of 64 plot()s. By commenting and uncommenting with highlighted text blocks and + , you may alter the scripts appearance when done properly.
Overall, I hope you find it useful with incorporating expected array functionality that will perpetuate the novel development of next generation indicators in Pine Script version 4.0 . Once again, check out MichelT's brilliantly crafted script mentioned above. You may be able to use both scripts incorporated into an all-in-one to have dual array support, BUT I have not tested this yet, be forewarned. I hope the community contribution of this script in open source is of some benefit to those who can utilize it properly. As always, I have included advanced Pine programming techniques that conform to proper "Pine Etiquette", so this script is more than just a complex array provision...
The comments section below is solely just for commenting and other remarks, ideas, compliments, etc... regarding only this indicator, not others. When available time provides itself, I will consider your inquiries, thoughts, and concepts presented below in the comments section, should you have any questions or comments regarding this indicator. When my indicators achieve more prevalent use by TV members, I may implement more ideas when they present themselves as worthy additions. As always, "Like" it if you simply just like it with a proper thumbs up, and also return to my scripts list occasionally for additional postings. Have a profitable future everyone!
[blackcat] L2 Ehlers Empirical Mode TraderCircumstance Remarks: Because of my carelessness, the script of the same name that I posted before was banned and hidden because the description contained content that violated the TradingView House Rule. After communicating with the MOD, I corrected the description and obtained permission to publish it again. I hereby declare. Sorry for the inconvenience!
Level: 2
Background
John F. Ehlers introuced Empirical Mode Trader Indicator in Mar, 2010.
Function
In his article “Empirical Mode Decomposition,” John Ehlers and Ric Way suggest using methods based on bandpass filtering to distinguish trending from cycling markets. The article’s trading suggestions were used to create the Empirical Mode strategy given here for pine v4 script. If the strategy determines that the marke is in trending mode, then the strategy is allowed to trade with the trend — either long, in uptrends, or short, in downtrends. If the indicator determines that the market is in cycling mode, then the strategy allows trading cycle extremes, using Bollinger bands to trigger entries. You can do this by Choosing either cycle or trend mode at inputs.
Key Signal
Trend ---> Trend signal
FracAvgPeak ---> Upper band signal
FracAvgValley ---> Lower band signal
Pros and Cons
100% John F. Ehlers definition translation, even variable names are the same. This help readers who would like to use pine to read his book.
Remarks
The 75th script for Blackcat1402 John F. Ehlers Week publication.
Readme
In real life, I am a prolific inventor. I have successfully applied for more than 60 international and regional patents in the past 12 years. But in the past two years or so, I have tried to transfer my creativity to the development of trading strategies. Tradingview is the ideal platform for me. I am selecting and contributing some of the hundreds of scripts to publish in Tradingview community. Welcome everyone to interact with me to discuss these interesting pine scripts.
The scripts posted are categorized into 5 levels according to my efforts or manhours put into these works.
Level 1 : interesting script snippets or distinctive improvement from classic indicators or strategy. Level 1 scripts can usually appear in more complex indicators as a function module or element.
Level 2 : composite indicator/strategy. By selecting or combining several independent or dependent functions or sub indicators in proper way, the composite script exhibits a resonance phenomenon which can filter out noise or fake trading signal to enhance trading confidence level.
Level 3 : comprehensive indicator/strategy. They are simple trading systems based on my strategies. They are commonly containing several or all of entry signal, close signal, stop loss, take profit, re-entry, risk management, and position sizing techniques. Even some interesting fundamental and mass psychological aspects are incorporated.
Level 4 : script snippets or functions that do not disclose source code. Interesting element that can reveal market laws and work as raw material for indicators and strategies. If you find Level 1~2 scripts are helpful, Level 4 is a private version that took me far more efforts to develop.
Level 5 : indicator/strategy that do not disclose source code. private version of Level 3 script with my accumulated script processing skills or a large number of custom functions. I had a private function library built in past two years. Level 5 scripts use many of them to achieve private trading strategy.
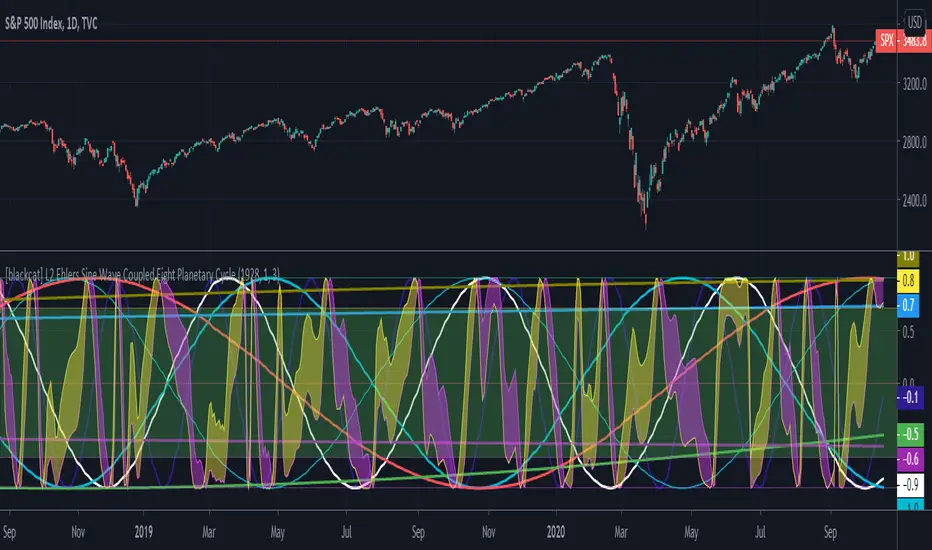
[blackcat] L2 Ehlers Sine Wave Coupled Eight Planetary CycleLevel: 2
Background
Have you considered that factors outside the Earth will be related to macro market trends? Let’s discuss the relationship between the planetary movement in the Galaxy and the market movement on Earth today! Although I said that, you may have laughed out in front of the screen, but the calculations in this script are entirely based on astronomical data and mathematical relationships.
Your next question may be why you compare the movements of the eight planets and the laws of the market on the earth together? My answer comes from a Cybernetic Sine Wave indicator proposed by Dr. John F. Ehlers.
Function
L2 Ehlers Sine Wave Coupled Eight Planetary Cycle first converts the astronomical data of the eight major planets into planetary aspects/phases through mathematical relationships. Planetary aspects/phases can provide the historical and current relative positions of each planet in the mathematical triangle relationship. We can use a simple mathematical sine formula to constrain the planet's trajectory between -1 and 1, which is what we often call a sine wave.
The relationship between the sine wave and the market can be extracted from the theory of John F. Ehlers. In Ehlers' theory, market price can be modeled by the trend and cycle modes. And in his works, there are many indicators of how to completely remove the trend in the market price and only leave the cycle mode data. The Cybernetic Sine Wave indicator is exactly the cycle mode data after the market trend is stripped, and expressed in the form of a sine wave.
If you can read to here with patience, you must also be aware of the premise that the trajectories of the eight planets and the laws of the earth market can be coupled: the trajectory of the sine wave mode. Therefore, this indicator is a tool for comparing and analyzing the two in the same chart. I hope you like it.
Finally, in order to benchmark the trajectories of the eight planets and the specific market on the earth, a starting point in time is particularly important. This is the base date of the market index to be analyzed. It is the year, month, and day data specified by the index, which needs to be input by the user when analyzing a specific stock index. For example, the base date of the S&P 500 index is January 3, 1928. This date needs to be entered into the indicator to analyze the SPX500.
Key Signal
Mercury_trail ---> smoothed Mercury orbit sine wave
Venus_trail ---> smoothed Venus orbit sine wave
Earth_trail ---> smoothed Earth orbit sine wave
Earth_mirror ---> smoothed Earth mirrored orbit sine wave
Mars_trail ---> smoothed Mars orbit sine wave
Jupiter_trail ---> smoothed Jupiter orbit sine wave
Saturn_trail ---> smoothed Saturn orbit sine wave
Uranus_trail ---> smoothed Uranus orbit sine wave
Neptune_trail ---> smoothed Neptune orbit sine wave
Aspect 0, 45, 90, 225, 270 deg ---> key planet aspects
ehlersine ---> Ehlers Cybernetic Sine Wave
ehlerslsine ---> Ehlers Cybernetic Lead Sine Wave
Pros and Cons
This is a technical indicator that I have come up with on a whim, and the laws of planetary operation and the operation of the Earth market are still being explored. Hope that interested friends will share your new discoveries.
Remarks
To celebrate I released the 50th technical indicator script on TV!
Courtesy of @sal157011 John Ehlers "Cybernetic Sine Wave" indicator, I converted it from pine v2 to pine v4 in this script.
Readme
In real life, I am a prolific inventor. I have successfully applied for more than 60 international and regional patents in the past 12 years. But in the past two years or so, I have tried to transfer my creativity to the development of trading strategies. Tradingview is the ideal platform for me. I am selecting and contributing some of the hundreds of scripts to publish in Tradingview community. Welcome everyone to interact with me to discuss these interesting pine scripts.
The scripts posted are categorized into 5 levels according to my efforts or manhours put into these works.
Level 1 : interesting script snippets or distinctive improvement from classic indicators or strategy. Level 1 scripts can usually appear in more complex indicators as a function module or element.
Level 2 : composite indicator/strategy. By selecting or combining several independent or dependent functions or sub indicators in proper way, the composite script exhibits a resonance phenomenon which can filter out noise or fake trading signal to enhance trading confidence level.
Level 3 : comprehensive indicator/strategy. They are simple trading systems based on my strategies. They are commonly containing several or all of entry signal, close signal, stop loss, take profit, re-entry, risk management, and position sizing techniques. Even some interesting fundamental and mass psychological aspects are incorporated.
Level 4 : script snippets or functions that do not disclose source code. Interesting element that can reveal market laws and work as raw material for indicators and strategies. If you find Level 1~2 scripts are helpful, Level 4 is a private version that took me far more efforts to develop.
Level 5 : indicator/strategy that do not disclose source code. private version of Level 3 script with my accumulated script processing skills or a large number of custom functions. I had a private function library built in past two years. Level 5 scripts use many of them to achieve private trading strategy.
L1 Moving Average Fingerprint for Long EntryLevel: 1
Background
This script combines moving average processing with highest high and lowest low to disclose the "fingerprint" of a specific trading pair to describe its unique behavior.
Function
Moving Average Fingerprint for Long Entry is a Level 1 pine script. It utilize several moving average of inherent highest high and lowest low and combine them with customized fingerprint coefficients to depict the unique behavior of a specific trading pair across multiple markets for long entry point identification.
Key Signal
FingerPrint1~6 are basic-level fingerprints with moving average of highest high and lowest low.
FingerPrint7~8 are composite fingerprint definitions with coefficients/weights,where coefficients/weights need to be tuned to discover the inherent "fingerprint" of a specific trading pair.
FingerPrint10~12 are composite fingerprint calculation for long entry alerts
ReadytoLong is a long entry filter where long entry point may happen within it. By using crossover() function to a customized threshold value, you can define accurate long entries.
Pros and Cons
Pros:
1. Combine moving average and extreme points to disclose a trading pair behavior.
2. Smart to tune specific set of parameters to obtain unique fingerprints of trading pairs.
3. Smart position sizing scheme by adjusting the threshold values.
Cons:
1. Require tune input parameters for each trading pair in a specific period and time frame.
2. Only long entry was studied, no short entry and re-entry are available yet to form as a trading system.
3. "ReadytoLong" is an inaccurate range where multiple long entries may happen at improper points in chop market.
4. Complex input parameters to obtain a unique fingerprint set.
Remarks
Although I wrote pine script for more than two years, this is the first script published in the community. I will publish more with my works in this platform.
Hope the community can improve this concept and make it as a trading system.
Readme
In real life, I am a prolific inventor. I have successfully applied for more than 60 international and regional patents in the past 12 years. But in the past two years or so, I have tried to transfer my creativity to the development of trading strategies. Tradingview is the ideal platform for me. I am selecting and contributing some of the hundreds of scripts to publish in Tradingview community. Welcome everyone to interact with me to discuss these interesting pine scripts.
The scripts posted are categorized into 5 levels according to my efforts or manhours put into these works.
Level 1 : interesting script snippets or distinctive improvement from classic indicators or strategy. Level 1 scripts can usually appear in more complex indicators as a function module or element.
Level 2 : composite indicator/strategy. By selecting or combining several independent or dependent functions or sub indicators in proper way, the composite script exhibits a resonance phenomenon which can filter out noise or fake trading signal to enhance trading confidence level.
Level 3 : comprehensive indicator/strategy. They are simple trading systems based on my strategies. They are commonly containing several or all of entry signal, close signal, stop loss, take profit, re-entry, risk management, and position sizing techniques. Even some interesting fundamental and mass psychological aspects are incorporated.
Level 4 : script snippets or functions that do not disclose source code. Interesting element that can reveal market laws and work as raw material for indicators and strategies. If you find Level 1~2 scripts are helpful, Level 4 is a private version that took me far more efforts to develop.
Level 5 : indicator/strategy that do not disclose source code. private version of Level 3 script with my accumulated script processing skills or a large number of custom functions. I had a private function library built in past two years. Level 5 scripts use many of them to achieve private trading strategy.

Day trading volume based levels by VhatkarThis script identifies dynamic support and resistance levels based on volume and price action analysis. It uses a unique algorithm that combines volume force calculations with pivot points to determine key levels where price is likely to react.
Originality and Usefulness :
Innovative Volume Force Calculation : The script calculates upforce and downforce based on volume and price movement, providing a novel insight into buying and selling pressure. Unlike traditional volume indicators, this approach offers a more nuanced understanding of market dynamics.
Dynamic Pivot Points : Pivot points are dynamically adjusted based on volume force and highest high calculations, unlike conventional static pivot points. This makes the levels more responsive to real-time market conditions, offering traders a competitive edge.
Adaptive Target Levels : The script sets target and stop prices for both long and short positions, with adjustable percentages based on the chosen timeframe. This feature is particularly useful for day traders looking for precise entry and exit points.
Unique Timeframe Adjustments : The script includes specific adjustments for different timeframes (e.g., 15m, 30m, 60m), optimizing the support and resistance levels for day trading strategies. This adaptability is not commonly found in existing open-source scripts.
Volume-Weighted Adjustments : The integration of VWAP (Volume-Weighted Average Price) into the volume force calculation adds an extra layer of accuracy, helping traders make more informed decisions.
Comprehensive Visual Representation : The script offers clear visual plots of entry, target, and stop levels, along with color-coded fill areas that indicate different target zones. This visual clarity enhances user experience and decision-making.
Unique Features Compared to Open-Source Scripts :
Advanced Volume Force Algorithm : While many open-source scripts rely solely on price action or basic volume indicators, this script integrates a sophisticated volume force algorithm. This unique approach allows traders to identify more accurate support and resistance levels based on real market activity.
Dynamic and Adaptive Pivot Points : Unlike traditional open-source scripts that use static pivot points, this script dynamically adjusts pivot points based on the highest high and volume force. This dynamic adjustment provides a more precise and adaptable analysis suitable for various market conditions.
Integrated VWAP Calculation : Incorporating VWAP into volume force calculations adds an extra dimension of accuracy, allowing for more reliable trading signals. This feature differentiates the script from simpler open-source alternatives that may not include such advanced calculations.
How to Use :
Apply the Script : Add the "Vhatkar Dynamic S/R Levels" script to your chart. Make sure your chart has volume data as the script relies on volume calculations.
Select Timeframe : The script is designed for day trading timeframes such as 5m, 15m, and 30m. Ensure you are using one of these timeframes for optimal performance.
Adjust Parameters :
Target Lines : Set the number of target lines using the SLRange input. Increase the count if fewer lines are visible or decrease if too many lines are cluttering the chart.
Interpreting Signals :
Long Entries : When the close price is above the pivot point, the script plots potential long entry points and target levels (TP1, TP2, TP3) as well as a stop-loss level.
Short Entries : When the close price is below the pivot point, the script plots potential short entry points and target levels (TP1, TP2, TP3) as well as a stop-loss level.
Visual Aids : Use the color-coded fill areas to quickly identify target zones and stop levels.
Trade Management : Utilize the plotted entry, target, and stop levels to manage your trades. Adjust your trading strategy based on the levels provided by the script.
Usage :
Designed for day trading on timeframes such as 5m, 15m, and 30m.
Provides clear visual plots of entry, target, and stop levels.
Offers flexibility with adjustable parameters to suit different trading styles.

Using `varip` variables [PineCoders]█ OVERVIEW
The new varip keyword in Pine can be used to declare variables that escape the rollback process, which is explained in the Pine User Manual's page on the execution model . This publication explains how Pine coders can use variables declared with varip to implement logic that was impossible to code in Pine before, such as timing events during the realtime bar, or keeping track of sequences of events that occur during successive realtime updates. We present code that allows you to calculate for how much time a given condition is true during a realtime bar, and show how this can be used to generate alerts.
█ WARNINGS
1. varip is an advanced feature which should only be used by coders already familiar with Pine's execution model and bar states .
2. Because varip only affects the behavior of your code in the realtime bar, it follows that backtest results on strategies built using logic based on varip will be meaningless,
as varip behavior cannot be simulated on historical bars. This also entails that plots on historical bars will not be able to reproduce the script's behavior in realtime.
3. Authors publishing scripts that behave differently in realtime and on historical bars should imperatively explain this to traders.
█ CONCEPTS
Escaping the rollback process
Whereas scripts only execute once at the close of historical bars, when a script is running in realtime, it executes every time the chart's feed detects a price or volume update. At every realtime update, Pine's runtime normally resets the values of a script's variables to their last committed value, i.e., the value they held when the previous bar closed. This is generally handy, as each realtime script execution starts from a known state, which simplifies script logic.
Sometimes, however, script logic requires code to be able to save states between different executions in the realtime bar. Declaring variables with varip now makes that possible. The "ip" in varip stands for "intrabar persist".
Let's look at the following code, which does not use varip :
//@version=4
study("")
int updateNo = na
if barstate.isnew
updateNo := 1
else
updateNo := updateNo + 1
plot(updateNo, style = plot.style_circles)
On historical bars, barstate.isnew is always true, so the plot shows a value of "1". On realtime bars, barstate.isnew is only true when the script first executes on the bar's opening. The plot will then briefly display "1" until subsequent executions occur. On the next executions during the realtime bar, the second branch of the if statement is executed because barstate.isnew is no longer true. Since `updateNo` is initialized to `na` at each execution, the `updateNo + 1` expression yields `na`, so nothing is plotted on further realtime executions of the script.
If we now use varip to declare the `updateNo` variable, the script behaves very differently:
//@version=4
study("")
varip int updateNo = na
if barstate.isnew
updateNo := 1
else
updateNo := updateNo + 1
plot(updateNo, style = plot.style_circles)
The difference now is that `updateNo` tracks the number of realtime updates that occur on each realtime bar. This can happen because the varip declaration allows the value of `updateNo` to be preserved between realtime updates; it is no longer rolled back at each realtime execution of the script. The test on barstate.isnew allows us to reset the update count when a new realtime bar comes in.
█ OUR SCRIPT
Let's move on to our script. It has three parts:
— Part 1 demonstrates how to generate alerts on timed conditions.
— Part 2 calculates the average of realtime update prices using a varip array.
— Part 3 presents a function to calculate the up/down/neutral volume by looking at price and volume variations between realtime bar updates.
Something we could not do in Pine before varip was to time the duration for which a condition is continuously true in the realtime bar. This was not possible because we could not save the beginning time of the first occurrence of the true condition.
One use case for this is a strategy where the system modeler wants to exit before the end of the realtime bar, but only if the exit condition occurs for a specific amount of time. One can thus design a strategy running on a 1H timeframe but able to exit if the exit condition persists for 15 minutes, for example. REMINDER: Using such logic in strategies will make backtesting their complete logic impossible, and backtest results useless, as historical behavior will not match the strategy's behavior in realtime, just as using `calc_on_every_tick = true` will do. Using `calc_on_every_tick = true` is necessary, by the way, when using varip in a strategy, as you want the strategy to run like a study in realtime, i.e., executing on each price or volume update.
Our script presents an `f_secondsSince(_cond, _resetCond)` function to calculate the time for which a condition is continuously true during, or even across multiple realtime bars. It only works in realtime. The abundant comments in the script hopefully provide enough information to understand the details of what it's doing. If you have questions, feel free to ask in the Comments section.
Features
The script's inputs allow you to:
• Specify the number of seconds the tested conditions must last before an alert is triggered (the default is 20 seconds).
• Determine if you want the duration to reset on new realtime bars.
• Require the direction of alerts (up or down) to alternate, which minimizes the number of alerts the script generates.
The inputs showcase the new `tooltip` parameter, which allows additional information to be displayed for each input by hovering over the "i" icon next to it.
The script only displays useful information on realtime bars. This information includes:
• The MA against which the current price is compared to determine the bull or bear conditions.
• A dash which prints on the chart when the bull or bear condition is true.
• An up or down triangle that prints when an alert is generated. The triangle will only appear on the update where the alert is triggered,
and unless that happens to be on the last execution of the realtime bar, it will not persist on the chart.
• The log of all triggered alerts to the right of the realtime bar.
• A gray square on top of the elapsed realtime bars where one or more alerts were generated. The square's tooltip displays the alert log for that bar.
• A yellow dot corresponding to the average price of all realtime bar updates, which is calculated using a varip array in "Part 2" of the script.
• Various key values in the Data Window for each parts of the script.
Note that the directional volume information calculated in Part 3 of the script is not plotted on the chart—only in the Data Window.
Using the script
You can try running the script on an open market with a 30sec timeframe. Because the default settings reset the duration on new realtime bars and require a 20 second delay, a reasonable amount of alerts will trigger.
Creating an alert on the script
You can create a script alert on the script. Keep in mind that when you create an alert from this script, the duration calculated by the instance of the script running the alert will not necessarily match that of the instance running on your chart, as both started their calculations at different times. Note that we use alert.freq_all in our alert() calls, so that alerts will trigger on all instances where the associated condition is met. If your alert is being paused because it reaches the maximum of 15 triggers in 3 minutes, you can configure the script's inputs so that up/down alerts must alternate. Also keep in mind that alerts run a distinct instance of your script on different servers, so discrepancies between the behavior of scripts running on charts and alerts can occur, especially if they trigger very often.
Challenges
Events detected in realtime using variables declared with varip can be transient and not leave visible traces at the close of the realtime bar, as is the case with our script, which can trigger multiple alerts during the same realtime bar, when the script's inputs allow for this. In such cases, elapsed realtime bars will be of no use in detecting past realtime bar events unless dedicated code is used to save traces of events, as we do with our alert log in this script, which we display as a tooltip on elapsed realtime bars.
█ NOTES
Realtime updates
We have no control over when realtime updates occur. A realtime bar can open, and then no realtime updates can occur until the open of the next realtime bar. The time between updates can vary considerably.
Past values
There is no mechanism to refer to past values of a varip variable across realtime executions in the same bar. Using the history-referencing operator will, as usual, return the variable's committed value on previous bars. If you want to preserve past values of a varip variable, they must be saved in other variables or in an array .
Resetting variables
Because varip variables not only preserve their values across realtime updates, but also across bars, you will typically need to plan conditions that will at some point reset their values to a known state. Testing on barstate.isnew , as we do, is a good way to achieve that.
Repainting
The fact that a script uses varip does not make it necessarily repainting. A script could conceivably use varip to calculate values saved when the realtime bar closes, and then use confirmed values of those calculations from the previous bar to trigger alerts or display plots, avoiding repaint.
timenow resolution
Although the variable is expressed in milliseconds it has an actual resolution of seconds, so it only increments in multiples of 1000 milliseconds.
Warn script users
When using varip to implement logic that cannot be replicated on historical bars, it's really important to explain this to traders in published script descriptions, even if you publish open-source. Remember that most TradingViewers do not know Pine.
New Pine features used in this script
This script uses three new Pine features:
• varip
• The `tooltip` parameter in input() .
• The new += assignment operator. See these also: -= , *= , /= and %= .
Example scripts
These are other scripts by PineCoders that use varip :
• Tick Delta Volume , by RicadoSantos .
• Tick Chart and Volume Info from Lower Time Frames by LonesomeTheBlue .
Thanks
Thanks to the PineCoders who helped improve this publication—especially to bmistiaen .
Look first. Then leap.

[blackcat] L2 Price Envelope TrackerLevel: 2
Background
Price envelopes sare shown at a set percentage above and below a moving average. They are used to indicate overbought and oversold levels and can be traded individually or in conjunction with a momentum indicator.
Function
L2 Price Envelope Tracker is an innovative indicator that use customized envelope of price to disclose overbought and oversold periods. With this function, long and short entries can be further developped in this pine script.
Key Signal
sma5 --> typical price moving average line
resistance --> upper envelope as resistance line
support ---> lower envelope as support line
Pros and Cons
Pros:
1. easy observe overbought and oversold zone
2. disclose exact long and short entries in overbought and oversold zones
Cons:
1. Only applicable for the trading pairs that support financial() functions. crypto/xau/xag/indice are not applicable
2. Need to tune r1 and s1 for different trading pairs
Remarks
NA
Readme
In real life, I am a prolific inventor. I have successfully applied for more than 60 international and regional patents in the past 12 years. But in the past two years or so, I have tried to transfer my creativity to the development of trading strategies. Tradingview is the ideal platform for me. I am selecting and contributing some of the hundreds of scripts to publish in Tradingview community. Welcome everyone to interact with me to discuss these interesting pine scripts.
The scripts posted are categorized into 5 levels according to my efforts or manhours put into these works.
Level 1 : interesting script snippets or distinctive improvement from classic indicators or strategy. Level 1 scripts can usually appear in more complex indicators as a function module or element.
Level 2 : composite indicator/strategy. By selecting or combining several independent or dependent functions or sub indicators in proper way, the composite script exhibits a resonance phenomenon which can filter out noise or fake trading signal to enhance trading confidence level.
Level 3 : comprehensive indicator/strategy. They are simple trading systems based on my strategies. They are commonly containing several or all of entry signal, close signal, stop loss, take profit, re-entry, risk management, and position sizing techniques. Even some interesting fundamental and mass psychological aspects are incorporated.
Level 4 : script snippets or functions that do not disclose source code. Interesting element that can reveal market laws and work as raw material for indicators and strategies. If you find Level 1~2 scripts are helpful, Level 4 is a private version that took me far more efforts to develop.
Level 5 : indicator/strategy that do not disclose source code. private version of Level 3 script with my accumulated script processing skills or a large number of custom functions. I had a private function library built in past two years. Level 5 scripts use many of them to achieve private trading strategy.

Auto Harmonic Pattern - Extreme [Trendoscope]Publishing free to use scripts always brought me more value - be it in terms of more followers, or helped me to engage with people having right ideas. This has helped me immensely over past few years of my presence in tradingview. To all the coders out there who is starting to work on pinescript - my suggestion is to publish as many open source/free to use scripts as possible. It will always be rewarding experience and help you grow in a way you can never imagine.
Today, I realised that I have accumulated 10,000+ followers in tradingview just by learning and publishing what I learn. As token of gratitude to all our followers and supporters, we would like to gift this indicator. This is also tribute to all the people who have positively influenced our presence in tradingview and encouraged us to reach this level. Unfortunately cannot publish it as open source due to having proprietary code in it and fear of being misused.
I will not talk about the subject harmonic patterns as it is very generic and information is available online in many places. You can also refer to my open source libraries and scripts related to harmonic patterns. Some of them are here:
Libraries
eHarmonicpatternsExtended
eHarmonicpatterns
harmonicpatterns
Indicators
Harmonic-Patterns-Custom-Candles
Manual-Harmonic-Patterns-With-interactive-inputs
Manual-Harmonic-Projections-With-interactive-inputs
Auto-Harmonic-Patterns-V2
There are few more among open source and free scripts. But, will not mention them here as they are deprecated.
Now coming to the present indicator.
Setting are made simpler to enhance usability. This can also help new traders learning harmonic patterns. Snapshot of the settings can be found here:
Components of the script are as below
Please note, I may not be able to make any further update to this script. But, I promise never to degrade or reduce the quality of any free to use or open source script I ever published.

Markov Chain [3D] | FractalystWhat exactly is a Markov Chain?
This indicator uses a Markov Chain model to analyze, quantify, and visualize the transitions between market regimes (Bull, Bear, Neutral) on your chart. It dynamically detects these regimes in real-time, calculates transition probabilities, and displays them as animated 3D spheres and arrows, giving traders intuitive insight into current and future market conditions.
How does a Markov Chain work, and how should I read this spheres-and-arrows diagram?
Think of three weather modes: Sunny, Rainy, Cloudy.
Each sphere is one mode. The loop on a sphere means “stay the same next step” (e.g., Sunny again tomorrow).
The arrows leaving a sphere show where things usually go next if they change (e.g., Sunny moving to Cloudy).
Some paths matter more than others. A more prominent loop means the current mode tends to persist. A more prominent outgoing arrow means a change to that destination is the usual next step.
Direction isn’t symmetric: moving Sunny→Cloudy can behave differently than Cloudy→Sunny.
Now relabel the spheres to markets: Bull, Bear, Neutral.
Spheres: market regimes (uptrend, downtrend, range).
Self‑loop: tendency for the current regime to continue on the next bar.
Arrows: the most common next regime if a switch happens.
How to read: Start at the sphere that matches current bar state. If the loop stands out, expect continuation. If one outgoing path stands out, that switch is the typical next step. Opposite directions can differ (Bear→Neutral doesn’t have to match Neutral→Bear).
What states and transitions are shown?
The three market states visualized are:
Bullish (Bull): Upward or strong-market regime.
Bearish (Bear): Downward or weak-market regime.
Neutral: Sideways or range-bound regime.
Bidirectional animated arrows and probability labels show how likely the market is to move from one regime to another (e.g., Bull → Bear or Neutral → Bull).
How does the regime detection system work?
You can use either built-in price returns (based on adaptive Z-score normalization) or supply three custom indicators (such as volume, oscillators, etc.).
Values are statistically normalized (Z-scored) over a configurable lookback period.
The normalized outputs are classified into Bull, Bear, or Neutral zones.
If using three indicators, their regime signals are averaged and smoothed for robustness.
How are transition probabilities calculated?
On every confirmed bar, the algorithm tracks the sequence of detected market states, then builds a rolling window of transitions.
The code maintains a transition count matrix for all regime pairs (e.g., Bull → Bear).
Transition probabilities are extracted for each possible state change using Laplace smoothing for numerical stability, and frequently updated in real-time.
What is unique about the visualization?
3D animated spheres represent each regime and change visually when active.
Animated, bidirectional arrows reveal transition probabilities and allow you to see both dominant and less likely regime flows.
Particles (moving dots) animate along the arrows, enhancing the perception of regime flow direction and speed.
All elements dynamically update with each new price bar, providing a live market map in an intuitive, engaging format.
Can I use custom indicators for regime classification?
Yes! Enable the "Custom Indicators" switch and select any three chart series as inputs. These will be normalized and combined (each with equal weight), broadening the regime classification beyond just price-based movement.
What does the “Lookback Period” control?
Lookback Period (default: 100) sets how much historical data builds the probability matrix. Shorter periods adapt faster to regime changes but may be noisier. Longer periods are more stable but slower to adapt.
How is this different from a Hidden Markov Model (HMM)?
It sets the window for both regime detection and probability calculations. Lower values make the system more reactive, but potentially noisier. Higher values smooth estimates and make the system more robust.
How is this Markov Chain different from a Hidden Markov Model (HMM)?
Markov Chain (as here): All market regimes (Bull, Bear, Neutral) are directly observable on the chart. The transition matrix is built from actual detected regimes, keeping the model simple and interpretable.
Hidden Markov Model: The actual regimes are unobservable ("hidden") and must be inferred from market output or indicator "emissions" using statistical learning algorithms. HMMs are more complex, can capture more subtle structure, but are harder to visualize and require additional machine learning steps for training.
A standard Markov Chain models transitions between observable states using a simple transition matrix, while a Hidden Markov Model assumes the true states are hidden (latent) and must be inferred from observable “emissions” like price or volume data. In practical terms, a Markov Chain is transparent and easier to implement and interpret; an HMM is more expressive but requires statistical inference to estimate hidden states from data.
Markov Chain: states are observable; you directly count or estimate transition probabilities between visible states. This makes it simpler, faster, and easier to validate and tune.
HMM: states are hidden; you only observe emissions generated by those latent states. Learning involves machine learning/statistical algorithms (commonly Baum–Welch/EM for training and Viterbi for decoding) to infer both the transition dynamics and the most likely hidden state sequence from data.
How does the indicator avoid “repainting” or look-ahead bias?
All regime changes and matrix updates happen only on confirmed (closed) bars, so no future data is leaked, ensuring reliable real-time operation.
Are there practical tuning tips?
Tune the Lookback Period for your asset/timeframe: shorter for fast markets, longer for stability.
Use custom indicators if your asset has unique regime drivers.
Watch for rapid changes in transition probabilities as early warning of a possible regime shift.
Who is this indicator for?
Quants and quantitative researchers exploring probabilistic market modeling, especially those interested in regime-switching dynamics and Markov models.
Programmers and system developers who need a probabilistic regime filter for systematic and algorithmic backtesting:
The Markov Chain indicator is ideally suited for programmatic integration via its bias output (1 = Bull, 0 = Neutral, -1 = Bear).
Although the visualization is engaging, the core output is designed for automated, rules-based workflows—not for discretionary/manual trading decisions.
Developers can connect the indicator’s output directly to their Pine Script logic (using input.source()), allowing rapid and robust backtesting of regime-based strategies.
It acts as a plug-and-play regime filter: simply plug the bias output into your entry/exit logic, and you have a scientifically robust, probabilistically-derived signal for filtering, timing, position sizing, or risk regimes.
The MC's output is intentionally "trinary" (1/0/-1), focusing on clear regime states for unambiguous decision-making in code. If you require nuanced, multi-probability or soft-label state vectors, consider expanding the indicator or stacking it with a probability-weighted logic layer in your scripting.
Because it avoids subjectivity, this approach is optimal for systematic quants, algo developers building backtested, repeatable strategies based on probabilistic regime analysis.
What's the mathematical foundation behind this?
The mathematical foundation behind this Markov Chain indicator—and probabilistic regime detection in finance—draws from two principal models: the (standard) Markov Chain and the Hidden Markov Model (HMM).
How to use this indicator programmatically?
The Markov Chain indicator automatically exports a bias value (+1 for Bullish, -1 for Bearish, 0 for Neutral) as a plot visible in the Data Window. This allows you to integrate its regime signal into your own scripts and strategies for backtesting, automation, or live trading.
Step-by-Step Integration with Pine Script (input.source)
Add the Markov Chain indicator to your chart.
This must be done first, since your custom script will "pull" the bias signal from the indicator's plot.
In your strategy, create an input using input.source()
Example:
//@version=5
strategy("MC Bias Strategy Example")
mcBias = input.source(close, "MC Bias Source")
After saving, go to your script’s settings. For the “MC Bias Source” input, select the plot/output of the Markov Chain indicator (typically its bias plot).
Use the bias in your trading logic
Example (long only on Bull, flat otherwise):
if mcBias == 1
strategy.entry("Long", strategy.long)
else
strategy.close("Long")
For more advanced workflows, combine mcBias with additional filters or trailing stops.
How does this work behind-the-scenes?
TradingView’s input.source() lets you use any plot from another indicator as a real-time, “live” data feed in your own script (source).
The selected bias signal is available to your Pine code as a variable, enabling logical decisions based on regime (trend-following, mean-reversion, etc.).
This enables powerful strategy modularity : decouple regime detection from entry/exit logic, allowing fast experimentation without rewriting core signal code.
Integrating 45+ Indicators with Your Markov Chain — How & Why
The Enhanced Custom Indicators Export script exports a massive suite of over 45 technical indicators—ranging from classic momentum (RSI, MACD, Stochastic, etc.) to trend, volume, volatility, and oscillator tools—all pre-calculated, centered/scaled, and available as plots.
// Enhanced Custom Indicators Export - 45 Technical Indicators
// Comprehensive technical analysis suite for advanced market regime detection
//@version=6
indicator('Enhanced Custom Indicators Export | Fractalyst', shorttitle='Enhanced CI Export', overlay=false, scale=scale.right, max_labels_count=500, max_lines_count=500)
// |----- Input Parameters -----| //
momentum_group = "Momentum Indicators"
trend_group = "Trend Indicators"
volume_group = "Volume Indicators"
volatility_group = "Volatility Indicators"
oscillator_group = "Oscillator Indicators"
display_group = "Display Settings"
// Common lengths
length_14 = input.int(14, "Standard Length (14)", minval=1, maxval=100, group=momentum_group)
length_20 = input.int(20, "Medium Length (20)", minval=1, maxval=200, group=trend_group)
length_50 = input.int(50, "Long Length (50)", minval=1, maxval=200, group=trend_group)
// Display options
show_table = input.bool(true, "Show Values Table", group=display_group)
table_size = input.string("Small", "Table Size", options= , group=display_group)
// |----- MOMENTUM INDICATORS (15 indicators) -----| //
// 1. RSI (Relative Strength Index)
rsi_14 = ta.rsi(close, length_14)
rsi_centered = rsi_14 - 50
// 2. Stochastic Oscillator
stoch_k = ta.stoch(close, high, low, length_14)
stoch_d = ta.sma(stoch_k, 3)
stoch_centered = stoch_k - 50
// 3. Williams %R
williams_r = ta.stoch(close, high, low, length_14) - 100
// 4. MACD (Moving Average Convergence Divergence)
= ta.macd(close, 12, 26, 9)
// 5. Momentum (Rate of Change)
momentum = ta.mom(close, length_14)
momentum_pct = (momentum / close ) * 100
// 6. Rate of Change (ROC)
roc = ta.roc(close, length_14)
// 7. Commodity Channel Index (CCI)
cci = ta.cci(close, length_20)
// 8. Money Flow Index (MFI)
mfi = ta.mfi(close, length_14)
mfi_centered = mfi - 50
// 9. Awesome Oscillator (AO)
ao = ta.sma(hl2, 5) - ta.sma(hl2, 34)
// 10. Accelerator Oscillator (AC)
ac = ao - ta.sma(ao, 5)
// 11. Chande Momentum Oscillator (CMO)
cmo = ta.cmo(close, length_14)
// 12. Detrended Price Oscillator (DPO)
dpo = close - ta.sma(close, length_20)
// 13. Price Oscillator (PPO)
ppo = ta.sma(close, 12) - ta.sma(close, 26)
ppo_pct = (ppo / ta.sma(close, 26)) * 100
// 14. TRIX
trix_ema1 = ta.ema(close, length_14)
trix_ema2 = ta.ema(trix_ema1, length_14)
trix_ema3 = ta.ema(trix_ema2, length_14)
trix = ta.roc(trix_ema3, 1) * 10000
// 15. Klinger Oscillator
klinger = ta.ema(volume * (high + low + close) / 3, 34) - ta.ema(volume * (high + low + close) / 3, 55)
// 16. Fisher Transform
fisher_hl2 = 0.5 * (hl2 - ta.lowest(hl2, 10)) / (ta.highest(hl2, 10) - ta.lowest(hl2, 10)) - 0.25
fisher = 0.5 * math.log((1 + fisher_hl2) / (1 - fisher_hl2))
// 17. Stochastic RSI
stoch_rsi = ta.stoch(rsi_14, rsi_14, rsi_14, length_14)
stoch_rsi_centered = stoch_rsi - 50
// 18. Relative Vigor Index (RVI)
rvi_num = ta.swma(close - open)
rvi_den = ta.swma(high - low)
rvi = rvi_den != 0 ? rvi_num / rvi_den : 0
// 19. Balance of Power (BOP)
bop = (close - open) / (high - low)
// |----- TREND INDICATORS (10 indicators) -----| //
// 20. Simple Moving Average Momentum
sma_20 = ta.sma(close, length_20)
sma_momentum = ((close - sma_20) / sma_20) * 100
// 21. Exponential Moving Average Momentum
ema_20 = ta.ema(close, length_20)
ema_momentum = ((close - ema_20) / ema_20) * 100
// 22. Parabolic SAR
sar = ta.sar(0.02, 0.02, 0.2)
sar_trend = close > sar ? 1 : -1
// 23. Linear Regression Slope
lr_slope = ta.linreg(close, length_20, 0) - ta.linreg(close, length_20, 1)
// 24. Moving Average Convergence (MAC)
mac = ta.sma(close, 10) - ta.sma(close, 30)
// 25. Trend Intensity Index (TII)
tii_sum = 0.0
for i = 1 to length_20
tii_sum += close > close ? 1 : 0
tii = (tii_sum / length_20) * 100
// 26. Ichimoku Cloud Components
ichimoku_tenkan = (ta.highest(high, 9) + ta.lowest(low, 9)) / 2
ichimoku_kijun = (ta.highest(high, 26) + ta.lowest(low, 26)) / 2
ichimoku_signal = ichimoku_tenkan > ichimoku_kijun ? 1 : -1
// 27. MESA Adaptive Moving Average (MAMA)
mama_alpha = 2.0 / (length_20 + 1)
mama = ta.ema(close, length_20)
mama_momentum = ((close - mama) / mama) * 100
// 28. Zero Lag Exponential Moving Average (ZLEMA)
zlema_lag = math.round((length_20 - 1) / 2)
zlema_data = close + (close - close )
zlema = ta.ema(zlema_data, length_20)
zlema_momentum = ((close - zlema) / zlema) * 100
// |----- VOLUME INDICATORS (6 indicators) -----| //
// 29. On-Balance Volume (OBV)
obv = ta.obv
// 30. Volume Rate of Change (VROC)
vroc = ta.roc(volume, length_14)
// 31. Price Volume Trend (PVT)
pvt = ta.pvt
// 32. Negative Volume Index (NVI)
nvi = 0.0
nvi := volume < volume ? nvi + ((close - close ) / close ) * nvi : nvi
// 33. Positive Volume Index (PVI)
pvi = 0.0
pvi := volume > volume ? pvi + ((close - close ) / close ) * pvi : pvi
// 34. Volume Oscillator
vol_osc = ta.sma(volume, 5) - ta.sma(volume, 10)
// 35. Ease of Movement (EOM)
eom_distance = high - low
eom_box_height = volume / 1000000
eom = eom_box_height != 0 ? eom_distance / eom_box_height : 0
eom_sma = ta.sma(eom, length_14)
// 36. Force Index
force_index = volume * (close - close )
force_index_sma = ta.sma(force_index, length_14)
// |----- VOLATILITY INDICATORS (10 indicators) -----| //
// 37. Average True Range (ATR)
atr = ta.atr(length_14)
atr_pct = (atr / close) * 100
// 38. Bollinger Bands Position
bb_basis = ta.sma(close, length_20)
bb_dev = 2.0 * ta.stdev(close, length_20)
bb_upper = bb_basis + bb_dev
bb_lower = bb_basis - bb_dev
bb_position = bb_dev != 0 ? (close - bb_basis) / bb_dev : 0
bb_width = bb_dev != 0 ? (bb_upper - bb_lower) / bb_basis * 100 : 0
// 39. Keltner Channels Position
kc_basis = ta.ema(close, length_20)
kc_range = ta.ema(ta.tr, length_20)
kc_upper = kc_basis + (2.0 * kc_range)
kc_lower = kc_basis - (2.0 * kc_range)
kc_position = kc_range != 0 ? (close - kc_basis) / kc_range : 0
// 40. Donchian Channels Position
dc_upper = ta.highest(high, length_20)
dc_lower = ta.lowest(low, length_20)
dc_basis = (dc_upper + dc_lower) / 2
dc_position = (dc_upper - dc_lower) != 0 ? (close - dc_basis) / (dc_upper - dc_lower) : 0
// 41. Standard Deviation
std_dev = ta.stdev(close, length_20)
std_dev_pct = (std_dev / close) * 100
// 42. Relative Volatility Index (RVI)
rvi_up = ta.stdev(close > close ? close : 0, length_14)
rvi_down = ta.stdev(close < close ? close : 0, length_14)
rvi_total = rvi_up + rvi_down
rvi_volatility = rvi_total != 0 ? (rvi_up / rvi_total) * 100 : 50
// 43. Historical Volatility
hv_returns = math.log(close / close )
hv = ta.stdev(hv_returns, length_20) * math.sqrt(252) * 100
// 44. Garman-Klass Volatility
gk_vol = math.log(high/low) * math.log(high/low) - (2*math.log(2)-1) * math.log(close/open) * math.log(close/open)
gk_volatility = math.sqrt(ta.sma(gk_vol, length_20)) * 100
// 45. Parkinson Volatility
park_vol = math.log(high/low) * math.log(high/low)
parkinson = math.sqrt(ta.sma(park_vol, length_20) / (4 * math.log(2))) * 100
// 46. Rogers-Satchell Volatility
rs_vol = math.log(high/close) * math.log(high/open) + math.log(low/close) * math.log(low/open)
rogers_satchell = math.sqrt(ta.sma(rs_vol, length_20)) * 100
// |----- OSCILLATOR INDICATORS (5 indicators) -----| //
// 47. Elder Ray Index
elder_bull = high - ta.ema(close, 13)
elder_bear = low - ta.ema(close, 13)
elder_power = elder_bull + elder_bear
// 48. Schaff Trend Cycle (STC)
stc_macd = ta.ema(close, 23) - ta.ema(close, 50)
stc_k = ta.stoch(stc_macd, stc_macd, stc_macd, 10)
stc_d = ta.ema(stc_k, 3)
stc = ta.stoch(stc_d, stc_d, stc_d, 10)
// 49. Coppock Curve
coppock_roc1 = ta.roc(close, 14)
coppock_roc2 = ta.roc(close, 11)
coppock = ta.wma(coppock_roc1 + coppock_roc2, 10)
// 50. Know Sure Thing (KST)
kst_roc1 = ta.roc(close, 10)
kst_roc2 = ta.roc(close, 15)
kst_roc3 = ta.roc(close, 20)
kst_roc4 = ta.roc(close, 30)
kst = ta.sma(kst_roc1, 10) + 2*ta.sma(kst_roc2, 10) + 3*ta.sma(kst_roc3, 10) + 4*ta.sma(kst_roc4, 15)
// 51. Percentage Price Oscillator (PPO)
ppo_line = ((ta.ema(close, 12) - ta.ema(close, 26)) / ta.ema(close, 26)) * 100
ppo_signal = ta.ema(ppo_line, 9)
ppo_histogram = ppo_line - ppo_signal
// |----- PLOT MAIN INDICATORS -----| //
// Plot key momentum indicators
plot(rsi_centered, title="01_RSI_Centered", color=color.purple, linewidth=1)
plot(stoch_centered, title="02_Stoch_Centered", color=color.blue, linewidth=1)
plot(williams_r, title="03_Williams_R", color=color.red, linewidth=1)
plot(macd_histogram, title="04_MACD_Histogram", color=color.orange, linewidth=1)
plot(cci, title="05_CCI", color=color.green, linewidth=1)
// Plot trend indicators
plot(sma_momentum, title="06_SMA_Momentum", color=color.navy, linewidth=1)
plot(ema_momentum, title="07_EMA_Momentum", color=color.maroon, linewidth=1)
plot(sar_trend, title="08_SAR_Trend", color=color.teal, linewidth=1)
plot(lr_slope, title="09_LR_Slope", color=color.lime, linewidth=1)
plot(mac, title="10_MAC", color=color.fuchsia, linewidth=1)
// Plot volatility indicators
plot(atr_pct, title="11_ATR_Pct", color=color.yellow, linewidth=1)
plot(bb_position, title="12_BB_Position", color=color.aqua, linewidth=1)
plot(kc_position, title="13_KC_Position", color=color.olive, linewidth=1)
plot(std_dev_pct, title="14_StdDev_Pct", color=color.silver, linewidth=1)
plot(bb_width, title="15_BB_Width", color=color.gray, linewidth=1)
// Plot volume indicators
plot(vroc, title="16_VROC", color=color.blue, linewidth=1)
plot(eom_sma, title="17_EOM", color=color.red, linewidth=1)
plot(vol_osc, title="18_Vol_Osc", color=color.green, linewidth=1)
plot(force_index_sma, title="19_Force_Index", color=color.orange, linewidth=1)
plot(obv, title="20_OBV", color=color.purple, linewidth=1)
// Plot additional oscillators
plot(ao, title="21_Awesome_Osc", color=color.navy, linewidth=1)
plot(cmo, title="22_CMO", color=color.maroon, linewidth=1)
plot(dpo, title="23_DPO", color=color.teal, linewidth=1)
plot(trix, title="24_TRIX", color=color.lime, linewidth=1)
plot(fisher, title="25_Fisher", color=color.fuchsia, linewidth=1)
// Plot more momentum indicators
plot(mfi_centered, title="26_MFI_Centered", color=color.yellow, linewidth=1)
plot(ac, title="27_AC", color=color.aqua, linewidth=1)
plot(ppo_pct, title="28_PPO_Pct", color=color.olive, linewidth=1)
plot(stoch_rsi_centered, title="29_StochRSI_Centered", color=color.silver, linewidth=1)
plot(klinger, title="30_Klinger", color=color.gray, linewidth=1)
// Plot trend continuation
plot(tii, title="31_TII", color=color.blue, linewidth=1)
plot(ichimoku_signal, title="32_Ichimoku_Signal", color=color.red, linewidth=1)
plot(mama_momentum, title="33_MAMA_Momentum", color=color.green, linewidth=1)
plot(zlema_momentum, title="34_ZLEMA_Momentum", color=color.orange, linewidth=1)
plot(bop, title="35_BOP", color=color.purple, linewidth=1)
// Plot volume continuation
plot(nvi, title="36_NVI", color=color.navy, linewidth=1)
plot(pvi, title="37_PVI", color=color.maroon, linewidth=1)
plot(momentum_pct, title="38_Momentum_Pct", color=color.teal, linewidth=1)
plot(roc, title="39_ROC", color=color.lime, linewidth=1)
plot(rvi, title="40_RVI", color=color.fuchsia, linewidth=1)
// Plot volatility continuation
plot(dc_position, title="41_DC_Position", color=color.yellow, linewidth=1)
plot(rvi_volatility, title="42_RVI_Volatility", color=color.aqua, linewidth=1)
plot(hv, title="43_Historical_Vol", color=color.olive, linewidth=1)
plot(gk_volatility, title="44_GK_Volatility", color=color.silver, linewidth=1)
plot(parkinson, title="45_Parkinson_Vol", color=color.gray, linewidth=1)
// Plot final oscillators
plot(rogers_satchell, title="46_RS_Volatility", color=color.blue, linewidth=1)
plot(elder_power, title="47_Elder_Power", color=color.red, linewidth=1)
plot(stc, title="48_STC", color=color.green, linewidth=1)
plot(coppock, title="49_Coppock", color=color.orange, linewidth=1)
plot(kst, title="50_KST", color=color.purple, linewidth=1)
// Plot final indicators
plot(ppo_histogram, title="51_PPO_Histogram", color=color.navy, linewidth=1)
plot(pvt, title="52_PVT", color=color.maroon, linewidth=1)
// |----- Reference Lines -----| //
hline(0, "Zero Line", color=color.gray, linestyle=hline.style_dashed, linewidth=1)
hline(50, "Midline", color=color.gray, linestyle=hline.style_dotted, linewidth=1)
hline(-50, "Lower Midline", color=color.gray, linestyle=hline.style_dotted, linewidth=1)
hline(25, "Upper Threshold", color=color.gray, linestyle=hline.style_dotted, linewidth=1)
hline(-25, "Lower Threshold", color=color.gray, linestyle=hline.style_dotted, linewidth=1)
// |----- Enhanced Information Table -----| //
if show_table and barstate.islast
table_position = position.top_right
table_text_size = table_size == "Tiny" ? size.tiny : table_size == "Small" ? size.small : size.normal
var table info_table = table.new(table_position, 3, 18, bgcolor=color.new(color.white, 85), border_width=1, border_color=color.gray)
// Headers
table.cell(info_table, 0, 0, 'Category', text_color=color.black, text_size=table_text_size, bgcolor=color.new(color.blue, 70))
table.cell(info_table, 1, 0, 'Indicator', text_color=color.black, text_size=table_text_size, bgcolor=color.new(color.blue, 70))
table.cell(info_table, 2, 0, 'Value', text_color=color.black, text_size=table_text_size, bgcolor=color.new(color.blue, 70))
// Key Momentum Indicators
table.cell(info_table, 0, 1, 'MOMENTUM', text_color=color.purple, text_size=table_text_size, bgcolor=color.new(color.purple, 90))
table.cell(info_table, 1, 1, 'RSI Centered', text_color=color.purple, text_size=table_text_size)
table.cell(info_table, 2, 1, str.tostring(rsi_centered, '0.00'), text_color=color.purple, text_size=table_text_size)
table.cell(info_table, 0, 2, '', text_color=color.blue, text_size=table_text_size)
table.cell(info_table, 1, 2, 'Stoch Centered', text_color=color.blue, text_size=table_text_size)
table.cell(info_table, 2, 2, str.tostring(stoch_centered, '0.00'), text_color=color.blue, text_size=table_text_size)
table.cell(info_table, 0, 3, '', text_color=color.red, text_size=table_text_size)
table.cell(info_table, 1, 3, 'Williams %R', text_color=color.red, text_size=table_text_size)
table.cell(info_table, 2, 3, str.tostring(williams_r, '0.00'), text_color=color.red, text_size=table_text_size)
table.cell(info_table, 0, 4, '', text_color=color.orange, text_size=table_text_size)
table.cell(info_table, 1, 4, 'MACD Histogram', text_color=color.orange, text_size=table_text_size)
table.cell(info_table, 2, 4, str.tostring(macd_histogram, '0.000'), text_color=color.orange, text_size=table_text_size)
table.cell(info_table, 0, 5, '', text_color=color.green, text_size=table_text_size)
table.cell(info_table, 1, 5, 'CCI', text_color=color.green, text_size=table_text_size)
table.cell(info_table, 2, 5, str.tostring(cci, '0.00'), text_color=color.green, text_size=table_text_size)
// Key Trend Indicators
table.cell(info_table, 0, 6, 'TREND', text_color=color.navy, text_size=table_text_size, bgcolor=color.new(color.navy, 90))
table.cell(info_table, 1, 6, 'SMA Momentum %', text_color=color.navy, text_size=table_text_size)
table.cell(info_table, 2, 6, str.tostring(sma_momentum, '0.00'), text_color=color.navy, text_size=table_text_size)
table.cell(info_table, 0, 7, '', text_color=color.maroon, text_size=table_text_size)
table.cell(info_table, 1, 7, 'EMA Momentum %', text_color=color.maroon, text_size=table_text_size)
table.cell(info_table, 2, 7, str.tostring(ema_momentum, '0.00'), text_color=color.maroon, text_size=table_text_size)
table.cell(info_table, 0, 8, '', text_color=color.teal, text_size=table_text_size)
table.cell(info_table, 1, 8, 'SAR Trend', text_color=color.teal, text_size=table_text_size)
table.cell(info_table, 2, 8, str.tostring(sar_trend, '0'), text_color=color.teal, text_size=table_text_size)
table.cell(info_table, 0, 9, '', text_color=color.lime, text_size=table_text_size)
table.cell(info_table, 1, 9, 'Linear Regression', text_color=color.lime, text_size=table_text_size)
table.cell(info_table, 2, 9, str.tostring(lr_slope, '0.000'), text_color=color.lime, text_size=table_text_size)
// Key Volatility Indicators
table.cell(info_table, 0, 10, 'VOLATILITY', text_color=color.yellow, text_size=table_text_size, bgcolor=color.new(color.yellow, 90))
table.cell(info_table, 1, 10, 'ATR %', text_color=color.yellow, text_size=table_text_size)
table.cell(info_table, 2, 10, str.tostring(atr_pct, '0.00'), text_color=color.yellow, text_size=table_text_size)
table.cell(info_table, 0, 11, '', text_color=color.aqua, text_size=table_text_size)
table.cell(info_table, 1, 11, 'BB Position', text_color=color.aqua, text_size=table_text_size)
table.cell(info_table, 2, 11, str.tostring(bb_position, '0.00'), text_color=color.aqua, text_size=table_text_size)
table.cell(info_table, 0, 12, '', text_color=color.olive, text_size=table_text_size)
table.cell(info_table, 1, 12, 'KC Position', text_color=color.olive, text_size=table_text_size)
table.cell(info_table, 2, 12, str.tostring(kc_position, '0.00'), text_color=color.olive, text_size=table_text_size)
// Key Volume Indicators
table.cell(info_table, 0, 13, 'VOLUME', text_color=color.blue, text_size=table_text_size, bgcolor=color.new(color.blue, 90))
table.cell(info_table, 1, 13, 'Volume ROC', text_color=color.blue, text_size=table_text_size)
table.cell(info_table, 2, 13, str.tostring(vroc, '0.00'), text_color=color.blue, text_size=table_text_size)
table.cell(info_table, 0, 14, '', text_color=color.red, text_size=table_text_size)
table.cell(info_table, 1, 14, 'EOM', text_color=color.red, text_size=table_text_size)
table.cell(info_table, 2, 14, str.tostring(eom_sma, '0.000'), text_color=color.red, text_size=table_text_size)
// Key Oscillators
table.cell(info_table, 0, 15, 'OSCILLATORS', text_color=color.purple, text_size=table_text_size, bgcolor=color.new(color.purple, 90))
table.cell(info_table, 1, 15, 'Awesome Osc', text_color=color.blue, text_size=table_text_size)
table.cell(info_table, 2, 15, str.tostring(ao, '0.000'), text_color=color.blue, text_size=table_text_size)
table.cell(info_table, 0, 16, '', text_color=color.red, text_size=table_text_size)
table.cell(info_table, 1, 16, 'Fisher Transform', text_color=color.red, text_size=table_text_size)
table.cell(info_table, 2, 16, str.tostring(fisher, '0.000'), text_color=color.red, text_size=table_text_size)
// Summary Statistics
table.cell(info_table, 0, 17, 'SUMMARY', text_color=color.black, text_size=table_text_size, bgcolor=color.new(color.gray, 70))
table.cell(info_table, 1, 17, 'Total Indicators: 52', text_color=color.black, text_size=table_text_size)
regime_color = rsi_centered > 10 ? color.green : rsi_centered < -10 ? color.red : color.gray
regime_text = rsi_centered > 10 ? "BULLISH" : rsi_centered < -10 ? "BEARISH" : "NEUTRAL"
table.cell(info_table, 2, 17, regime_text, text_color=regime_color, text_size=table_text_size)
This makes it the perfect “indicator backbone” for quantitative and systematic traders who want to prototype, combine, and test new regime detection models—especially in combination with the Markov Chain indicator.
How to use this script with the Markov Chain for research and backtesting:
Add the Enhanced Indicator Export to your chart.
Every calculated indicator is available as an individual data stream.
Connect the indicator(s) you want as custom input(s) to the Markov Chain’s “Custom Indicators” option.
In the Markov Chain indicator’s settings, turn ON the custom indicator mode.
For each of the three custom indicator inputs, select the exported plot from the Enhanced Export script—the menu lists all 45+ signals by name.
This creates a powerful, modular regime-detection engine where you can mix-and-match momentum, trend, volume, or custom combinations for advanced filtering.
Backtest regime logic directly.
Once you’ve connected your chosen indicators, the Markov Chain script performs regime detection (Bull/Neutral/Bear) based on your selected features—not just price returns.
The regime detection is robust, automatically normalized (using Z-score), and outputs bias (1, -1, 0) for plug-and-play integration.
Export the regime bias for programmatic use.
As described above, use input.source() in your Pine Script strategy or system and link the bias output.
You can now filter signals, control trade direction/size, or design pairs-trading that respect true, indicator-driven market regimes.
With this framework, you’re not limited to static or simplistic regime filters. You can rigorously define, test, and refine what “market regime” means for your strategies—using the technical features that matter most to you.
Optimize your signal generation by backtesting across a universe of meaningful indicator blends.
Enhance risk management with objective, real-time regime boundaries.
Accelerate your research: iterate quickly, swap indicator components, and see results with minimal code changes.
Automate multi-asset or pairs-trading by integrating regime context directly into strategy logic.
Add both scripts to your chart, connect your preferred features, and start investigating your best regime-based trades—entirely within the TradingView ecosystem.
References & Further Reading
Ang, A., & Bekaert, G. (2002). “Regime Switches in Interest Rates.” Journal of Business & Economic Statistics, 20(2), 163–182.
Hamilton, J. D. (1989). “A New Approach to the Economic Analysis of Nonstationary Time Series and the Business Cycle.” Econometrica, 57(2), 357–384.
Markov, A. A. (1906). "Extension of the Limit Theorems of Probability Theory to a Sum of Variables Connected in a Chain." The Notes of the Imperial Academy of Sciences of St. Petersburg.
Guidolin, M., & Timmermann, A. (2007). “Asset Allocation under Multivariate Regime Switching.” Journal of Economic Dynamics and Control, 31(11), 3503–3544.
Murphy, J. J. (1999). Technical Analysis of the Financial Markets. New York Institute of Finance.
Brock, W., Lakonishok, J., & LeBaron, B. (1992). “Simple Technical Trading Rules and the Stochastic Properties of Stock Returns.” Journal of Finance, 47(5), 1731–1764.
Zucchini, W., MacDonald, I. L., & Langrock, R. (2017). Hidden Markov Models for Time Series: An Introduction Using R (2nd ed.). Chapman and Hall/CRC.
On Quantitative Finance and Markov Models:
Lo, A. W., & Hasanhodzic, J. (2009). The Heretics of Finance: Conversations with Leading Practitioners of Technical Analysis. Bloomberg Press.
Patterson, S. (2016). The Man Who Solved the Market: How Jim Simons Launched the Quant Revolution. Penguin Press.
TradingView Pine Script Documentation: www.tradingview.com
TradingView Blog: “Use an Input From Another Indicator With Your Strategy” www.tradingview.com
GeeksforGeeks: “What is the Difference Between Markov Chains and Hidden Markov Models?” www.geeksforgeeks.org
What makes this indicator original and unique?
- On‑chart, real‑time Markov. The chain is drawn directly on your chart. You see the current regime, its tendency to stay (self‑loop), and the usual next step (arrows) as bars confirm.
- Source‑agnostic by design. The engine runs on any series you select via input.source() — price, your own oscillator, a composite score, anything you compute in the script.
- Automatic normalization + regime mapping. Different inputs live on different scales. The script standardizes your chosen source and maps it into clear regimes (e.g., Bull / Bear / Neutral) without you micromanaging thresholds each time.
- Rolling, bar‑by‑bar learning. Transition tendencies are computed from a rolling window of confirmed bars. What you see is exactly what the market did in that window.
- Fast experimentation. Switch the source, adjust the window, and the Markov view updates instantly. It’s a rapid way to test ideas and feel regime persistence/switch behavior.
Integrate your own signals (using input.source())
- In settings, choose the Source . This is powered by input.source() .
- Feed it price, an indicator you compute inside the script, or a custom composite series.
- The script will automatically normalize that series and process it through the Markov engine, mapping it to regimes and updating the on‑chart spheres/arrows in real time.
Credits:
Deep gratitude to @RicardoSantos for both the foundational Markov chain processing engine and inspiring open-source contributions, which made advanced probabilistic market modeling accessible to the TradingView community.
Special thanks to @Alien_Algorithms for the innovative and visually stunning 3D sphere logic that powers the indicator’s animated, regime-based visualization.
Disclaimer
This tool summarizes recent behavior. It is not financial advice and not a guarantee of future results.

Time Clusters [Blu_Ju]What are Time Clusters?
Within the scope of this script, a time cluster is simply the price range of a single 1-minute timeframe bar or candle. The basic function of this script is to draw a box for each of the selected 1-minute timeframe candles and extend that box forward. This script also labels the box with the corresponding time (in 24-hr format), as can be seen in the image above.
What are Time Clusters used for?
Time clusters are primarily used by intraday traders as levels of support or resistance. All manner of models can be built around time clusters. For example, a trader may be interested in the price of a futures contract such as the Nasdaq (NQ) retracing to the midnight (00:00) price level after the New York open at 9:30 EST. Any specific model using time clusters is beyond the scope of this script. This script only aims to automate the process of drawing boxes and labels for the time clusters (which is otherwise done manually).
What makes this Script unique:
Other scripts have been written to draw the opening price of a particular time, such as the New York market open at 9:30 EST. What makes this script unique is that it not only draws a box for the entire 1-minute range of any selected time, but that box is accurate to that 1-minute range on higher timeframes (such as the 3 minute or 15 minute timeframes) and lower timeframes (such as the 15 second timeframe). There is a particular limitation to this - see below.
Limitations of this script:
Because time clusters are typically used on the lower timeframes for intraday trading, the maximum timeframe that this script executes on is the 30 minute timeframe.
While the script does a good job of accurately marking the range of a 1-minute candle on other timeframes, there are some uncommon timeframes it will not accurately work on, such as a 7-minute or 13-minute timeframe. Stay off these unusual timeframes, and the script will draw the time clusters accurately.
Features of this Script:
This script was written to allow the user flexibility in how the time clusters and labels are displayed.
Labels:
By default the labels are toggled on, and they are given the same color as their corresponding time cluster. The labels can be toggled off, and the label color can be overridden to make all the labels a single color of the user's choosing. Additionally, the label size can be changed. Lastly, the labels by default are shifted to the current bar, but this can be toggled off so that the labels remain at the origin of the time cluster. See below for an example of label customization:
User-Defined Time Clusters:
While this script provides a long list of commonly-used time clusters, there are also five user-definable time clusters available. The user may enter the desired time using 4 digits without the colon. For example, enter '0120' for the 1:20 time cluster.
Recoloring Candles:
This script give the user the option to recolor up to ten 1-minute candles of the user's choosing. Note that the recoloring only affects 1-minute and seconds-based timeframes. Candles will not be recolored on any timeframe higher than 1 minute.
Multiple Time Clusters:
Some trading strategies are interested in the time clusters from prior trading days. This script gives the user the option of displaying up to 30 historic clusters for any of the selected times. In the example shown below, The 13:30 time cluster is toggled visible, and 5 historic 13:30 time clusters are shown.

CRT Hourly/15m dividers and opensRange Separator is a unique tool designed to help traders visualize critical price levels and ranges on their charts. This script employs the innovative concepts of "Candles Are Ranges" and the "Power of 3 (PO3)" to enhance trading strategies by marking key time intervals and price levels.
What the Script Does:
Hourly Lines:
Automatically draws vertical lines at the start of each hour.
Provides an option to display only the current hour's line for a cleaner visual.
Allows customization of line color, width, and style.
15-Minute Lines:
Adds vertical lines at 15-minute intervals to highlight smaller time ranges.
Includes an option to draw horizontal lines at the 15-minute interval prices.
Offers customization for line color, width, and style.
Horizontal Lines:
Draws horizontal lines based on the opening, high, or low price of the selected timeframe.
Customizable options for line color, width, and style.
How the Script Works:
Candles Are Ranges: Each candle represents a price range (OHLC) on any timeframe. The script visually emphasizes these ranges, helping traders understand price action better.
Power of 3 (PO3): This concept divides price delivery into three stages: formation, turtle soup (stop hunting), and distribution/expansion. The script marks these intervals, aiding in identifying potential key levels for entries and exits.
How to Use the Script:
Adding the Script:
Apply the script to your chart and adjust the settings in the input menu.
Customize the appearance of hourly and 15-minute lines to suit your preference.
Analyzing the Chart:
Observe the hourly lines to determine higher timeframe biases.
Use 15-minute lines to identify more granular price movements.
Pay attention to horizontal lines that mark significant price levels based on your chosen criteria (open, high, low).
Trading Strategy:
Combine the script's visual aids with your understanding of the "Candles Are Ranges" and "Power of 3" concepts.
Use these visual cues to make informed decisions about potential entry and exit points.
What Makes it Original:
Integration of Candles Are Ranges and PO3 Concepts: Unlike traditional scripts that merely plot lines, this script uniquely integrates two powerful trading theories to provide a comprehensive view of price action.
Customizable Visual Aids: Offers extensive customization options for line colors, widths, and styles, allowing traders to tailor the script to their specific needs.
Enhanced Timeframe Analysis: By marking both hourly and 15-minute intervals, the script provides a detailed view of price ranges across multiple timeframes, enhancing the trader's ability to make informed decisions.
- Key script Parameters
Show Hourly Lines: Toggles the display of vertical lines marking each hour.
Hourly Lines Color: Sets the color of the hourly vertical lines.
Hourly Lines Width: Chooses the width of the hourly vertical lines (1, 2, or 3).
Hourly Lines Style: Selects the style of the hourly lines (Solid, Dashed, or Dotted).
Horizontal Line Color: Defines the color of the horizontal lines drawn at hourly intervals.
Horizontal Line Width: Determines the width of the horizontal lines (1, 2, or 3).
Horizontal Line Style: Sets the style of the horizontal lines (Solid, Dashed, or Dotted).
Horizontal Line Start Price: Specifies which price (Open, High, Low) the horizontal lines will start from.
Show Current Hour Only: Limits the display to only the current hour's horizontal line.
Show 15-Minute Lines: Toggles the display of vertical lines marking each 15-minute interval.
15-Minute Lines Color: Sets the color of the 15-minute vertical lines.
15-Minute Lines Width: Chooses the width of the 15-minute vertical lines (1, 2, or 3).
15-Minute Lines Style: Selects the style of the 15-minute lines (Solid, Dashed, or Dotted).
Show 15-Minute Horizontal Lines: Toggles the display of horizontal lines at 15-minute intervals.
15-Minute Horizontal Lines Color: Defines the color of the horizontal lines drawn at 15-minute intervals.
15-Minute Horizontal Lines Width: Determines the width of the horizontal lines (1, 2, or 3).
15-Minute Horizontal Lines Style: Sets the style of the horizontal lines (Solid, Dashed, or Dotted).
Important Notes:
- Credit to @Yazdanian and his basic "Hourly separators" indicator that plots a simple vertical line every hour which provided the idea for this version and expanded on
- This script is designed to complement your trading strategy by providing visual aids and should be used alongside other technical analysis tools.
It is not intended to issue buy or sell signals but to help you understand price ranges and potential key levels.
Disclaimer: The script is provided as-is, and the authors are not responsible for any trading losses incurred using this script. Always perform your own analysis and use proper risk management.
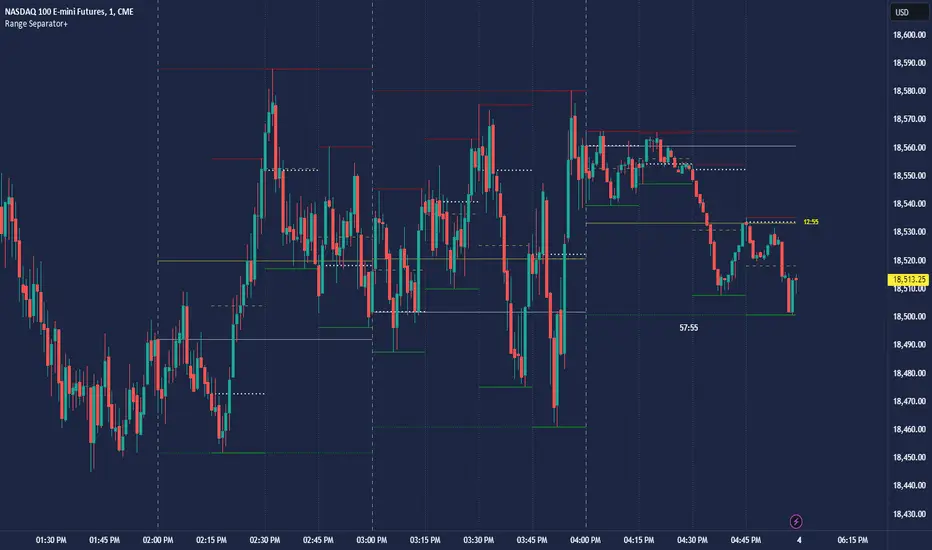
Delta Volume Candles [LucF]█ OVERVIEW
This indicator plots on-chart volume delta information using candles that can replace your normal candles, tops and bottoms appended to normal candles, optional MAs of those tops and bottoms levels, a divergence channel and a chart background. The indicator calculates volume delta using intrabar analysis, meaning that it uses the lower timeframe bars constituting each chart bar.
█ CONCEPTS
Volume Delta
The volume delta concept divides a bar's volume in "up" and "down" volumes. The delta is calculated by subtracting down volume from up volume. Many calculation techniques exist to isolate up and down volume within a bar. The simplest use the polarity of interbar price changes to assign their volume to up or down slots, e.g., On Balance Volume or the Klinger Oscillator . Others such as Chaikin Money Flow use assumptions based on a bar's OHLC values. The most precise calculation method uses tick data and assigns the volume of each tick to the up or down slot depending on whether the transaction occurs at the bid or ask price. While this technique is ideal, it requires huge amounts of data on historical bars, which considerably limits the historical depth of charts and the number of symbols for which tick data is available. Furthermore, historical tick data is not yet available on TradingView.
This indicator uses intrabar analysis to achieve a compromise between the simplest and most precise methods of calculating volume delta. It is currently the most precise method usable on TradingView charts. TradingView's Volume Profile built-in indicators use it, as do the CVD - Cumulative Volume Delta Candles and CVD - Cumulative Volume Delta (Chart) indicators published from the TradingView account . My Delta Volume Channels and Volume Delta Columns Pro indicators also use intrabar analysis. Other volume delta indicators such as my Realtime 5D Profile use realtime chart updates to calculate volume delta without intrabar analysis, but that type of indicator only works in real time; they cannot calculate on historical bars.
This is the logic I use to determine the polarity of intrabars, which determines the up or down slot where its volume is added:
• If the intrabar's open and close values are different, their relative position is used.
• If the intrabar's open and close values are the same, the difference between the intrabar's close and the previous intrabar's close is used.
• As a last resort, when there is no movement during an intrabar, and it closes at the same price as the previous intrabar, the last known polarity is used.
Once all intrabars making up a chart bar have been analyzed and the up or down property of each intrabar's volume determined, the up volumes are added, and the down volumes subtracted. The resulting value is volume delta for that chart bar, which can be used as an estimate of the buying/selling pressure on an instrument. Not all markets have volume information. Without it, this indicator is useless.
Intrabar analysis
Intrabars are chart bars at a lower timeframe than the chart's. The timeframe used to access intrabars determines the number of intrabars accessible for each chart bar. On a 1H chart, each chart bar of an active market will, for example, usually contain 60 bars at the lower timeframe of 1min, provided there was market activity during each minute of the hour.
This indicator automatically calculates an appropriate lower timeframe using the chart's timeframe and the settings you use in the script's "Intrabars" section of the inputs. As it can access lower timeframes as small as seconds when available, the indicator can be used on charts at relatively small timeframes such as 1min, provided the market is active enough to produce bars at second timeframes.
The quantity of intrabars analyzed in each chart bar determines:
• The precision of calculations (more intrabars yield more precise results).
• The chart coverage of calculations (there is a 100K limit to the quantity of intrabars that can be analyzed on any chart,
so the more intrabars you analyze per chart bar, the less chart bars can be calculated by the indicator).
The information box displayed at the bottom right of the chart shows the lower timeframe used for intrabars, as well as the average number of intrabars detected for chart bars and statistics on chart coverage.
Balances
This indicator calculates five balances from volume delta values. The balances are oscillators with a zero centerline; positive values are bullish, and negative values are bearish. It is important to understand the balances as they can be used to:
• Color candle bodies.
• Calculate body and top and bottom divergences.
• Color an EMA channel.
• Color the chart's background.
• Configure markers and alerts.
The five balances are:
1 — Bar Balance : This is the only balance using instant values; it is simply the subtraction of the down volume from the up volume on the bar, so the instant volume delta for that bar.
2 — Average Balance : Calculates a distinct EMA for both the up and down volumes, and subtracts the down EMA from the up EMA.
The result is akin to MACD's histogram because it is the subtraction of two moving averages.
3 — Momentum Balance : Starts by calculating, separately for both up and down volumes, the difference between the same EMAs used in "Average Balance" and
an SMA of twice the period used for the "Average Balance" EMAs. The difference for the up side is subtracted from the difference for the down side,
and an RSI of that value is calculated and brought over the −50/+50 scale.
4 — Relative Balance : The reference values used in the calculation are the up and down EMAs used in the "Average Balance".
From those, we calculate two intermediate values using how much the instant up and down volumes on the bar exceed their respective EMA — but with a twist.
If the bar's up volume does not exceed the EMA of up volume, a zero value is used. The same goes for the down volume with the EMA of down volume.
Once we have our two intermediate values for the up and down volumes exceeding their respective MA, we subtract them. The final value is an ALMA of that subtraction.
The rationale behind using zero values when the bar's up/down volume does not exceed its EMA is to only take into account the more significant volume.
If both instant volume values exceed their MA, then the difference between the two is the signal's value.
The signal is called "relative" because the intermediate values are the difference between the instant up/down volumes and their respective MA.
This balance flatlines when the bar's up/down volumes do not exceed their EMAs, which makes it useful to spot areas where trader interest dwindles, such as consolidations.
The smaller the period of the final value's ALMA, the more easily it will flatline. These flat zones should be considered no-trade zones.
5 — Percent Balance : This balance is the ALMA of the ratio of the "Bar Balance" over the total volume for that bar.
From the balances and marker conditions, two more values are calculated:
1 — Marker Bias : This sums the up/down (+1/‒1) occurrences of the markers 1 to 4 over a period you define, so it ranges from −4 to +4, times the period.
Its calculation will depend on the modes used to calculate markers 3 and 4.
2 — Combined Balances : This is the sum of the bull/bear (+1/−1) states of each of the five balances, so it ranges from −5 to +5.
The periods for all of these balances can be configured in the "Periods" section at the bottom of the script's inputs. As you cannot see the balances on the chart, you can use my Volume Delta Columns Pro indicator in a pane; it can plot the same balances, so you will be able to analyze them.
Divergences
In the context of this indicator, a divergence is any bar where the bear/bull state of a balance (above/below its zero centerline) diverges from the polarity of a chart bar. No directional bias is assigned to divergences when they occur. Candle bodies and tops/bottoms can each be colored differently on divergences detected from distinct balances.
Divergence Channel
The divergence channel is the space between two levels (by default, the bar's open and close ) saved when divergences occur. When price (by default the close ) has breached a channel and a new divergence occurs, a new channel is created. Until that new channel is breached, bars where additional divergences occur will expand the channel's levels if the bar's price points are outside the channel.
Prices breaches of the divergence channel will change its state. Divergence channels can be in one of three different states:
• Bull (green): Price has breached the channel to the upside.
• Bear (red): Price has breached the channel to the downside.
• Neutral (gray): The channel has not yet been breached.
█ HOW TO USE THE INDICATOR
I do not make videos to explain how to use my indicators. I do, however, try hard to include in their description everything one needs to understand what they do. From there, it's up to you to explore and figure out if they can be useful in your trading practice. Communicating in videos what this description and the script's tooltips contain would make for very long videos that would likely exceed the attention span of most people who find this description too long. There is no quick way to understand an indicator such as this one because it uses many different concepts and has quite a bit of settings one can use to modify its visuals and behavior — thus how one uses it. I will happily answer questions on the inner workings of the indicator, but I do not answer questions like "How do I trade using this indicator?" A useful answer to that question would require an in-depth analysis of who you are, your trading methodology and objectives, which I do not have time for. I do not teach trading.
Start by loading the indicator on an active chart containing volume information. See here if you need help.
The default configuration displays:
• Normal candles where the bodies are only colored if the bar's volume has increased since the last bar.
If you want to use this indicator's candles, you may want to disable your chart's candles by clicking the eye icon to the right of the symbol's name in the top left of the chart.
• A top or bottom appended to the normal candles. It represents the difference between up and down volume for that bar
and is positioned at the top or bottom, depending on its polarity. If up volume is greater than down volume, a top is displayed. If down volume is greater, a bottom is plotted.
The size of tops and bottoms is determined by calculating a factor which is the proportion of volume delta over the bar's total volume.
That factor is then used to calculate the top or bottom size relative to a baseline of the average candle body size of the last 100 bars.
• An information box in the bottom right displaying intrabar and chart coverage information.
• A light red background when the intrabar volume differs from the chart's volume by more than 1%.
The script's inputs contain tooltips explaining most of the fields. I will not repeat them here. Following is a brief description of each section of the indicator's inputs which will give you an idea of what the indicator can do:
Normal Candles is where you configure the replacement candles plotted by the script. You can choose from different coloring schemes for their bodies and specify a unique color for bodies where a divergence calculated using the method you choose occurs.
Volume Tops & Botttoms is where you configure the display of tops and bottoms, and their EMAs. The EMAs are calculated from the high point of tops and the low point of bottoms. They can act as a channel to evaluate price, and you can choose to color the channel using a gradient reflecting the advances/declines in the balance of your choice.
Divergence Channel is where you set up the appearance and behavior of the divergence channel. These areas represent levels where price and volume delta information do not converge. They can be interpreted as regions with no clear direction from where one will look for breaches. You can configure the channel to take into account one or both types of divergences you have configured for candle bodies and tops/bottoms.
Background allows you to configure a gradient background color that reflects the advances/declines in the balance of your choice. You can use this to provide context to the volume delta values from bars. You can also control the background color displayed on volume discrepancies between the intrabar and the chart's timeframe.
Intrabars is where you choose the calculation mode determining the lower timeframe used to access intrabars. The indicator uses the chart's timeframe and the type of market you are on to calculate the lower timeframe. Your setting there should reflect which compromise you prefer between the precision of calculations and chart coverage. This is also where you control the display of the information box in the lower right corner of the chart.
Markers allows you to control the plotting of chart markers on different conditions. Their configuration determines when alerts generated from the indicator will fire. Note that in order to generate alerts from this script, they must be created from your chart. See this Help Center page to learn how. Only the last 500 markers will be visible on the chart, but this will not affect the generation of alerts.
Periods is where you configure the periods for the balances and the EMAs used in the indicator.
The raw values calculated by this script can be inspected using the Data Window.
█ INTERPRETATION
Rightly or wrongly, volume delta is considered by many a useful complement to the interpretation of price action. I use it extensively in an attempt to find convergence between my read of volume delta and price movement — not so much as a predictor of future price movement. No system or person can predict the future. Accordingly, I consider people who speak or act as if they know the future with certainty to be dangerous to themselves and others; they are charlatans, imprudent or blissfully ignorant.
I try to avoid elaborate volume delta interpretation schemes involving too many variables and prefer to keep things simple:
• Trends that have more chances of continuing should be accompanied by VD of the same polarity.
In trends, I am looking for "slow and steady". I work from the assumption that traders and systems often overreact, which translates into unproductive volatility.
Wild trends are more susceptible to overreactions.
• I prefer steady VD values over wildly increasing ones, as large VD increases often come with increased price volatility, which can backfire.
Large VD values caused by stopping volume will also often occur on trend reversals with abnormally high candles.
• Prices escaping divergence channels may be leading a trend in that direction, although there is no telling how long that trend will last; could be just a few bars or hundreds.
When price is in a channel, shifts in VD balances can sometimes give us an idea of the direction where price has the most chance of breaking.
• Dwindling VD will often indicate trend exhaustion and predate reversals by many bars, but the problem is that mere pauses in a trend will often produce the same behavior in VD.
I think it is too perilous to infer rigidly from VD decreases.
Divergence Channel
Here I have configured the divergence channels to be visible. First, I set the bodies to display divergences on the default Bar Balance. They are indicated by yellow bodies. Then I activated the divergence channels by choosing to draw levels on body divergences and checked the "Fill" checkbox to fill the channel with the same color as the levels. The divergence channel is best understood as a direction-less area from where a breach can be acted on if other variables converge with the breach's direction:
Tops and Bottoms EMAs
I find these EMAs rather interesting. They have no equivalent elsewhere, as they are calculated from the top and bottom values this indicator plots. The only similarity they have with volume-weighted MAs, including VWAP, is that they use price and volume. This indicator's Tops and Bottoms EMAs, however, use the price and volume delta. While the channel differs from other channels in how it is calculated, it can be used like others, as a baseline from which to evaluate price movement or, alternatively, as stop levels. Remember that you can change the period used for the EMAs in the "Periods" section of the inputs.
This chart shows the EMAs in action, filled with a gradient representing the advances/decline from the Momentum balance. Notice the anomaly in the chart's latest bars where the Momentum balance gradient has been indicating a bullish bias for some time, during which price was mostly below the EMAs. Price has just broken above the channel on positive VD. My interpretation of this situation would be that it is a risky opportunity for a long trade in the larger context where the market has been in a downtrend since the 5th. Intrepid traders choosing to enter here could do so with a "make or break" tight stop that will minimize their losses should the market continue its downtrend while hopefully preserving the potential upside of price continuing on the longer-term uptrend prevalent since the 28th:
█ NOTES
Volume
If you use indicators such as this one which depends on volume information, it is important to realize that the volume data they consume comes from data feeds, and that all data feeds are NOT created equally. Those who create the data feeds we use must make decisions concerning the nature of the transactions they tally and the way they are tallied in each feed, and these decisions affect the nature of our volume data. My Volume X-ray publication discusses some of the reasons why volume information from different timeframes, brokers/exchanges or sectors may vary considerably. I encourage you to read it. This indicator's display of a warning through a background color on volume discrepancies between the timeframe used to access intrabars and the chart's timeframe is an attempt to help you realize these variations in feeds. Don't take things for granted, and understand that the quality of a given feed's volume information affects the quality of the results this indicator calculates.
Markets as ecosystems
I believe it is perilous to think that behavioral patterns you discover in one market through the lens of this or any other indicator will necessarily port to other markets. While this may sometimes be the case, it will often not. Why is that? Because each market is its own ecosystem. As cities do, all markets share some common characteristics, but they also all have their idiosyncrasies. A proportion of a city's inhabitants is always composed of outsiders who come and go, but a core population of regulars and systems is usually the force that actually defines most of the city's observable characteristics. I believe markets work somewhat the same way; they may look the same, but if you live there for a while and pay attention, you will notice the idiosyncrasies. Some things that work in some markets will, accordingly, not work in others. Please keep that in mind when you draw conclusions.
On Up/Down or Buy/Sell Volume
Buying or selling volume are misnomers, as every unit of volume transacted is both bought and sold by two different traders. While this does not keep me from using the terms, there is no such thing as “buy only” or “sell only” volume. Trader lingo is riddled with peculiarities. Without access to order book information, traders work with the assumption that when price moves up during a bar, there was more buying pressure than selling pressure, just as when buy market orders take out limit ask orders in the order book at successively higher levels. The built-in volume indicator available on TradingView uses this logic to color the volume columns green or red. While this script’s calculations are more precise because it analyses intrabars to calculate its information, it uses pretty much the same imperfect logic. Until Pine scripts can have access to how much volume was transacted at the bid/ask prices, our volume delta calculations will remain a mere proxy.
Repainting
• The values calculated on the realtime bar will update as new information comes from the feed.
• Historical values may recalculate if the historical feed is updated or when calculations start from a new point in history.
• Markers and alerts will not repaint as they only occur on a bar's close. Keep this in mind when viewing markers on historical bars,
where one could understandably and incorrectly assume they appear at the bar's open.
To learn more about repainting, see the Pine Script™ User Manual's page on the subject .
Superfluity
In "The Bed of Procrustes", Nassim Nicholas Taleb writes: To bankrupt a fool, give him information . This indicator can display a lot of information. The inevitable adaptation period you will need to figure out how to use it should help you eliminate all the visuals you do not need. The more you eliminate, the easier it will be to focus on those that are the most useful to your trading practice. Don't be a fool.
█ THANKS
Thanks to alexgrover for his Dekidaka-Ashi indicator. His volume plots on candles were the inspiration for my top/bottom plots.
Kudos to PineCoders for their libraries. I use two of them in this script: Time and lower_tf .
The first versions of this script used functionality that I would not have known about were it not for these two guys:
— A guy called Kuan who commented on a Backtest Rookies presentation of their Volume Profile indicator.
— theheirophant , my partner in the exploration of the sometimes weird abysses of request.security() ’s behavior at lower timeframes.

TrendGuard Pullback Trader Indicators [Quantigenics]The 'TrendGuard Pullback Trader Indicators' offers a synergistic representation of Trend Wave, Trend Pulse, and Trend Strength, each interrelated to provide intuitive and comprehensive market analysis—combining momentum, trend fluctuation insights, and trend strength in one cohesive tool.
The "TrendGuard Pullback Trader Indicators " utilize a novel approach in market trend analysis, distinctly combining multiple Exponential Moving Averages (EMA) layers for enhanced momentum tracking. This script employs a triple-layered EMA system for the Trend Wave component, adeptly filtering market noise and providing a refined view of underlying momentum. In parallel, the Trend Pulse feature contrasts current prices against a double-EMA of modified averages, offering granular insights into short-term market dynamics. This synergy is further enriched by the Trend Strength Identifier, which leverages the differential between fast and slow EMAs. This element is key in distinguishing significant market trends from minor fluctuations, thus offering a comprehensive gauge of market sentiment. These components, while advanced in their individual functionalities, are integrated to provide a holistic market analysis tool, far surpassing the capabilities of standard trend-following indicators. This sophisticated integration, underpinned by complex mathematical modeling, ensures that the "TrendGuard Pullback Indicators" script is not just a collection of indicators but a refined, cohesive system for strategic trading.
Integrated Analysis System: Trend Wave, Trend Pulse, and Trend Strength Identifier:
Trend Wave : Advanced Momentum Analysis
Calculation : Implements an advanced smoothing technique using a triple-layered Exponential Moving Average (EMA). This complex approach reduces market noise by refining the momentum tracking algorithm, thereby enhancing trend line smoothness.
Output : The output is visualized as a color-changing histogram, pivoting from green to red to indicate bullish and bearish momentum. This histogram is based on a scaled and adjusted Trend Wave value, providing a nuanced understanding of market momentum shifts.
Trend Pulse : Precision in Short-term Market Dynamics
Design : Contrasts a unique combination of high and low prices with their double EMA, diverging from standard closing price analysis. This results in a dynamic indicator sensitive to immediate market shifts.
Function : Acts as a vital complement to Trend Wave, offering fine-grained insights into short-term market behavior. It enhances the overall system by adding depth to the trend context set by the Trend Wave
Trend Strength Identifier: In-Depth Trend Viability Assessment Mechanism
Mechanism : Utilizes a sophisticated differential EMA strategy, comparing fast and slow EMA outputs. The script’s complexity extends beyond basic EMA differences, incorporating advanced trend/noise ratio calculations and trend quality assessments.
Indicator Dynamics : Generates a histogram that colors and positions itself based on the strength and direction of market trends, further informed by calculated trend quality metrics. It crucially differentiates between major trends and minor market noise.
System Synergy :
The three components are designed to operate in unison, forming an integrated trading system. Their interrelation is not merely additive but synergistic, where each element informs and enhances the others, making them indispensable to one another.
This interconnected functionality blends the indicators, as each component is tailored to contribute to a unified decision-making process, rather than functioning as standalone entities. The system's unique construction and its reliance on the interplay between its components underscore its distinctiveness and necessity for combined usage.
How to Trade with the "TrendGuard Pullback Trader Indicators"
Integration with "TrendGuard Pullback Signals" script :
The "TrendGuard Pullback Trader Indicators" script is an integral part of the "TrendGuard Pullback Trader" system, designed to operate in tandem with the "TrendGuard Pullback Trader Signals" script. This script amalgamates three sophisticated indicators, each contributing a unique perspective to market analysis.
This script, while useful as a standalone trading method, is one part of a two-part system. The “TrendGuard Pullback Trader Signals” script can be found below:
Integrated Trend Analysis: Aligning Wave, Pulse, and Strength :
Trend Wave & Trend Pulse Alignment : Look for moments when both the Trend Wave and Trend Pulse indicate a similar direction (both turning green for bullish or red for bearish). This alignment often marks the beginning of a new primary trend.
Confirmation with Trend Strength : Ensure that the Trend Strength histogram supports the new trend. A rising histogram above the lower threshold (white line) indicates growing trend strength.
Assessing Trend Strength and Potential Exhaustion :
Monitoring Threshold Lines : The upper (blue) and lower (white) threshold lines are crucial. When the Trend Strength histogram crosses these lines, it signals significant market conditions:
Above the Upper Threshold (Blue Line): Indicates a very strong trend but be cautious of potential trend exhaustion. A peak above this line may signal that the trend is overstretched.
Below the Lower Threshold (White Line): Suggests a weak or emerging trend, potentially signaling a trend reversal or consolidation phase.
Determining Trending or Ranging Market :
Above Lower Threshold : If the Trend Strength histogram consistently stays above the lower threshold, it suggests a trending market. Use this phase for trend-following strategies.
Below Lower Threshold : When the histogram frequently falls below this line, it may indicate a ranging or choppy market. In such conditions, consider adopting range-bound strategies or tightening stop losses.
Practical Application :
Entry Points : Trades can be initiated when there’s an alignment in Trend Wave and Pulse, coupled with supportive readings in Trend Strength. For instance, long positions during a green Trend Wave and Pulse, with the Trend Strength histogram rising above the lower threshold and vice versa for short entries.
Exit Points and Profit Taking : Consider exiting or taking profits when the Trend Strength crosses above the upper threshold, indicating potential trend exhaustion, especially if the trend strength histogram suddenly drops. Also, look for changes in the Trend Wave and Pulse for additional exit signals.
Alerts Setup : Utilize the provided alert features for key changes in the indicators, especially when the Trend Strength crosses threshold lines, to stay updated on significant market shifts.
Interpreting Indicator Interactions :
Refer to the accompanying images for visual examples of how these indicators interact and signal various market conditions. Understanding their synergy will enhance your ability to recognize key market phases and adjust your trading strategy accordingly.
The "TrendGuard Pullback Trader Indicators" script is intricately designed to be used in conjunction with the "TrendGuard Pullback Trader Signals" script, offering a cohesive and comprehensive trading strategy. Use both scripts together for a more robust trading method.
Adjustable Input Parameters
Each component in the script features customizable settings, designed to offer traders comprehensive control over the indicators. This flexibility allows for tailoring to specific trading styles, market conditions, and time frames. With options for adjusting visibility, selecting price types, modifying calculation lengths, and setting thresholds, these parameters ensure that the tool can be fine-tuned for a high degree of customization and precision, making it adaptable and effective for nearly all markets/symbols and time frames.
Important Usage Guidance: For seamless integration with its counterpart, the "TrendGuard Pullback Trader Signals" script, it's crucial to align the input parameter settings across both scripts. When adjusting values from their defaults, ensure that corresponding parameters in both scripts are identically set. This synchronization is key to achieving a cohesive and accurate representation on your charts.
Show Indicator Name (ShowName):
This parameter controls the display of the indicator's name on the chart. When enabled (`true`), it visually labels the indicator for ease of identification. Disabling (`false`) this feature offers a cleaner visual by removing the label.
Show Trend Wave Indicator (ShowTrendWave):
Activates or deactivates the Trend Wave indicator. When active (`true`), it displays a histogram based on the triple-layered exponential moving average (EMA) of the selected price type, providing a visual representation of market momentum trends. Deactivating (`false`) simplifies the chart by removing this histogram.
Trend Wave Price (TrendWavePrice):
Specifies the price data (close, open, high, low) used in calculating the Trend Wave. This choice affects how the Trend Wave responds to market movements, with each price type offering a different perspective on market momentum.
Trend Wave Length (TrendWaveLength):
Determines the overall calculation period for the triple-layered EMA in the Trend Wave, influencing its sensitivity. A higher value leads to a smoother, less volatile wave, focusing on longer-term market trends, whereas a lower value makes it more responsive to recent price actions.
Show Trend Pulse Indicator (ShowTrendPulse):
This parameter toggles the display of the Trend Pulse indicator, which analyzes the divergence between the current closing price and a double-EMA of a modified price average, providing insight into immediate market dynamics. Enabling (`true`) it adds this analysis to the chart, while disabling (`false`) removes it for focus on other trends.
Trend Pulse Length (TrendPulseLength):
Sets the length for the main double-EMA calculation in the Trend Pulse. A higher number smoothens the indicator, reducing sensitivity to minor price changes and highlighting more significant short-term trends.
Show Trend Strength Indicator (ShowTrendStrength):
Controls whether the Trend Strength indicator is displayed. This indicator uses a differential approach between fast and slow EMAs to assess the market's trend strength. Enabling it (`true`) provides a histogram view of the trend’s robustness, whereas disabling (`false`) omits this analysis.
Fast Average Length (FastAvgLen):
Specifies the period for the fast EMA in the Trend Strength indicator. Shorter periods make the EMA more sensitive to recent price changes, ideal for identifying new trend formations.
Slow Average Length (SlowAvgLen):
Determines the period for the slow EMA in the Trend Strength indicator. A longer period smoothens the EMA, useful for identifying sustained trend directions.
Threshold High (ThresholdHi):
This value sets a high threshold for the Trend Strength indicator. Values exceeding this threshold indicate a strong and established market trend, which can be critical for strategies focusing on trend continuity.
Threshold Low (ThresholdLow):
Defines a low threshold for the Trend Strength indicator. Values below this threshold suggest weak or emerging trends, signaling potential trend reversals or consolidations.
Threshold Trend (ThreshTrend):
Establishes a specific threshold within the Trend Strength indicator for identifying significant trends. Exceeding this threshold often suggests a trend with potential trading relevance.
Enable Threshold Low (ThresholdLowOnOff):
This option enables or disables the low threshold in the Trend Strength calculation. It allows traders to customize the indicator’s sensitivity to weaker trends.
Average Line (AvgLine):
Adjusts the period for an additional EMA line in the Trend Strength indicator. This line acts as a smoothing reference for the Trend Strength. This can also act as a threshold reference as when its below the ‘Threshold Low’ line this could identify sideways/choppy conditions.
Conclusion:
The "TrendGuard Pullback Trader Indicators" script provides a multidimensional analysis platform, combining in-depth momentum tracking, immediate market movement insights, and robust trend evaluation.
Remember, trading involves risk, and past performance is not indicative of future results.
You can see the “Author’s instructions" below to get immediate access to TrendGuard Pullback Trader Indicators & the rest of the “Quantigenics Premium Indicator Suite”.
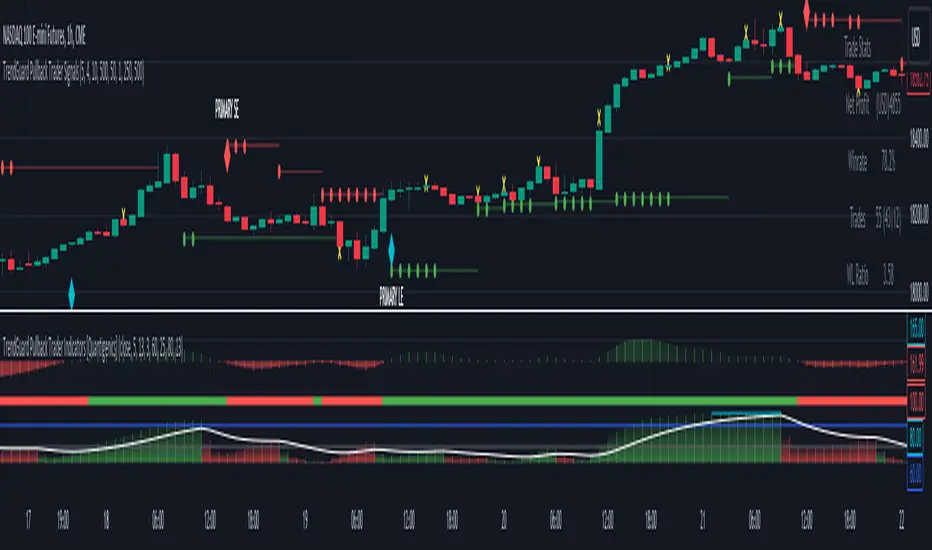
Footprint ClassicThe Volume Footprint chart is analyzing volume data contained within candles and split it into two components - Up and Down volume. This analysis is similar to how Volume Profile evaluates volume data from a portion of the chart.
This script can be used by any user. You do not need to have PRO or PREMIUM account to use it.
As a user, you have the flexibility to select the desired level of data precision for the Volume Footprint analysis. We highly recommend using the highest precision possible, as it provides the most accurate results. However, it's important to keep in mind that Trading View has several limitations and not all levels of precision are available on all intervals. The higher the precision, the shorter the history of available data.
If, after adding the script or changing the precision, you encounter an error message stating "'The study references too many candles in history'", it may be necessary to reduce the precision level in the script settings to resolve the issue.
This script is a part of the "Volume Footprint" toolkit, which includes:
I. Footprint chart visualization scripts in two variants:
⠀⠀Volume Footprint - Presenting volume data on both sides of the candle.
⠀⠀Volume Footprint Classic - Presenting volume data on the right side of the candle.
II. Supporting tools:
⠀⠀Volume Footprint Statistics - Script presents, in tabular form, basic statistics calculated from candle volume data, such as Delta, min Delta, max Delta and more. It can support both Volume Footprint and Volume Footprint Classic.
⠀⠀Volume Footprint Candles - Tool drawing candles adapted for footprint chart scripts.
III. Tools dedicated to more detailed analysis:
⠀⠀Volume Delta - A candle chart illustrating changes in delta values.
⠀⠀Volume Cumulative Delta - A candle chart ilustrating changes in cumulative delta values.
⠀⠀Volume Delta In Candle - A line chart showing changes in delta values over a period equal to the chart interval.
⠀⠀Volume Cumulative Delta in Interval - A line chart showing changes in cumulative delta over a period equal to the chart interval.
Script with limited access, contact author to get authorization
User Interface:
The script groups Up and Down volume into slots based on price. The height of the slots is controlled by the "Slot height" parameter in the settings. Each slot has the following configurable features:
Text - A label that displays the value. You can choose from:
⠀- - Hidden
⠀V - Slot Volume (UP + Down)
⠀V% - Slot volume as percentage of Candle volume
⠀UD - Up and Down volume
⠀UDI - Up and Down volume + Imbalance symbols.
⠀Δ - Delta (Up - Down Volume)
⠀Δ% - Delta as percent of slot volume (from -100% to 100%)
Border - Highlight slots with border color. You can chose from:
⠀- - Hidden
⠀C - Constant color
⠀POC - Slot with biggest volume
⠀V - Slot volume compared to other slots in that candle
⠀VA - Value area, highlights slots forming the value area
⠀Δ - Delta is the slot.
Background - Highlight slots with background color. You can pick one of:
⠀- - Hidden
⠀C - Constant color
⠀POC - Slot with biggest volume
⠀V - Slot volume compared to other slots in that candle
⠀VA - Value area, highlights slots forming the value area
⠀Δ - Delta is the slot.
Imbalances symbols:
Before the Down Volume, the following imbalance symbols may appear:
⠀↓ - 3 times
⠀↡ - 5 times
⠀⇊ - 10 times
After the Up Volume the following imbalance symbols may appear:
⠀↑ - 3 time
⠀↟ - 5 times
⠀⇈ - 10 times
Above the candle, the following basic statistics can be shown:
"V:" - Row with volume statistics:
⠀∑ - Total volume ,
⠀Δ - Difference between Up and Down Volume .
⠀min Δ - The smallest difference between Up and Down Volume in that candle
⠀max Δ - the biggest difference between Up and Down Volume in that candle
Script settings:
Slot height = 10^ - Price slot height on the chart, recorded as a power of 10, which means:
⠀ 0 - 1$
⠀ 1 - 10$
⠀ 2 - 100$
⠀ 3 - 1000$
⠀-1 - 0.1$
⠀-2 - 0.01$
⠀-3 - 0.001$
Data precision - One of 6 standard levels of data precision: ▉▇▆▅▃▁, where ▉ means the highest precision and ▁ the lowest available precision and two special values "W" and "M" dedicated for biggest intervals. The highest precision should be available for 15-minute chart, but for a 1D chart, it may hit TradingView limitations and the script will not be launched by the platform with error: "'The study references too many candles in history'". The general recommendation is to use the highest available precision for a given instrument and interval.
Precise warnings - An option to show warnings about missing volume in candle footprint (warning connected with one of TradingView limitations).
Text - Picking what king of info is on label:
⠀- - Hidden
⠀V - Total slot Volume
⠀V% - Slot volume as % of Candle volume
⠀UD - Up and Down volume
⠀UDI - Up and Down volume + Imbalance symbols.
⠀Δ - Delta
⠀Δ% - Delta as percent of slot volume
Centered - If checked volume labels are stick to candle (centered), if not they are alligned to right.
Border, Background:
⠀- - Hidden
⠀C - Color1
⠀POC - Slot with biggest volume
⠀V - Slot volume compared to other slots in that candle
⠀VA - Value area, highlights the slots forming the value area
⠀Δ - Delta is the slot, color1 is used when volume Up is at least 10% bigger, color2 is used when Volume Down is at least 10% bigger
Filter - Filtering option than allow hinding labels with small values:
⠀0 - filter turned off.
⠀1-5 - filtering with transparency
⠀6-10 - Filtering with hiding values
Show zeros - Option to show zeros or leave empty spaces
Draw candles - Option to draw candles that fit the volume labels, and 2 fields to choose the color of up and down candles. It is recommended to hide chart candles and use candles adapted to the footprint chart. TradingView has a bug and candles are drawn under the slots. If you choose a non-transparent background or border, they may be invisible. If possible (free accounts have a limit of 3 scripts), it is recommended to use Volume Footprint Candles script to draw thin candles over the slots.
Show stats - Showing stats over the candle: ∑, Δ, min Δ, max Δ. It's recommended to use 'Volume Footprint Statistics' script instead
Font size - Used to draw stats over the chart: T(iny), S(mall), N(ormal), L(arge)
Instrument and Volume status - A dialog showing basic chart information: Instrument type, Volume type, Smallest change, slot height.
Value area - Value area is the smallest group set of neighboring slots that have at least n(param) % of candle volume.
⠀ Value Area Minimal Volume (%) - Value area size as % of candle volume
⠀ Track - Option to track value areas, potencial support-resistance zones.
⠀ Only active - Option to hide areas that were crossed by the price.
⠀ Show Values - Opiton to show volume value over tracked value areas.
Alerts:
⠀ One alert per Bar - Emits no more than one alert per bar.
⠀ Add value area to tracking - Emits an alert about a new VA beeing added to the tracking list.
⠀ Remove value area from tracking - Emits an alert when a VA is removed from the tracking list.
Troubleshooting:
In case of any problems, please send error details to the author of the script.
Known issues:
"The study references too many candles in history" - If you encounter this issue, try changing "Data precision" setting to a lower value.

PriceCatch Forex Crypto Screener FHi,
TradingView community and Forex & Crypto traders. Warm Greetings.
PriceCatch Forex Crypto Screener Free Version.
I am sharing a script that screens Forex pairs, XAGUSD, XAUUSD, BTCUSD and ETHUSD for Probable Breakout signals. This script may prove to be useful to traders who trade in the above instruments.
Once this script is added to your chart and the resolution is set, it will automatically keep watching for any breakout on the above instruments and display the results on chart for your attention.
I have already shared the script "PriceCatch-Signals Buy Signals" that marks the following levels on the chart.
Probable Breakout Buy Level
Stop-Reverse Buy Level
While the script "PriceCatch-Signals Buy Signals" can be used independently on all instruments like stocks, Forex, Crypto, commodities etc., this script is intended to be used with the script "PriceCatch-Signals Buy Signals".
Used together, these two scripts may help you identify probable breakout opportunities. This Screener will help you screen the above instruments that have broken out of any of the Breakout levels marked by the "PriceCatch-Signals Buy Signals" script. This way you can quickly and automatically identify breakouts or anticipate them on your favorite Forex pair without manually going through your watchlist searching for breakout opportunities.
Please read the Notes of the script "PriceCatch-Signals Buy Signals" for explanation of its functionality.
FREE VERSION FOREX SET
This Free Forex screener scans a list of 11 Pairs and 2 Crypto (BTCUSD and ETHUSD). This should be enough for most traders. The full version scans all major Forex pairs and more Cryptocurrencies.
Chart resolution vs. Script resolution
It is suggested to set the chart resolution to a lower time-frame than the Screener resolution. For example, if the screener resolution is set to 1 Hour time-frame, set the chart resolution to less than 1 Hour time-frame and run the Screener.
CHART
The Screener runs independently of any symbol displayed on your chart.
NOTE - PRIOR TO USING THIS SCRIPT:
Please remember that the script is shared with absolutely no assurances about usability and any warranties whatsoever and as a responsible trader, please satisfy yourselves thoroughly and use it only if you are convinced it works for you. Remember, you are 100% responsible for your actions. If you understand and accept that, you may use the script.
QUERIES/FEEDBACK
Please PM me or leave comments.
Regards to all and wish everyone all the best with trading.
PriceCatch Malaysia MYX Stocks Screener FHi,
Tradingview community and Malaysian MYX Traders. Warm Greetings.
Malaysia MYX Stocks Screener
I am sharing a script that screens Malaysia MYX stocks for Probable Breakout Buy signal and Stop-Reverse Buy Signal. This script may prove to be useful to traders who trade Malaysia MYX listed stocks.
I have already shared the script "PriceCatch Signals Buy Signals" that marks the following levels on the chart.
Probable Breakout Buy Level
Stop-Reverse Buy Level
While the script "PriceCatch Signals Buy Signals" can be used independently, this script is intended to be used with the script "PriceCatch Signals Buy Signals".
Used together, these two scripts may help you identify probable buy opportunities. The purpose of this script is to help screen stocks quickly without manually going through every stock in your watch list.
Please read the Notes of the script "PriceCatch Signals Buy Signals" for explanation of its functionality.
Stock Set
This Free screener scans a list of 20 stocks. The full version scans a list of 60 stocks. The stocks list will be regularly updated. Care has been taken to include liquid stocks. MYX traders may suggest liquid stocks for inclusion in full version.
Chart resolution vs. Script resolution
I have noticed that if the chart resolution is set to 15 minutes time-frame and the screener resolution is selected as 2 Hours, then the results are correct. However, if the screener resolution is set to 5 minutes, then the results are not accurate. This is not an issue with script. So scanning higher time-frames from a lower time-frame chart works better. My advice however, is better to set the chart resolution to the same interval as screener resolution for sure results.
As usual with price action, longer time-frames produce more reliable signals.
CHART
You can have any stock on your chart, while the screener is scanning the stocks independently. In the above image, chart is set to 45 minutes time frame and stock is ABMB, however screener is screening stocks in 120 minutes time frame and has found GTRONIC.
NOTE - PRIOR TO USING THIS SCRIPT:
Please remember that the script is shared with absolutely no assurances about usability and any warranties whatsoever and as a responsible trader, please satisfy yourselves thoroughly and use it only if you are satisfied it works for you. Remember, you are 100% responsible for your actions. If you understand and accept that, you may use the script.
QUERIES/FEEDBACK
Please PM me.
Regards to all and wish everyone all the best with trading.
PriceCatch - EuronextParis-Stocks screenerHi,
Tradingview community. Warm Greetings.
EuronextParis Stocks Screener
I am sharing a script that screens Euronext Paris stocks for Probable Breakout Buy signal and Stop-Reverse Buy Signal. This script may prove to be useful to traders who trade Euronext Paris listed stocks.
I have already shared the script "PriceCatch-Signals - Buy Signals" that marks the following levels on the chart.
Probable Breakout Buy Level
Stop-Reverse Buy Level
While the script "PriceCatch-Signals - Buy Signals" can be used independently, this script is intended to be used with the script "PriceCatch-Signals - Buy Signals".
Used together, these two scripts may help you identify probable buy opportunities. The purpose of this script is to help screen stocks quickly without manually going through every stock in your watchlist.
Please read the Notes of the script "PriceCatch-Signals - Buy Signals" for explanation of its functionality.
Stock Set
As Tradingview limits the number of security function calls, to get around, you have to select Set1 to screen first set of 25 stocks and then select Set2 to screen next set of 25 stocks.
Chart resolution vs. Script resolution
I have noticed that if the chart resolution is set to 15 minutes timeframe and the screener resolution is selected as 2 Hours, then the results are correct. However, if the screener resolution is set to 5 minutes, then the results are not accurate. This is not an issue with script. So scanning higher timeframes from a lower timeframe chart works better. My advice however, is better to set the chart resolution to the same interval as screener resolution for sure results.
As usual with price action, longer time-frames produce more reliable signals.
SOME CHARTS
Chart set to Daily timeframe and shows Derichebourg stock. Screener shows a Stop-Reverse Buy Opportunity on GET.
Example 2
Chart set to 30 min. timeframe and shows Derichebourg stock. Screener shows a Stop-Reverse Buy Opportunity on VIV.
NOTE - PRIOR TO USING THIS SCRIPT:
Please remember that the script is shared with absolutely no assurances about usability and any warranties whatsoever and as a responsible trader, please satisfy yourselves thoroughly and use it only if you are satisfied it works for you. Remember, you are 100% responsible for your actions. If you understand and accept that, you may use the script.
QUERIES/FEEDBACK
Please PM me.
Regards to all and wish everyone all the best with trading.

Blue Dot Pullback with Bollinger BonusKey FeaturesCore Blue Dot Condition:ATH Pulse: Checks if the highest high in the lookback period (default: 60 bars) is within 1% of the all-time high (over 5000 bars), using recentHigh >= allTimeHigh * 0.99.
Pullback: Price must be below the recent high (close < recentHigh ) but above a 10-period SMA (close > sma10) to ensure a bullish context.
Stochastic Crossover: Stochastic %K must cross above 20 (ta.crossover(k, stochOverSold)).
When these conditions are met, a blue dot is plotted below the bar.
Purple Dot Condition (Bollinger Band Bonus):Includes all blue dot conditions plus the price being within 2% of the lower Bollinger Band (close <= lowerBB * bbProximity).
When met, a purple dot is plotted instead of a blue dot to highlight the stronger signal.
Plotting Logic:Blue dots are plotted only when blueDotCondition is true and purpleDotCondition is false to avoid overlap.
Purple dots are plotted when purpleDotCondition is true (includes Bollinger Band proximity).
Alerts:Added separate alertcondition calls for blue and purple dots, allowing you to set up notifications in TradingView for each signal type.
Visualization:Stochastic %K and %D are plotted in a separate pane for reference, along with the oversold line (20).
You can disable the Stochastic plot by setting display=display.none in the plot functions.
Why This Should WorkCore Setup Alignment: The blue dot condition focuses on the core requirements (ATH, pullback, Stochastic crossover), which should produce signals similar to or more frequently than the ChatGPT script, as it omits the Bollinger Band requirement unless the purple dot condition is met.
Bollinger Band Bonus: The purple dot incorporates the Bollinger Band proximity check (bbNear), matching the ChatGPT script’s additional filter, ensuring purple dots appear when the price is near the lower Bollinger Band.
Flexible ATH Detection: Using recentHigh >= allTimeHigh * 0.99 makes the ATH condition less strict, increasing the likelihood of signals compared to my original script.
How to UseAdd to TradingView:Open the Pine Editor in TradingView.
Copy and paste the script.
Click "Add to Chart" to apply it.
Interpret Dots:Blue Dot: Indicates a stock near an ATH, in a pullback (above 10-period SMA), with a Stochastic crossover above 20. This is the core Dr. Wish setup.
Purple Dot: Same as blue dot but with the price also within 2% of the lower Bollinger Band, suggesting a stronger pullback signal.
Test and Compare:Apply the script to the same stock and timeframe where the ChatGPT script showed blue dots (e.g., NVDA or TSLA on a daily chart).
Check if blue dots appear at similar points and if purple dots appear when the price is near the lower Bollinger Band.
Adjust lookbackATH (e.g., 60 to 100) or bbProximity (e.g., 1.02 to 1.05) if signals are too rare or frequent.
Set Alerts:Use TradingView’s alert feature to create notifications for “Blue Dot Alert” or “Purple Dot Alert” when signals occur.
TroubleshootingIf you’re still not seeing blue or purple dots:Check the Chart: Ensure the stock has recently hit an ATH and pulled back. Test on volatile stocks like NVDA, TSLA, or AAPL on daily or weekly timeframes.
Timeframe Sensitivity: The script may produce fewer signals on lower timeframes (e.g., 1-hour) due to fewer ATH occurrences. Try a daily or weekly chart.
Parameter Tuning: Increase bbProximity (e.g., to 1.05) to allow purple dots for prices slightly further from the lower Bollinger Band, or increase lookbackATH to capture more ATHs.
Compare with ChatGPT Script: Run both scripts on the same chart to identify where signals differ. Share the ticker, timeframe, or a screenshot if you need help debugging specific cases.
Additional NotesThe 10-period SMA in the pullback condition (isPullback) is a simple bullish context filter. You can replace it with another condition (e.g., 20-period SMA or trend filter) if preferred.
The Bollinger Band parameters (bbLength=20, bbMult=2.0) are standard but can be adjusted to match your trading style.
The script uses a 5000-bar lookback for allTimeHigh to approximate a true ATH. If your chart has limited historical data, reduce this value (e.g., to 1000).

PSESS1 - Learn PineScript InputsThis is a script written exclusively for people who are trying to learn Pine Script.
PSESS stands for "Pine Script Educational Script Series" which is a series of scripts that helps Pine Script programmers in 2 ways:
1. Learn Pine Script at more depth by an interactive environment where they can immediately see the effects of any change in the pre-written code and also comparing different lines code having tiny differences so they can grasp the details.
2. Have this script open while coding in order to copy the line they find useful
Pine Script Library couldn't be used for this purpose since this script has educational aspect and needs to be executable individually.
This is Script 1 of PSESS and focuses on inputs in Pine Script.
The script is densly commented in order to make it understandable. here is the outline of the script:
1. Inputs that can be received through the indicator() function
2. 12 possible types of input
3. Input() function arguments: defval - title - tooltip - inline - group - confirm
4. The different display of tooltip when inputs are inline
5. Multiple price and time inputs (on single request or multiple requests)
6. What happens when title argument is not specified
7. References and key points from them
