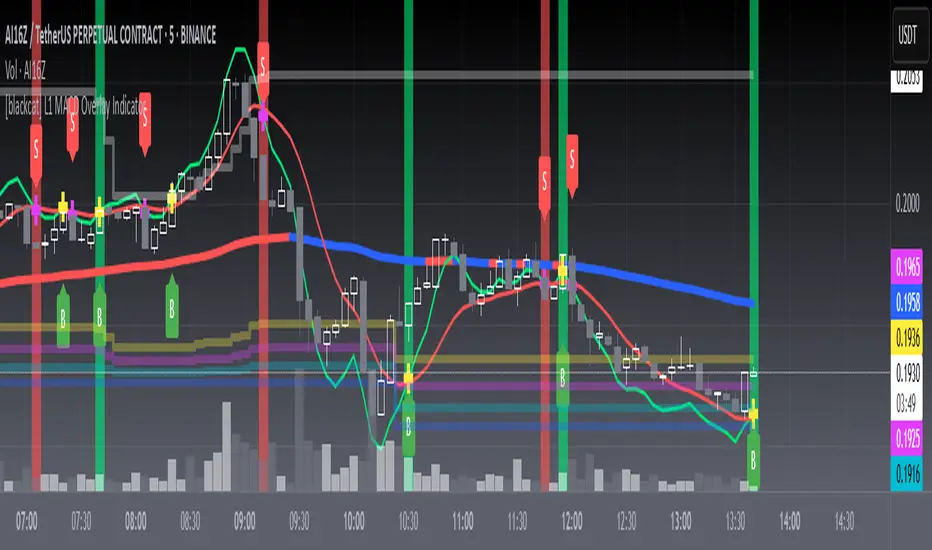
L1 MACD Overlay IndicatorLevel: 1
Background
MACD is a measure of changes in the dynamics between short-term and longer-term price averages. The sign (positive or negative) and the size or MACD line represent the interaction between the two underlying EMAs.
Function
L1 MACD Overlay Indicator is a MACD indicator for main chart. The lime and red color EMAs are the DIFF and DEA signal. I want to plot a contant "Zero Line" line in main chart but failed. So, I use dyanmic color bands to inidcate the "Zero line" in traditioanl MACD. It is not static but a dynamic one.
Key Signal
wdiff --> MACD DIFF
wdea --> MACD DEA
th191 --> zero line
th886 --> zero line
th946 --> zero line
bot --> zero line
Pros and Cons
Pros:
1. main chart MACD
2. easier observation with candles
Cons:
1. I cannot draw static zero line in main chart with PINE, so I draw dyanmic "Zero"
2. No diff-dea histograms
Remarks
I cannot draw static zero line in main chart with PINE, so I draw dyanmic "Zero"
Readme
In real life, I am a prolific inventor. I have successfully applied for more than 60 international and regional patents in the past 12 years. But in the past two years or so, I have tried to transfer my creativity to the development of trading strategies. Tradingview is the ideal platform for me. I am selecting and contributing some of the hundreds of scripts to publish in Tradingview community. Welcome everyone to interact with me to discuss these interesting pine scripts.
The scripts posted are categorized into 5 levels according to my efforts or manhours put into these works.
Level 1 : interesting script snippets or distinctive improvement from classic indicators or strategy. Level 1 scripts can usually appear in more complex indicators as a function module or element.
Level 2 : composite indicator/strategy. By selecting or combining several independent or dependent functions or sub indicators in proper way, the composite script exhibits a resonance phenomenon which can filter out noise or fake trading signal to enhance trading confidence level.
Level 3 : comprehensive indicator/strategy. They are simple trading systems based on my strategies. They are commonly containing several or all of entry signal, close signal, stop loss, take profit, re-entry, risk management, and position sizing techniques. Even some interesting fundamental and mass psychological aspects are incorporated.
Level 4 : script snippets or functions that do not disclose source code. Interesting element that can reveal market laws and work as raw material for indicators and strategies. If you find Level 1~2 scripts are helpful, Level 4 is a private version that took me far more efforts to develop.
Level 5 : indicator/strategy that do not disclose source code. private version of Level 3 script with my accumulated script processing skills or a large number of custom functions. I had a private function library built in past two years. Level 5 scripts use many of them to achieve private trading strategy.
在腳本中搜尋"the script"
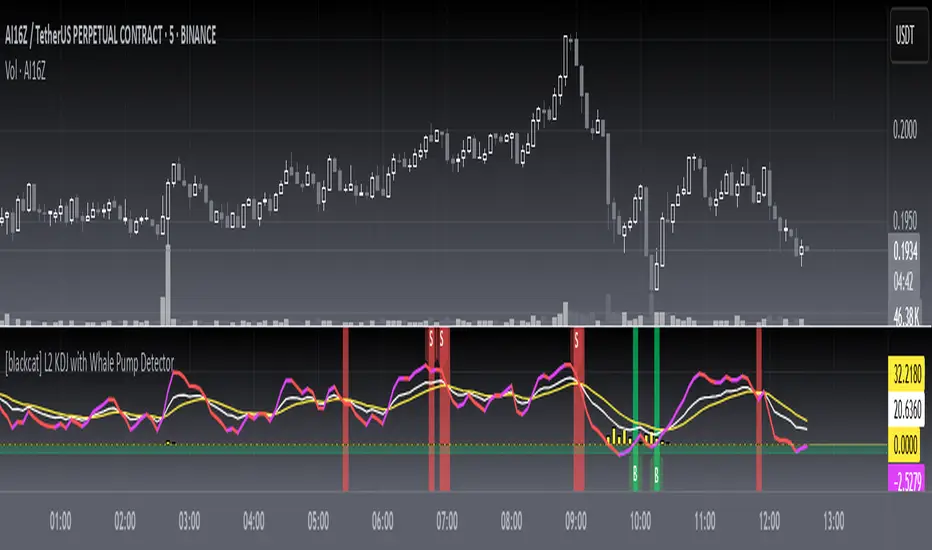
L2 KDJ with Whale Pump DetectorLevel: 2
Background
One of the biggest differences between cryptocurrency and traditional financial markets is that cryptocurrency is based on blockchain technology. Individual investors can discover the direction of the flow of large funds through on-chain transfers. These large funds are often referred to as Whale. Whale can have a significant impact on the price movements of cryptocurrencies, especially Bitcoin . Therefore, how to monitor Whale trends is of great significance both in terms of fundamentals and technical aspects.
The KDJ oscillator display consists of 3 lines (K, D and J - hence the name of the display) and 2 levels. K and D are the same lines you see when using the stochastic oscillator. The J line in turn represents the deviation of the D value from the K value. The convergence of these lines indicates new trading opportunities. Just like the Stochastic Oscillator, oversold and overbought levels correspond to the times when the trend is likely to reverse.
Function
L2 KDJ with Whale Pump Detector is a composite indicator that combines both KDJ and Whale Pump Detector. By virtue of this, fake signal of KDJ can be filtered out to some degree.
Key Signal
whalepump --> whale buy behavior will be detected and displayed in yellow histograms
k --> k value of a stochastic oscillator
d --> d value of a stochastic oscillator
j --> the deviation of the d value from the d value of a stochastic oscillator
Pros and Cons
Pros:
1. filter out KDJ fake signal by introducing whale buy/pump detector
2. J value can be used to detect overbought and oversold regions
Cons:
1. It works better in small time frame and sideways. Extreme long or short conditions may cause KDJ staturate.
2. It can only indicate in current time frame, larger time frame trend info is missing.
Remarks
Composite KDJ+Whale Pump Detector. Works fine in 15mins time frame.
Readme
In real life, I am a prolific inventor. I have successfully applied for more than 60 international and regional patents in the past 12 years. But in the past two years or so, I have tried to transfer my creativity to the development of trading strategies. Tradingview is the ideal platform for me. I am selecting and contributing some of the hundreds of scripts to publish in Tradingview community. Welcome everyone to interact with me to discuss these interesting pine scripts.
The scripts posted are categorized into 5 levels according to my efforts or manhours put into these works.
Level 1 : interesting script snippets or distinctive improvement from classic indicators or strategy. Level 1 scripts can usually appear in more complex indicators as a function module or element.
Level 2 : composite indicator/strategy. By selecting or combining several independent or dependent functions or sub indicators in proper way, the composite script exhibits a resonance phenomenon which can filter out noise or fake trading signal to enhance trading confidence level.
Level 3 : comprehensive indicator/strategy. They are simple trading systems based on my strategies. They are commonly containing several or all of entry signal, close signal, stop loss, take profit, re-entry, risk management, and position sizing techniques. Even some interesting fundamental and mass psychological aspects are incorporated.
Level 4 : script snippets or functions that do not disclose source code. Interesting element that can reveal market laws and work as raw material for indicators and strategies. If you find Level 1~2 scripts are helpful, Level 4 is a private version that took me far more efforts to develop.
Level 5 : indicator/strategy that do not disclose source code. private version of Level 3 script with my accumulated script processing skills or a large number of custom functions. I had a private function library built in past two years. Level 5 scripts use many of them to achieve private trading strategy.
L1 Composite RSI-William%R IndicatorLevel: 1
Background
The Relative Strength Index (RSI) developed by J. Welles Wilder is a pulse oscillator that measures the speed and change in price movements. The RSI hovers between zero and 100. Traditionally, the RSI is considered overbought when it is above 70 and oversold when it is below 30. Signals can be generated by looking for divergences and error fluctuations. RSI can also be used to identify the general trend.
Williams% R, also known as the Williams Percent Range, is a type of momentum indicator that moves between 0 and -100 and measures overbought and oversold levels. The Williams% R can be used to find entry and exit points in the market. The indicator is very similar to the stochastic oscillator and is used in the same way.
Function
L1 Composite RSI-William%R Indicator combines both RSI and William%R indicator to indicate long and short entries.
Key Signal
rsi1 --> rsi in white
wr1 --> William%R in yellow
bull --> long entry in lime
Pros and Cons
Pros:
1. resonance of RSI and William%R will provide better long and short entry signal
2. use 'bull' to indicate a long entry zone
Cons:
1. It is sensitive to fluctuations
2. More independent long and short entries should be considered
Remarks
Composite RSI+William%R
Readme
In real life, I am a prolific inventor. I have successfully applied for more than 60 international and regional patents in the past 12 years. But in the past two years or so, I have tried to transfer my creativity to the development of trading strategies. Tradingview is the ideal platform for me. I am selecting and contributing some of the hundreds of scripts to publish in Tradingview community. Welcome everyone to interact with me to discuss these interesting pine scripts.
The scripts posted are categorized into 5 levels according to my efforts or manhours put into these works.
Level 1 : interesting script snippets or distinctive improvement from classic indicators or strategy. Level 1 scripts can usually appear in more complex indicators as a function module or element.
Level 2 : composite indicator/strategy. By selecting or combining several independent or dependent functions or sub indicators in proper way, the composite script exhibits a resonance phenomenon which can filter out noise or fake trading signal to enhance trading confidence level.
Level 3 : comprehensive indicator/strategy. They are simple trading systems based on my strategies. They are commonly containing several or all of entry signal, close signal, stop loss, take profit, re-entry, risk management, and position sizing techniques. Even some interesting fundamental and mass psychological aspects are incorporated.
Level 4 : script snippets or functions that do not disclose source code. Interesting element that can reveal market laws and work as raw material for indicators and strategies. If you find Level 1~2 scripts are helpful, Level 4 is a private version that took me far more efforts to develop.
Level 5 : indicator/strategy that do not disclose source code. private version of Level 3 script with my accumulated script processing skills or a large number of custom functions. I had a private function library built in past two years. Level 5 scripts use many of them to achieve private trading strategy.

L1 Mid-Term Swing Oscillator v1Level: 1
Background
Oscillators are widely used set of technical analysis indicators. They are popular primarily for their ability to alert of a possible trend change before that change manifests itself in price and volume . They should work best in times of sideways markets.
Function
L1 Short-Mid-Long-Term Swing Oscillator puts three terms of oscillators to cover short-term, middle-term and long-term oscillators at the same time. By resonating all these three oscillators, short-term scalping signal and middle term swing signal are disclosed. You can see both short and mid term signal under one indicator which give you more confidence to follow the trend.
Key Signal
I didn't handle the key signals well. I piled up all the useful signals I found, and it is really difficult to classify them one by one. I feel tired when I think about this problem. Therefore, the code of the overall signal is rather confusing, sorry.
Pros and Cons
Pros:
1. Three oscillators are used to cover short, mid, long term oscillations.
2. Short-Mid term resonance can be observed to have higher confidence level.
3. Use single indicator for scalping and swing trading is possible.
Cons:
1. No deep dive into very accurate long and short entries.
2. A trade off between sensitivity and stability may be needed by traders' subjective judge.
Remarks
I enjoyed the fun of put three different oscillator together to cover short, mid, long terms. But how to use them perfectly is really more brainstorming.
Readme
In real life, I am a prolific inventor. I have successfully applied for more than 60 international and regional patents in the past 12 years. But in the past two years or so, I have tried to transfer my creativity to the development of trading strategies. Tradingview is the ideal platform for me. I am selecting and contributing some of the hundreds of scripts to publish in Tradingview community. Welcome everyone to interact with me to discuss these interesting pine scripts.
The scripts posted are categorized into 5 levels according to my efforts or manhours put into these works.
Level 1 : interesting script snippets or distinctive improvement from classic indicators or strategy. Level 1 scripts can usually appear in more complex indicators as a function module or element.
Level 2 : composite indicator/strategy. By selecting or combining several independent or dependent functions or sub indicators in proper way, the composite script exhibits a resonance phenomenon which can filter out noise or fake trading signal to enhance trading confidence level.
Level 3 : comprehensive indicator/strategy. They are simple trading systems based on my strategies. They are commonly containing several or all of entry signal, close signal, stop loss, take profit, re-entry, risk management, and position sizing techniques. Even some interesting fundamental and mass psychological aspects are incorporated.
Level 4 : script snippets or functions that do not disclose source code. Interesting element that can reveal market laws and work as raw material for indicators and strategies. If you find Level 1~2 scripts are helpful, Level 4 is a private version that took me far more efforts to develop.
Level 5 : indicator/strategy that do not disclose source code. private version of Level 3 script with my accumulated script processing skills or a large number of custom functions. I had a private function library built in past two years. Level 5 scripts use many of them to achieve private trading strategy.

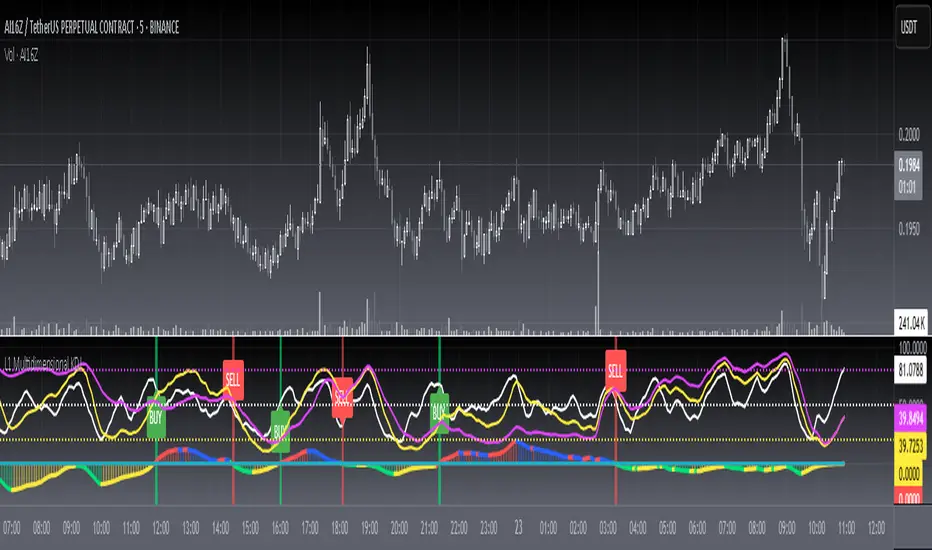
L1 Multidimensional KDJLevel: 1
Background
The KDJ oscillator display consists of 3 lines (K, D and J - hence the name of the display) and 2 levels. K and D are the same lines you see when using the stochastic oscillator. The J line in turn represents the deviation of the D value from the K value. The convergence of these lines indicates new trading opportunities. Just like the Stochastic Oscillator, oversold and overbought levels correspond to the times when the trend is likely to reverse.
Function
L1 Multidimensional KDJ utilizes multiple KDJ modeling across multiple time frames. In this instance, it covers three time frames as day, week and month. Although it is named like that, one can deduce and use it in small time frames e.g. 15mins (day), 60mins (week) and 4H (month) because KDJ oscillator is commonly used for small time frames across various markets.
Key Signal
kd --> day K value
kw --> week K value
km --> month K value
dd --> day D value
dw --> week D value
dm --> month D value
divergence --> divergence among day, week, month D values
resonance --> all three time frame D values are in the same direction
Pros and Cons
Pros:
1. Enable multidimensional KDJ,especially D value comparisons
2. divergence and resoanance among different time frame KDJ can be disclosed
Cons:
1. It may satruate for extreme conditions of long and short.
2. Not accurate for long and short entries by resonance effect.
Remarks
Bring about multiple time frames into consideration of KDJ is novel.
Readme
In real life, I am a prolific inventor. I have successfully applied for more than 60 international and regional patents in the past 12 years. But in the past two years or so, I have tried to transfer my creativity to the development of trading strategies. Tradingview is the ideal platform for me. I am selecting and contributing some of the hundreds of scripts to publish in Tradingview community. Welcome everyone to interact with me to discuss these interesting pine scripts.
The scripts posted are categorized into 5 levels according to my efforts or manhours put into these works.
Level 1 : interesting script snippets or distinctive improvement from classic indicators or strategy. Level 1 scripts can usually appear in more complex indicators as a function module or element.
Level 2 : composite indicator/strategy. By selecting or combining several independent or dependent functions or sub indicators in proper way, the composite script exhibits a resonance phenomenon which can filter out noise or fake trading signal to enhance trading confidence level.
Level 3 : comprehensive indicator/strategy. They are simple trading systems based on my strategies. They are commonly containing several or all of entry signal, close signal, stop loss, take profit, re-entry, risk management, and position sizing techniques. Even some interesting fundamental and mass psychological aspects are incorporated.
Level 4 : script snippets or functions that do not disclose source code. Interesting element that can reveal market laws and work as raw material for indicators and strategies. If you find Level 1~2 scripts are helpful, Level 4 is a private version that took me far more efforts to develop.
Level 5 : indicator/strategy that do not disclose source code. private version of Level 3 script with my accumulated script processing skills or a large number of custom functions. I had a private function library built in past two years. Level 5 scripts use many of them to achieve private trading strategy.
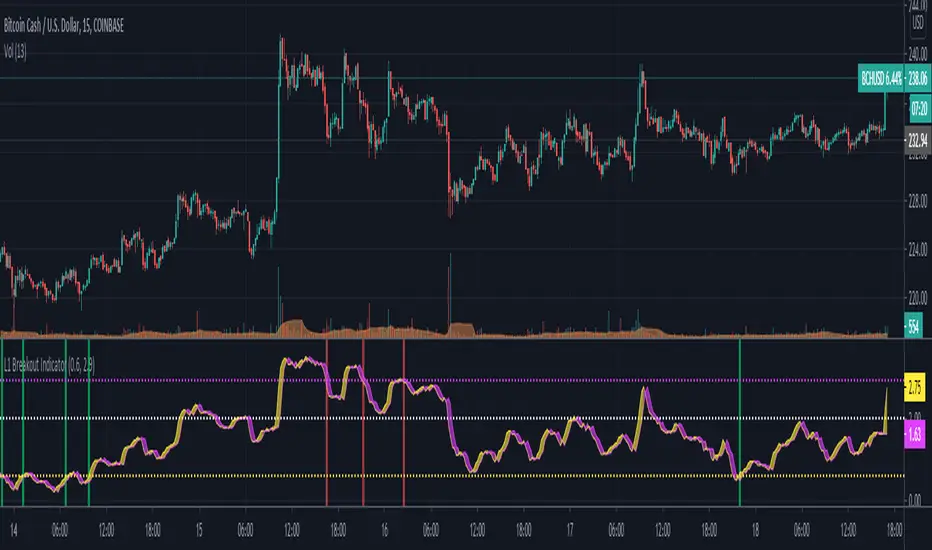
L1 Breakout IndicatorLevel: 1
Background
A breakout refers to when the price of an asset moves above a resistance area or below a support area. Breakouts indicate that the price may be trending in the direction of the breakout.
Function
L1 Breakout Indicator utilizes highest() and lowest() functions to define breakout levels. Use ema() to draw a trade line to detect the distance to breakout points. By doing that, you will know whether is overbought or oversold. Then, by applying a set of simple threshold inputs, you can locate the long and short entries points.
Key Signal
trade line and its lag version
Pros and Cons
Pros:
1. Simple but powerful to know overbought and oversold regions
2. Flexible input threshold values to adapt various market conditions
Cons:
1. It may satruate for extreme conditions of long and short.
2. Multiple long and short entries may be generated.
Remarks
Just simple
Readme
In real life, I am a prolific inventor. I have successfully applied for more than 60 international and regional patents in the past 12 years. But in the past two years or so, I have tried to transfer my creativity to the development of trading strategies. Tradingview is the ideal platform for me. I am selecting and contributing some of the hundreds of scripts to publish in Tradingview community. Welcome everyone to interact with me to discuss these interesting pine scripts.
The scripts posted are categorized into 5 levels according to my efforts or manhours put into these works.
Level 1 : interesting script snippets or distinctive improvement from classic indicators or strategy. Level 1 scripts can usually appear in more complex indicators as a function module or element.
Level 2 : composite indicator/strategy. By selecting or combining several independent or dependent functions or sub indicators in proper way, the composite script exhibits a resonance phenomenon which can filter out noise or fake trading signal to enhance trading confidence level.
Level 3 : comprehensive indicator/strategy. They are simple trading systems based on my strategies. They are commonly containing several or all of entry signal, close signal, stop loss, take profit, re-entry, risk management, and position sizing techniques. Even some interesting fundamental and mass psychological aspects are incorporated.
Level 4 : script snippets or functions that do not disclose source code. Interesting element that can reveal market laws and work as raw material for indicators and strategies. If you find Level 1~2 scripts are helpful, Level 4 is a private version that took me far more efforts to develop.
Level 5 : indicator/strategy that do not disclose source code. private version of Level 3 script with my accumulated script processing skills or a large number of custom functions. I had a private function library built in past two years. Level 5 scripts use many of them to achieve private trading strategy.
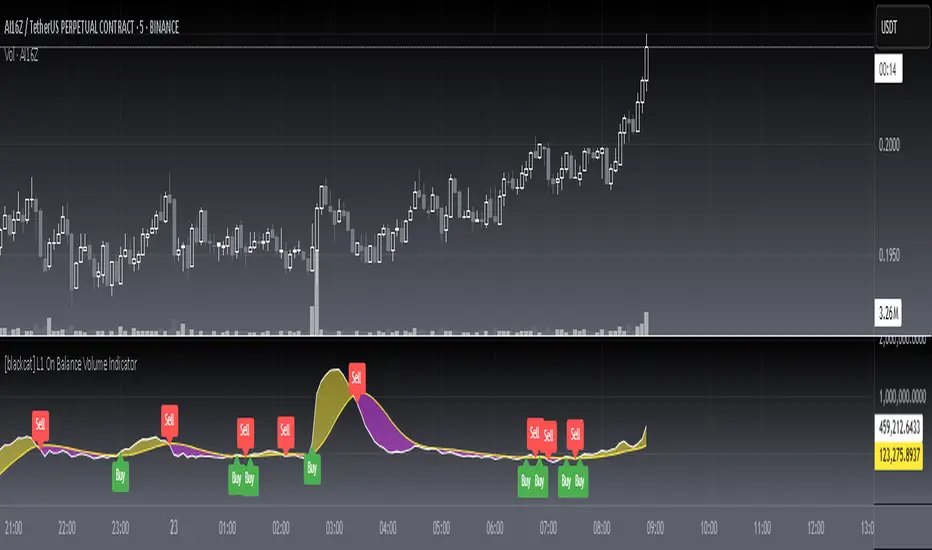
L1 On Balance Volume IndicatorLevel: 1
Background
On Balance Volume (OBV) is a simple indicator that uses volume and price to measure buying and selling pressure. The buying pressure is evident when the positive volume exceeds the negative volume and the OBV line rises.
Function
L1 On Balance Volume Indicator is a simple but improved OBV by using alma and more input parameters
Key Signal
OBV and its ALMA
Pros and Cons
Pros:
1. More freedom to tune with more input parameters
2. ALMA can make better tradeoff between response and smooth
Cons:
1. No details of volume generation can be disclosed
2. It may help to judge trend but not the short-term price movements.
Remarks
NA
Readme
In real life, I am a prolific inventor. I have successfully applied for more than 60 international and regional patents in the past 12 years. But in the past two years or so, I have tried to transfer my creativity to the development of trading strategies. Tradingview is the ideal platform for me. I am selecting and contributing some of the hundreds of scripts to publish in Tradingview community. Welcome everyone to interact with me to discuss these interesting pine scripts.
The scripts posted are categorized into 5 levels according to my efforts or manhours put into these works.
Level 1 : interesting script snippets or distinctive improvement from classic indicators or strategy. Level 1 scripts can usually appear in more complex indicators as a function module or element.
Level 2 : composite indicator/strategy. By selecting or combining several independent or dependent functions or sub indicators in proper way, the composite script exhibits a resonance phenomenon which can filter out noise or fake trading signal to enhance trading confidence level.
Level 3 : comprehensive indicator/strategy. They are simple trading systems based on my strategies. They are commonly containing several or all of entry signal, close signal, stop loss, take profit, re-entry, risk management, and position sizing techniques. Even some interesting fundamental and mass psychological aspects are incorporated.
Level 4 : script snippets or functions that do not disclose source code. Interesting element that can reveal market laws and work as raw material for indicators and strategies. If you find Level 1~2 scripts are helpful, Level 4 is a private version that took me far more efforts to develop.
Level 5 : indicator/strategy that do not disclose source code. private version of Level 3 script with my accumulated script processing skills or a large number of custom functions. I had a private function library built in past two years. Level 5 scripts use many of them to achieve private trading strategy.
EasyBee59 v1.0EasyBee59 v1.0 for TradingView does tedious CC59 counting for you automatically in your investment chart. It then creates respectable support and resistance levels based on CC59 counting results as well as marks and reminds you about important parameters that are happening so that you would not forget to consider them before placing trade orders. The events occur in the chart can be set to send server-side alerts to your smart phone so that you don't have to stay in front of the screen all the time.
=================================================================================================
The source code of EasyBee59 v1.0 for TradingView is protected. Only invited TradingView members can access and use this script.
Lifetime invitation to use it is for 100 USD with free future upgrades and online supports. Paypal, bank transfer and bitcoin payments are welcome.
For more informaton please contact the author (DrGraph or Nimit Chomnawang, PhD) via TradingView private chat
or in the comment field below.
=================================================================================================
How to install the script:
------------------------------
*Go to the bottom of this page and click on "Add to Favorite Scripts".
*Remove older version of the script by clicking on the "X" button behind the indicator line at the top left corner of the chart window.
*Open a new chart at and click on the "Indicators" tab.
*Click on the "Favorites" tab and choose "EasyBee59 v1.0".
*Right click anywhere on the graph, choose "Color Theme", the select "Dark".
*Right click anywhere on the graph, choose "Settings".
*In "Symbol" tab, set "Precesion" to 1/100 for stock price or 1/100000 for forex and set "Time Zone" to your local time.
*In "Status line" tab, uncheck "Indicator Arguments" and "Indicator Values".
*In "Events" tab, check "Show Dividends on Chart", "Show Splits on Chart" and "Show Earnings on Chart".
*At the bottom of settings window, click on "Template", "Save As...", then name this theme of graph setting for future call up such as "DrGraph chart setting".
*Click OK.
For free TradingView plan, you can add two more indicators to the chart. That means you may add Stoch and Vol indicators with same parameters as those setup in EasyBee59 to your graph. DrGraph regularly publishes his educational ideas on using features provided in EasyBee59 for profitable investments. You can follow him for how to use the tools in trading stocks, forex, and crypto currencies.

Global Market Scanner [Armi Goldman]Concept
This indicator is designed to provide a comprehensive "Bird's Eye View" of the global financial economy. Instead of focusing on a single chart, this dashboard allows traders to monitor capital rotation across every major asset class simultaneously. By tracking the Money Flux (daily percentage change) of these markets, users can instantly identify if the market environment is "Risk-On" (flowing into assets) or "Risk-Off" (fleeing to cash/bonds).
Features
The dashboard displays a real-time table in the top-right corner tracking 9 key sectors:
US M2 Money Supply: The broad measure of liquidity availability.
US Dollar (DXY): The global currency baseline.
Global Stocks (VT): World equities performance.
Crypto Market: Total cryptocurrency market capitalization.
Commodities: Gold, Silver, and Crude Oil (WTI).
Real Estate: Vanguard Real Estate ETF (VNQ).
Bonds: US Aggregate Bond Market.
How it Works
The script utilizes request.security() to fetch data from multiple asset classes regardless of the chart you are currently viewing.
Flux Calculation: The "Flux" column calculates the daily percentage change (Close - Open) / Open. This reveals the immediate direction of capital flow for the current session.
M2 Trend: For the Money Supply, the script calculates a 30-day rate of change to determine if the Fed is effectively "Inflating" (adding liquidity) or "Tightening" (removing liquidity).
Status Logic: The status column uses conditional logic to assign readable labels (e.g., "INFLOW" vs "OUTFLOW" or "STRONGER" vs "WEAKER") based on the positive or negative value of the Flux.
How to Use
Risk-On Signal: If Stocks, Crypto, and Real Estate show green "INFLOW" status while the Dollar (DXY) is red, capital is deploying into risk assets.
Flight to Safety: If Gold and Bonds are green while Equities are red, investors may be hedging against fear.
Cash is King: If DXY is strong (Green) and almost all other assets are red, liquidity is drying up and moving into Cash.
Liquidity Watch: Monitor the US M2 Supply. A simplified view is that when M2 is "Inflating," it provides a long-term tailwind for asset prices.
Tickers Used
Liquidity: ECONOMICS:USM2
Currency: TVC:DXY
Equities: AMEX:VT (Total World Stock ETF)
Real Estate: AMEX:VNQ (Vanguard Real Estate)
Bonds: AMEX:AGG
Commodities: TVC:GOLD, TVC:SILVER, TVC:USOIL
Crypto: CRYPTOCAP:TOTAL
Disclaimer This tool is for informational purposes only and does not constitute financial advice.

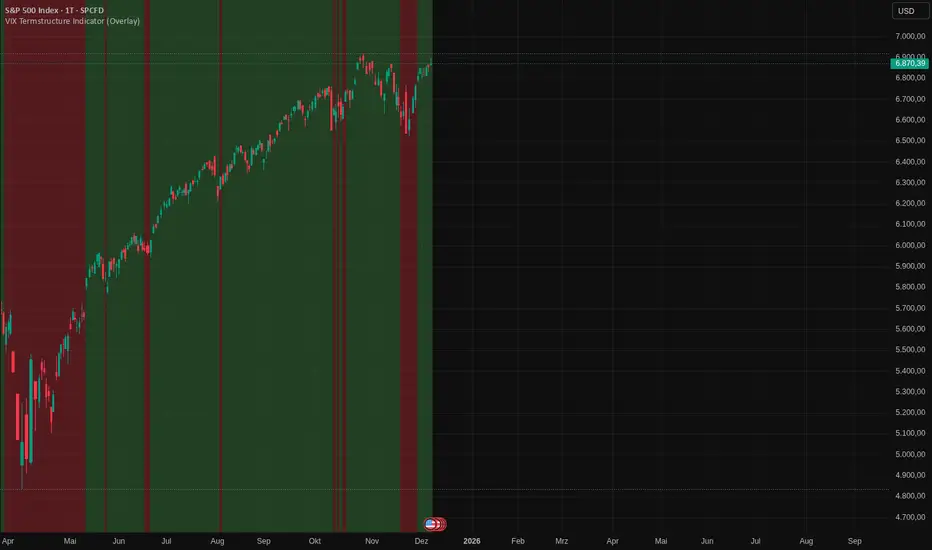
VIX Termstructure Indicator (Overlay)This indicator visualizes the VIX futures term structure directly on your chart background and highlights three key volatility regimes using color coding. It helps identify when the volatility curve is in normal contango, inverted (backwardation), or undergoing a curve flip between the front-month VIX futures.
What the indicator does
The script pulls and compares:
VIX spot index: VIX
Front-month VIX futures: VX1!
Second-month VIX futures: VX2!
All data is requested on the daily timeframe and used to classify the current volatility environment. The indicator then colors the background of your chart according to the detected VIX term structure:
Green background – Contango:
VIX spot is below the front-month futures (VIX < VX1!).
This is typically associated with more “normal” market conditions and lower perceived short-term stress.
Red background – Inverted curve (Backwardation):
VIX spot is above the front-month futures (VIX > VX1!).
This often signals elevated fear, stress, or risk-off conditions in the market.
Yellow background – Curve flip between VX1! and VX2!:
The front-month futures are trading above the second-month futures (VX1! > VX2!).
This can indicate a transition phase in the volatility term structure and may precede or accompany shifts in market sentiment.
How it works
The script fetches the daily close values of VIX, VX1!, and VX2!. It checks whether the front-month futures are above the second-month futures to detect a curve flip. It compares VIX with VX1! to determine if the curve is contango or inverted. Based on these conditions, the chart background is colored with a semi-transparent overlay:
Red has priority when VIX is above VX1! (inverted curve).
If not inverted, yellow is shown when a curve flip VX1! > VX2! is detected.
Otherwise, the background is green (normal contango).
Use cases
This overlay is designed as a context tool for indices, ETFs, Options, or individual stocks that are sensitive to volatility and risk sentiment. Typical applications include:
Identifying periods of heightened risk (red / inverted curve) to adjust position sizing or risk exposure.
Confirming risk-on environments (green / contango) where volatility is more contained.
Monitoring yellow curve-flip phases as potential early warnings of changing volatility regimes.
The indicator does not generate buy/sell signals on its own, but it can be a valuable regime filter or confirmation layer alongside other technical tools.
Notes
This is an overlay indicator: it colors the background of your active chart.
All VIX-related data is evaluated on the daily timeframe, regardless of the chart timeframe.
Make sure that the symbols VIX, VX1!, and VX2! are available on your broker/data feed in TradingView.
6B1! Manipulation/Distribution Projections (OHLC Stats)Overview
The Manipulation/Distribution Projections (OHLC Stats) indicator is a powerful tool designed to forecast potential price levels for various timeframes on British Pound futures (6B1!). It operates on a simple yet profound principle: price action within a single candle can be broken down into “manipulation” and “distribution” phases.
By analyzing over 17 years of 6B (6B1!) historical OHLC data externally in Python, this script calculates the average (mean) and typical (median) extent of these movements. These statistical insights are then used to project key levels on your chart based on the current period’s opening price—providing a statistically-grounded framework for potential support, resistance, and price targets.
________________________________________
Key Concepts Explained
The indicator’s logic is based on how price wicks and bodies form relative to the opening price.
• Manipulation: This refers to the initial move that goes against the candle’s eventual direction.
o For a bullish candle, it’s the lower wick (the move from the open down to the low before reversing higher).
o For a bearish candle, it’s the upper wick (the move from the open up to the high before selling off).
It represents a “fake out” or a stop hunt.
• Distribution: This is the primary, directional move of the candle from the opening price.
o For a bullish candle, it’s the distance from the open to the high.
o For a bearish candle, it’s the distance from the open to the low.
It represents the “real” intended direction of price for that period.
________________________________________
How It Works
This indicator does not calculate these ratios in real-time. Instead, it leverages a comprehensive statistical analysis performed externally in Python on over 17 years of 6B (6B1!) OHLC data. This analysis determined the mean and median ratios for both Manipulation and Distribution movements across different timeframes and, for intraday periods, different times of day.
These pre-computed, static ratios are embedded directly into the script. When a new period begins (e.g., a new day on the Daily timeframe), the indicator:
1. Takes the opening price for that period.
2. Retrieves the corresponding pre-calculated Manipulation and Distribution ratios.
3. Applies these ratios to the opening price to project eight potential price levels:
o
/ - Mean Distribution
o
/ - Median Distribution
o
/ - Mean Manipulation
o
/ - Median Manipulation
This approach provides a stable, forward-looking set of levels for the entire duration of the trading period.
________________________________________
Features
• Statistically-Derived Projections: Plots eight key price levels based on historical tendencies, providing clear potential zones for entries, exits, and stop placement.
• Selectable Timeframe: Choose to view projections for the 1H, 4H, 1D, or 1W periods directly from the settings.
• Dynamic Stats Table: A powerful, on-chart dashboard that provides real-time context. For all four timeframes (1H, 4H, 1D, 1W), it shows:
o Position: Where the current price is relative to the projected zones (e.g., “In +Manip Zone,” “Below -Dist”).
o Range Completed: The percentage of the historical average range that the current period has already covered.
o Current & Average Range: The current high-to-low range in points vs. the historical average.
• Historical Context: You can display levels for previous periods to see how price has interacted with them in the past.
• Full Customization: Control the color, style, and visibility of every line, label, and fill to match your chart’s theme.
________________________________________
How to Use
This indicator is versatile and can be integrated into various trading strategies.
• Identifying Targets & Reversal Zones: The Distribution levels (especially the zone between the median and mean) can serve as logical take-profit targets, as they represent a historical point of extension. Conversely, Manipulation levels can indicate areas where price might form a wick and reverse.
• Gauging Volatility: Use the Stats Table’s “Range Completed” column to assess market conditions. If the 1D range is only 30% complete by mid-day, there may be room for significant expansion. If it’s already at 150%, the market might be overextended and due for consolidation.
• Multi-Timeframe Confluence: Use the Stats Table to quickly check if the price on a lower timeframe (e.g., 1H) is approaching a significant level on a higher timeframe (e.g., 1D), adding more weight to that level.
• Defining Bias: If the price opens and holds above the Manipulation zones, it can signal a strong directional bias for the rest of the period.
________________________________________
Settings
• Projection Timeframe: The primary timeframe for which to calculate and display the levels.
• Historical Periods to Show: Set to 1 for only the current period, or increase to see how levels from past periods held up.
• Timezone: Set the timezone for accurate hourly calculations (defaults to America/New_York).
• Visuals: Customize the appearance of the projection lines, labels, and the shaded zones between mean and median levels.
• Stats Table: Enable/disable the table and configure its position, size, and colors.
________________________________________
Disclaimer
This indicator is for informational and educational purposes only. It does not constitute financial advice or a recommendation to buy or sell any asset. All trading involves risk, and past performance is not indicative of future results. Please do your own research and risk management.
Enjoy!

GC1! Manipulation/Distribution Projections (17 years OHLC Stats)Overview
The Manipulation/Distribution Projections (OHLC Stats) indicator is a powerful tool designed to forecast potential price levels for various timeframes on Gold futures (GC1!). It operates on a simple yet profound principle: price action within a single candle can be broken down into “manipulation” and “distribution” phases.
By analyzing over 17 years of GC (GC1!) historical OHLC data externally in Python, this script calculates the average (mean) and typical (median) extent of these movements. These statistical insights are then used to project key levels on your chart based on the current period’s opening price—providing a statistically-grounded framework for potential support, resistance, and price targets.
________________________________________
Key Concepts Explained
The indicator’s logic is based on how price wicks and bodies form relative to the opening price.
• Manipulation: This refers to the initial move that goes against the candle’s eventual direction.
o For a bullish candle, it’s the lower wick (the move from the open down to the low before reversing higher).
o For a bearish candle, it’s the upper wick (the move from the open up to the high before selling off).
It represents a “fake out” or a stop hunt.
• Distribution: This is the primary, directional move of the candle from the opening price.
o For a bullish candle, it’s the distance from the open to the high.
o For a bearish candle, it’s the distance from the open to the low.
It represents the “real” intended direction of price for that period.
________________________________________
How It Works
This indicator does not calculate these ratios in real-time. Instead, it leverages a comprehensive statistical analysis performed externally in Python on over 17 years of GC (GC1!) OHLC data. This analysis determined the mean and median ratios for both Manipulation and Distribution movements across different timeframes and, for intraday periods, different times of day.
These pre-computed, static ratios are embedded directly into the script. When a new period begins (e.g., a new day on the Daily timeframe), the indicator:
1. Takes the opening price for that period.
2. Retrieves the corresponding pre-calculated Manipulation and Distribution ratios.
3. Applies these ratios to the opening price to project eight potential price levels:
o
/ - Mean Distribution
o
/ - Median Distribution
o
/ - Mean Manipulation
o
/ - Median Manipulation
This approach provides a stable, forward-looking set of levels for the entire duration of the trading period.
________________________________________
Features
• Statistically-Derived Projections: Plots eight key price levels based on historical tendencies, providing clear potential zones for entries, exits, and stop placement.
• Selectable Timeframe: Choose to view projections for the 1H, 4H, 1D, or 1W periods directly from the settings.
• Dynamic Stats Table: A powerful, on-chart dashboard that provides real-time context. For all four timeframes (1H, 4H, 1D, 1W), it shows:
o Position: Where the current price is relative to the projected zones (e.g., “In +Manip Zone,” “Below -Dist”).
o Range Completed: The percentage of the historical average range that the current period has already covered.
o Current & Average Range: The current high-to-low range in points vs. the historical average.
• Historical Context: You can display levels for previous periods to see how price has interacted with them in the past.
• Full Customization: Control the color, style, and visibility of every line, label, and fill to match your chart’s theme.
________________________________________
How to Use
This indicator is versatile and can be integrated into various trading strategies.
• Identifying Targets & Reversal Zones: The Distribution levels (especially the zone between the median and mean) can serve as logical take-profit targets, as they represent a historical point of extension. Conversely, Manipulation levels can indicate areas where price might form a wick and reverse.
• Gauging Volatility: Use the Stats Table’s “Range Completed” column to assess market conditions. If the 1D range is only 30% complete by mid-day, there may be room for significant expansion. If it’s already at 150%, the market might be overextended and due for consolidation.
• Multi-Timeframe Confluence: Use the Stats Table to quickly check if the price on a lower timeframe (e.g., 1H) is approaching a significant level on a higher timeframe (e.g., 1D), adding more weight to that level.
• Defining Bias: If the price opens and holds above the Manipulation zones, it can signal a strong directional bias for the rest of the period.
________________________________________
Settings
• Projection Timeframe: The primary timeframe for which to calculate and display the levels.
• Historical Periods to Show: Set to 1 for only the current period, or increase to see how levels from past periods held up.
• Timezone: Set the timezone for accurate hourly calculations (defaults to America/New_York).
• Visuals: Customize the appearance of the projection lines, labels, and the shaded zones between mean and median levels.
• Stats Table: Enable/disable the table and configure its position, size, and colors.
________________________________________
Disclaimer
This indicator is for informational and educational purposes only. It does not constitute financial advice or a recommendation to buy or sell any asset. All trading involves risk, and past performance is not indicative of future results. Please do your own research and risk management.
Enjoy!

ES1! Manipulation/Distribution Projections (17 years OHLC Stats)Overview
The Manipulation/Distribution Projections (OHLC Stats) indicator is a powerful tool designed to forecast potential price levels for various timeframes on S&P 500 E-mini futures (ES1!). It operates on a simple yet profound principle: price action within a single candle can be broken down into “manipulation” and “distribution” phases.
By analyzing over 17 years of ES (ES1!) historical OHLC data externally in Python, this script calculates the average (mean) and typical (median) extent of these movements. These statistical insights are then used to project key levels on your chart based on the current period’s opening price—providing a statistically-grounded framework for potential support, resistance, and price targets.
________________________________________
Key Concepts Explained
The indicator’s logic is based on how price wicks and bodies form relative to the opening price.
• Manipulation: This refers to the initial move that goes against the candle’s eventual direction.
o For a bullish candle, it’s the lower wick (the move from the open down to the low before reversing higher).
o For a bearish candle, it’s the upper wick (the move from the open up to the high before selling off).
It represents a “fake out” or a stop hunt.
• Distribution: This is the primary, directional move of the candle from the opening price.
o For a bullish candle, it’s the distance from the open to the high.
o For a bearish candle, it’s the distance from the open to the low.
It represents the “real” intended direction of price for that period.
________________________________________
How It Works
This indicator does not calculate these ratios in real-time. Instead, it leverages a comprehensive statistical analysis performed externally in Python on over 17 years of ES (ES1!) OHLC data. This analysis determined the mean and median ratios for both Manipulation and Distribution movements across different timeframes and, for intraday periods, different times of day.
These pre-computed, static ratios are embedded directly into the script. When a new period begins (e.g., a new day on the Daily timeframe), the indicator:
1. Takes the opening price for that period.
2. Retrieves the corresponding pre-calculated Manipulation and Distribution ratios.
3. Applies these ratios to the opening price to project eight potential price levels:
o
/ - Mean Distribution
o
/ - Median Distribution
o
/ - Mean Manipulation
o
/ - Median Manipulation
This approach provides a stable, forward-looking set of levels for the entire duration of the trading period.
________________________________________
Features
• Statistically-Derived Projections: Plots eight key price levels based on historical tendencies, providing clear potential zones for entries, exits, and stop placement.
• Selectable Timeframe: Choose to view projections for the 1H, 4H, 1D, or 1W periods directly from the settings.
• Dynamic Stats Table: A powerful, on-chart dashboard that provides real-time context. For all four timeframes (1H, 4H, 1D, 1W), it shows:
o Position: Where the current price is relative to the projected zones (e.g., “In +Manip Zone,” “Below -Dist”).
o Range Completed: The percentage of the historical average range that the current period has already covered.
o Current & Average Range: The current high-to-low range in points vs. the historical average.
• Historical Context: You can display levels for previous periods to see how price has interacted with them in the past.
• Full Customization: Control the color, style, and visibility of every line, label, and fill to match your chart’s theme.
________________________________________
How to Use
This indicator is versatile and can be integrated into various trading strategies.
• Identifying Targets & Reversal Zones: The Distribution levels (especially the zone between the median and mean) can serve as logical take-profit targets, as they represent a historical point of extension. Conversely, Manipulation levels can indicate areas where price might form a wick and reverse.
• Gauging Volatility: Use the Stats Table’s “Range Completed” column to assess market conditions. If the 1D range is only 30% complete by mid-day, there may be room for significant expansion. If it’s already at 150%, the market might be overextended and due for consolidation.
• Multi-Timeframe Confluence: Use the Stats Table to quickly check if the price on a lower timeframe (e.g., 1H) is approaching a significant level on a higher timeframe (e.g., 1D), adding more weight to that level.
• Defining Bias: If the price opens and holds above the Manipulation zones, it can signal a strong directional bias for the rest of the period.
________________________________________
Settings
• Projection Timeframe: The primary timeframe for which to calculate and display the levels.
• Historical Periods to Show: Set to 1 for only the current period, or increase to see how levels from past periods held up.
• Timezone: Set the timezone for accurate hourly calculations (defaults to America/New_York).
• Visuals: Customize the appearance of the projection lines, labels, and the shaded zones between mean and median levels.
• Stats Table: Enable/disable the table and configure its position, size, and colors.
________________________________________
Disclaimer
This indicator is for informational and educational purposes only. It does not constitute financial advice or a recommendation to buy or sell any asset. All trading involves risk, and past performance is not indicative of future results. Please do your own research and risk management.
Enjoy!

Magic Touch Line DetectorSummary of the Magic Touch Line Detector Script:
Purpose:
The Magic Touch Line Detector script is designed to identify significant price points in the market by analyzing candlestick wicks and bodies. It plots lines based on the detected wicks, classifying them as either ascending or descending. The script tracks how frequently price touches these lines and highlights the "most touched" lines for both ascending and descending categories. This script is particularly useful for traders looking to identify key price levels and trends over time.
How It Works:
Wick and Body Detection:
The script starts by analyzing the highs and lows of candlestick wicks relative to their bodies over a user-defined lookback period. A significant wick is identified based on a specified wick-to-body ratio and a deviation threshold measured against the Average True Range (ATR).
Line Creation:
Once a significant upper or lower wick is detected, the script calculates unconventional highs and lows (i.e., points that differ from the absolute highs and lows of the lookback period). Lines are then drawn from these unconventional price points using the slope between the detected wick and the current bar, ensuring a smooth extension.
Line Refinement and Touch Tracking:
As new bars are added, the script tracks how often the price touches the previously drawn lines. The number of touches each line receives is counted and updated in real-time, and the script ensures that only the most touched line is highlighted.
Highlighting and Labeling:
For each category (ascending and descending), the most touched line is identified and given special highlighting with thicker lines and different colors. Labels are also generated to show the number of touches that the most touched line has received. Old labels are cleared to avoid clutter.
Explanation of the Settings:
Lookback Period for Highs and Lows:
This sets the number of bars the script will use to detect the highest highs and lowest lows. A larger lookback period gives the script a broader context to work with, potentially identifying more significant price points.
Minimum Wick-to-Body Ratio:
This ratio determines what qualifies as a "significant" wick. It compares the length of the wick to the body of the candle. A higher ratio means that only wicks that are much longer than the candle body will be considered significant.
Price Deviation Threshold (in ATR multiples):
This setting controls how much price deviation from the ATR is required for a wick to be deemed significant. It acts as a filter to reduce noise by ignoring smaller wicks that are within normal price movements.
Line Touch Tolerance Factor (ATR multiple):
When checking if a price touches a line, the script uses this setting to define how close the price must be to the line to count as a "touch." This tolerance is a multiplier of the ATR, allowing for some flexibility in what is considered a touch.
Price Difference Threshold:
This defines the minimum price difference required to plot a line. If the price difference between the high and low of a detected wick is too small, the script can avoid plotting a line for insignificant moves.
Slope Adjustment Multiplier:
This multiplier adjusts the slope of the lines that are drawn from detected price points. It affects the length and angle of the lines, allowing users to control how far and at what angle the lines should extend across the chart.
Customization Options:
Show Ascending/Descending Lines:
These toggles allow users to decide whether ascending (bullish) or descending (bearish) lines should be shown on the chart.
Line Color, Style, and Width (for Ascending and Descending Lines):
These settings give users control over how the lines appear visually. You can customize the color, style (solid, dashed, dotted), and width of both ascending and descending lines.
Most Touched Line Color:
Users can define a different color for the "most touched" line, which is automatically identified by the script. This setting helps highlight the line that has been interacted with the most by the price.
How to Use the Script:
Setup the Lookback Period and Deviation Filters:
Start by setting the lookback period and the filters for wick-to-body ratio and deviation threshold. These settings help control the script's sensitivity to market movements.
Refine the Tolerance and Slope:
Adjust the line touch tolerance and slope adjustment multiplier to control how closely the script tracks price touches and how the lines are extended on the chart.
Customize Visuals:
Once the lines are being drawn, customize the colors, styles, and widths to ensure the lines are easy to read on your chart. You can also decide if you want to display both ascending and descending lines or focus on just one.
By setting up the script based on these inputs and parameters, you can get a real-time view of significant price levels and how often the price interacts with them, helping you make more informed trading decisions.

Realtime Divergence for Any Indicator - By John BartleThe main purpose of this script is to show historical and real-time divergences for any oscillating indicator. The secondary purpose is to give the user a lot of precise control over identifying divergences and determining what they are. This is an improved version of my other script which is similarly called "Realtime Divergence for Any Indicator"
There are four types of divergences that are offered:
Bull divergence
Hidden bull divergence
Bear divergence
Hidden Bear divergence
There are three types of potential(real-time) divergences which include:
1) Without right side bars for rightside pivots. Plus without waiting for the rightside pivot bar to complete
2) Without right side bars for rightside pivots. Plus with waiting for the rightside pivot bar to complete
3) With right side bars for rightside pivots. Plus without waiting for the rightside pivot right-most bar to complete
A definite divergence occurs when all specified bars are accounted for and fully formed.
Potential divergences use dashed lines and definite(historical) divergences use solid lines.
In addition to several other categories of settings to filter out unwanted divergences or manipulate the search process, this script also offers Alerts. Remember that alerts must not only be set within this scripts settings but also your "Alerts" panel on your right. It's strange but BOTH must be set for alerts to work...
Other interesting Things To Know:
1)I actually don't trade and so I have no need of a paid account. Unpaid accounts don't have the playback feature so I haven't really tested this script out very well. Sorry. Just let me know if something seems off and IF I have time I'll try to fix it.
2)Keep in mind that Pinescript limits the number of lines that can be shown at one time. This means that if your settings allow for a large number of divergence lines they will be removed from the leftward side of your chart but appear in the rightward side.
3) The time and the values for the price or oscillator are not the same things as each other nor are they physical things with physical space. This means that slopes of lines using the time as X and value as Y can not have definite angles. Consequently, under the setting "DIVERGENCES: SLOPE ANGLE EXCLUSION" YOU have to decide what slope equals what angle by using the setting called "Normalization Factor".
4) Remember that some individual settings apply to both the oscillator and price chart. This means that even if the setting's conditions are fulfilled in one they may not be fulfilled in the other.
5) Under the category "DIVERGENCES: INTERSECTION ALLOWANCE", if you set the "Measurement Type" to Relative Percentage then FYI any single given length will equate to an increasingly smaller percentage the further away from zero it is. Because of this, I think "Reletive Percentage" is probably only useful for price charts or oscillators with big values. Maybe >200 is OK ?
Errors:
1) If you get the error mentioning that the script must complete execution within X amount of time, this is because this is a big script and sometimes takes longer than your service plan's allotted time limit. You can just disable some of the settings to reduce the scripts amount of work and time. The biggest time savers will be to disable some lines and labels
2) If you get an error saying the script accessed a negative index(e.g. ) then try temporarily increasing the "Add More Array Elements" setting to 100-200. Sometimes it fixes the problem.
3) You may sometimes temporarily get an error that reads: "Pine cannot determine the referencing length of a series. Try using max_bars_back in the study or strategy function".
If this happens there are several things that you can do:
3A) Create a copy of my script. Then edit the section of code that looks like this ")//, max_bars_back = INSERT_YOUR_QUANTITY_HERE)" and transform it to look like this new code ", max_bars_back = INSERT_YOUR_QUANTITY_HERE)" then repeatedly try replacing "INSERT_YOUR_QUANTITY_HERE" with an increasingly larger number greater than 244 but less than 5000.
This method will increase your system resources and could cause other problems. Try changing the code back after a few hours and see if all is well again. It is a Pinescript limitation issue and happens when certain functions or variables don't get used at least once within the first 244 bars.
3B) Adjust your settings to hopefully find a divergence within the first 244 bars. If one is found then the problematic variables or functions should get used and the Pinescript 244 bar limitation should be temporarily resolved.
3C) Wait for X number of new bars to occur. If a divergence is eventually found within the first 244 bars that should solve the issue.
Tips:
1) If the amount that a setting changes value is undesirable for each time you click it then you can change that amount in the code. To do that, you'll need your own copy of my script. To make your own copy just click on "create a working copy" in the brown colored strip area above the code. Then within approximately the first 108 lines find the title of the setting you want to change. Then look to it's right to find the parameter called "step =". Change what the step equals to whatever you want. FYI, you can hover your mouse over the blue colored code and a popup will tell you what parameters(i.e. settings) that function(e.g. "input.int()") has available.
Delta Volume Channels [LucF]█ OVERVIEW
This indicator displays on-chart visuals aimed at making the most of delta volume information. It can color bars and display two channels: one for delta volume, another calculated from the price levels of bars where delta volume divergences occur. Markers and alerts can also be configured using key conditions, and filtered in many different ways. The indicator caters to traders who prefer chart visuals over raw values. It will work on historical bars and in real time, using intrabar analysis to calculate delta volume in both conditions.
█ CONCEPTS
Delta Volume
The volume delta concept divides a bar's volume in "up" and "down" volumes. The delta is calculated by subtracting down volume from up volume. Many calculation techniques exist to isolate up and down volume within a bar. The simplest techniques use the polarity of interbar price changes to assign their volume to up or down slots, e.g., On Balance Volume or the Klinger Oscillator . Others such as Chaikin Money Flow use assumptions based on a bar's OHLC values. The most precise calculation method uses tick data and assigns the volume of each tick to the up or down slot depending on whether the transaction occurs at the bid or ask price. While this technique is ideal, it requires huge amounts of data on historical bars, which usually limits the historical depth of charts and the number of symbols for which tick data is available.
This indicator uses intrabar analysis to achieve a compromise between the simplest and most precise methods of calculating volume delta. In the context where historical tick data is not yet available on TradingView, intrabar analysis is the most precise technique to calculate volume delta on historical bars on our charts. TradingView's Volume Profile built-in indicators use it, as do the CVD - Cumulative Volume Delta Candles and CVD - Cumulative Volume Delta (Chart) indicators published from the TradingView account . My Volume Delta Columns Pro indicator also uses intrabar analysis. Other volume delta indicators such as my Realtime 5D Profile use realtime chart updates to achieve more precise volume delta calculations. Indicators of that type cannot be used on historical bars however; they only work in real time.
This is the logic I use to assign intrabar volume to up or down slots:
• If the intrabar's open and close values are different, their relative position is used.
• If the intrabar's open and close values are the same, the difference between the intrabar's close and the previous intrabar's close is used.
• As a last resort, when there is no movement during an intrabar and it closes at the same price as the previous intrabar, the last known polarity is used.
Once all intrabars making up a chart bar have been analyzed and the up or down property of each intrabar's volume determined, the up volumes are added and the down volumes subtracted. The resulting value is volume delta for that chart bar, which can be used as an estimate of the buying/selling pressure on an instrument.
Delta Volume Percent (DV%)
This value is the proportion that delta volume represents of the total intrabar volume in the chart bar. Note that on some symbols/timeframes, the total intrabar volume may differ from the chart's volume for a bar, but that will not affect our calculations since we use the total intrabar volume.
Delta Volume Channel
The DV channel is the space between two moving averages: the reference line and a DV%-weighted version of that reference. The reference line is a moving average of a type, source and length which you select. The DV%-weighted line uses the same settings, but it averages the DV%-weighted price source.
The weight applied to the source of the reference line is calculated from two values, which are multiplied: DV% and the relative size of the bar's volume in relation to previous bars. The effect of this is that DV% values on bars with higher total volume will carry greater weight than those with lesser volume.
The DV channel can be in one of four states, each having its corresponding color:
• Bull (teal): The DV%-weighted line is above the reference line.
• Strong bull (lime): The bull condition is fulfilled and the bar's close is above the reference line and both the reference and the DV%-weighted lines are rising.
• Bear (maroon): The DV%-weighted line is below the reference line.
• Strong bear (pink): The bear condition is fulfilled and the bar's close is below the reference line and both the reference and the DV%-weighted lines are falling.
Divergences
In the context of this indicator, a divergence is any bar where the slope of the reference line does not match that of the DV%-weighted line. No directional bias is assigned to divergences when they occur.
Divergence Channel
The divergence channel is the space between two levels (by default, the bar's low and high ) saved when divergences occur. When price has breached a channel and a new divergence occurs, a new channel is created. Until that new channel is breached, bars where additional divergences occur will expand the channel's levels if the bar's price points are outside the channel.
Prices breaches of the divergence channel will change its state. Divergence channels can be in one of five different states:
• Bull (teal): Price has breached the channel to the upside.
• Strong bull (lime): The bull condition is fulfilled and the DV channel is in the strong bull state.
• Bear (maroon): Price has breached the channel to the downside.
• Strong bear (pink): The bear condition is fulfilled and the DV channel is in the strong bear state.
• Neutral (gray): The channel has not been breached.
█ HOW TO USE THE INDICATOR
Load the indicator on an active chart (see here if you don't know how).
The default configuration displays:
• The DV channel, without the reference or DV%-weighted lines.
• The Divergence channel, without its level lines.
• Bar colors using the state of the DV channel.
The default settings use an Arnaud-Legoux moving average on the close and a length of 20 bars. The DV%-weighted version of it uses a combination of DV% and relative volume to calculate the ultimate weight applied to the reference. The DV%-weighted line is capped to 5 standard deviations of the reference. The lower timeframe used to access intrabars automatically adjusts to the chart's timeframe and achieves optimal balance between the number of intrabars inspected in each chart bar, and the number of chart bars covered by the script's calculations.
The Divergence channel's levels are determined using the high and low of the bars where divergences occur. Breaches of the channel require a bar's low to move above the top of the channel, and the bar's high to move below the channel's bottom.
No markers appear on the chart; if you want to create alerts from this script, you will need first to define the conditions that will trigger the markers, then create the alert, which will trigger on those same conditions.
To learn more about how to use this indicator, you must understand the concepts it uses and the information it displays, which requires reading this description. There are no videos to explain it.
█ FEATURES
The script's inputs are divided in four sections: "DV channel", "Divergence channel", "Other Visuals" and "Marker/Alert Conditions". The first setting is the selection method used to determine the intrabar precision, i.e., how many lower timeframe bars (intrabars) are examined in each chart bar. The more intrabars you analyze, the more precise the calculation of DV% results will be, but the less chart coverage can be covered by the script's calculations.
DV Channel
Here, you control the visibility and colors of the reference line, its weighted version, and the DV channel between them.
You also specify what type of moving average you want to use as a reference line, its source and length. This acts as the DV channel's baseline. The DV%-weighted line is also a moving average of the same type and length as the reference line, except that it will be calculated from the DV%-weighted source used in the reference line. By default, the DV%-weighted line is capped to five standard deviations of the reference line. You can change that value here. This section is also where you can disable the relative volume component of the weight.
Divergence Channel
This is where you control the appearance of the divergence channel and the key price values used in determining the channel's levels and breaching conditions. These choices have an impact on the behavior of the channel. More generous level prices like the default low and high selection will produce more conservative channels, as will the default choice for breach prices.
In this section, you can also enable a mode where an attempt is made to estimate the channel's bias before price breaches the channel. When it is enabled, successive increases/decreases of the channel's top and bottom levels are counted as new divergences occur. When one count is greater than the other, a bull/bear bias is inferred from it.
Other Visuals
You specify here:
• The method used to color chart bars, if you choose to do so.
• The display of a mark appearing above or below bars when a divergence occurs.
• If you want raw values to appear in tooltips when you hover above chart bars. The default setting does not display them, which makes the script faster.
• If you want to display an information box which by default appears in the lower left of the chart.
It shows which lower timeframe is used for intrabars, and the average number of intrabars per chart bar.
Marker/Alert Conditions
Here, you specify the conditions that will trigger up or down markers. The trigger conditions can include a combination of state transitions of the DV and the divergence channels. The triggering conditions can be filtered using a variety of conditions.
Configuring the marker conditions is necessary before creating an alert from this script, as the alert will use the marker conditions to trigger.
Markers only appear on bar closes, so they will not repaint. Keep in mind, when looking at markers on historical bars, that they are positioned on the bar when it closes — NOT when it opens.
Raw values
The raw values calculated by this script can be inspected using a tooltip and the Data Window. The tooltip is visible when you hover over the top of chart bars. It will display on the last 500 bars of the chart, and shows the values of DV, DV%, the combined weight, and the intermediary values used to calculate them.
█ INTERPRETATION
The aim of the DV channel is to provide a visual representation of the buying/selling pressure calculated using delta volume. The simplest characteristic of the channel is its bull/bear state. One can then distinguish between its bull and strong bull states, as transitions from strong bull to bull states will generally happen when buyers are losing steam. While one should not infer a reversal from such transitions, they can be a good place to tighten stops. Only time will tell if a reversal will occur. One or more divergences will often occur before reversals.
The nature of the divergence channel's design makes it particularly adept at identifying consolidation areas if its settings are kept on the conservative side. A gray divergence channel should usually be considered a no-trade zone. More adventurous traders can use the DV channel to orient their trade entries if they accept the risk of trading in a neutral divergence channel, which by definition will not have been breached by price.
If your charts are already busy with other stuff you want to hold on to, you could consider using only the chart bar coloring component of this indicator:
At its simplest, one way to use this indicator would be to look for overlaps of the strong bull/bear colors in both the DV channel and a divergence channel, as these identify points where price is breaching the divergence channel when buy/sell pressure is consistent with the direction of the breach. I have highlighted all those points in the chart below. Not all of them would have produced profitable trades, but nothing is perfect in the markets. Also, keep in mind that the circles identify the visual you would be looking for — not the trade's entry level.
█ LIMITATIONS
• The script will not work on symbols where no volume is available. An error will appear when that is the case.
• Because a maximum of 100K intrabars can be analyzed by a script, a compromise is necessary between the number of intrabars analyzed per chart bar
and chart coverage. The more intrabars you analyze per chart bar, the less coverage you will obtain.
The setting of the "Intrabar precision" field in the "DV channel" section of the script's inputs
is where you control how the lower timeframe is calculated from the chart's timeframe.
█ NOTES
Volume Quality
If you use volume, it's important to understand its nature and quality, as it varies with sectors and instruments. My Volume X-ray indicator is one way you can appraise the quality of an instrument's intraday volume.
For Pine Script™ Coders
• This script uses the new overload of the fill() function which now makes it possible to do vertical gradients in Pine. I use it for both channels displayed by this script.
• I use the new arguments for plot() 's `display` parameter to control where the script plots some of its values,
namely those I only want to appear in the script's status line and in the Data Window.
• I wrote my script using the revised recommendations in the Style Guide from the Pine v5 User Manual.
█ THANKS
To PineCoders . I have used their lower_tf library in this script, to manage the calculation of the LTF and intrabar stats, and their Time library to convert a timeframe in seconds to a printable form for its display in the Information box.
To TradingView's Pine Script™ team. Their innovations and improvements, big and small, constantly expand the boundaries of the language. What this script does would not have been possible just a few months back.
And finally, thanks to all the users of my scripts who take the time to comment on my publications and suggest improvements. I do not reply to all but I do read your comments and do my best to implement your suggestions with the limited time that I have.

MTFT Full Time Frame Continuity Table TheStrat Suite(2of5)Multi Time Frame Tools
Multi Time Frame Tools (MTFT) is a suite of scripts aimed to establish a standard timeframe-based color scheme. This can be utilized to overlay different timeframes calculations/values over a single timeframe. As one example, this would allow to observe the 5-month moving average, 5-week moving average, and 5-day moving average overlaid over each other. This would allow to study a chart, get accustomed to the color scheme and study all these at the same time much easier.
All indicators calculated using the below specific timeframes as input, will always use the color scheme outlined below. This is to get you in habit of recognizing the different timeframes overlaid in top of each other. These can be personalized.
Longer TF analysis.
Yearly - Black
Semi-Annual - Yellow
Quarterly - White
Monthly - Maroon
Weekly - Royal Blue
Daily - Lime
Shorter TF analysis.
4 hour - Fuchsia
1 hour - Orange
30 min - Red
15 min - Brown
10 min - Purple
5 min - Lilac
All color coordination is able to be modified in either the “Inputs” or “Style” section. If you need to make changes, make sure to select “Save as Default” on the bottom right of the settings menu.
Recommended Chart Color Layout
I played around with color coordination a lot. The final product was what worked best for me. I personally use the following chart settings to accent all available TF colors.
-> Click on the settings wheel on your chart. -> Click on “Appearance”.
Background - Solid -> On the top row pick the 6th color from the left.
Vert Grid Lines and Horz Grid Lines -> On the top row pick the 7th color from the left.
You may of course change these and the indicator line colors as you like.
Adding indicator to Chart
-> Open the TradingView “Indicators & Strategies” library, the icon has “ƒx”. -> All premium scripts will be located under “Invite-Only Scripts” -> Click indicator to add to your chart.
MTFT TheStrat Suite (5 Scripts)
Rob Smith is the creator of ‘TheStrat’ trading strategy. For ‘TheStrat’ I have put together a suite of 5 premium scripts that combined will offer people interested in learning ‘TheStrat’ a cleaner learning process. For 2 of the 5 scripts specifically, the MTFT approach of overlaying multiple longer timeframes(TF) over a shorter TF selected as a display cannot be utilized. The other 2 scripts will have full MTFT functionality and they are my personal favorite. I will be providing very basic info to utilize this script; it is up to you to dive deep into learning this strategy. I am not an expert with the tool or a financial advisor. As with all aspects of life, I recommend you research, learn, discern and practice extensively in order to become a master.
1. MTFT Patterns Pro/Noob
*2. MTFT Full Time Frame Continuity Table
3. MTFT Last HML wOpen
4. MTFT Actionable Signal Targets
5. MTFT Reversal Lines
MTFT Full Time Frame Continuity Table, TheStrat Suite (2of5)
Full timeframe continuity observes what direction different timeframes are pointed at, red or green. This gives you a bias when evaluating a trade. Image below shows 3 instances of the script to outline the max capacity of the script.
Features includes:
1. Four user selected TFs, with 20 different TF to pick from per script instance. Timeframes(TF) include: Yearly(Y), Semi-annually(S), Quarterly(Q), Monthly(M), 2-Week(2W), Weekly(W), 3-Day(3D), Daily(D), 12 hour, 8 hour, 6 hour, 4 hour, 3 hour, 2 hour, 1 hour, 30 min, 15 min, 10 min, 5 min. The first row on the table cell will show the text for the selected timeframe.
2. Color text Green/Red timeframe based on candlestick status for the selected timeframe. Entire Table Cell text will be colored in this color. These can be customized to user preference.
3. Absolute Truth for most recently closed candlestick, plus the active candlestick. This will be displayed in the second row of the table cell. The value inside the brackets ‘ ’ is used for the previous closed candlestick. The value outside the brackets is for the active candlestick.
4. Label pattern if it’s “in force” or not. This only applies for the active candlestick absolute truth value. Note, ‘i’ means the absolute truth is in force. ‘x’ means the absolute truth is not in force.
5. Actionable Signal indication at bottom. If there is an inside candlestick, a hammer or a shooter, the script will display , , and respectively at the bottom on the third row.
6. Auto-hide Lower Timeframes. When the table cell value is smaller than the selected timeframe this timeframe will be hidden. This is done because their will be errors in calculations.
7. Customizable Table Cell Width for use in the different platforms, desktop/mobile. For desktop I use the setting.
IMPORTANT NOTE for TradingView admin: One of the lessons I would consider most important in attaining clarity regarding trading, is “TheStrat” by Rob Smith. His lesson on “actionable signals” is something that can be applied to any strategy. For this reason, I am including “MTFT TheStrat Patterns Pro” script in all images that will depict confluence for a better trade selection.
Example using TheStrat Pro MTFT with this indicator.
Look for a “TheStrat actionable signal” or a “TheStrat Reversal signal” along with this indicator showing several other larger timeframes Red/Green depending on the direction of the actionable signal.
The Image below shows what this would look like with this indicator. The selected candlestick is the Week, it shows a confirmed closed Shooting Star Actionable signal and below the table shows that the Current Week(W), Month(M), Quarter(Q), and Year(Y) are all Red. This actionable signal would be played for SHORTS. If the low is breached than you would enter a short. For targets you would look at the previous pivots, for this example all targets were hit. This wont always play out so nice and clean, but given that there is so many stocks and so many signals this is just a thought to improve the quality of the signal as it has extra confluence.

WWV_LB pivotfix histogram jayy
This is a modification of LazyBear's WWV_LB which plots cumulative volume of waves. The reversal points are defined through relative closing prices. I made adjustments to the script to show waves turning on actual/true low or high pivots as opposed to the bar/candle identified in the LazyBear script. What I mean by that is that the actual/true low or high pivots are in fact the true WWV_LB pivots. The original WWV_LB script calculates cumulative volume from reversal confirmation bar to reversal confirmation bar as opposed to the true WWV_LB pivot bar to pivot bar. As such the waves can have slightly different start and end points. As such the cumulative volume can also be different from te WWV_LB script. This is because confirmation of a wave reversal can lag a few bars after the true reversal pivot bar. In the script notes, you will see the original key WWV_LB script lines that identify the true high or low pivots and confirm the wave direction has reversed. I have taken these lines from LazyBear's original script. I have included the LazyBear script within the script notes so that the original can be compared to what I have added/changed. Instead of "trendDetectionLength" I have inserted "Trend Detection Length". You can of course change the descriptor to what you wish by editing script line 33 to the original term or whatever you wish. You might also wish to set the default to the value "2" as per the original script. I have set the default to "3". This script should be used in conjunction with "WWV-LB zigzag pivot fix jayy" script which is shown on this screen for comparison.
Here is a link to the original LazyBear histogram script which can be used for comparison. The differences are subtle, however, the histograms will regularly be different by a bar or two:
The lowest panel has the original LazyBear WWV_LB script for comparison. All three scripts have been set to a Trend Detection Length of 3.jayy

Ensemble Alerts█ OVERVIEW
This indicator creates highly customizable alert conditions and messages by combining several technical conditions into groups , which users can specify directly from the "Settings/Inputs" tab. It offers a flexible framework for building and testing complex alert conditions without requiring code modifications for each adjustment.
█ CONCEPTS
Ensemble analysis
Ensemble analysis is a form of data analysis that combines several "weaker" models to produce a potentially more robust model. In a trading context, one of the most prevalent forms of ensemble analysis is the aggregation (grouping) of several indicators to derive market insights and reinforce trading decisions. With this analysis, traders typically inspect multiple indicators, signaling trade actions when specific conditions or groups of conditions align.
Simplifying ensemble creation
Combining indicators into one or more ensembles can be challenging, especially for users without programming knowledge. It usually involves writing custom scripts to aggregate the indicators and trigger trading alerts based on the confluence of specific conditions. Making such scripts customizable via inputs poses an additional challenge, as it often involves complicated input menus and conditional logic.
This indicator addresses these challenges by providing a simple, flexible input menu where users can easily define alert criteria by listing groups of conditions from various technical indicators in simple text boxes . With this script, you can create complex alert conditions intuitively from the "Settings/Inputs" tab without ever writing or modifying a single line of code. This framework makes advanced alert setups more accessible to non-coders. Additionally, it can help Pine programmers save time and effort when testing various condition combinations.
█ FEATURES
Configurable alert direction
The "Direction" dropdown at the top of the "Settings/Inputs" tab specifies the allowed direction for the alert conditions. There are four possible options:
• Up only : The indicator only evaluates upward conditions.
• Down only : The indicator only evaluates downward conditions.
• Up and down (default): The indicator evaluates upward and downward conditions, creating alert triggers for both.
• Alternating : The indicator prevents alert triggers for consecutive conditions in the same direction. An upward condition must be the first occurrence after a downward condition to trigger an alert, and vice versa for downward conditions.
Flexible condition groups
This script features six text inputs where users can define distinct condition groups (ensembles) for their alerts. An alert trigger occurs if all the conditions in at least one group occur.
Each input accepts a comma-separated list of numbers with optional spaces (e.g., "1, 4, 8"). Each listed number, from 1 to 35, corresponds to a specific individual condition. Below are the conditions that the numbers represent:
1 — RSI above/below threshold
2 — RSI below/above threshold
3 — Stoch above/below threshold
4 — Stoch below/above threshold
5 — Stoch K over/under D
6 — Stoch K under/over D
7 — AO above/below threshold
8 — AO below/above threshold
9 — AO rising/falling
10 — AO falling/rising
11 — Supertrend up/down
12 — Supertrend down/up
13 — Close above/below MA
14 — Close below/above MA
15 — Close above/below open
16 — Close below/above open
17 — Close increase/decrease
18 — Close decrease/increase
19 — Close near Donchian top/bottom (Close > (Mid + HH) / 2)
20 — Close near Donchian bottom/top (Close < (Mid + LL) / 2)
21 — New Donchian high/low
22 — New Donchian low/high
23 — Rising volume
24 — Falling volume
25 — Volume above average (Volume > SMA(Volume, 20))
26 — Volume below average (Volume < SMA(Volume, 20))
27 — High body to range ratio (Abs(Close - Open) / (High - Low) > 0.5)
28 — Low body to range ratio (Abs(Close - Open) / (High - Low) < 0.5)
29 — High relative volatility (ATR(7) > ATR(40))
30 — Low relative volatility (ATR(7) < ATR(40))
31 — External condition 1
32 — External condition 2
33 — External condition 3
34 — External condition 4
35 — External condition 5
These constituent conditions fall into three distinct categories:
• Directional pairs : The numbers 1-22 correspond to pairs of opposing upward and downward conditions. For example, if one of the inputs includes "1" in the comma-separated list, that group uses the "RSI above/below threshold" condition pair. In this case, the RSI must be above a high threshold for the group to trigger an upward alert, and the RSI must be below a defined low threshold to trigger a downward alert.
• Non-directional filters : The numbers 23-30 correspond to conditions that do not represent directional information. These conditions act as filters for both upward and downward alerts. Traders often use non-directional conditions to refine trending or mean reversion signals. For instance, if one of the input lists includes "30", that group uses the "Low relative volatility" condition. The group can trigger an upward or downward alert only if the 7-period Average True Range (ATR) is below the 40-period ATR.
• External conditions : The numbers 31-35 correspond to external conditions based on the plots from other indicators on the chart. To set these conditions, use the source inputs in the "External conditions" section near the bottom of the "Settings/Inputs" tab. The external value can represent an upward, downward, or non-directional condition based on the following logic:
▫ Any value above 0 represents an upward condition.
▫ Any value below 0 represents a downward condition.
▫ If the checkbox next to the source input is selected, the condition becomes non-directional . Any group that uses the condition can trigger upward or downward alerts only if the source value is not 0.
To learn more about using plotted values from other indicators, see this article in our Help Center and the Source input section of our Pine Script™ User Manual.
Group markers
Each comma-separated list represents a distinct group , where all the listed conditions must occur to trigger an alert. This script assigns preset markers (names) to each condition group to make the active ensembles easily identifiable in the generated alert messages and labels. The markers assigned to each group use the format "M", where "M" is short for "Marker" and "x" is the group number. The titles of the inputs at the top of the "Settings/Inputs" tab show these markers for convenience.
For upward conditions, the labels and alert messages show group markers with upward triangles (e.g., "M1▲"). For downward conditions, they show markers with downward triangles (e.g., "M1▼").
NOTE: By default, this script populates the "M1" field with a pre-configured list for a mean reversion group ("2,18,24,28"). The other fields are empty. If any "M*" input does not contain a value, the indicator ignores it in the alert calculations.
Custom alert messages
By default, the indicator's alert message text contains the activated markers and their direction as a comma-separated list. Users can override this message for upward or downward alerts with the two text fields at the bottom of the "Settings/Inputs" tab. When the fields are not empty , the alerts use that text instead of the default marker list.
NOTE: This script generates alert triggers, not the alerts themselves. To set up an alert based on this script's conditions, open the "Create Alert" dialog box, then select the "Ensemble Alerts" and "Any alert() function call" options in the "Condition" tabs. See the Alerts FAQ in our Pine Script™ User Manual for more information.
Condition visualization
This script offers organized visualizations of its conditions, allowing users to inspect the behaviors of each condition alongside the specified groups. The key visual features include:
1) Conditional plots
• The indicator plots the history of each individual condition, excluding the external conditions, as circles at different levels. Opposite conditions appear at positive and negative levels with the same absolute value. The plots for each condition show values only on the bars where they occur.
• Each condition's plot is color-coded based on its type. Aqua and orange plots represent opposing directional conditions, and purple plots represent non-directional conditions. The titles of the plots also contain the condition numbers to which they apply.
• The plots in the separate pane can be turned on or off with the "Show plots in pane" checkbox near the top of the "Settings/Inputs" tab. This input only toggles the color-coded circles, which reduces the graphical load. If you deactivate these visuals, you can still inspect each condition from the script's status line and the Data Window.
• As a bonus, the indicator includes "Up alert" and "Down alert" plots in the Data Window, representing the combined upward and downward ensemble alert conditions. These plots are also usable in additional indicator-on-indicator calculations.
2) Dynamic labels
• The indicator draws a label on the main chart pane displaying the activated group markers (e.g., "M1▲") each time an alert condition occurs.
• The labels for upward alerts appear below chart bars. The labels for downward alerts appear above the bars.
NOTE: This indicator can display up to 500 labels because that is the maximum allowed for a single Pine script.
3) Background highlighting
• The indicator can highlight the main chart's background on bars where upward or downward condition groups activate. Use the "Highlight background" inputs in the "Settings/Inputs" tab to enable these highlights and customize their colors.
• Unlike the dynamic labels, these background highlights are available for all chart bars, irrespective of the number of condition occurrences.
█ NOTES
• This script uses Pine Script™ v6, the latest version of TradingView's programming language. See the Release notes and Migration guide to learn what's new in v6 and how to convert your scripts to this version.
• This script imports our new Alerts library, which features functions that provide high-level simplicity for working with complex compound conditions and alerts. We used the library's `compoundAlertMessage()` function in this indicator. It evaluates items from "bool" arrays in groups specified by an array of strings containing comma-separated index lists , returning a tuple of "string" values containing the marker of each activated group.
• The script imports the latest version of the ta library to calculate several technical indicators not included in the built-in `ta.*` namespace, including Double Exponential Moving Average (DEMA), Triple Exponential Moving Average (TEMA), Fractal Adaptive Moving Average (FRAMA), Tilson T3, Awesome Oscillator (AO), Full Stochastic (%K and %D), SuperTrend, and Donchian Channels.
• The script uses the `force_overlay` parameter in the label.new() and bgcolor() calls to display the drawings and background colors in the main chart pane.
• The plots and hlines use the available `display.*` constants to determine whether the visuals appear in the separate pane.
Look first. Then leap.

US30 Challenge ComplementPurpose of the Script
This script is designed to analyze bullish and bearish engulfing patterns on the US30 index. It combines moving averages (MA and EMA) on both daily and hourly charts to detect crossovers, evaluates engulfing candlestick patterns, and adds additional conditions based on the size of candlestick wicks. The script provides visual feedback by coloring bars and plotting flags when certain conditions are met.
Explanation of the Key Features
User Input Parameters:
The script allows users to customize the period and color of both a simple moving average (SMA) and an exponential moving average (EMA). This flexibility enables users to adapt the moving average settings to their preferred strategy.
Moving Averages (MA and EMA):
Two key moving averages are calculated:
A simple moving average (SMA) with a period of 18 for both daily and hourly timeframes.
An exponential moving average (EMA) with a period of 8 for both daily and hourly timeframes.
These moving averages are used to detect whether the EMA is above or below the SMA in both the daily and hourly charts, providing trend direction insights.
Engulfing Patterns:
The script detects bullish and bearish engulfing patterns across multiple candlesticks.
Bullish Engulfing: Occurs when a green candlestick (closing higher than it opens) completely engulfs the body of the previous red candlestick.
Bearish Engulfing: Occurs when a red candlestick (closing lower than it opens) completely engulfs the body of the previous green candlestick.
The script detects these patterns not only for a single previous candle but also up to three previous candles, making it more versatile in recognizing different engulfing scenarios.
A percentage threshold is introduced to ensure that the engulfing candles meet a minimum size requirement, which can be customized by the user.
Cross-Detection on Multiple Timeframes:
The script checks whether the EMA is above or below the SMA on both daily and hourly charts.
This crossover is critical for confirming bullish or bearish conditions. If the EMA is below the SMA on the hourly chart, combined with a bullish engulfing pattern, it suggests a potential bullish reversal. Conversely, if the EMA is above the SMA with a bearish engulfing pattern, it signals a potential bearish reversal.
Candlestick Size and Wick Filters:
The script includes functions to filter candlesticks based on their wick sizes.
Bullish Wick Filter: Ensures that the upper wick of a bullish candle is not too large compared to the body.
Bearish Wick Filter: Ensures that the lower wick of a bearish candle is not too large compared to the body.
These filters help confirm strong candlesticks, reducing noise from candles with long wicks that might indicate indecision.
Visual Cues (Bar Coloring and Flags):
The script colors bars green if bullish engulfing conditions are met and red if bearish engulfing conditions are met. This provides an immediate visual indication of potential reversal points.
It also plots flags above bullish candlesticks and below bearish candlesticks if they have favorable wick characteristics. This adds an extra layer of confirmation for identifying stronger candles.
How to Use the Script
Adjust Parameters:
Before using the script, traders can customize the moving average periods, colors, and the percentage threshold for the engulfing candlesticks. This allows users to fine-tune the script to different timeframes and market conditions.
Engulfing Pattern Detection:
Traders can rely on the script to automatically detect and highlight bullish and bearish engulfing patterns, making it easier to spot potential reversal points. The script considers both single and multi-candlestick engulfing patterns, adding robustness to its detection logic.
Cross-Verification with Moving Averages:
The script adds a layer of confirmation by checking the relationship between the EMA and SMA. Traders can look for alignment between the moving averages and the engulfing patterns to increase the likelihood of successful trades.
Filter Candles Based on Wick Size:
Traders can use the additional wick filters to focus on stronger, more decisive candles. Flags are plotted on these candles, making them easier to identify.
Differences from Other Scripts
Multi-Candle Engulfing Detection: The script detects engulfing patterns over multiple previous candles (up to three), which is not commonly found in most scripts.
Customizable Engulfing Size: The user can set a minimum size threshold for engulfing candles, providing greater control over the pattern detection.
Wick Filters: The inclusion of filters to check for wick size makes this script more precise in identifying strong engulfing candles, reducing false signals from indecisive candles with large wicks.
EMA and SMA Crossover Integration: By integrating moving average crossovers, the script provides additional trend confirmation, increasing the reliability of the engulfing signals.
***************************************************(Español)
Propósito del Script
Este script está diseñado para analizar patrones de envolvente alcista y bajista en el índice US30. Combina medias móviles (MA y EMA) en gráficos diarios y horarios para detectar cruces, evalúa patrones de velas envolventes y añade condiciones adicionales basadas en el tamaño de las mechas. El script ofrece retroalimentación visual coloreando barras y trazando banderas cuando se cumplen ciertas condiciones.
Explicación de las Características Clave
Parámetros de Entrada del Usuario:
El script permite personalizar el período y el color tanto de una media móvil simple (SMA) como de una media móvil exponencial (EMA), lo que permite a los usuarios ajustar las configuraciones según su estrategia.
Medias Móviles (MA y EMA):
Dos medias móviles clave se calculan:
Una media móvil simple (SMA) con un período de 18 tanto para los marcos de tiempo diarios como horarios.
Una media móvil exponencial (EMA) con un período de 8 tanto para los marcos de tiempo diarios como horarios.
Patrones Envolventes:
El script detecta patrones de envolvente alcista y bajista en múltiples velas.
Se introduce un umbral porcentual que garantiza que las velas envolventes tengan un tamaño mínimo, personalizable por el usuario.
Detección de Cruces en Múltiples Marcos Temporales:
El script verifica si la EMA está por encima o por debajo de la SMA en gráficos diarios y horarios, lo que ayuda a confirmar las condiciones de tendencia.
Filtros de Tamaño de Mecha:
El script incluye funciones para filtrar velas según el tamaño de sus mechas, lo que ayuda a identificar velas más fuertes y decisivas.
Indicadores Visuales:
El script colorea las barras en verde si se cumplen las condiciones de envolvente alcista y en rojo si se cumplen las de envolvente bajista. También traza banderas para indicar velas con mechas favorables.
Cómo usar el Script
Ajustar Parámetros.
Detección de Patrones Envolventes.
Verificación con Medias Móviles.
Filtrar Velas Según el Tamaño de Mecha.
Diferencias con Otros Scripts
Detección Multi-Velas de Envolventes.
Tamaño Personalizable de Envolventes.
Filtros de Mechas.
Integración de Cruces de EMA y SMA.

Bogdan Ciocoiu - Sniper EntryWhat is Sniper Entry
Sniper Entry is a set indicator that encapsulates a collection of pre-configured scripts using specific variables that enable users to extract signals by interpreting market behaviour quickly, suitable for 1-3min scalping. This instrument is a tool that acts as a confluence for traders to make decisions concerning current market conditions. This indicator does not apply solely to an asset.
What Sniper Entry is not
Sniper Entry is not interpreting fundamental analysis and will also not be providing out of box market signals. Instead, it will provide a collection of integrated and significantly improved open-source subscripts designed to help traders speculate on market trends. Traders must apply their strategies and configure Sniper Entry accordingly to maximise the script's output.
Originality and usefulness
The collection of subscripts encapsulated in this tool makes it unique in the Trading View ecosystem. This indicator enables traders to consider entry positions or exit positions by comparing similar algorithms at once.
Its usefulness also emerges from the unique configurations embedded in the indicator's settings, which are different from those of the original scripts.
This indicator's originality is also reflected in how its modules are integrated, including the integration of the settings.
Open-source reuse
I used the following open-source resources, which I simplified significantly and pre-configured for short term scalping. The source codes for the below are already in the public domain, including the following links listed below.
www.tradingview.com (open source)
(open source and generic algorithm)
www.tradingview.com (open source)
(open source)
(open source)
www.tradingview.com (generic MA algorithm and open source)
(generic VWAP algorithm and open source)

Scanner/Screener of Over 40 Coins Per Script I am very scatter-brained by nature and sporadic in my thought processes but if these benefit the community and ya'll ask for more perhaps I will get better and even out a tad....probably not....but you never know. Firstly, allow me to apologize to all the vet/more sophisticated coders out there whose eyes and brains might just be overly taxed due to my poor coding structure. Im just getting started for the first time in ANY sort of coding...so cut me a little slack. Also, if anyone sees any mistakes or the functionality is not as I proclaimed, PLEASE do let me know. In these past 12mo of me learning my 1st coding language (Pinescript) I would say that I have been intently focused on creating all types/sorts of scanners/screeners. Ive always hoped to be a benefit to the community as I was always SO grateful to those who have come before me that have led me to the little bit of progress I have made with Pinescript. This script is not necessarily something that should be traded with as it is just a thrown together example showing a scanner/screener whose results produce plot outputs (ie, Rate of Change / oscillators as well / etc) and how they can be used in the alert system so that only 1 alert has to be set per iteration of the script but more importantly how to use/scan/screen with over 40 coins per script. My intent is not to trick anyone here. So to be PERFECTLY CLEAR, more than 40 coins CAN in fact be screened/scanned from one script (here I am doing all of KUCOIN's Margin Coins...72 total I look at)...BUT...(heres the catch) it must be added to the chart however many times EQUAL to the amount of "sets" you have in your script. (Heres the limitation by TV) There cannot be more than 40 coins in each "set". The less coins you have per set, the quicker the script will startup and run, thus, the quicker alerts will be received if automating the process. Though, if you only have the free plan and can only have MAX 3 indicators per chart then the MAX you can screen at a time is 120 coins if you use 40 coins per set. So, this is the first one I would like to introduce. For this one your screener/scanner must be using some sort of plots as output that is being screened for. (original inspiration of ALL my variations mainly come from @QuantNomad, @daveatt, and @LonesomeTheBlue (and a few others I may be forgetting at the moment). Thanks for the inspiration through countless publications that ya'll have created for us in the community.
Some of my variations are more complex/elegant than others but there are MANY very different ones that I would like to share with the community. If you leave a comment and wonder why I have not responded but did so to every comment around yours...see if you are one of the individuals in this next few sentences...and if you are then perhaps someone else would like to waste their time responding to your comment...but basically, if you don't want to spend the time helping yourself by reading the title, description section, AND the comments section (at least scanning them) then I am MOST DEFINITELY not going to help you down your path of destruction that is most likely soon to be your blown-up trading account. I was called a "masochist" after asking for guidance on if its worth the headache to publish anything on TV bc there will NO DOUBT be comments that'll make me wish I didn't (ie. someone CLEARLY not reading the description (or seemingly even the title sometimes) bc they make a comment that has been explicitly addressed, or someone asking to rebuild the code compatible for another charting software or whatnot, or how about those asking if it repaints (this one is almost always addressed in the comments section but I can understand this question more than others as Im only 1 yr into learning any sort of coding for the first time in the beginning I saw people ask on EVERY script about if it repainted and it was worrisome at the lest (esp bc I didn't even understand what it was not so long ago, or my favorite...what TF it works best on...these people CLEARLY need not be trading yet if your still asking questions as such...Ill end it there). Point being, Ive got some truly VERY useful scripts that I want to share and as long as these people don't make me regret doing so in the beginning, then whats mine...will soon be yours. Though, I will take a little time between the releases.
YOU GUYS (TV and its community) ARE AWESOME (most of you anyways ;)
MUCH LOVE,
ChasinAlts
(1) INPUTS
Here is where the "sets" come in. I am looking at all of KUCOIN's Margin Coins (72 of them at least) so am splitting them up into 3 sets/iterations and a copy of the script must be added equal to amount of "sets" you have here. This is the ONLY workaround I have found to be able to scan/screen with more than 40 coins per script (due to TV's limitation of 40 Security Calls per script) ***So for everyone saying it's impossible scan more than 40 Coins per scipt...it' MOST DEFINITELY possible....BUT ONLY by adding this script multiple times on the chart and selecting 1 of each of the "sets" in the script settings via the chart window. To save the much needed room you must push each iteration of the script into 1 window and merging the scales of each into 1 scale(ie. "Scale A") within the settings of the script name on the chart(3 horizontal dots)
(2) FUNCTION
(2.1) COLORIDs
This is just to set up all my Colors of plots which are being matched with their respective labels. I have a diff color for each of the 72 coins Im plotting so Im telling the function, "depending on which set of coins I select...give me this color out of the colors I input later into the function"
(2.2) TICKERID CONSTRUCTION
I construct the tickerID this way so that the labels on my plots have only the Coin's name vs the label having the (Exchange Name):(Coin Name)(Base Pair Name). If you are using more than 1 Base pair (ie. XRP/BTC and XRP/USDT and XRP/ETH) OR more than 1 Exchange OR want your plots to show MORE THAN just the Trading Coin's name, then the tickerID MUST BE constructed differently
(2.3) SECURITY CALL & PLOT OUTPUT VARIABLES
If using a Higher Time Frame in Security Call then it MUST BE adjusted to permit or dissallow repainting if you so wish (BEYOND THE SCOPE OF THIS PUBLICATION so Do Your Own Researh). If your MAIN LOGIC is more complex than simply using a TV built-in function), THEN it MUST BE built into its own function outside of this function and called on within the "expression" slot of this Security Call OR can also be built into this function and called on in the "expression" slot of this Security call (BEYOND THE SCOPE OF THIS PUB SO DYOR). FURTHERMORE...when you are using a series(ie high/low/close/open/hl2/etc) / bar_index / time / etc that will be specific to the Coin/tickerID, then they MUST BE explicitly used within the "expression" slot of the Security Function when calling on your Main Logic or else it will pull the series/time/bar_index/etc from the Coin that the Chart is presently on (BEYOND THE SCOPE OF THIS PUB SO DYOR)
(2.4) PLOT LABEL
This is the Plot's Label that will be next to the end of the plot on the LAST bar_index. ***Notice in the "text" slot of the label I have "_coin" (without the quotes obviously)...this is where have JUST the Coin's name comes into effect on the label vs the (Exchange Name):(Coin Name)(Base Pair Name) which looks MUCH cleaner
(2.5) ALERT LOGIC / ALERT LABEL
Your alert logic need not be as complex as this... I just wanted to create a decent enough timing for this system and wanted to simply print the labels displaying which coin produced the alert at the same time the alerts would go off. Alert is set up to Trigger Bullish when the ROC is below the Threshold and _chg > _chg X=length of bars inputted in "Rising/Falling Length" setting and vise versa for Bearish Alerts. If _chg plot only goes past threshold for a VERY few amount of bars NOT providing enough time for initial Alert to trigger, then alert/label triggers on crossing of threshold back towards 0(zero). ONLY 1 alert needs to be set per script to be able to scan ALL 72 of the coins as I have them in this script. Timing of Alert is inline with the name label printed past the thresholds.
(3) VARIABLES FROM MAIN FUNCTION
This is the tuple of the Main Function that outputs the variables from 3 lines up to be able to plot the lines and color them according to the colors on the labels. *** As of now, we CANNOT plot from within the function so MUST BE done this way to produce the variables and colors needed. The plots are the ONLY thing in this script that cannot be executed from within the function
(4) LINE PLOTS
ALL output variables from our Main Function are used here for the line plots

Monte Carlo Range Forecast [DW]This is an experimental study designed to forecast the range of price movement from a specified starting point using a Monte Carlo simulation.
Monte Carlo experiments are a broad class of computational algorithms that utilize random sampling to derive real world numerical results.
These types of algorithms have a number of applications in numerous fields of study including physics, engineering, behavioral sciences, climate forecasting, computer graphics, gaming AI, mathematics, and finance.
Although the applications vary, there is a typical process behind the majority of Monte Carlo methods:
-> First, a distribution of possible inputs is defined.
-> Next, values are generated randomly from the distribution.
-> The values are then fed through some form of deterministic algorithm.
-> And lastly, the results are aggregated over some number of iterations.
In this study, the Monte Carlo process used generates a distribution of aggregate pseudorandom linear price returns summed over a user defined period, then plots standard deviations of the outcomes from the mean outcome generate forecast regions.
The pseudorandom process used in this script relies on a modified Wichmann-Hill pseudorandom number generator (PRNG) algorithm.
Wichmann-Hill is a hybrid generator that uses three linear congruential generators (LCGs) with different prime moduli.
Each LCG within the generator produces an independent, uniformly distributed number between 0 and 1.
The three generated values are then summed and modulo 1 is taken to deliver the final uniformly distributed output.
Because of its long cycle length, Wichmann-Hill is a fantastic generator to use on TV since it's extremely unlikely that you'll ever see a cycle repeat.
The resulting pseudorandom output from this generator has a minimum repetition cycle length of 6,953,607,871,644.
Fun fact: Wichmann-Hill is a widely used PRNG in various software applications. For example, Excel 2003 and later uses this algorithm in its RAND function, and it was the default generator in Python up to v2.2.
The generation algorithm in this script takes the Wichmann-Hill algorithm, and uses a multi-stage transformation process to generate the results.
First, a parent seed is selected. This can either be a fixed value, or a dynamic value.
The dynamic parent value is produced by taking advantage of Pine's timenow variable behavior. It produces a variable parent seed by using a frozen ratio of timenow/time.
Because timenow always reflects the current real time when frozen and the time variable reflects the chart's beginning time when frozen, the ratio of these values produces a new number every time the cache updates.
After a parent seed is selected, its value is then fed through a uniformly distributed seed array generator, which generates multiple arrays of pseudorandom "children" seeds.
The seeds produced in this step are then fed through the main generators to produce arrays of pseudorandom simulated outcomes, and a pseudorandom series to compare with the real series.
The main generators within this script are designed to (at least somewhat) model the stochastic nature of financial time series data.
The first step in this process is to transform the uniform outputs of the Wichmann-Hill into outputs that are normally distributed.
In this script, the transformation is done using an estimate of the normal distribution quantile function.
Quantile functions, otherwise known as percent-point or inverse cumulative distribution functions, specify the value of a random variable such that the probability of the variable being within the value's boundary equals the input probability.
The quantile equation for a normal probability distribution is μ + σ(√2)erf^-1(2(p - 0.5)) where μ is the mean of the distribution, σ is the standard deviation, erf^-1 is the inverse Gauss error function, and p is the probability.
Because erf^-1() does not have a simple, closed form interpretation, it must be approximated.
To keep things lightweight in this approximation, I used a truncated Maclaurin Series expansion for this function with precomputed coefficients and rolled out operations to avoid nested looping.
This method provides a decent approximation of the error function without completely breaking floating point limits or sucking up runtime memory.
Note that there are plenty of more robust techniques to approximate this function, but their memory needs very. I chose this method specifically because of runtime favorability.
To generate a pseudorandom approximately normally distributed variable, the uniformly distributed variable from the Wichmann-Hill algorithm is used as the input probability for the quantile estimator.
Now from here, we get a pretty decent output that could be used itself in the simulation process. Many Monte Carlo simulations and random price generators utilize a normal variable.
However, if you compare the outputs of this normal variable with the actual returns of the real time series, you'll find that the variability in shocks (random changes) doesn't quite behave like it does in real data.
This is because most real financial time series data is more complex. Its distribution may be approximately normal at times, but the variability of its distribution changes over time due to various underlying factors.
In light of this, I believe that returns behave more like a convoluted product distribution rather than just a raw normal.
So the next step to get our procedurally generated returns to more closely emulate the behavior of real returns is to introduce more complexity into our model.
Through experimentation, I've found that a return series more closely emulating real returns can be generated in a three step process:
-> First, generate multiple independent, normally distributed variables simultaneously.
-> Next, apply pseudorandom weighting to each variable ranging from -1 to 1, or some limits within those bounds. This modulates each series to provide more variability in the shocks by producing product distributions.
-> Lastly, add the results together to generate the final pseudorandom output with a convoluted distribution. This adds variable amounts of constructive and destructive interference to produce a more "natural" looking output.
In this script, I use three independent normally distributed variables multiplied by uniform product distributed variables.
The first variable is generated by multiplying a normal variable by one uniformly distributed variable. This produces a bit more tailedness (kurtosis) than a normal distribution, but nothing too extreme.
The second variable is generated by multiplying a normal variable by two uniformly distributed variables. This produces moderately greater tails in the distribution.
The third variable is generated by multiplying a normal variable by three uniformly distributed variables. This produces a distribution with heavier tails.
For additional control of the output distributions, the uniform product distributions are given optional limits.
These limits control the boundaries for the absolute value of the uniform product variables, which affects the tails. In other words, they limit the weighting applied to the normally distributed variables in this transformation.
All three sets are then multiplied by user defined amplitude factors to adjust presence, then added together to produce our final pseudorandom return series with a convoluted product distribution.
Once we have the final, more "natural" looking pseudorandom series, the values are recursively summed over the forecast period to generate a simulated result.
This process of generation, weighting, addition, and summation is repeated over the user defined number of simulations with different seeds generated from the parent to produce our array of initial simulated outcomes.
After the initial simulation array is generated, the max, min, mean and standard deviation of this array are calculated, and the values are stored in holding arrays on each iteration to be called upon later.
Reference difference series and price values are also stored in holding arrays to be used in our comparison plots.
In this script, I use a linear model with simple returns rather than compounding log returns to generate the output.
The reason for this is that in generating outputs this way, we're able to run our simulations recursively from the beginning of the chart, then apply scaling and anchoring post-process.
This allows a greater conservation of runtime memory than the alternative, making it more suitable for doing longer forecasts with heavier amounts of simulations in TV's runtime environment.
From our starting time, the previous bar's price, volatility, and optional drift (expected return) are factored into our holding arrays to generate the final forecast parameters.
After these parameters are computed, the range forecast is produced.
The basis value for the ranges is the mean outcome of the simulations that were run.
Then, quarter standard deviations of the simulated outcomes are added to and subtracted from the basis up to 3σ to generate the forecast ranges.
All of these values are plotted and colorized based on their theoretical probability density. The most likely areas are the warmest colors, and least likely areas are the coolest colors.
An information panel is also displayed at the starting time which shows the starting time and price, forecast type, parent seed value, simulations run, forecast bars, total drift, mean, standard deviation, max outcome, min outcome, and bars remaining.
The interesting thing about simulated outcomes is that although the probability distribution of each simulation is not normal, the distribution of different outcomes converges to a normal one with enough steps.
In light of this, the probability density of outcomes is highest near the initial value + total drift, and decreases the further away from this point you go.
This makes logical sense since the central path is the easiest one to travel.
Given the ever changing state of markets, I find this tool to be best suited for shorter term forecasts.
However, if the movements of price are expected to remain relatively stable, longer term forecasts may be equally as valid.
There are many possible ways for users to apply this tool to their analysis setups. For example, the forecast ranges may be used as a guide to help users set risk targets.
Or, the generated levels could be used in conjunction with other indicators for meaningful confluence signals.
More advanced users could even extrapolate the functions used within this script for various purposes, such as generating pseudorandom data to test systems on, perform integration and approximations, etc.
These are just a few examples of potential uses of this script. How you choose to use it to benefit your trading, analysis, and coding is entirely up to you.
If nothing else, I think this is a pretty neat script simply for the novelty of it.
----------
How To Use:
When you first add the script to your chart, you will be prompted to confirm the starting date and time, number of bars to forecast, number of simulations to run, and whether to include drift assumption.
You will also be prompted to confirm the forecast type. There are two types to choose from:
-> End Result - This uses the values from the end of the simulation throughout the forecast interval.
-> Developing - This uses the values that develop from bar to bar, providing a real-time outlook.
You can always update these settings after confirmation as well.
Once these inputs are confirmed, the script will boot up and automatically generate the forecast in a separate pane.
Note that if there is no bar of data at the time you wish to start the forecast, the script will automatically detect use the next available bar after the specified start time.
From here, you can now control the rest of the settings.
The "Seeding Settings" section controls the initial seed value used to generate the children that produce the simulations.
In this section, you can control whether the seed is a fixed value, or a dynamic one.
Since selecting the dynamic parent option will change the seed value every time you change the settings or refresh your chart, there is a "Regenerate" input built into the script.
This input is a dummy input that isn't connected to any of the calculations. The purpose of this input is to force an update of the dynamic parent without affecting the generator or forecast settings.
Note that because we're running a limited number of simulations, different parent seeds will typically yield slightly different forecast ranges.
When using a small number of simulations, you will likely see a higher amount of variance between differently seeded results because smaller numbers of sampled simulations yield a heavier bias.
The more simulations you run, the smaller this variance will become since the outcomes become more convergent toward the same distribution, so the differences between differently seeded forecasts will become more marginal.
When using a dynamic parent, pay attention to the dispersion of ranges.
When you find a set of ranges that is dispersed how you like with your configuration, set your fixed parent value to the parent seed that shows in the info panel.
This will allow you to replicate that dispersion behavior again in the future.
An important thing to note when settings alerts on the plotted levels, or using them as components for signals in other scripts, is to decide on a fixed value for your parent seed to avoid minor repainting due to seed changes.
When the parent seed is fixed, no repainting occurs.
The "Amplitude Settings" section controls the amplitude coefficients for the three differently tailed generators.
These amplitude factors will change the difference series output for each simulation by controlling how aggressively each series moves.
When "Adjust Amplitude Coefficients" is disabled, all three coefficients are set to 1.
Note that if you expect volatility to significantly diverge from its historical values over the forecast interval, try experimenting with these factors to match your anticipation.
The "Weighting Settings" section controls the weighting boundaries for the three generators.
These weighting limits affect how tailed the distributions in each generator are, which in turn affects the final series outputs.
The maximum absolute value range for the weights is . When "Limit Generator Weights" is disabled, this is the range that is automatically used.
The last set of inputs is the "Display Settings", where you can control the visual outputs.
From here, you can select to display either "Forecast" or "Difference Comparison" via the "Output Display Type" dropdown tab.
"Forecast" is the type displayed by default. This plots the end result or developing forecast ranges.
There is an option with this display type to show the developing extremes of the simulations. This option is enabled by default.
There's also an option with this display type to show one of the simulated price series from the set alongside actual prices.
This allows you to visually compare simulated prices alongside the real prices.
"Difference Comparison" allows you to visually compare a synthetic difference series from the set alongside the actual difference series.
This display method is primarily useful for visually tuning the amplitude and weighting settings of the generators.
There are also info panel settings on the bottom, which allow you to control size, colors, and date format for the panel.
It's all pretty simple to use once you get the hang of it. So play around with the settings and see what kinds of forecasts you can generate!
----------
ADDITIONAL NOTES & DISCLAIMERS
Although I've done a number of things within this script to keep runtime demands as low as possible, the fact remains that this script is fairly computationally heavy.
Because of this, you may get random timeouts when using this script.
This could be due to either random drops in available runtime on the server, using too many simulations, or running the simulations over too many bars.
If it's just a random drop in runtime on the server, hide and unhide the script, re-add it to the chart, or simply refresh the page.
If the timeout persists after trying this, then you'll need to adjust your settings to a less demanding configuration.
Please note that no specific claims are being made in regards to this script's predictive accuracy.
It must be understood that this model is based on randomized price generation with assumed constant drift and dispersion from historical data before the starting point.
Models like these not consider the real world factors that may influence price movement (economic changes, seasonality, macro-trends, instrument hype, etc.), nor the changes in sample distribution that may occur.
In light of this, it's perfectly possible for price data to exceed even the most extreme simulated outcomes.
The future is uncertain, and becomes increasingly uncertain with each passing point in time.
Predictive models of any type can vary significantly in performance at any point in time, and nobody can guarantee any specific type of future performance.
When using forecasts in making decisions, DO NOT treat them as any form of guarantee that values will fall within the predicted range.
When basing your trading decisions on any trading methodology or utility, predictive or not, you do so at your own risk.
No guarantee is being issued regarding the accuracy of this forecast model.
Forecasting is very far from an exact science, and the results from any forecast are designed to be interpreted as potential outcomes rather than anything concrete.
With that being said, when applied prudently and treated as "general case scenarios", forecast models like these may very well be potentially beneficial tools to have in the arsenal.
