Monthly Performance Table by Dr. MauryaWhat is this ?
This Strategy script is not aim to produce strategy results but It aim to produce monthly PnL performance Calendar table which is useful for TradingView community to generate a monthly performance table for Own strategy.
So make sure to read the disclaimer below.
Why it is required to publish?:
I am not satisfied with the monthly performance available on TV community script. Sometimes it is very lengthy in code and sometimes it showing the wrong PNL for current month.
So I have decided to develop new Monthly performance or return in value as well as in percentage with highly flexible to adjust row automatically.
Features :
Accuracy increased for current month PnL.
There are 14 columns and automatically adjusted rows according to available trade years/month.
First Column reflect the YEAR, from second column to 13 column reflect the month and 14 column reflect the yearly PnL.
In tabulated data reflects the monthly PnL (value and (%)) in month column and Yearly PnL (value and (%)) in Yearly column.
Various color input also added to change the table look like background color, text color, heading text color, border color.
In tabulated data, background color turn green for profit and red for loss.
Copy from line 54 to last line as it is in your strategy script.
Credit: This code is modified and top up of the open-source code originally written by QuantNomad. Thanks for their contribution towards to give base and lead to other developers. I have changed the way of determining past PnL to array form and keep separated current month and year PnL from array. Which avoid the false pnl in current month.
Strategy description:
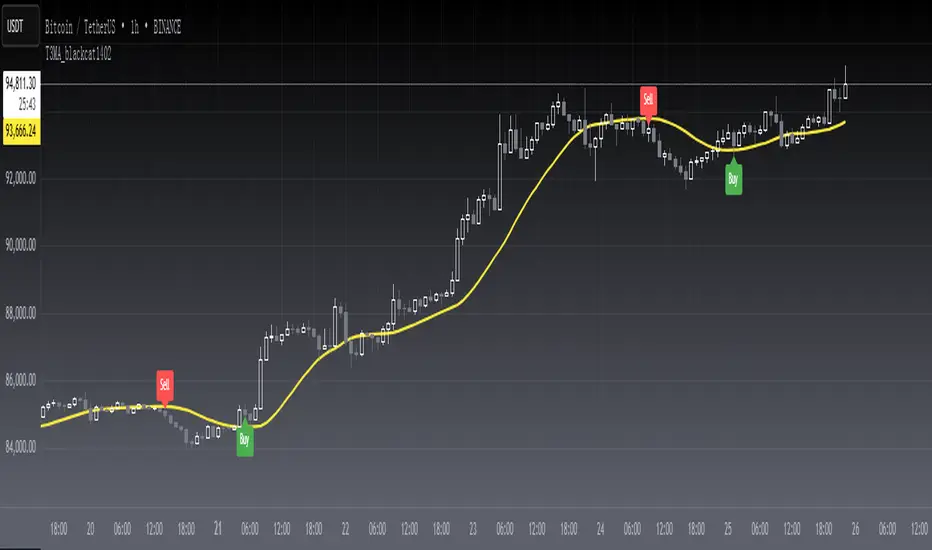
As in first line I said This strategy is aim to provide monthly performance table not focused on the strategy. But it is necessary to explain strategy which I have used here. Strategy is simply based on ADX available on TV community script. Long entry is based on when the difference between DIPlus and ADX is reached on certain value (Set value in Long difference in Input Tab) while Short entry is based on when the difference between DIMinus and ADX is reached on certain value (Set value in Short difference in Input Tab).
Default Strategy Properties used on chart(Important)
This script backtest is done on 1 hour timeframe of NSE:Reliance Inds Future cahrt, using the following backtesting properties:
Balance (default): 500 000 (default base currency)
Order Size: 1 contract
Comission: 20 INR per Order
Slippage: 5 tick
Default setting in Input tab
Len (ADX length) : 14
Th (ADX Threshhold): 20
Long Difference (DIPlus - ADX) = 5
Short Difference (DIMinus - ADX) = 5
We use these properties to ensure a realistic preview of the backtesting system, do note that default properties can be different for various reasons described below:
Order Size: 1 contract by default, this is to allow the strategy to run properly on most instruments such as futures.
Comission: Comission can vary depending on the market and instrument, there is no default value that might return realistic results.
We strongly recommend all users to ensure they adjust the Properties within the script settings to be in line with their accounts & trading platforms of choice to ensure results from the strategies built are realistic.
Disclaimer:
This script not provide indicative of any future results.
This script don’t provide any financial advice.
This strategy is only for the readymade snippet code for monthly PnL performance calender table for any own strategy.
Pine Script®策略