[blackcat] L3 Bullish Grab SignalOVERVIEW
The " L3 Bullish Grab Signal" indicator is designed to identify bullish trends and potential buying opportunities in the market. It uses a combination of moving averages and custom calculations to generate signals. The indicator is set to not overlay on the price chart, meaning it will have its own panel below the main chart, and it updates based on the specified timeframe.
FEATURES
Input Parameters:
shortEmaPeriod: Default value is 13, used for the shorter-term EMA.
longEmaPeriod: Default value is 34, used for the longer-term EMA.
signalEmaPeriod: Default value is 5, used to smooth the difference between the short and long EMAs.
lookbackPeriod: Default value is 60, used to look back over a certain number of bars for specific calculations.
Variable Calculations:
priceWeightedAverage: Calculated as (close * 2 + high + low) / 4 * 10, a custom price point.
shortEma: EMA of priceWeightedAverage over the short period.
longEma: EMA of priceWeightedAverage over the long period.
signalEma: EMA of the difference between shortEma and longEma, smoothed over the signalEmaPeriod.
oscillatorValue: Calculated as 2 * (shortEma - longEma - signalEma) * 5.5, a custom oscillator.
positiveOscillatorValue: Positive part of oscillatorValue, setting negative values to zero.
bullishSignal: True when positiveOscillatorValue increases and was previously negative.
confirmedBullishSignal: True when the bullish signal is confirmed by certain conditions involving the oscillator values and price increases.
priceIncreaseThreshold: Checks if the close price increased by more than 7% from the previous bar.
strongBullishSignal: Combines the bullish signal with the confirmed signal and the price increase threshold.
confirmedStrongBullishSignal: When all conditions for a strong bullish signal are met.
weakBullishSignal: Bullish signal that doesn't meet the strong criteria but still shows some strength.
Plotting:
Oscillator Value: Plots the raw oscillator value in white.
Positive Oscillator Value: Plots only the positive part of the oscillator value in white.
Strong Bullish Signal Stick: Plots a red candlestick when a strong bullish signal is confirmed, using the highest positive oscillator value over the lookback period.
Bullish Signal Stick: Plots a white candlestick for a bullish signal that isn't necessarily strong.
Weak Bullish Signal Stick: Plots a green candlestick for a weak bullish signal.
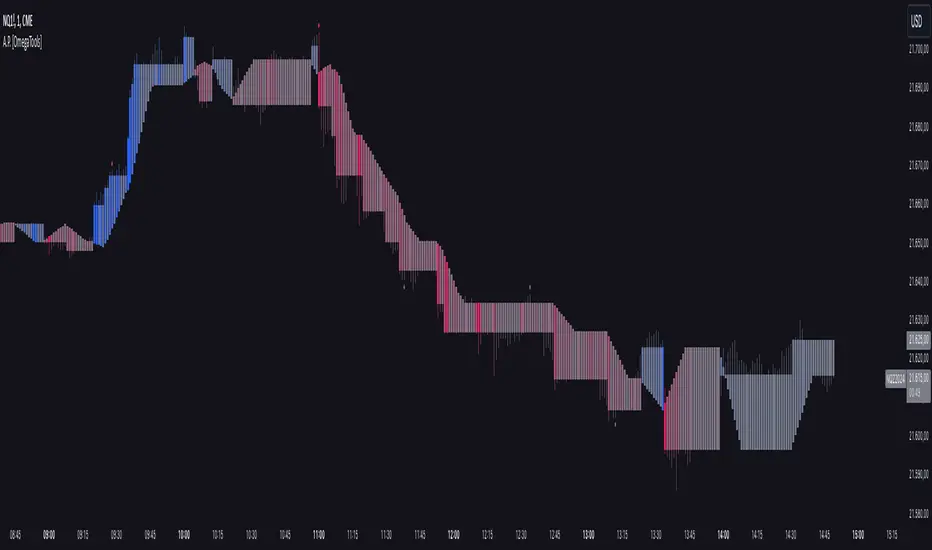
Positive Trend: Plots yellow candlesticks when the oscillator value is positive.
Negative Trend: Plots fuchsia candlesticks when the oscillator value is negative.
Numbers on Candles: Represents the breakout strength as a percentage change in price.
HOW TO USE
Install the Script: Add the script to your TradingView chart.
Customize Inputs:
Adjust the shortEmaPeriod, longEmaPeriod, signalEmaPeriod, and lookbackPeriod as needed.
Interpret the Charts:
Red Candles: Indicate a strong bullish trend, suggesting a potential buying opportunity.
White Candles: Indicate bullish signals that are not as strong but still suggest a buying opportunity.
Green Candles: Indicate weak bullish signals, suggesting a possible buying opportunity but with less confidence.
Yellow Candles: Indicate a positive trend, suggesting the market is in an uptrend.
Fuchsia Candles: Indicate a negative trend, suggesting the market is in a downtrend.
Numbers on Candles: Show the breakout strength as a percentage change in price.
Analyze Trends and Signals:
Use red candles to identify strong bullish signals, especially if the price has increased by more than 7% from the previous bar.
Monitor white and green candles for potential entries with lower confidence.
Avoid trading during fuchsia candles, as the market is in a downtrend.
MARKET MEANING AND TRADING USAGE
Strong Bullish Signal (Red Candles): Indicates a significant price increase and momentum, suggesting a strong buying opportunity.
Bullish Signal (White Candles): Suggests a buying opportunity but with less confidence compared to strong signals.
Weak Bullish Signal (Green Candles): Indicates a possible buying opportunity with even lower confidence.
Positive Trend (Yellow Candles): Suggests the market is in an uptrend.
Negative Trend (Fuchsia Candles): Suggests the market is in a downtrend.
Trading Strategy:
Buy: When a strong bullish signal is confirmed (red candle), especially if the price has increased by more than 7% from the previous bar.
Monitor: Watch for bullish signals (white candles) and weak bullish signals (green candles) for potential entries with lower confidence.
Avoid: During negative trends (fuchsia candles), as the market is in a downtrend.
LIMITATIONS
Simplicity: The implementation is based on a combination of moving averages and custom calculations, which might not capture all aspects of market dynamics.
Close Price Dependency: Uses close prices to determine trends and signals, which might not reflect intrabar price movements and trade imbalances accurately.
Historical Data: The script is based on historical data and does not guarantee future performance.
NOTES
Educational Tool: The script is designed for educational purposes and should not be considered financial advice.
Backtesting: Users are encouraged to backtest the strategy on a demo account before applying it to live trades.
Complementary Use: Best used in conjunction with other indicators and analysis methods for more accurate trading decisions.
THANKS
Special thanks to the TradingView community for their support and feedback.
Pine Script®指標