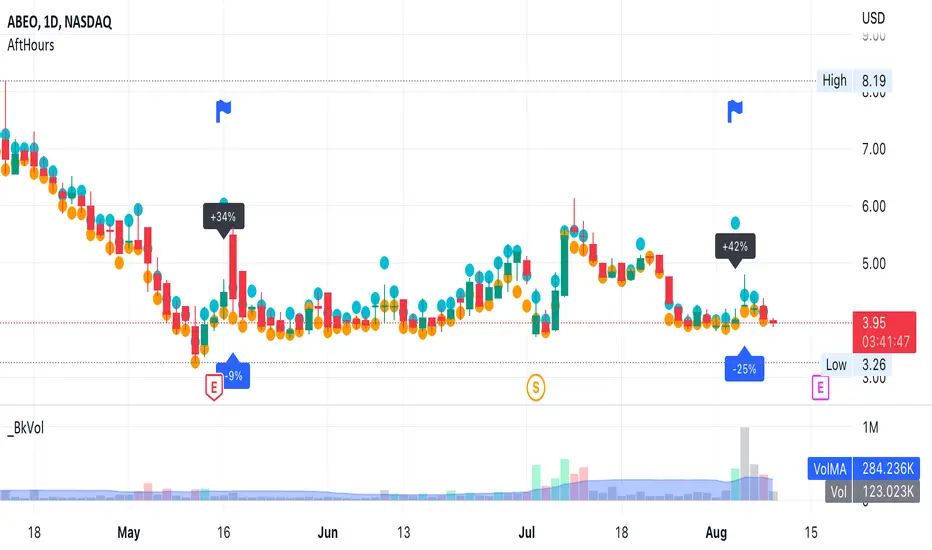
AfterHours Spike DetectorThe script pulls Lower Timeframe (30min) data to draw High/Low of Out-of-hours/AfterHours session (post-market session & next day pre-market session) on the Daily regular session chart. It then identifies significant AfterHours price changes and what happens to these price Spikes by the Open of the next day regular session.
You can change:
wether to show AfterHours High/Lows
wether to show AfterHours price Spikes
the AfterHours price Spike threshold (default = +/- 10%)
在腳本中搜尋"the script"
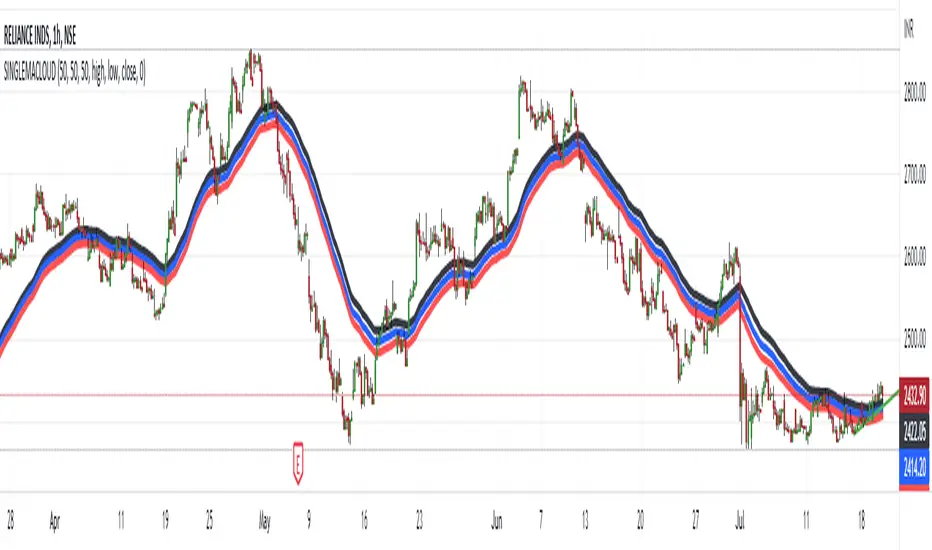
HIGH LOW CLOSE Moving Average ExponentialThe Script is prepared for testing purpose the Added single indicator for getting high low and close.
RSI - S&P Sector ETFsThe script displays RSI of each S&P SPDR Sector ETF
XLB - Materials
XLC - Communications
XLE - Energy
XLF - Financials
XLI - Industrials
XLK - Technology
XLP - Consumer Staples
XLRE - Real Estate
XLU - Utilities
XLV - Healthcare
XLY - Consumer Discretionary
It is meant to identify changes in sector rotation, compare oversold/overbought signals of each sector, and/or any price momentum trading strategy applicable to a trader.

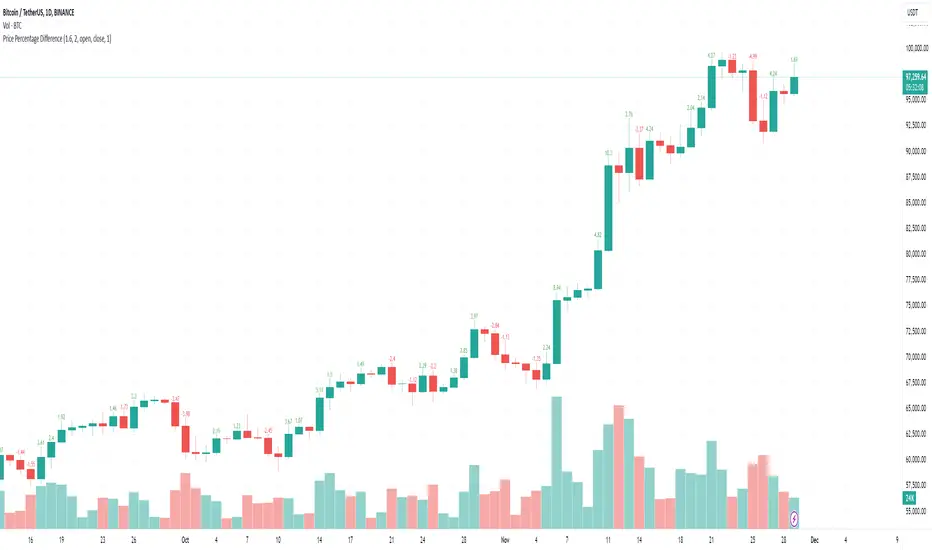
Price Percentage DifferenceThe script prints the percentage difference between open and close. The number of decimals can be between 0 and 5 and is adjustable in the settings.
SOPR SignalThe script uses Glassnode's SOPR on-chain data to identify:
1. Sentiment Trends:
- Green circle on bottom (Bullish) -> Investors are selling in profits
- Red circle on top (Bearish) -> Investors are selling in losses
2. Short-term Entries:
- Small green circle on SOPR (Bullish) -> Approaching investor purchase price in bull run -> not willing to sell -> decrease supply
- Small red circle on SOPR (Bearish) -> Approaching break even price in bear run -> chance to get out -> increase supply
3. Potential Trend Change:
- Yellow circle on top/bottom -> Potential trend changing soon

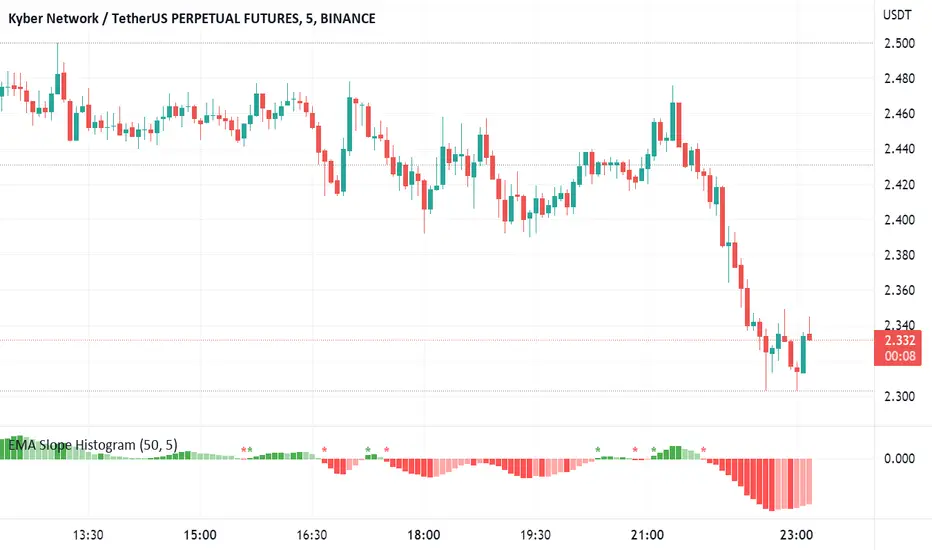
EMA Slope HistogramThe script shows change in a single EMA over a specified period as a histogram. The period of EMA as well as Change period can be specified. Moreover, it also shows change in direction of EMA. The change can be negative for a downward trend and positive for an upward trend.
[_ParkF]Linreg & Trendlines* The script has been uploaded again.
Linear regression and trendline not only facilitate trend identification,
but also identify support and resistance within it,
and linear regression and trendline departure can detect trend changes, which are useful in trading.
Linear regression and trend lines are shown in the chart.
It offers a variety of options, length, color, thickness, on/off switch, etc.
I hope it will help you with your trading.
hope you become rich!
---------------------------------------------------------------------------------------------------------------------------
* 스크립트가 다시 업로드 되었습니다.
선형 회귀(채널) 및 추세선은 추세 식별을 용이하게 할 뿐만 아니라,
또한 그 안에서 지지와 저항을 식별하고,
선형 회귀(채널) 및 추세선 이탈은 거래에 유용한 추세 변화를 감지할 수 있습니다.
선형 회귀(채널) 및 추세선이 차트에 표시됩니다.
길이, 색상, 두께, 온/오프 스위치 등 다양한 옵션을 제공합니다.
거래에 도움이 되셨으면 합니다.
부자되세요!
---------------------------------------------------------------------------------------------------------------------------
* I would like to express my gratitude to zdmre for revealing the linear regression source.

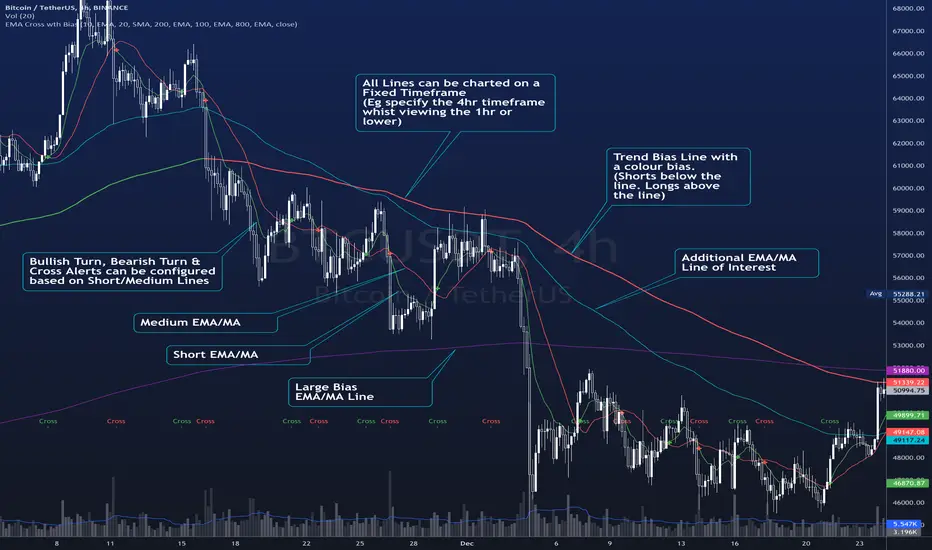
EMA Cross wth BiasThe Script plots 4 Moving averages.
1. Short Moving Average
2. Medium Moving Average
2. Trend Bias (Usually a much slower Moving Average) - Plots in Green when price action is above the line and Red for when price action is below the line.
3. Alerts are triggered when the short MA/ EMA turns. Can be used for Early Entry signals and Exits.
4. Alerts are triggered for Crosses of the Short and Medium MA
Each Moving average line can be confirmed to be a Simple MA or and EMA
Ichimoku Cloud OscillatorThe script looks at how far the price is below or above the ichimoku cloud, and publishes an oscillator.
Low or high oscillator values are indicative of reversals, to assist with long or short entry decisions.

StableF-AdxThe script is ADX-DMI modified verison
-Adx is labeled as Weak trend Below 25 and strong Trend above 25
-Hline is drawn at 25 for better clarification of crossover above 25
-Wait for crossover in +dmi and -dmi and to cross above 25 for any trend clarifcation
-crossover i.e upside cross of +dmi over -dmi is shown buy UP shape
-crossunder i.e downside cross of +dmi over -dmi is Shown buy DN shape
--disclaimer --This is just modified version of Bulit in ADX_DMI indicatior \ NOT advised for buy / Sell purpose

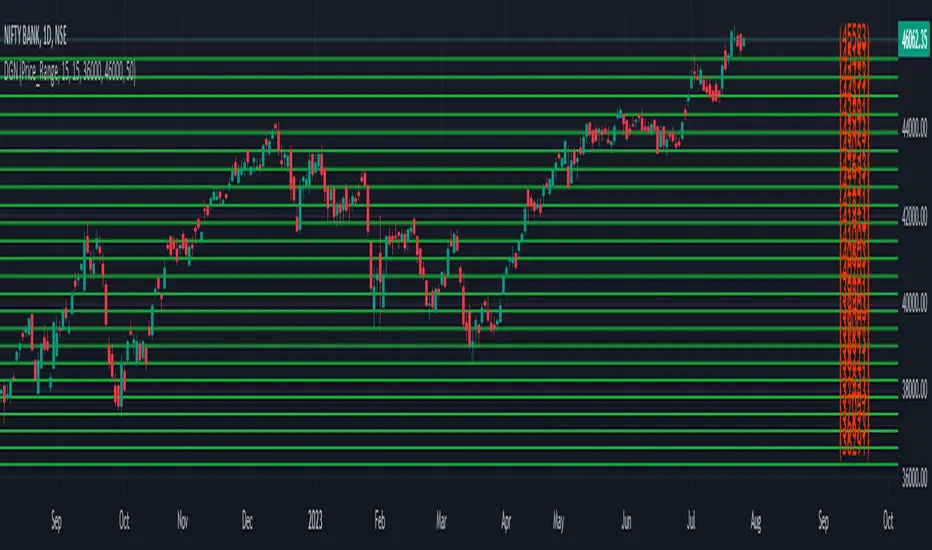
Degree Gann NumbersThe script plots numbers from Cardinal & Ordinal lines of Gann square of 9 for a given range. Inputs required are the degree of cardinal or Ordinal line & Range Min & Max Number.
For example, if we want to plot 45-225-degree Ordinal line numbers from Gann square of 9, on the chart for a range of 50 to 600, Input for the degree will be 45 & Range Min =50 / Range Max = 600
if we want to plot 90-270-degree Cardinal line numbers on the chart for a range of 50 to 600, Input for the degree will be 90 & Range Min =50 / Range Max = 600
VISH_BOTThe script is built with specific logic for BankNifty and would work only for Bank Nifty. A buy or sell signal will be indicated on the bar. The bar wicks should be used as a stop loss.This is meant for scalping and should be used in that trading style though it may at times prove to be postional.

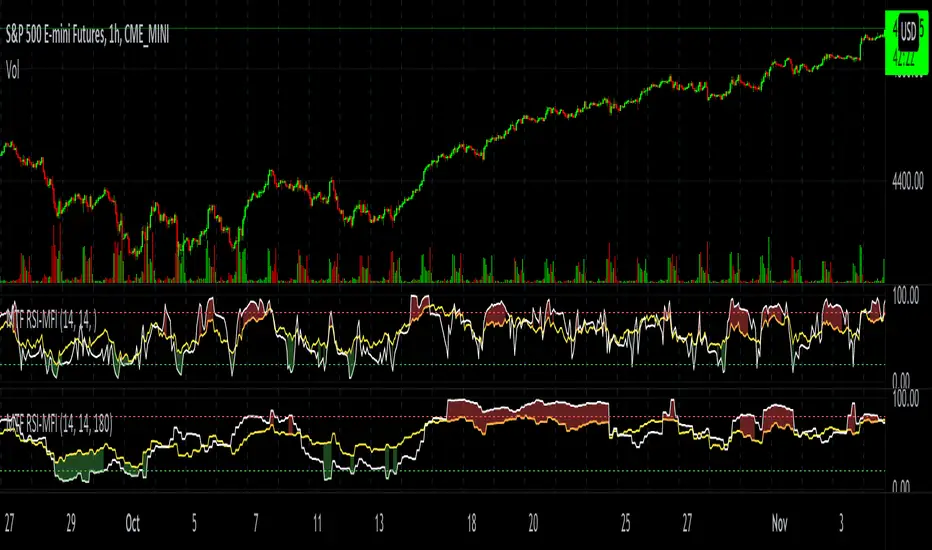
MTF RSI-MFIThe script plots both RSI and MFI of security, automatically highlights oversold and overbought conditions and allows for calculating indicators on timeframes other than the chart.
MTF Bullish/Bearish IndicatorThe script plots a bullish/bearish indicator by evaluating a variety of moving averages for a security across multiple timeframes. It's derived from built in Technical Analysis indicator published by TradingView. The result of evaluation is plotted on the chart in green light/red light format in a configurable location.
evaluated moving averages include
- SMA 10, 20, 30, 50, 100, 200
- EMA 10, 20, 30, 50, 100, 200
- Hull MA 9
- VWMA 20
- Ichimoku Cloud
moving averages are evaluated at chart timeframes and 5 min, 15 min, 30 min, 120 min, 240 min, and daily by default but can be customized.

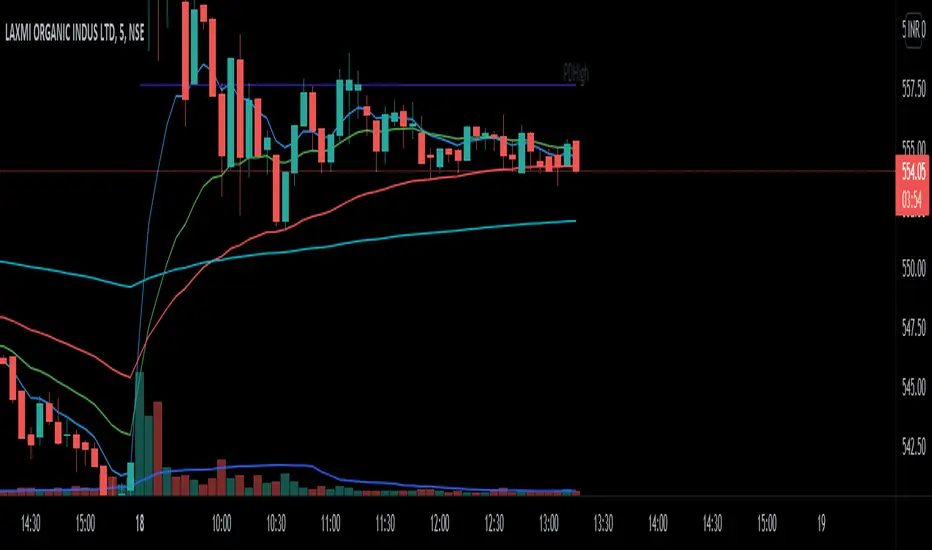
RVC_DecisionPoints By RishabhThe script is a combination of moving averages and previous day low and previous day high.
It can be used for intraday trading and as well as swing trades.
For using intraday I prefer 8 ema and 20 ema to take trades and trail stop losses with 50ema and 200 ema for confirmation.
For swing trades you can always use 50 ema as support to buy on the dip.
The entry is made on the basis of the stock breaks the previous day high or previous day low.
Percent ATRThe script changes the default output of ATR and shows the result based on the percentage. It could be usefull when do you want to know about the percentage of the movement.

Volume Ranges (VSA)The script is intended for volume analysis
It shows if the volume is low, average, high or ultra-high.
Can be applied to any timeframe and any asset.
There're two calculation methods user can choose from:
1. Ranges - it allows to set a lookback period and moving average type to calculate averages
2. Deviations. In this case only one setting is applied - lookback period. Average type is not involved in this calculation method
Play around to figure out which one is better for you
Colors are:
Red - low volume
Green - avg volume
Yellow - high volume
Blue - ultra high volume

No Trading Zone (NZT)The script highlights Frankfurt's opening range up until New York's close. It is described as No Trading Zone in Gabrielle Fabris's The Price in Time book.
Projections of the Frankfurt range are potential supports and resistances and they are used in trade management & for taking profits in his system.
Full rules are not mine to share. You have to read the book to understand his system and run your own backtest on each pair to find out what management method you will be most comfortable with.


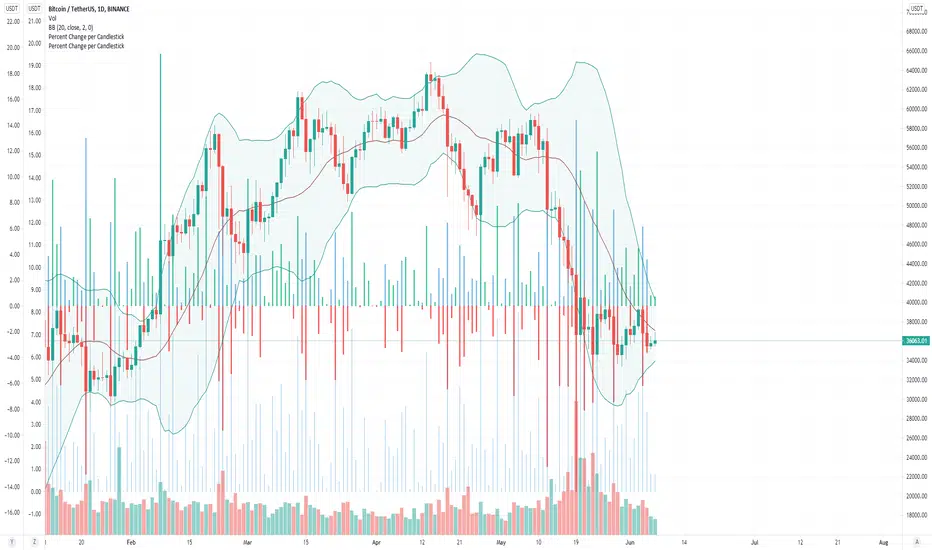
Percent Change per CandlestickThe script has two options: volatility (absolute value of change) and updown which has positive and negatives. That's it. useful for alerts.
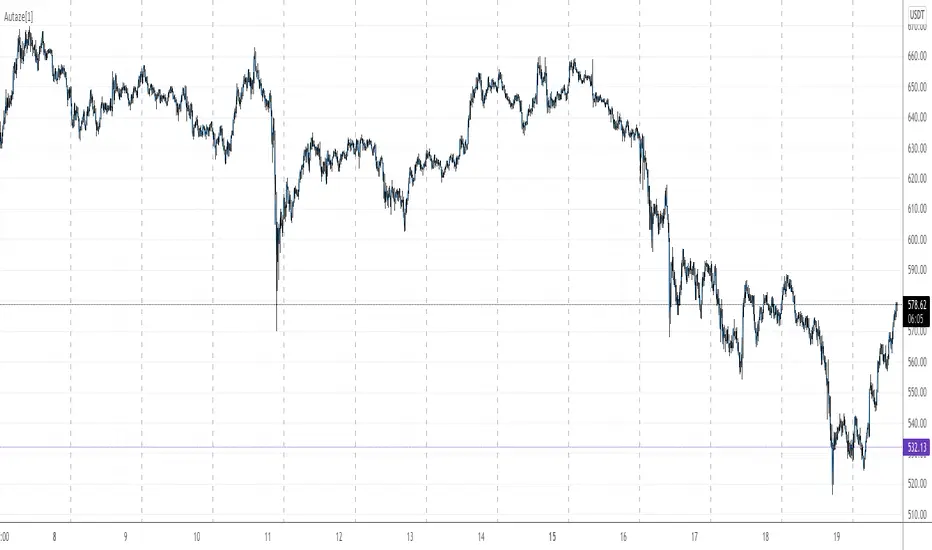
Autaze[1]The script provides clear BUY/SELL signals.
It is equipped with EMA ribbons which in the future I will include in the calculation of the signals itself.
It also has a dynamic support/resistance levels represented by the flags.
In 1-Hour tf, with a target-and-trigger of 2%
In 15-minutes tf, with a target-and-trigger of 1%:
In 5-minutes tf, with a target-and-trigger of 0.5%:
In 1-minute tf, with a target-and-trigger of 0.25%:
The dispersion of volatility indicesThe script is my implementation of "Forecasting a Volatility Tsunami" by Andrew Thrasher (Thrasher Analytics). You can find the paper here: www.researchgate.net
I've changed a bit the approach - instead of two volatility indices (VIX & VVIX), I used two more: VXN and VXD. Additionally, I average the percentiles, but there is an option to swtich it to the original approach.

Correlation overlayThe script is intended to indicate when the correlation between VIX and VVIX gets below 0, on the selecteted security chart. It makes sense to plot it on indicies. This aims to present how the chart of a security looked like when the divergance between VIX and VVIX happened.
