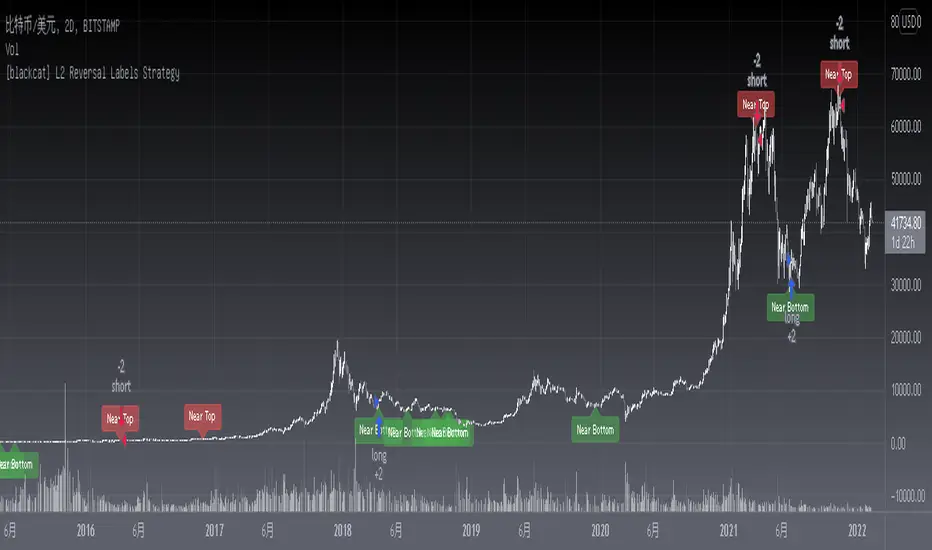
[blackcat] L2 Reversal Labels StrategyLevel: 2
Background
There is a Chinese proverb that says: "The great way leads to simplicity". This indicator is the representative of this meaning. Through the processing of the most common MACD indicator data, it is possible to quickly determine the market price: whether the current price is at a historical high or low, whether a reversal will happen soon, etc. at a glance.
Function
This is the strategy version of the same indicator which performs screening and filtering through the fast and slow line data corresponding to the output of the standard MACD indicator, so as to realize the function of judging the top and bottom of the trend.
Inputs
N/A
Key Signal
Near Top --> Top is reached and reversal may happen soon. (red labels)
Near Bottom --> Bottom is reached and reversal may happen soon. (green labels)
Remarks
The backtest result is picked up and optimized for BTCUSD '2D' time frame, it does not work constantly well for any time frame. You need to combine other indicators for other trading pair and time frame.
You can add alerts for this version.
This is a Level 2 free and open source indicator.
Feedbacks are appreciated.
在腳本中搜尋"top"
Abz BTC InvestorInvestor indicator:
This indicator is intended to be used on a chart showing Bitcoin's historical price action. By viewing years of Bitcoin's history, it's possible to better see Bitcoin's current price within a long term context of the price rage.
Purpose and possible usage:
I built the indicator to make it easier for me and for friends and family to make better informed decisions about our Bitcoin investments. The indicator shows the historic range of the asset and indicates where Bitcoin is oversold (below the bottom line) and overbought (above the top purple line):
- Above the top purple line, I'll look to take some profits or consider hedging to protect my long term position's growth
- Below the bottom purple line, I'll look to dollar cost average into a long term position
I think the idea for this came from idea listening to the YouTuber Birb talking about how well Bitcoin tracked between the 200 day moving average (bottom navy moving average) and 5x that value (top moving average).
Hope you find it useful.
Best wishes,
Abzorba

CHOPORSI
CHOPORSI is a multiindicator.
This indicator help You to recognize potential in or out singal.
Base singals are from Choppines, RSI, AND DMI indicators.
It is a combination of 3 separate indicators like choppines RSI and DMI.
Then our new indicator see like bellow on next image.
Yellow line is sum of CHOP index and RSI , in this case we can say its a CHOPORSI Index.
Green line is DMI- line , this show us strength of sell position on the market.
We schould use other signals, like LSMA 50/100 to improve trend changing. Like on next picture.
Now how this indicator works?
Yellow line is the sum oF Chop and RSI value - 50.
Max and minimum value of CHOP and RSI are the same from 0 to 100.
We have sum of them.
Our minimum signal is 0+0-50=-50
maximum signal is 100+100-50= 150
Most times if both of tem are on top level ( then we have 150) the trend is chanhing from bullish to bearish.
The same way if the RSI ist on 0 and chop is over 50 ( then we have index 0 ) wee changing the tren from bearish to bullish.
Off course it not every time. We see other signals, to take our risk self not sugested by some art of indicators.
But if we are abowe topline, witch is set to 85 we can sey, we have have oversold signal.
Underline 30 isour potentialy buy signal.
Midrange 50 is mostly trand changin line.
This valu of top, mid bottom line you can change on the setting.
Every Coin have another level of this lines, and need to be checked individual to the coin.
Standard, settings are set fo timeframe : 12 min. 24 min, 1H and 4 H >
Blue crosses signalize possibilities trend changing.
This picture shou us how this indicator works.
Buy long signal : If yellow line is mostly at the bottom and green mostly on the top.
Sell long signal l. Yellow -top , green -bottom.
The Green line is from Directional Movement Index and is - DI line. Its show us selling trend. even higher position then mor sell of .
Standard value of CHOPPINES is 14 , works fin on 1H and abowe also wit the value of 28
Standard value for RSI AND -DI unchanging 14.
I tjink this is a simplu helpfull indycator.
WARNING!!! IF YOU AT THIS POINT CANT UNDERSUD THIS INDICATOR, PLEASE DONT USE THEM .
Signal, schould be confirmed with other indicators like MA, EMA even better with LSMA .
Please try it an make only paper trading, to undertand how its realy works.
Thank You!

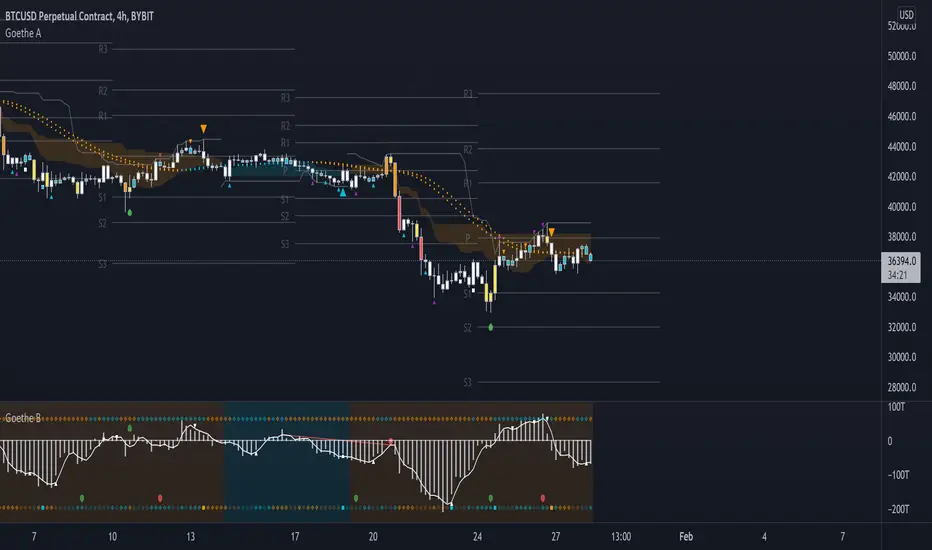
Goethe B - Mutiple Leading Indicator PackageGoethe B is an Indicator Package that contains multiple leading and lagging indicators.
The background is that shows the local trend is calculated by either two Moving Averages or by a Kumo Cloud. By default the Kumo Cloud calculation is used.
What is the main oscillator?
- The main oscillator is TSV, or time segmented volume. It is one of the more interesting leading indicators.
What is the top bar?
-The top bar shows a trend confirmation based on the wolfpack ID indicator.
What are those circles on the second top bar?
-Those are Divergences of an internally calculated PVT oscillator. Red for Regular-Bearish, Green for Regular-Bullish.
What are those circles on the main oscillator?
-These are Divergences. Red for Regular-Bearish. Orange for Hidden-Bearish. Green for Regular-Bullish. Aqua for Hidden-Bullish.
What are those circles on the second lower bar?
-Those are Divergences of an internally calculated CCI indicator. Red for Regular-Bearish, Green for Regular-Bullish.
What is the lower bar?
-The lower bar shows a trend confirmation based on the Acceleration Oscillator, in best case it showes how far in the trend the current price action is.
What are those orange or aqua squares?
- These are TSI (true strength indicator) entry signals . They are calculated by the TSI entry signal, the TSI oscillator threshold.
Most settings of the indicator package can be modified to your liking and based on your chosen strategy might have to be modified. Please keep in mind that this indicator is a tool and not a strategy, do not blindly trade signals, do your own research first! Use this indicator in conjunction with other indicators to get multiple confirmations.
Logger Library For Pinescript (Logging and Debugging)Library "LoggerLib"
This is a logging library for Pinescript. It is aimed to help developers testing and debugging scripts with a simple to use logger function.
Pinescript lacks a native logging implementation. This library would be helpful to mitigate this insufficiency.
This library uses table to print outputs into its view. It is simple, customizable and robust.
You can start using it's .log() method just like any other logging method in other languages.
//////////////////
USAGE
//////////////////
-- Recommended: Please Read The Documentation From Source Code Below. It Is Much More Readable There And Will Be Updated Along With Newer Versions. --
Importing the Library
---------------------
import paragjyoti2012/LoggerLib/ as Logger
.init() : Initializes the library and returns the logger pointer. (Later will be used as a function parameter)
.initTable: Initializes the Table View for the Logger and returns the table id. (Later will be used as a function parameter)
parameters:
logger: The logger pointer got from .init()
max_rows_count: Number of Rows to display in the Logger Table (default is 10)
offset: The offset value for the rows (Used for scrolling the view)
position: Position of the Table View
Values could be:
left
right
top-right
(default is left)
size: Font Size of content
Values could be:
small
normal
large
(default is small)
hide_date: Whether to hide the Date/Time column in the Logger (default is false)
returns: Table
example usage of .initTable()
import paragjyoti2012/LoggerLib/1 as Logger
var logger=Logger.init()
var logTable=Logger.initTable(logger, max_rows_count=20, offset=0, position="top-right")
-------------------
LOGGING
-------------------
.log() : Logging Method
params: (string message, |string| logger, table table_id, string type="message")
logger: pass the logger pointer from .init()
table_id: pass the table pointer from .initTable()
message: The message to log
type: Type of the log message
Values could be:
message
warning
error
info
success
(default is message)
returns: void
///////////////////////////////////////
Full Boilerplate For Using In Indicator
///////////////////////////////////////
P.S: Change the | (pipe) character into square brackets while using in script (or copy it from the source code instead)
offset=input.int(0,"Offset",minval=0)
size=input.string("small","Font Size",options=|"normal","small","large"|)
rows=input.int(15,"No Of Rows")
position=input.string("left","Position",options=|"left","right","top-right"|)
hide_date=input.bool(false,"Hide Time")
import paragjyoti2012/LoggerLib/1 as Logger
var logger=Logger.init()
var logTable=Logger.initTable(logger,rows,offset,position,size,hide_date)
rsi=ta.rsi(close,14)
|macd,signal,hist|=ta.macd(close,12,26,9)
if(ta.crossunder(close,34000))
Logger.log("Dropped Below 34000",logger,logTable,"warning")
if(ta.crossunder(close,35000))
Logger.log("Dropped Below 35000",logger,logTable)
if(ta.crossover(close,38000))
Logger.log("Crossed 38000",logger,logTable,"info")
if(ta.crossunder(rsi,20))
Logger.log("RSI Below 20",logger,logTable,"error")
if(ta.crossover(macd,signal))
Logger.log("Macd Crossed Over Signal",logger,logTable)
if(ta.crossover(rsi,80))
Logger.log("RSI Above 80",logger,logTable,"success")
////////////////////////////
// For Scrolling the Table View
////////////////////////////
There is a subtle way of achieving nice scrolling behaviour for the Table view. Open the input properties panel for the table/indicator. Focus on the input field for "Offset", once it's focused, you could use your mouse scroll wheel to increment/decrement the offset values; It will smoothly scroll the Logger Table Rows as well.
/////////////////////
For any assistance using this library or reporting issues, please write in the comment section below.
I will try my best to guide you and update the library. Thanks :)
/////////////////////

[blackcat] L2 Reversal LabelsLevel: 2
Background
There is a Chinese proverb that says: "The great way leads to simplicity". This indicator is the representative of this meaning. Through the processing of the most common MACD indicator data, it is possible to quickly determine the market price: whether the current price is at a historical high or low, whether a reversal will happen soon, etc. at a glance.
Function
This indicator performs screening and filtering through the fast and slow line data corresponding to the output of the standard MACD indicator, so as to realize the function of judging the top and bottom of the trend.
Inputs
N/A
Key Signal
Near Top --> Top is reached and reversal may happen soon. (red labels)
Near Bottom --> Bottom is reached and reversal may happen soon. (green labels)
Remarks
This is a Level 2 free and open source indicator.
Feedbacks are appreciated.

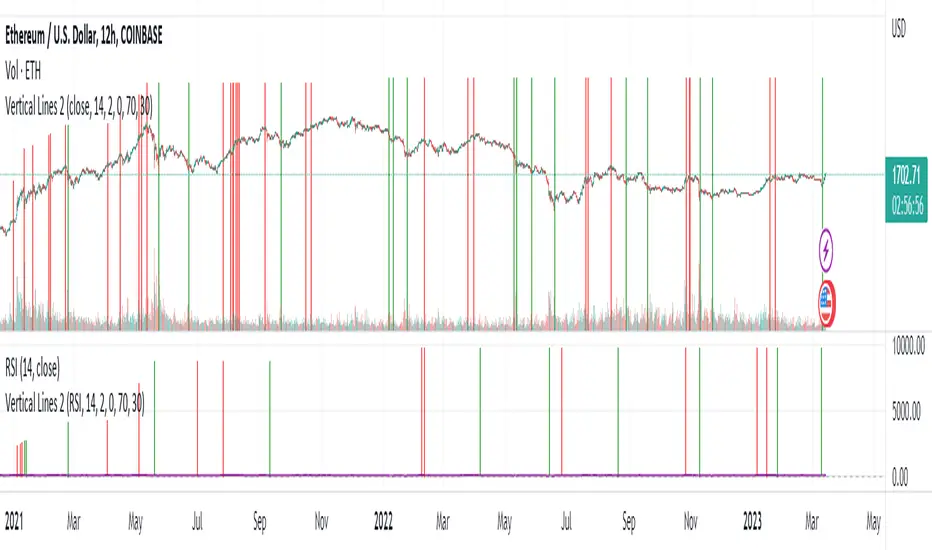
Vertical LinesThis script plots vertical lines on charts or indicators. Unfortunately pinescript is lacking a vertical line plotting function. Vertical lines are useful to mark events, such as crossover of levels, indicators signals or as a time marker.
After searching the internet for a long time and trying different scripts, this script is the simplest and visually the best. You would think that plotting a vertical line would be relatively easy, it is not! I thank the unknow author for sharing this solution and now I will share it on tradingview to make it readily available to anybody that needs it.
RSI crossover signals are used as an example in this script. When the RSI crosses over 70 or below 30, the script plots a red or green vertical line.
The script plots a vertical line as a histogram bar. The histogram bar must have a height.
Setting the height near infinity like 1e20 will cover all the ranges from top to bottom in most charts, but doesn't work all the time. If the chart range is small in values, the line is not plotted or the chart is visually compressed because the top of the bar is also a data point in the chart. Another solution is to find the highest point in the chart and multiply it by a number from 2 to 10 to set the top of the histogram bar. But this solution doesn't work if the line is drawn in the indicator window. additionally if the chart or indicator includes negative values, a histogram bar with a negative height must be concatenated to the histogram bar with a positive height to cover the positive and negative range.
It would seem intuitive to include a vertical plot function since it is very useful and pinescript already has a horizontal line plot function called Hline. But pinescript is becoming less intuitive, and redundant. A case in point is Version 4 variable declaration and naming, it less intuitive and more redundant than previous versions. I beg Tradingview to adopt a more refined scripting language such as Matlab or Python for charting purposes. These languages can be easily ported to other analysis programs for AI or statistical analysis.
Wick Bodies [vnhilton]I noticed that changing the colour of the wicks through TradingView settings changes the colours of both the top and bottom wicks. I also noticed that the thickness of wicks couldn't be changed either so they remained very hard to see when zoomed out of charts. Wicks have the potential to show zones where price rejects from - this is useful for identifying potential support and resistance zones.
I created an alternative solution to this problem by creating bodies for the wicks. It's recommended that you hide the wicks so it shows candles as bars split into 3 segments (top segment representing top wick; middle segment representing candle; bottom segment representing bottom wick). Colours are customizable. Also includes borders for the wick bodies.

LeoLibraryLibrary "LeoLibrary"
A collection of custom tools & utility functions commonly used with my scripts
getDecimals() Calculates how many decimals are on the quote price of the current market
Returns: The current decimal places on the market quote price
truncate(float, float) Truncates (cuts) excess decimal places
Parameters:
float : _number The number to truncate
float : _decimalPlaces (default=2) The number of decimal places to truncate to
Returns: The given _number truncated to the given _decimalPlaces
toWhole(float) Converts pips into whole numbers
Parameters:
float : _number The pip number to convert into a whole number
Returns: The converted number
toPips(float) Converts whole numbers back into pips
Parameters:
float : _number The whole number to convert into pips
Returns: The converted number
av_getPositionSize(float, float, float, float) Calculates OANDA forex position size for AutoView based on the given parameters
Parameters:
float : _balance The account balance to use
float : _risk The risk percentage amount (as a whole number - eg. 1 = 1% risk)
float : _stopPoints The stop loss distance in POINTS (not pips)
float : _conversionRate The conversion rate of our account balance currency
Returns: The calculated position size (in units - only compatible with OANDA)
getMA(int, string) Gets a Moving Average based on type
Parameters:
int : _length The MA period
string : _maType The type of MA
Returns: A moving average with the given parameters
getEAP(float) Performs EAP stop loss size calculation (eg. ATR >= 20.0 and ATR < 30, returns 20)
Parameters:
float : _atr The given ATR to base the EAP SL calculation on
Returns: The EAP SL converted ATR size
barsAboveMA(int, float) Counts how many candles are above the MA
Parameters:
int : _lookback The lookback period to look back over
float : _ma The moving average to check
Returns: The bar count of how many recent bars are above the MA
barsBelowMA(int, float) Counts how many candles are below the MA
Parameters:
int : _lookback The lookback period to look back over
float : _ma The moving average to reference
Returns: The bar count of how many recent bars are below the EMA
barsCrossedMA(int, float) Counts how many times the EMA was crossed recently
Parameters:
int : _lookback The lookback period to look back over
float : _ma The moving average to reference
Returns: The bar count of how many times price recently crossed the EMA
getPullbackBarCount(int, int) Counts how many green & red bars have printed recently (ie. pullback count)
Parameters:
int : _lookback The lookback period to look back over
int : _direction The color of the bar to count (1 = Green, -1 = Red)
Returns: The bar count of how many candles have retraced over the given lookback & direction
getBodySize() Gets the current candle's body size (in POINTS, divide by 10 to get pips)
Returns: The current candle's body size in POINTS
getTopWickSize() Gets the current candle's top wick size (in POINTS, divide by 10 to get pips)
Returns: The current candle's top wick size in POINTS
getBottomWickSize() Gets the current candle's bottom wick size (in POINTS, divide by 10 to get pips)
Returns: The current candle's bottom wick size in POINTS
getBodyPercent() Gets the current candle's body size as a percentage of its entire size including its wicks
Returns: The current candle's body size percentage
isHammer(float, bool) Checks if the current bar is a hammer candle based on the given parameters
Parameters:
float : _fib (default=0.382) The fib to base candle body on
bool : _colorMatch (default=false) Does the candle need to be green? (true/false)
Returns: A boolean - true if the current bar matches the requirements of a hammer candle
isStar(float, bool) Checks if the current bar is a shooting star candle based on the given parameters
Parameters:
float : _fib (default=0.382) The fib to base candle body on
bool : _colorMatch (default=false) Does the candle need to be red? (true/false)
Returns: A boolean - true if the current bar matches the requirements of a shooting star candle
isDoji(float, bool) Checks if the current bar is a doji candle based on the given parameters
Parameters:
float : _wickSize (default=2) The maximum top wick size compared to the bottom (and vice versa)
bool : _bodySize (default=0.05) The maximum body size as a percentage compared to the entire candle size
Returns: A boolean - true if the current bar matches the requirements of a doji candle
isBullishEC(float, float, bool) Checks if the current bar is a bullish engulfing candle
Parameters:
float : _allowance (default=0) How many POINTS to allow the open to be off by (useful for markets with micro gaps)
float : _rejectionWickSize (default=disabled) The maximum rejection wick size compared to the body as a percentage
bool : _engulfWick (default=false) Does the engulfing candle require the wick to be engulfed as well?
Returns: A boolean - true if the current bar matches the requirements of a bullish engulfing candle
isBearishEC(float, float, bool) Checks if the current bar is a bearish engulfing candle
Parameters:
float : _allowance (default=0) How many POINTS to allow the open to be off by (useful for markets with micro gaps)
float : _rejectionWickSize (default=disabled) The maximum rejection wick size compared to the body as a percentage
bool : _engulfWick (default=false) Does the engulfing candle require the wick to be engulfed as well?
Returns: A boolean - true if the current bar matches the requirements of a bearish engulfing candle
timeFilter(string, bool) Determines if the current price bar falls inside the specified session
Parameters:
string : _sess The session to check
bool : _useFilter (default=false) Whether or not to actually use this filter
Returns: A boolean - true if the current bar falls within the given time session
dateFilter(int, int) Determines if this bar's time falls within date filter range
Parameters:
int : _startTime The UNIX date timestamp to begin searching from
int : _endTime the UNIX date timestamp to stop searching from
Returns: A boolean - true if the current bar falls within the given dates
dayFilter(bool, bool, bool, bool, bool, bool, bool) Checks if the current bar's day is in the list of given days to analyze
Parameters:
bool : _monday Should the script analyze this day? (true/false)
bool : _tuesday Should the script analyze this day? (true/false)
bool : _wednesday Should the script analyze this day? (true/false)
bool : _thursday Should the script analyze this day? (true/false)
bool : _friday Should the script analyze this day? (true/false)
bool : _saturday Should the script analyze this day? (true/false)
bool : _sunday Should the script analyze this day? (true/false)
Returns: A boolean - true if the current bar's day is one of the given days
atrFilter(float, float) Checks the current bar's size against the given ATR and max size
Parameters:
float : _atr (default=ATR 14 period) The given ATR to check
float : _maxSize The maximum ATR multiplier of the current candle
Returns: A boolean - true if the current bar's size is less than or equal to _atr x _maxSize
fillCell(table, int, int, string, string, color, color) This updates the given table's cell with the given values
Parameters:
table : _table The table ID to update
int : _column The column to update
int : _row The row to update
string : _title The title of this cell
string : _value The value of this cell
color : _bgcolor The background color of this cell
color : _txtcolor The text color of this cell
Returns: A boolean - true if the current bar falls within the given dates

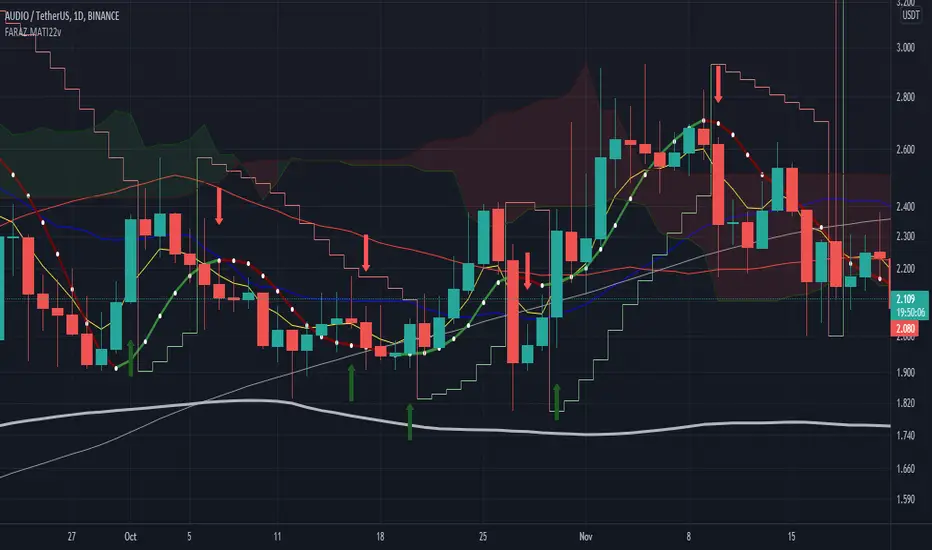
FARAZ.MATI20vA personal indicator.
This indicator has the following features :
Thanks to the managers and administrators of TradingView site for the appropriate space with wide facilities for optimal use. All (indicators) were available on the site and I only defined certain settings for them.
FARAZ.MATI20v
EMA: 5
SMA : 20
SMA : 50
Collision and interruption of Moving 20 by Moving 5 can be the beginning of an upward trend. Provided that the Moving 5 is placed under the candles. (The best signal for the Moving 5 is to collide with the Moving 20 under the candles). Also, the collision of the Moing 5 with the Moing 20 on top of the candles can be a sign of falling. Especially if this collision occurs above the candles.The cut of the Moving 20 and the Moving 50 indicate the intensity of the wave. If Moving 20 is above Moving 50 in this collision, it shows the intensity of the uptrend and if it is below Moving 50, it shows the intensity of the downtrend.
SMA : 100
SMA : 200
Both (resistance and support) are very strong, which is very effective in larger timeframes (such as 1 day).
HMA : 20
To determine the entry point. In such a way that whenever the seeds (HMA) are below the candlesticks. 3 seeds are in ascending position. The body of the candle and the shadow should not touch them. It can be a good signal to enter. Also if the seeds are placed on top of the candlesticks. Show the descending direction of 3 seeds. Provided that the body of the candle and the shadow have not hit them. It is a signal for the short position.
SAR : With the applied settings, it is a kind (trending view) that can evaluate the volume of input to any currency much sooner and determine the probability of rising or falling. If our wave lines (stairs) are at the bottom of the candles, it means an upward trend, and if they are at the top of the candles, it means a downward trend. As the volume of inputs increases, the trend increases, and as the volume of inputs decreases, the trend will also decrease.
Ichimoku Cloud : To determine the lines (support and resistance) the peaks formed by the cloud can represent a resistance area. Price To cross the area marked by the Ichimoku cloud must have a strong candle. This can be very effective in determining the point of entry and purchase.
zig zag : For better diagnosis of the process. Using it to determine areas of support and resistance can be useful. Determining the points of the Fibonacci table is also very effective.
ZenLibraryLibrary "ZenLibrary"
A collection of custom tools & utility functions commonly used with my scripts.
getDecimals() Calculates how many decimals are on the quote price of the current market
Returns: The current decimal places on the market quote price
truncate(float, float) Truncates (cuts) excess decimal places
Parameters:
float : _number The number to truncate
float : _decimalPlaces (default=2) The number of decimal places to truncate to
Returns: The given _number truncated to the given _decimalPlaces
toWhole(float) Converts pips into whole numbers
Parameters:
float : _number The pip number to convert into a whole number
Returns: The converted number
toPips(float) Converts whole numbers back into pips
Parameters:
float : _number The whole number to convert into pips
Returns: The converted number
av_getPositionSize(float, float, float, float) Calculates OANDA forex position size for AutoView based on the given parameters
Parameters:
float : _balance The account balance to use
float : _risk The risk percentage amount (as a whole number - eg. 1 = 1% risk)
float : _stopPoints The stop loss distance in POINTS (not pips)
float : _conversionRate The conversion rate of our account balance currency
Returns: The calculated position size (in units - only compatible with OANDA)
getMA(int, string) Gets a Moving Average based on type
Parameters:
int : _length The MA period
string : _maType The type of MA
Returns: A moving average with the given parameters
getEAP(float) Performs EAP stop loss size calculation (eg. ATR >= 20.0 and ATR < 30, returns 20)
Parameters:
float : _atr The given ATR to base the EAP SL calculation on
Returns: The EAP SL converted ATR size
barsAboveMA(int, float) Counts how many candles are above the MA
Parameters:
int : _lookback The lookback period to look back over
float : _ma The moving average to check
Returns: The bar count of how many recent bars are above the MA
barsBelowMA(int, float) Counts how many candles are below the MA
Parameters:
int : _lookback The lookback period to look back over
float : _ma The moving average to reference
Returns: The bar count of how many recent bars are below the EMA
barsCrossedMA(int, float) Counts how many times the EMA was crossed recently
Parameters:
int : _lookback The lookback period to look back over
float : _ma The moving average to reference
Returns: The bar count of how many times price recently crossed the EMA
getPullbackBarCount(int, int) Counts how many green & red bars have printed recently (ie. pullback count)
Parameters:
int : _lookback The lookback period to look back over
int : _direction The color of the bar to count (1 = Green, -1 = Red)
Returns: The bar count of how many candles have retraced over the given lookback & direction
getBodySize() Gets the current candle's body size (in POINTS, divide by 10 to get pips)
Returns: The current candle's body size in POINTS
getTopWickSize() Gets the current candle's top wick size (in POINTS, divide by 10 to get pips)
Returns: The current candle's top wick size in POINTS
getBottomWickSize() Gets the current candle's bottom wick size (in POINTS, divide by 10 to get pips)
Returns: The current candle's bottom wick size in POINTS
getBodyPercent() Gets the current candle's body size as a percentage of its entire size including its wicks
Returns: The current candle's body size percentage
isHammer(float, bool) Checks if the current bar is a hammer candle based on the given parameters
Parameters:
float : _fib (default=0.382) The fib to base candle body on
bool : _colorMatch (default=false) Does the candle need to be green? (true/false)
Returns: A boolean - true if the current bar matches the requirements of a hammer candle
isStar(float, bool) Checks if the current bar is a shooting star candle based on the given parameters
Parameters:
float : _fib (default=0.382) The fib to base candle body on
bool : _colorMatch (default=false) Does the candle need to be red? (true/false)
Returns: A boolean - true if the current bar matches the requirements of a shooting star candle
isDoji(float, bool) Checks if the current bar is a doji candle based on the given parameters
Parameters:
float : _wickSize (default=2) The maximum top wick size compared to the bottom (and vice versa)
bool : _bodySize (default=0.05) The maximum body size as a percentage compared to the entire candle size
Returns: A boolean - true if the current bar matches the requirements of a doji candle
isBullishEC(float, float, bool) Checks if the current bar is a bullish engulfing candle
Parameters:
float : _allowance (default=0) How many POINTS to allow the open to be off by (useful for markets with micro gaps)
float : _rejectionWickSize (default=disabled) The maximum rejection wick size compared to the body as a percentage
bool : _engulfWick (default=false) Does the engulfing candle require the wick to be engulfed as well?
Returns: A boolean - true if the current bar matches the requirements of a bullish engulfing candle
isBearishEC(float, float, bool) Checks if the current bar is a bearish engulfing candle
Parameters:
float : _allowance (default=0) How many POINTS to allow the open to be off by (useful for markets with micro gaps)
float : _rejectionWickSize (default=disabled) The maximum rejection wick size compared to the body as a percentage
bool : _engulfWick (default=false) Does the engulfing candle require the wick to be engulfed as well?
Returns: A boolean - true if the current bar matches the requirements of a bearish engulfing candle
timeFilter(string, bool) Determines if the current price bar falls inside the specified session
Parameters:
string : _sess The session to check
bool : _useFilter (default=false) Whether or not to actually use this filter
Returns: A boolean - true if the current bar falls within the given time session
dateFilter(int, int) Determines if this bar's time falls within date filter range
Parameters:
int : _startTime The UNIX date timestamp to begin searching from
int : _endTime the UNIX date timestamp to stop searching from
Returns: A boolean - true if the current bar falls within the given dates
dayFilter(bool, bool, bool, bool, bool, bool, bool) Checks if the current bar's day is in the list of given days to analyze
Parameters:
bool : _monday Should the script analyze this day? (true/false)
bool : _tuesday Should the script analyze this day? (true/false)
bool : _wednesday Should the script analyze this day? (true/false)
bool : _thursday Should the script analyze this day? (true/false)
bool : _friday Should the script analyze this day? (true/false)
bool : _saturday Should the script analyze this day? (true/false)
bool : _sunday Should the script analyze this day? (true/false)
Returns: A boolean - true if the current bar's day is one of the given days
atrFilter(float, float) Checks the current bar's size against the given ATR and max size
Parameters:
float : _atr (default=ATR 14 period) The given ATR to check
float : _maxSize The maximum ATR multiplier of the current candle
Returns: A boolean - true if the current bar's size is less than or equal to _atr x _maxSize
fillCell(table, int, int, string, string, color, color) This updates the given table's cell with the given values
Parameters:
table : _table The table ID to update
int : _column The column to update
int : _row The row to update
string : _title The title of this cell
string : _value The value of this cell
color : _bgcolor The background color of this cell
color : _txtcolor The text color of this cell
Returns: A boolean - true if the current bar falls within the given dates
HarmonicPatternLibrary "HarmonicPattern"
Functions to detect/check harmonic patterns from provided values.
line_price_rate(point_c, point_b, point_a) Compute the price rate of the line AB divided by the the line BC
Parameters:
point_c : float, the price at point C.
point_b : float, the price at point B.
point_a : float, the price at point A.
Returns: float
line_time_rate(_c, _b, _a) Compute the time rate of the line AB divided by the the line BC
Parameters:
_c : float, the time or bar_index at point C.
_b : float, the time or bar_index at point B.
_a : float, the time or bar_index at point A.
Returns: float
is_inrange(value, min, max) Check if value is within min/max range of tolerance.
Parameters:
value : float, value to check tolerance.
min : float, minimum value in range of tolerance.
max : float, maximum value in range of tolerance.
Returns: bool
isHarmonicTriangle(rate_cba, margin_of_error) Check if the rate(s) correspond to pattern ("Harmonic Triangle").
Parameters:
rate_cba : float, percent rate of the triangle CBA. expects a negative rate.
margin_of_error : float, percent rate of expected error margin, default 0.05(5%).
Returns: bool
is2Tap(rate_cba, margin_of_error) Check if the rate(s) correspond to pattern ("2Tap", 'Double Top / Bottom').
Parameters:
rate_cba : float, percent rate of the triangle CBA. expects a negative rate.
margin_of_error : float, percent rate of expected error margin, default 0.05(5%).
Returns: bool
is3Tap(rate_edc, rate_cba, margin_of_error) Check if the rate(s) correspond to pattern ("3Tap", "Triple Top / Bottom").
Parameters:
rate_edc : float, percent rate of the triangle EDC. expects a negative rate.
rate_cba : float, percent rate of the triangle CBA. expects a negative rate.
margin_of_error : float, percent rate of expected error margin, default 0.05(5%).
Returns: bool
is4Tap(rate_gfe, rate_edc, rate_cba, margin_of_error) Check if the rate(s) correspond to pattern ("4Tap", "Quadruple Top / Bottom").
Parameters:
rate_gfe : float, percent rate of the triangle GFE. expects a negative rate.
rate_edc : float, percent rate of the triangle EDC. expects a negative rate.
rate_cba : float, percent rate of the triangle CBA. expects a negative rate.
margin_of_error : float, percent rate of expected error margin, default 0.05(5%).
Returns: bool
isABCD(rate_cba, rate_dcb, margin_of_error) Check if the rate(s) correspond to pattern ("AB=CD").
Parameters:
rate_cba : float, percent rate of the triangle CBA. expects a negative rate.
rate_dcb : float, percent rate of the triangle DCB. expects a negative rate.
margin_of_error : float, percent rate of expected error margin, default 0.05(5%).
Returns: bool
isBat(rate_edc, rate_dcb, rate_cba, rate_eda, margin_of_error) Check if the rate(s) correspond to pattern ("Bat").
Parameters:
rate_edc : float, percent rate of the triangle EDC. expects a negative rate.
rate_dcb : float, percent rate of the triangle DCB. expects a negative rate.
rate_cba : float, percent rate of the triangle CBA. expects a negative rate.
rate_eda : float, percent rate of the triangle EDA. expects a negative rate.
margin_of_error : float, percent rate of expected error margin, default 0.05(5%).
Returns: bool
isButterfly(rate_edc, rate_dcb, rate_cba, rate_eda, margin_of_error) Check if the rate(s) correspond to pattern ("Butterfly").
Parameters:
rate_edc : float, percent rate of the triangle EDC. expects a negative rate.
rate_dcb : float, percent rate of the triangle DCB. expects a negative rate.
rate_cba : float, percent rate of the triangle CBA. expects a negative rate.
rate_eda : float, percent rate of the triangle EDA. expects a negative rate.
margin_of_error : float, percent rate of expected error margin, default 0.05(5%).
Returns: bool
isGartley(rate_edc, rate_dcb, rate_cba, rate_eda, margin_of_error) Check if the rate(s) correspond to pattern ("Gartley").
Parameters:
rate_edc : float, percent rate of the triangle EDC. expects a negative rate.
rate_dcb : float, percent rate of the triangle DCB. expects a negative rate.
rate_cba : float, percent rate of the triangle CBA. expects a negative rate.
rate_eda : float, percent rate of the triangle EDA. expects a negative rate.
margin_of_error : float, percent rate of expected error margin, default 0.05(5%).
Returns: bool
isCrab(rate_edc, rate_dcb, rate_cba, rate_eda, margin_of_error) Check if the rate(s) correspond to pattern ("Crab").
Parameters:
rate_edc : float, percent rate of the triangle EDC. expects a negative rate.
rate_dcb : float, percent rate of the triangle DCB. expects a negative rate.
rate_cba : float, percent rate of the triangle CBA. expects a negative rate.
rate_eda : float, percent rate of the triangle EDA. expects a negative rate.
margin_of_error : float, percent rate of expected error margin, default 0.05(5%).
Returns: bool
isShark(rate_edc, rate_dcb, rate_cba, rate_eda, margin_of_error) Check if the rate(s) correspond to pattern ("Shark").
Parameters:
rate_edc : float, percent rate of the triangle EDC. expects a negative rate.
rate_dcb : float, percent rate of the triangle DCB. expects a negative rate.
rate_cba : float, percent rate of the triangle CBA. expects a negative rate.
rate_eda : float, percent rate of the triangle EDA. expects a negative rate.
margin_of_error : float, percent rate of expected error margin, default 0.05(5%).
Returns: bool
is5o(rate_edc, rate_dcb, rate_cba, rate_eda, margin_of_error) Check if the rate(s) correspond to pattern ("5o").
Parameters:
rate_edc : float, percent rate of the triangle EDC. expects a negative rate.
rate_dcb : float, percent rate of the triangle DCB. expects a negative rate.
rate_cba : float, percent rate of the triangle CBA. expects a negative rate.
rate_eda : float, percent rate of the triangle EDA. expects a negative rate.
margin_of_error : float, percent rate of expected error margin, default 0.05(5%).
Returns: bool
isWolfe(rate_edc, rate_dcb, rate_cba, rate_eda, margin_of_error) Check if the rate(s) correspond to pattern ("Wolfe").
Parameters:
rate_edc : float, percent rate of the triangle EDC. expects a negative rate.
rate_dcb : float, percent rate of the triangle DCB. expects a negative rate.
rate_cba : float, percent rate of the triangle CBA. expects a negative rate.
rate_eda : float, percent rate of the triangle EDA. expects a negative rate.
margin_of_error : float, percent rate of expected error margin, default 0.05(5%).
Returns: bool
is3Driver(rate_edc, rate_dcb, rate_cba, rate_eda, margin_of_error) Check if the rate(s) correspond to pattern ("3 Driver").
Parameters:
rate_edc : float, percent rate of the triangle EDC. expects a negative rate.
rate_dcb : float, percent rate of the triangle DCB. expects a negative rate.
rate_cba : float, percent rate of the triangle CBA. expects a negative rate.
rate_eda : float, percent rate of the triangle EDA. expects a negative rate.
margin_of_error : float, percent rate of expected error margin, default 0.05(5%).
Returns: bool
isConTria(rate_edc, rate_dcb, rate_cba, rate_eda, margin_of_error) Check if the rate(s) correspond to pattern ("Contracting Triangle").
Parameters:
rate_edc : float, percent rate of the triangle EDC. expects a negative rate.
rate_dcb : float, percent rate of the triangle DCB. expects a negative rate.
rate_cba : float, percent rate of the triangle CBA. expects a negative rate.
rate_eda : float, percent rate of the triangle EDA. expects a negative rate.
margin_of_error : float, percent rate of expected error margin, default 0.05(5%).
Returns: bool
isExpTria(rate_edc, rate_dcb, rate_cba, rate_eda, margin_of_error) Check if the rate(s) correspond to pattern ("Expanding Triangle").
Parameters:
rate_edc : float, percent rate of the triangle EDC. expects a negative rate.
rate_dcb : float, percent rate of the triangle DCB. expects a negative rate.
rate_cba : float, percent rate of the triangle CBA. expects a negative rate.
rate_eda : float, percent rate of the triangle EDA. expects a negative rate.
margin_of_error : float, percent rate of expected error margin, default 0.05(5%).
Returns: bool
isHnS(rate_fed, rate_feb, rate_edc, rate_dcb, rate_cba, rate_eda, margin_of_error) Check if the rate(s) correspond to pattern ("Head and Shoulders").
Parameters:
rate_fed : float, percent rate of the triangle FED. expects a negative rate.
rate_feb : float, percent rate of the triangle FEB. expects a negative rate.
rate_edc : float, percent rate of the triangle EDC. expects a negative rate.
rate_dcb : float, percent rate of the triangle DCB. expects a negative rate.
rate_cba : float, percent rate of the triangle CBA. expects a negative rate.
rate_eda : float, percent rate of the triangle EDA. expects a negative rate.
margin_of_error : float, percent rate of expected error margin, default 0.05(5%).
Returns: bool
+ ATR Support and ResistanceThis, a very different script from most of mine, is my attempt at making a useful, and not messy, support and resistance indicator. If you've never looked into trader xkavalis, and his scripts and discord, I would highly recommend it. He talks about "pay attention candles" a lot. It got me thinking about what those are. Best as I can tell all he means by that phrase is large, impulsive candles. Sometimes these lead to break outs of ranges, or they may signal tops, bottoms, or near-tops and bottoms. The only way I could make sense of this in a mathematical way was by using the average true range. Basically, any candle's true range outside of the ATR is considered a "pay attention candle," by my definition.
This script originally began as just a candle coloring exercise with some optional shapes plotted above/below certain candles, but I quickly realized I wanted to draw lines or zones from these candles, so eventually, after many hours spent figuring out and learning 'line.new' and 'box.new' I got things sorted.
Essentially, my line of thinking is that on impulsive candles down, the origin of the impulse is more important than the close (not always of course, as there are no unbreakable rules in what markets can do), and with impulsive candles up, the same theory applies.
So, for upward impulsive candles I've marked out the zone from the open to the low as a support (until broken, in which case it may become resistance). For downward impulsive candles the zone encompasses the open to the high. I've given the option to plot a line from the close for all of these. It's turned off by default as it's just less stuff on the chart, but you may like it.
The line length is customizable in a menu. It does funny things on low timeframes on forex and stock charts (long lines that result in chart compression), but for some reason very rarely on crypto charts. If someone who is smart (not me) and has much experience with pinescript could perhaps help me out with a fix for this, that would be great. I suspect it has something to do with my "bar_index_duration" that I defined using the time function, but I'm not sure how or why.
Line length on time frames of one hour and up it is typically fine.
Use the ATR multiple to change the sensitivity of the indicator. This is basically the determination of when a candle is beyond the ATR. A multiple of two is two times the ATR. With lower volatile pairs you can maybe make this lower. On lower time frames or with more volatile pairs (illiquid alts in particular) a higher multiple might serve better. I find the default 1.75 is mostly acceptable.
As I started this I also thought adding some sort of volume information to the candles might be useful as well, so I added a simple candle coloring feature referencing the OBV and a 21 period EMA. Candles are colored based on the OBV's relation to its moving average.
I added some plot shapes and candle coloring utilizing the RSI as well. Options to turn on or off shapes plotted for overbought and oversold across the top of the chart. The most interesting feature that I implemented here is a support/resistance zone around the centerline of the RSI. If the RSI is between 49 and 51 then you can have optional candle coloring, shapes plotted above the candles, and s/r zones drawn on the chart. In trending markets the centerline of the RSI will frequetly act as support or resistance, so by being alerted of this condition on the chart you can use that with actual levels marked off in order to help make a judgement on a trade. I think it's a nice addition, and an oft overlooked aspect of the usefulness of the RSI.
I've also included a calculation, with candle coloring and/or plot shapes, for something like a stop run on high volume. The calculation for that is in its section below, and should be pretty self explanatory.
Lastly, typing this as I'm posting it, this indicator could also be useful for helping to find placement for trailing a stop. Just a thought!

Bollinger Bands + Moving Average (BBMA Oma Ally)Found this strategy in babypips forums.babypips.com
This strategy using BB and MA
BBMA Oma Ally Trading Technique
I’m just sharing this Forex Technique that helping me making positive result.
In BBMA, BB (Bollinger Bands) act as Dynamic Support and Resistance.
SETTING OF BBMA - BOLLINGER BANDS
Period : 20
Deviations : 2
Shift : 0
Apply to : Close
Style : Dodge Blue
MA (Moving Average) are used to detect potential entry point.
SETTING OF BBMA - MOVING AVERAGE
Ma5 Hi
Period : 5
Ma Method : Linear Weighted
Apply to : High
Style : Red
Ma10 Hi
Period : 10
Ma Method : Linear Weighted
Apply to : High
Style : Yellow
Ma5 Low
Period : 5
Ma Method : Linear Weighted
Apply to : Low
Style : Magenta
Ma10 Low
Period : 10
Ma Method : Linear Weighted
Apply to : Low
Style : White
Ma50
Period : 50
Ma Method : Exponential
Apply to : Close
Style : Lime
.
EXTREM (SIGNAL)
Extrem is an early signal to say the Market journey is beginning to end - but not yet confirmed
Will only confirm when there is a reversal candle.
Extrem is not valid when there is a CS momentum, although Ma outside BB.
CHARACTERISTICS OF EXTREM
Ma out of Top / Low BB (will not valid if there is cs momentum, although Ma is outside BB)
Reverse candle must exist, as it indicates the journey of a Market is ending (not necessarily 1 or 2 cs)
Retest candle (entry point)
Entry at Highest or Lowest volume
Entry retest candle at Ma5 or body candle
MHV (LOSS VOLUME MARKET) (SETUP)
It is a setup for the beginning of long distance Market journey
This setup gives a validation for the Extrem signal earlier
It is to show the loss of strength for the market.
MHV is valid once CSA (direction candle) appear
***If the candle close NOT above or below Top / Low BB after the first Reentry, after MHV there is a directional candlestick, then there will be a reentry and after the reentry there is no momentum “COMPULSORY TP”
CHARACTERISTICS OF MHV :
Candle CANNOT close above or below Top / Low BB
Must have reverse candle, because reverse candle is confirming the end of the journey (Marking at candle body)
Retest candle (entry point) at Ma5 or highest volume / lowest at that current time
Must happen after Extrem
TYPES OF MHV
5 types but i can only post 1 photo. So sorry i cant give more on this.
RE-ENTRY
CHARACTERISTICS OF REENTRY
Candle close can not pass Ma5 / Ma10
It will be strong when the candle close does not pass Ma5 / Ma10 and also Mid BB
Candle close did not come in. He found Ma5 / Ma10 and mid BB at that Time would make the re-entry stronger
If there is a re-entry in Ma5 / Ma10 and mid BB, the minimum of 3 drops of candles or increments (follow TF) re-entry will be strong
Following market trend, then just search for re-entry and entry
Wait for the second candle, because the first candle validates the reentry and the second candle is for entry

BankNifty Multi-TimeFrames Price Panel [MaestroTrader]█ OVERVIEW
Price Panel provides Nifty /BankNifty Index comprehensive Price Insights on different time intervals. It helps to determine the trend of Index using top Index Heavy Weights along with Dow, India VIX & Index Spot Prices. It helps to determine the price behavior of the underlying Index/stock to make informed decisions while trading.
█ FEATURES
a) Displays Price in Multi Time Frames for Multi time frame analysis
b) Displays Weighted Securities price for Weighted INDEX price analysis.
c) Displays INDIA VIX and DOW for Combined INDIX VOLATALITY Analysis
█ MUTLI TIME FRAME ANALYSIS
How to use Multiple time frame analysis?
Multiple time frame analysis follows a top-down approach when trading and allows traders to gauge the longer-term trend while spotting ideal entries on a smaller time frame. Traders can then conduct technical analysis using multiple time frames to confirm or reject their trading bias.
Multiple time frame analysis, is the process of viewing the same symbols under different time frames. Usually, the larger time frame is used to establish a longer-term trend, while a shorter time frame is used to spot ideal entries into the market.
Let’s Say 75 & 15 TF’s Trend is up, then shorter time 5M is used to spot ideal entries on long side.
█ WEIGHTED INDEXS PRICE ANALYSIS
How to use Weighted Index Price Movement in Multi timeframes?
The index future trading price is based on the trading prices of the individual securities (stocks) that comprise the index basket. In other words, the stocks with higher weights will have more impact on the movement of the index. Price Panel provides the insights of these heavy weight stock price movement in different time frames, that can help you confirm or reject your trading bias.
HDFC Bank (28% Weight) will have more impact on the BankNifty Movement. By looking the top 4 bank's price movement in different timeframes, you can derive the BankNifty price trend.
█ VOLATALITY ANALYSIS
India VIX is a short form for India Volatility Index. It is the volatility index that measures the market’s expectation of volatility over the near term.
A lower VIX level usually implies that the market is confident about the movement and is expecting lower volatility and a stable range.
A higher VIX level usually signals high volatility and lower trader confidence about the current range of the market. A major directional move can be expected in the market and a quick broadening of range can be expected.
█ SETTINGS
• Time Frame Settings: Configure Time Frames 5 Min, 15 Min, 75 Min
• Table Settings: Configure Table Styles- Position- Font Color
• Symbol Settings: Configure Securities. Toggle (on/Off) Securities display.
• Index Settings: Display Bank Nifty or Nifty Heavy Weights.
█ PANEL DISPLAY VARIATIONS
BANK NIFTY VIEW
NIFTY VIEW
WITHOUT STOCKS - ONLY INDEX, VIX, DOW
█ THANKS
Thanks to Pine Team for this new great feature tables & Thanks to PineCoders for the `f_strRightOf` function.
█ DISCLIAMER
Indicator is built for educational purposes. Test it before use.
Hope - These features help you get quick insights of the price movement to take informed trades.
You are free to use the code, please share the credit for reuse.
Happy Trading !!

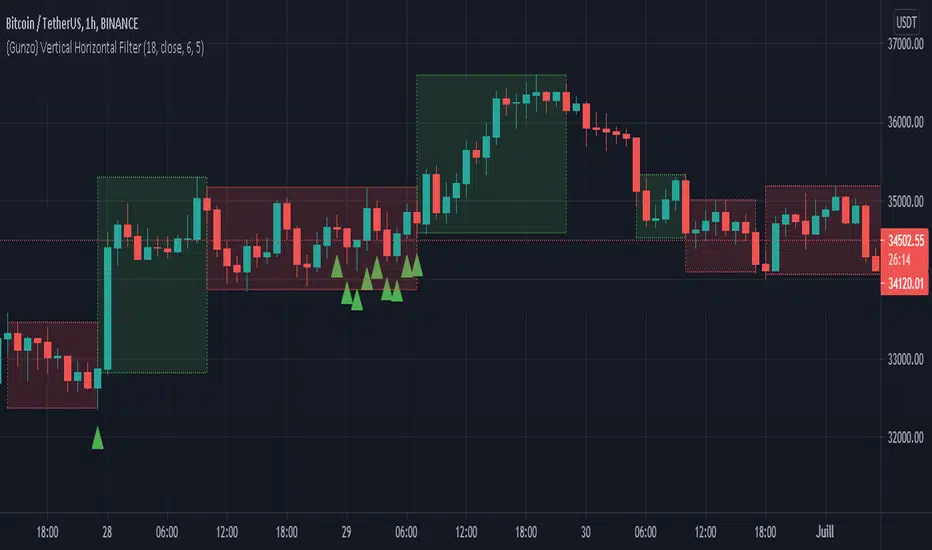
{Gunzo} Vertical Horizontal Filter (Trading ranges)Vertical Horizontal Filter indicator is a tool that can be used to identify market conditions (ranging or trending). It measures if the price is going vertical (uni-directional) or horizontal (non-directional).
OVERVIEW :
The Vertical Horizontal Filter is a technical analysis indicator created by Adam White in 1991. He described it in the “Issues of Futures” magazine for the first time. The indicator is only composed of one line that measures the level of trend activity.
If the VHF line is increasing, we consider that the trend is getting stronger (up-trend or down-trend). Otherwise, if the VHF line is decreasing, we consider that the trend is weakening (going sideways or even ranging) as the market is getting calmer
CALCULATION :
The level of trend activity is calculated as the ratio between the distance from the highest to the lowest value (on the last N days) and the movement of the closing price.
VHF = ( highest (high) – lowest (low) ) / sum( close – previous close)
SETTINGS :
VHF length : Length of the vertical horizontal filter (28 or 18 recommended)
VHF source : Source of the vertical horizontal filter (close recommended)
VHF smoothing length : Extra smoothing applied on the VHF line to filter noise (1 or 6 or 9 or 14 recommended)
Display ranging market rectangles : Display rectangles on the chart around the area where VHF is decreasing (ranging market)
Display trending market rectangles : Display rectangles on the chart around the area where VHF is increasing (trending market up or down)
Minimum rectangle size : Hide rectangles that are smaller than X candles
Display signal line : Display circles at the bottom of the chart with the raw VHF direction (green if increasing /red if decreasing)
Display VHF tops and bottoms : Display triangles if the VHF line is reaching a new high or new low over the last 100 candles. When consecutive triangles appear, it may be a sign that the current market conditions are ending. Green triangles mean the possible end of the ranging market and red triangles mean the possible end of the trending market.
VISUALIZATIONS :
This indicator has 3 possible visualizations :
Rectangles : the rectangles are drawn on areas where the VHF is decreasing (red) or increasing (green) for a minimum number of consecutive candles. The first candles of an area may not be representative of the market conditions as the VHF line is still in extreme values but going slowly in the opposite direction. The market conditions (ranging or trending) get stronger with the VHF line keeping the same direction.
Signal line : The signal line is the VHF raw data : the red circle is a decreasing VHF line, and the green circle is an increasing VHF line.
Tops and bottoms : The tops and bottoms are signals indicating that the VHF line is reaching extreme values, there is a high probability that the market conditions are going to change after that.
USAGE :
This indicator can be used as a filter for strategies based on other technical analysis indicators.
If you are using trending indicators like moving averages, you should consider using them only when the market is trending. You can use VHF increasing to confirm that the market is not ranging.
If you are using oscillating indicators like stochastic or commodity channel index, you may prefer using them when the market is ranging as trending indicators may not be useful. You can use the VHF decreasing to confirm that the market is ranging.
Alt Golden Ratio by USCG_VetPine Script math based on the medium article by Philip Swift.
Idea based from Willy Woo Charts.
Disclaimer: None of this Pine Script, Title, nor Description should be used for Financial Advice. For Education Purposes Only.
Purpose: Identify a Golden Ratio Cross of the 350 Daily MA vs the 111 Daily MA with Multiplier to theorize where local valuation tops or bottoms could be approximated. NOT FINANCIAL ADVICE!
Parameters:
DMA A: short Daily Moving Average
DMA B: long Daily Moving Average
Golden Ratio: point where short Daily Moving Average crosses value assigned in parameter.
Indicators:
S2: Cross of DMA A vs DMA B in upward direction (approximate local top)
Sn: additional approximate top indicators
Sell1: first approximate local bottom
Selln: additional approximate local bottom indicators
GR: Golden-Ratio Cross of DMA A

Box Trade with RenatoTrade with Renato contains 3 tackled, Ichimoku Cloud, Various Moving Averages and Bollinger Bands.
This strategy is simple and effective, always looking for clearer entry signals to trade.
Description:
Long
Conversion Line crossing Ichimoku Baseline from bottom to top, Start at candlestick low after crossing!
Conversion Line Crossing Bollinger Band Base, End!
STOP on the Bottom Line of the Band.
Short
Conversion Line crossing Ichimoku Baseline from top to bottom, Start at candlestick low after crossing!
Conversion Line Crossing Bollinger Band Base, End!
STOP at the Top Line of the Band.
Settings:
You can edit as colors in the indicator settings and select the media you want to use.
Also the possibility to activate in settings such as Bollinger bands.
There is also the possibility to edit as medium media.
You can also disable or enable Ichimoku Cloud
----------------------------------------------------------------------------------------------------------------------------------------------------------------------------------
Trade with Renato contém 3 estratégias, Nuvem de Ichimoku, Diversas Médias Móveis e Bandas de Bollinger.
Essa estratégia é simples e eficaz, procurando sempre sinais de entradas mais claros para o trade.
Descrição:
Long
Conversion Line cruzando a Base Line Ichimoku de baixo para cima, Início na minima do candle após cruzamento!
Conversion Line cruzando a Base da Banda de Bollinger, Fim!
STOP na Linha Inferior da Banda.
Short
Conversion Line cruzando a Base Line Ichimoku de cima para baixo, Início na minima do candle após cruzamento!
Conversion Line cruzando a Base da Banda de Bollinger, Fim!
STOP Na Linha Superior da Banda.
Configuração:
Você pode editar as cores nas configurações do indicador e selecione as medias que deseja usar.
Também a possibilidade de ativar nas configurações, as Bandas de bollinger .
Há também a possibilidade de editar as médias moveís.
Você também pode desativar ou ativar a Nuvem de Ichimoku

{Gunzo} Bulls Power vs. Bears PowerBulls Power vs. Bears Power is a unique tool that displays on each candle the balance between the bears (sellers) and the bulls (buyers).
OVERWIEW :
This indicator is mainly based on the popular indicator “Elder ray” made by Dr. Alexander Elder in 1989. This indicator has been developed in order to determine the strength of the competing groups of buyers and sellers in the markets.
CALCULATION :
To measure the competing power of bulls and bears, the indicator compares the current high (maximum power of the bulls) and current low (maximum power of the bears) to the average price using a exponential moving average.
Bull Power = Current High – EMA 13 (closing)
Bear Power = Current Low – EMA 13 (closing)
This Elder ray indicator can also tell us more information about market conditions :
If the current high and current low are above the EMA 13, the bulls are totally in control on the market
If the current high and current low are under the EMA 13, the bears are totally in control of the market
If the EMA 13 is in between of the current high and current low, there is strong fight about controlling the market, there is possible reversal in this configuration
SETTINGS :
Fast MA Period : Fast moving average period (only used for buy sell signal)
Slow MA Period : Slow moving average period (only used for buy sell signal)
Display candle labels : Show/hide candle labels on the chart
Display only bear labels above X : Exclude all top candle labels on the chart below the value specified.
Display only bull labels above X : Exclude all bottom candle labels on the chart below the value specified.
Display opposite values : Show all candle labels on top (bearish) and bottom (bullish) or only show the candle labels for the winning force on the candle.
Display box for last candle : Show/hide the dominance boxes (red and blue) after last candle showing the last bear and bull power.
Display box after X candles : How many candles in the future the dominance boxes should be displayed.
Display slow / fast crossover (o) : Display crossover signals (circles) between fast line and slow line.
Display bear / bull fighting (x) : Display fighting signals (crosses) between bull and bears.
VISUALIZATIONS :
This indicator has 3 possible complementary visualizations:
Candle labels : The labels on top are the percentage of the bears on the candle, while the labels on the bottom are the percentage of the bulls on the candle. When the bulls are winning the labels are blue, when the bears are winning the labels are red, silver otherwise.
Box after last candle : The blue and red boxes after the last candle are the percentage of bears and bulls on the last candle of the chart. That boxes can be disabled in the settings if you feel it is redundant with the labels.
Signals : The signals are displayed at the bottom of the main area of trading. The orange “x” represents an area where bulls and bears are fighting hard. The blue “o” represents a buy signal (fast line crosses over the slow line) and the red “o” represents a sell sinal (fast line crosses under the slow line).
USAGE :
The most important rule in the usage of this indicator is :
“The higher the current bull power is (or bear power), the higher the chances are the next candle will also be bullish (or bearish).”
When the prices is increasing, it is very interesting to follow the bull power to verify that it is either stable or increasing. If the bull power keeps decreasing candle after candle, there is chances that in the next candles there will be a reversal.
When there is orange crosses in the signal area (bottom of the screen), it means that there is a big fight between bulls and bears and that the current price of the asset is probably stable. During these fighting areas, reversals are more likely to happen.
When there is a blue circle in the signal area (or red signal), it can be considered as a buy signal (or sell signal). These signals are determined by the crossover of the fast and slow lines of the total power of the bulls plus the bears.
LIMITATIONS :
As Pine script only allows to display about 50 drawings on the chart, the labels on the candles can not be printed on all the historical candles. The option “Display opposites” could be useful to hide unnecessary labels and then be able to display more older labels.
As the Elder ray indicator uses an average price (EMA 13 of closing price), the indicator may be lagging in some situations, but most of the time it will help to filter the bad signals contrary to the indicators that are too reactive.

Donchian Channel - trend filterTrend filter created based on donchian channel. I am using my custom donchian channel as base for this indicator:
Concept is simple.
We count how many times price is hitting donchian channel top or bottom without hitting the other side and keep counter for both. Thus:
upCount is the number of times price hits donchian channel top without hitting bottom
downCount is the number of times price hits donchian channel bottom without hittin top
trendCountLimit is the minimum value of upCount or downCount to call it uptrend or downtrend.

Gann Circle Swing LevelsThis indicator is based on W. D. Gann's Square of 9 Chart and can be interpreted as the Gann Circle / Gann Wheel / 360 Degree Circle Chart or Square of the Circle Chart.
Spiral arrangement of numbers on the Square of 9 chart creates a very unique square root relationship amongst the numbers on the chart. If you take any number on the Square of 9 chart, take the square root of the number, then add 2 to the root and re-square it, resulting in one full 360 degree cycle (i.e. a 360 degree Circle) out from the center of the chart.
For example,
the square root of 121 = 11,
11 + 2 = 13,
and the square of 13 = 169
The number 169 is one full 360 degree cycle out (with reference to 121) from the center of the Square of 9 chart.
Similarly, if you take any number on the Square of 9 chart, take the square root of the number, then subtract 2 from the root and re-square it, resulting in one full 360 degree inward rotation towards the center of the chart.
For example,
the square root of 565 = 23.77,
23.77 - 2 = 21.77,
and the square of 21.77 = 473.93 (approximately equal to 474, which is directly below 565 on the Square of 9 chart)
The number 474 is one full 360 degree inward rotation (with reference to 565) towards the center of the chart.
How to Use this Indicator ?
This indicator is useful for finding coordinate squares on the Gann Circle that are making hard aspects to a previous position (such as a significant top or bottom) on the circle.
Input :
Swing Point (Significant price point, such as a top or a bottom)
Low / High ? (Is it a bottom or a top)
Number of Gann Levels (Number of Gann Cycles to be projected)
Output :
Gann Support or Resistance Levels (color coded as follows) :
Swing High or Swing Low (BLUE)
Support levels calculated with reference to the Swing High (RED)
Resistance levels calculated with reference to the Swing Low (LIME)

Easy TrendThis signal is completely based on analysis and transformation of a single simple moving average. As with all signals and indicators, it should be combined with others.
This is how the signal is built:
1. First it takes the SMA of the closing price.
2. It then takes the ROC of that SMA using a length of 1.
3. It takes an 8-period SMA and also a 64-period SMA of that ROC.
4. These are plotted as follows:
- the ROC is plotted in green when above 0 (trending up) and red when below 0 (trending down).
- the 8-period SMA is plotted as a thin white line within the ROC signal
- the 64-period SMA is plotted as a thick white line within the ROC signal
When the trendline is green, this is a bullish zone. When the trendline is red, this is a bearish zone.
Moving averages (all types of moving averages) are inherently lagging signals. To compensate for that, I am offsetting each SMA series by half of its period. This may be confusing to some, but the end result is a mathematically accurate SMA signal, centered on the signal that it is providing the moving average of. It doesn't stop the lag, but it directly and obviously shows how lagged each signal is, which I personally find better to trade against.
Symbols on the top and bottom of indicator:
Yellow triangle at bottom of indicator shows where a downward trend is starting to bottom out and a buy/long opening may be available soon.
Green triangle at bottom of indicator shows that a downward trend has switched to an upward trend. This indicates a good time to buy.
Yellow triangle at top of indicator shows where an upward trend is starting to plateau and a sell/short opening may be available soon.
Red triangle at top of indicator shows that an upward trend has switched to a downward trend. This indicates a good time to sell.
Note: You may see multiple yellow triangles before seeing a green or red triangle. This can happen when multiple trend accelerations or decelerations occur within an overall green or red zone.
In addition there is a dotted line connecting the end of the 64-period SMA to the end of the 8-period SMA. This indicates the direction the trend is moving towards. When the dotted line crosses the zero line, this portrays a rough estimate of where the trend may switch from a downtrend to an uptrend or vice versa. This is the "best" time to buy or sell, depending on your strategy.
I recommend placing a SMA on your candles set to the same window size as this indicator, and also to offset that SMA to the left by half its window size. For example, a 90-period SMA should be offset by -45 periods. That will cause it to be correctly aligned with this trend signal.

FIBS S/R IndicatorHello,
I've decided to publish a new script. The previous version of this script was removed by admins for breaking community rules.
So I present to you the Fibonacci Support / Resistance.
1. How does it work
Ratio plots
I first take the input of pivot look back and search for pivots high and low.
And then it takes a second look back to search highest high and lowest low to establish the top bottom range.
Then using the top and bottom I plot ratios provided as input. Defaults to most relevant 5 ratios I've found (Fibonacci):
Ratio 0 = 0 - can't be changed
Ratio 1 = 0.5
Ratio 2 = 0.618
Ratio 3 = 1
Ratio 4 = 1.618
Ratio 5 = 2.618
Any changes done to these ratios should be in order, otherwise conditions could get messed up. So R1 needs to the lowest and R5 the highest.
Also the same ratios are used in reverse as negative ratios.
There is a option to plot all ratios but gets really confusing for me but maybe for you it works. By default there are certain conditions set so that as we go up new resistance ratio get displayed and as we go down we see new resistance plots.
Trendlines
I've also added some automatic trendline plots with breakout warning labels based on the pivots high and low. Start and end for trendlines can be changed via inputs.
Labels can be deactivated via input. On a older version the trendlines and labels where not removed from the chart but I felt like there was to much information.
Overcooked/Undercooked
I've also added some fills and background colors that indicate if the price action is over R5 or under Negative R5 ratios. This usually indicates some "overcooking" or "undecooking".
I've notices that after "crossunder"/"crossover" top bottom ratios it goes in consolidation or it dumps. So then I plot a bgcolor to signal that.
2. How to use it
Using plot lines we can determine where we have support and resistance. I found that the best way to use the default ratios values is on the 1H chart. Very good for trading on crypto because of current situation in the market where there is a lot of new people entering the space and volatility and sentiment make swings respect the Fibonacci ratios.
3. Examples
For instance lets look at BINANCE:BTCUSDT .
On the left we see that the price action between 20 and 21 February was "overcooked". So after we got the signal that we "crossunder" the R5 the signal was triggered and we got a small red candle followed by a small dip and after that we got a small bounce and a dump.
If we also look at MF-RSI we can also see we got multiple bear divs.
Lets entertain the idea that we went short at ~57.1k as soon as we get signaled and it starts dumping.
Where does it stop ?
We can see it went all the way down to Negative R5 ratio. Normally that should signal "undercooking" but this was not triggered as it did not close under it (signaled in green).
We can also see that previous support now becomes resistance (signaled in red).
If we take a look at BINANCE:ETHUSDT , we do see that the "undercooking" was triggered here.
I will be publishing a more detailed Idea with examples of using this on the BINANCE:BTCUSDT chart in combination with Volume and other technical analysis.
Use with caution, this is not 100% signal indicator as the markets do what they want. But by using this in combination with other indicators like MF-RSI, EMAs and regular patterns we can get some targets for Support/Resistance.
I'm trying to create a strategy based on this indicator but I'm not getting very good results. Best results were on the 15 min chart with gross profits around ~50%.
Please try to play around with the inputs and let me know if you find something interesting, maybe I can incorporate new features in the indicator.
You can find the MF-RSI indicator here
