High and Low with Horizontal TableHigh and Low with Horizontal Table Indicator
Overview
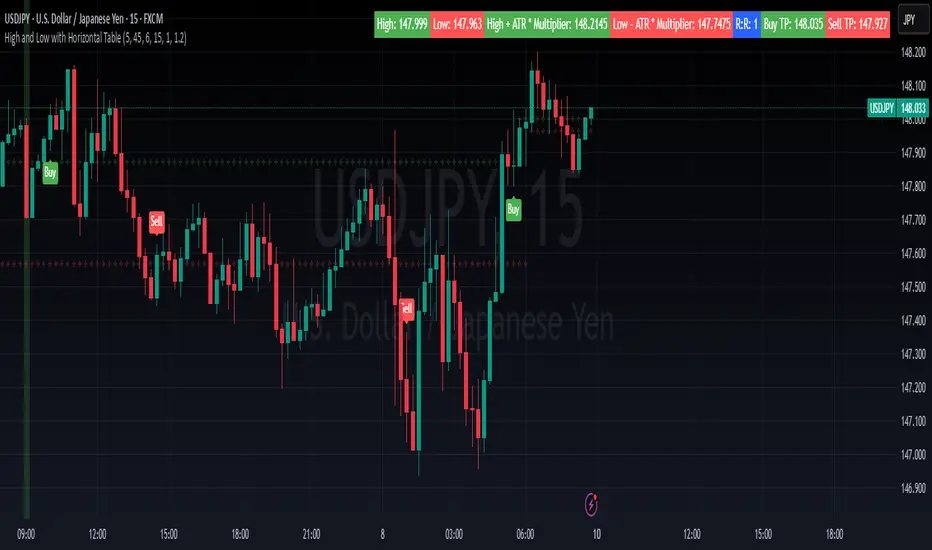
The "High and Low with Horizontal Table" indicator is designed for traders who wish to monitor key levels based on specific candle times, along with dynamic risk-to-reward ratios and ATR-based values. This indicator features real-time calculations, visual cues, and a table for quick reference of the calculated values.
Key Features
Custom Time Inputs:
Users can define two specific time inputs to select the candles for the High and Low prices. These times can target the same or separate candles.
ATR-based Calculation:
The indicator allows users to apply an ATR Multiplier to adjust the calculation of key levels. By default, the ATR multiplier is set to 1.2, but users can adjust it to their preferred value (e.g., 1.5 or 2).
Risk-to-Reward (R:R) Calculation:
The Risk-to-Reward Ratio (R:R) is used to calculate potential Take Profit (TP) levels based on the high and low of the selected candle(s).
The default R:R ratio is 2.0, but it can be customized to suit the trader’s strategy.
Visual Markings:
The High and Low values are plotted with subtle markers on the chart (cross style) for easy identification. The display of these markers is subdued for minimal visual distraction.
Horizontal Table Display:
A horizontal table is generated in the top-right corner of the chart, providing a quick reference for the following values:
High and Low of the selected candle(s)
High + ATR Multiplier and Low - ATR Multiplier
R:R ratio
Buy TP and Sell TP levels
Each value is displayed with a reasonable number of decimal places (4 decimals) for major forex pairs, XAUUSD, and BTCUSD.
Input Parameters
Hour and Minute for High Candle: Select the time for the candle that will determine the High.
Hour and Minute for Low Candle: Select the time for the candle that will determine the Low.
ATR Multiplier: A customizable input for adjusting the ATR-based calculations (default is 1.2).
Risk-to-Reward (R:R): Set the ratio to determine the TP levels (default is 2.0).
How It Works
The user defines two distinct time inputs (one for the High and one for the Low).
At the specified times, the indicator captures the High and Low prices of the candles.
The ATR is calculated and adjusted by the user-defined ATR Multiplier to determine buffers above the High and below the Low.
The Risk-to-Reward ratio is applied to calculate the Take Profit levels.
All of these values are displayed on the chart and updated in real time. The horizontal table ensures quick reference to all the key levels without cluttering the main chart.
Use Cases
Trend Trading: Identify potential support and resistance levels based on specific timeframes and adjust TP targets using ATR.
Scalping: Use the ATR and R:R calculations to target precise entry and exit points.
Market Opens: Track key market opens (such as New York and London) with candle times that reflect your trading strategy.
Conclusion
The High and Low with Horizontal Table indicator is a powerful tool for traders looking to combine precise candle-based level tracking with ATR-based risk management. By displaying key levels and TP targets in a clear, tabular format, traders can quickly assess and act on key price levels throughout their trading sessions.
在腳本中搜尋"tp"
SyakDan FX (Clear Version)**SyakDan FX (Clear Version) - Indicator Description**
### Overview:
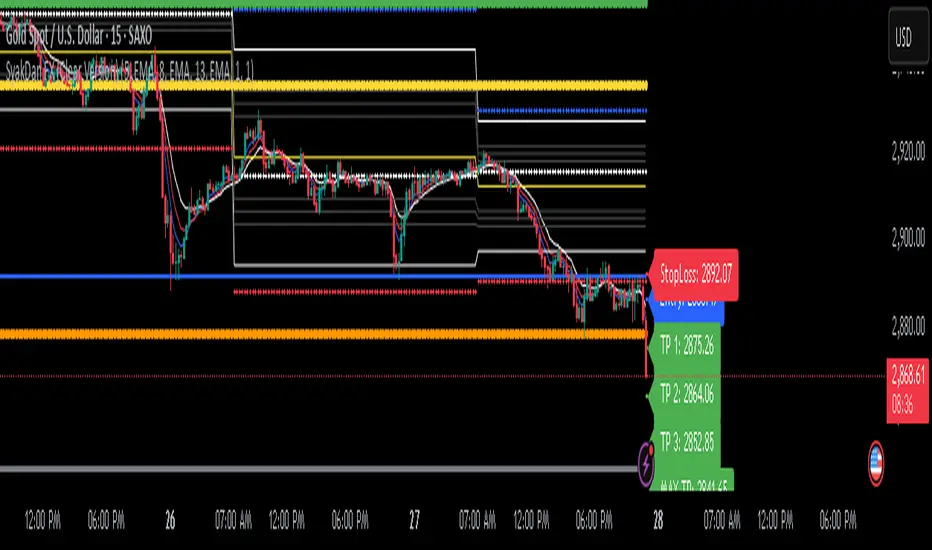
SyakDan FX (Clear Version) is a comprehensive TradingView indicator designed for account management, trend identification, and automated trading signals. This script utilizes multiple moving averages, ATR-based stop-loss calculations, and Fibonacci-based pivot points to assist traders in making informed trading decisions.
### Features:
1. **Account Management Calculation:**
- The indicator dynamically adapts to the current timeframe.
- Customizable moving average (MA) types, including EMA, SMA, WMA, and HMA.
- ATR-based trailing stop and volatility assessment.
2. **Moving Averages & Trend Identification:**
- Configurable EMA lengths for three different moving averages.
- Dynamic selection of MA types (SMA, EMA, WMA, HMA) for flexibility.
- Different EMA lengths for low and high timeframes.
- Automatic detection of EMA crossovers and trend changes.
3. **Entry, Stop-Loss, and Take-Profit Calculation:**
- Enables automatic calculation of entry, stop-loss, and take-profit levels.
- ATR-based stop-loss placement.
- Multi-level take-profit targets (TP1, TP2, TP3, and Max TP).
- Visual representation of SL/TP levels using dynamic lines and labels.
4. **Alerts & Notifications:**
- Alerts for EMA crossovers (Buy & Sell signals).
- Additional alerts when EMA 2 crosses EMA 3, indicating strong signals.
5. **Pivot Point Calculations:**
- Calculates daily and weekly pivot points using Fibonacci and traditional methods.
- Helps traders identify key support and resistance levels.
### How It Works:
- The indicator plots three customizable moving averages on the chart.
- It detects crossovers between these moving averages to identify potential buy and sell signals.
- ATR (Average True Range) is used to set dynamic stop-loss and take-profit levels.
- Traders can enable or disable automatic SL/TP plotting.
- Alerts notify users when key trade signals occur.
- Fibonacci and traditional pivot points provide additional confluence for trading decisions.
### Customization Options:
- **MA Type Selection:** Choose from SMA, EMA, WMA, or HMA for each moving average.
- **EMA Length Adjustments:** Modify the lengths for short-term and long-term trends.
- **SL/TP Settings:** Enable or disable SL/TP plotting and customize their multipliers.
- **Alert Preferences:** Enable or disable alerts for trend crossovers.
### Ideal Usage:
- Traders using trend-following strategies based on moving averages.
- Those who want automated SL/TP placement for risk management.
- Anyone looking to integrate pivot points into their trading decisions.
This indicator provides a clean, structured approach to trading with automated analysis, reducing the need for manual calculations while offering strong risk management tools.
MTF Signal XpertMTF Signal Xpert – Detailed Description
Overview:
MTF Signal Xpert is a proprietary, open‑source trading signal indicator that fuses multiple technical analysis methods into one cohesive strategy. Developed after rigorous backtesting and extensive research, this advanced tool is designed to deliver clear BUY and SELL signals by analyzing trend, momentum, and volatility across various timeframes. Its integrated approach not only enhances signal reliability but also incorporates dynamic risk management, helping traders protect their capital while navigating complex market conditions.
Detailed Explanation of How It Works:
Trend Detection via Moving Averages
Dual Moving Averages:
MTF Signal Xpert computes two moving averages—a fast MA and a slow MA—with the flexibility to choose from Simple (SMA), Exponential (EMA), or Hull (HMA) methods. This dual-MA system helps identify the prevailing market trend by contrasting short-term momentum with longer-term trends.
Crossover Logic:
A BUY signal is initiated when the fast MA crosses above the slow MA, coupled with the condition that the current price is above the lower Bollinger Band. This suggests that the market may be emerging from a lower price region. Conversely, a SELL signal is generated when the fast MA crosses below the slow MA and the price is below the upper Bollinger Band, indicating potential bearish pressure.
Recent Crossover Confirmation:
To ensure that signals reflect current market dynamics, the script tracks the number of bars since the moving average crossover event. Only crossovers that occur within a user-defined “candle confirmation” period are considered, which helps filter out outdated signals and improves overall signal accuracy.
Volatility and Price Extremes with Bollinger Bands
Calculation of Bands:
Bollinger Bands are calculated using a 20‑period simple moving average as the central basis, with the upper and lower bands derived from a standard deviation multiplier. This creates dynamic boundaries that adjust according to recent market volatility.
Signal Reinforcement:
For BUY signals, the condition that the price is above the lower Bollinger Band suggests an undervalued market condition, while for SELL signals, the price falling below the upper Bollinger Band reinforces the bearish bias. This volatility context adds depth to the moving average crossover signals.
Momentum Confirmation Using Multiple Oscillators
RSI (Relative Strength Index):
The RSI is computed over 14 periods to determine if the market is in an overbought or oversold state. Only readings within an optimal range (defined by user inputs) validate the signal, ensuring that entries are made during balanced conditions.
MACD (Moving Average Convergence Divergence):
The MACD line is compared with its signal line to assess momentum. A bullish scenario is confirmed when the MACD line is above the signal line, while a bearish scenario is indicated when it is below, thus adding another layer of confirmation.
Awesome Oscillator (AO):
The AO measures the difference between short-term and long-term simple moving averages of the median price. Positive AO values support BUY signals, while negative values back SELL signals, offering additional momentum insight.
ADX (Average Directional Index):
The ADX quantifies trend strength. MTF Signal Xpert only considers signals when the ADX value exceeds a specified threshold, ensuring that trades are taken in strongly trending markets.
Optional Stochastic Oscillator:
An optional stochastic oscillator filter can be enabled to further refine signals. It checks for overbought conditions (supporting SELL signals) or oversold conditions (supporting BUY signals), thus reducing ambiguity.
Multi-Timeframe Verification
Higher Timeframe Filter:
To align short-term signals with broader market trends, the script calculates an EMA on a higher timeframe as specified by the user. This multi-timeframe approach helps ensure that signals on the primary chart are consistent with the overall trend, thereby reducing false signals.
Dynamic Risk Management with ATR
ATR-Based Calculations:
The Average True Range (ATR) is used to measure current market volatility. This value is multiplied by a user-defined factor to dynamically determine stop loss (SL) and take profit (TP) levels, adapting to changing market conditions.
Visual SL/TP Markers:
The calculated SL and TP levels are plotted on the chart as distinct colored dots, enabling traders to quickly identify recommended exit points.
Optional Trailing Stop:
An optional trailing stop feature is available, which adjusts the stop loss as the trade moves favorably, helping to lock in profits while protecting against sudden reversals.
Risk/Reward Ratio Calculation:
MTF Signal Xpert computes a risk/reward ratio based on the dynamic SL and TP levels. This quantitative measure allows traders to assess whether the potential reward justifies the risk associated with a trade.
Condition Weighting and Signal Scoring
Binary Condition Checks:
Each technical condition—ranging from moving average crossovers, Bollinger Band positioning, and RSI range to MACD, AO, ADX, and volume filters—is assigned a binary score (1 if met, 0 if not).
Cumulative Scoring:
These individual scores are summed to generate cumulative bullish and bearish scores, quantifying the overall strength of the signal and providing traders with an objective measure of its viability.
Detailed Signal Explanation:
A comprehensive explanation string is generated, outlining which conditions contributed to the current BUY or SELL signal. This explanation is displayed on an on‑chart dashboard, offering transparency and clarity into the signal generation process.
On-Chart Visualizations and Debug Information
Chart Elements:
The indicator plots all key components—moving averages, Bollinger Bands, SL and TP markers—directly on the chart, providing a clear visual framework for understanding market conditions.
Combined Dashboard:
A dedicated dashboard displays key metrics such as RSI, ADX, and the bullish/bearish scores, alongside a detailed explanation of the current signal. This consolidated view allows traders to quickly grasp the underlying logic.
Debug Table (Optional):
For advanced users, an optional debug table is available. This table breaks down each individual condition, indicating which criteria were met or not met, thus aiding in further analysis and strategy refinement.
Mashup Justification and Originality
MTF Signal Xpert is more than just an aggregation of existing indicators—it is an original synthesis designed to address real-world trading complexities. Here’s how its components work together:
Integrated Trend, Volatility, and Momentum Analysis:
By combining moving averages, Bollinger Bands, and multiple oscillators (RSI, MACD, AO, ADX, and an optional stochastic), the indicator captures diverse market dynamics. Each component reinforces the others, reducing noise and filtering out false signals.
Multi-Timeframe Analysis:
The inclusion of a higher timeframe filter aligns short-term signals with longer-term trends, enhancing overall reliability and reducing the potential for contradictory signals.
Adaptive Risk Management:
Dynamic stop loss and take profit levels, determined using ATR, ensure that the risk management strategy adapts to current market conditions. The optional trailing stop further refines this approach, protecting profits as the market evolves.
Quantitative Signal Scoring:
The condition weighting system provides an objective measure of signal strength, giving traders clear insight into how each technical component contributes to the final decision.
How to Use MTF Signal Xpert:
Input Customization:
Adjust the moving average type and period settings, ATR multipliers, and oscillator thresholds to align with your trading style and the specific market conditions.
Enable or disable the optional stochastic oscillator and trailing stop based on your preference.
Interpreting the Signals:
When a BUY or SELL signal appears, refer to the on‑chart dashboard, which displays key metrics (e.g., RSI, ADX, bullish/bearish scores) along with a detailed breakdown of the conditions that triggered the signal.
Review the SL and TP markers on the chart to understand the associated risk/reward setup.
Risk Management:
Use the dynamically calculated stop loss and take profit levels as guidelines for setting your exit points.
Evaluate the provided risk/reward ratio to ensure that the potential reward justifies the risk before entering a trade.
Debugging and Verification:
Advanced users can enable the debug table to see a condition-by-condition breakdown of the signal generation process, helping refine the strategy and deepen understanding of market dynamics.
Disclaimer:
MTF Signal Xpert is intended for educational and analytical purposes only. Although it is based on robust technical analysis methods and has undergone extensive backtesting, past performance is not indicative of future results. Traders should employ proper risk management and adjust the settings to suit their financial circumstances and risk tolerance.
MTF Signal Xpert represents a comprehensive, original approach to trading signal generation. By blending trend detection, volatility assessment, momentum analysis, multi-timeframe alignment, and adaptive risk management into one integrated system, it provides traders with actionable signals and the transparency needed to understand the logic behind them.

Multi-indicator Signal Builder [Skyrexio]Overview
Multi-Indicator Signal Builder is a versatile, all-in-one script designed to streamline your trading workflow by combining multiple popular technical indicators under a single roof. It features a single-entry, single-exit logic, intrabar stop-loss/take-profit handling, an optional time filter, a visually accessible condition table, and a built-in statistics label. Traders can choose any combination of 12+ indicators (RSI, Ultimate Oscillator, Bollinger %B, Moving Averages, ADX, Stochastic, MACD, PSAR, MFI, CCI, Heikin Ashi, and a “TV Screener” placeholder) to form entry or exit conditions. This script aims to simplify strategy creation and analysis, making it a powerful toolkit for technical traders.
Indicators Overview
1. RSI (Relative Strength Index)
Measures recent price changes to evaluate overbought or oversold conditions on a 0–100 scale.
2. Ultimate Oscillator (UO)
Uses weighted averages of three different timeframes, aiming to confirm price momentum while avoiding false divergences.
3. Bollinger %B
Expresses price relative to Bollinger Bands, indicating whether price is near the upper band (overbought) or lower band (oversold).
4. Moving Average (MA)
Smooths price data over a specified period. The script supports both SMA and EMA to help identify trend direction and potential crossovers.
5. ADX (Average Directional Index)
Gauges the strength of a trend (0–100). Higher ADX signals stronger momentum, while lower ADX indicates a weaker trend.
6. Stochastic
Compares a closing price to a price range over a given period to identify momentum shifts and potential reversals.
7. MACD (Moving Average Convergence/Divergence)
Tracks the difference between two EMAs plus a signal line, commonly used to spot momentum flips through crossovers.
8. PSAR (Parabolic SAR)
Plots a trailing stop-and-reverse dot that moves with the trend. Often used to signal potential reversals when price crosses PSAR.
9. MFI (Money Flow Index)
Similar to RSI but incorporates volume data. A reading above 80 can suggest overbought conditions, while below 20 may indicate oversold.
10. CCI (Commodity Channel Index)
Identifies cyclical trends or overbought/oversold levels by comparing current price to an average price over a set timeframe.
11. Heikin Ashi
A type of candlestick charting that filters out market noise. The script uses a streak-based approach (multiple consecutive bullish or bearish bars) to gauge mini-trends.
12. TV Screener
A placeholder condition designed to integrate external buy/sell logic (like a TradingView “Buy” or “Sell” rating). Users can override or reference external signals if desired.
Unique Features
1. Multi-Indicator Entry and Exit
You can selectively enable any subset of 12+ classic indicators, each with customizable parameters and conditions. A position opens only if all enabled entry conditions are met, and it closes only when all enabled exit conditions are satisfied, helping reduce false triggers.
2. Single-Entry / Single-Exit with Intrabar SL/TP
The script supports a single position at a time. Once a position is open, it monitors intrabar to see if the price hits your stop-loss or take-profit levels before the bar closes, making results more realistic for fast-moving markets.
3. Time Window Filter
Users may specify a start/end date range during which trades are allowed, making it convenient to focus on specific market cycles for backtesting or live trading.
4. Condition Table and Statistics
A table at the bottom of the chart lists all active entry/exit indicators. Upon each closed trade, an integrated statistics label displays net profit, total trades, win/loss count, average and median PnL, etc.
5. Seamless Alerts and Automation
Configure alerts in TradingView using “Any alert() function call.”
The script sends JSON alert messages you can route to your own webhook.
The indicator can be integrated with Skyrexio alert bots to automate execution on major cryptocurrency exchanges
6. Optional MA/PSAR Plots
For added visual clarity, optionally plot the chosen moving averages or PSAR on the chart to confirm signals without stacking multiple indicators.
Methodology
1. Multi-Indicator Entry Logic
When multiple entry indicators are enabled (e.g., RSI + Stochastic + MACD), the script requires all signals to align before generating an entry. Each indicator can be set for crossovers, crossunders, thresholds (above/below), etc. This “AND” logic aims to filter out low-confidence triggers.
2. Single-Entry Intrabar SL/TP
One Position At a Time: Once an entry signal triggers, a trade opens at the bar’s close.
Intrabar Checks: Stop-loss and take-profit levels (if enabled) are monitored on every tick. If either is reached, the position closes immediately, without waiting for the bar to end.
3. Exit Logic
All Conditions Must Agree: If the trade is still open (SL/TP not triggered), then all enabled exit indicators must confirm a closure before the script exits on the bar’s close.
4. Time Filter
Optional Trading Window: You can activate a date/time range to constrain entries and exits strictly to that interval.
Justification of Methodology
Indicator Confluence: Combining multiple tools (RSI, MACD, etc.) can reduce noise and false signals.
Intrabar SL/TP: Capturing real-time spikes or dips provides a more precise reflection of typical live trading scenarios.
Single-Entry Model: Straightforward for both manual and automated tracking (especially important in bridging to bots).
Custom Date Range: Helps refine backtesting for specific market conditions or to avoid known irregular data periods.
How to Use
1. Add the Script to Your Chart
In TradingView, open Indicators , search for “Multi-indicator Signal Builder”.
Click to add it to your chart.
2. Configure Inputs
Time Filter: Set a start and end date for trades.
Alerts Messages: Input any JSON or text payload needed by your external service or bot.
Entry Conditions: Enable and configure any indicators (e.g., RSI, MACD) for a confluence-based entry.
Close Conditions: Enable exit indicators, along with optional SL (negative %) and TP (positive %) levels.
3. Set Up Alerts
In TradingView, select “Create Alert” → Condition = “Any alert() function call” → choose this script.
Entry Alert: Triggers on the script’s entry signal.
Close Alert: Triggers on the script’s close signal (or if SL/TP is hit).
Skyrexio Alert Bots: You can route these alerts via webhook to Skyrexio alert bots to automate order execution on major crypto exchanges (or any other supported broker).
4. Visual Reference
A condition table at the bottom summarizes active signals.
Statistics Label updates automatically as trades are closed, showing PnL stats and distribution metrics.
Backtesting Guidelines
Symbol/Timeframe: Works on multiple assets and timeframes; always do thorough testing.
Realistic Costs: Adjust commissions and potential slippage to match typical exchange conditions.
Risk Management: If using the built-in stop-loss/take-profit, set percentages that reflect your personal risk tolerance.
Longer Test Horizons: Verify performance across diverse market cycles to gauge reliability.
Example of statistic calculation
Test Period: 2023-01-01 to 2025-12-31
Initial Capital: $1,000
Commission: 0.1%, Slippage ~5 ticks
Trade Count: 468 (varies by strategy conditions)
Win rate: 76% (varies by strategy conditions)
Net Profit: +96.17% (varies by strategy conditions)
Disclaimer
This indicator is provided strictly for informational and educational purposes .
It does not constitute financial or trading advice.
Past performance never guarantees future results.
Always test thoroughly in demo environments before using real capital.
Enjoy exploring the Multi-Indicator Signal Builder! Experiment with different indicator combinations and adjust parameters to align with your trading preferences, whether you trade manually or link your alerts to external automation services. Happy trading and stay safe!

ICT Power Of Three | Flux Charts💎 GENERAL OVERVIEW
Introducing our new ICT Power Of Three Indicator! This indicator is built around the ICT's "Power Of Three" strategy. This strategy makes use of these 3 key smart money concepts : Accumulation, Manipulation and Distribution. Each step is explained in detail within this write-up. For more information about the process, check the "HOW DOES IT WORK" section.
Features of the new ICT Power Of Three Indicator :
Implementation of ICT's Power Of Three Strategy
Different Algorithm Modes
Customizable Execution Settings
Customizable Backtesting Dashboard
Alerts for Buy, Sell, TP & SL Signals
📌 HOW DOES IT WORK ?
The "Power Of Three" comes from these three keywords "Accumulation, Manipulation and Distribution". Here is a brief explanation of each keyword :
Accumulation -> Accumulation phase is when the smart money accumulate their positions in a fixed range. This phase indicates price stability, generally meaning that the price constantly switches between up & down trend between a low and a high pivot point. When the indicator detects an accumulation zone, the Power Of Three strategy begins.
Manipulation -> When the smart money needs to increase their position sizes, they need retail traders' positions for liquidity. So, they manipulate the market into the opposite direction of their intended direction. This will result in retail traders opening positions the way that the smart money intended them to do, creating liquidity. After this step, the real move that the smart money intended begins.
Distribution -> This is when the real intention of the smart money comes into action. With the new liquidity thanks to the manipulation phase, the smart money add their positions towards the opposite direction of the retail mindset. The purpose of this indicator is to detect the accumulation and manipulation phases, and help the trader move towards the same direction as the smart money for their trades.
Detection Methods Of The Indicator :
Accumulation -> The indicator detects accumulation zones as explained step-by-step :
1. Draw two lines from the lowest point and the highest point of the latest X bars.
2. If the (high line - low line) is lower than Average True Range (ATR) * accumulationConstant
3. After the condition is validated, an accumulation zone is detected. The accumulation zone will be invalidated and manipulation phase will begin when the range is broken.
Manipulation -> If the accumulation range is broken, check if the current bar closes / wicks above the (high line + ATR * manipulationConstant) or below the (low line - ATR * manipulationConstant). If the condition is met, the indicator detects a manipulation zone.
Distribution -> The purpose of this indicator is to try to foresee the distribution zone, so instead of a detection, after the manipulation zone is detected the indicator automatically create a "shadow" distribution zone towards the opposite direction of the freshly detected manipulation zone. This shadow distribution zone comes with a take-profit and stop-loss layout, customizable by the trader in the settings.
The X bars, accumulationConstant and manipulationConstant are subject to change with the "Algorithm Mode" setting. Read the "Settings" section for more information.
This indicator follows these steps and inform you step by step by plotting them in your chart.
🚩UNIQUENESS
This indicator is an all-in-one suite for the ICT's Power Of Three concept. It's capable of plotting the strategy, giving signals, a backtesting dashboard and alerts feature. Different and customizable algorithm modes will help the trader fine-tune the indicator for the asset they are currently trading. The backtesting dashboard allows you to see how your settings perform in the current ticker. You can also set up alerts to get informed when the strategy is executable for different tickers.
⚙️SETTINGS
1. General Configuration
Algorithm Mode -> The indicator offers 3 different detection algorithm modes according to your needs. Here is the explanation of each mode.
a) Small Manipulation
This mode has the default bar length for the accumulation detection, but a lower manipulation constant, meaning that slighter imbalances in the price action can be detected as manipulation. This setting can be useful on tickers that have lower liquidity, thus can be manipulated easier.
b) Big Manipulation
This mode has the default bar length for the accumulation detection, but a higher manipulation constant, meaning that heavier imbalances on the price action are required in order to detect manipulation zones. This setting can be useful on tickers that have higher liquidity, thus can be manipulated harder.
c) Short Accumulation
This mode has a ~70% lower bar length requirement for accumulation zone detection, and the default manipulation constant. This setting can be useful on tickers that are highly volatile and do not enter accumulation phases too often.
Breakout Method -> If "Close" is selected, bar close price will be taken into calculation when Accumulation & Manipulation zone invalidation. If "Wick" is selected, a wick will be enough to validate the corresponding zone.
2. TP / SL
TP / SL Method -> If "Fixed" is selected, you can adjust the TP / SL ratios from the settings below. If "Dynamic" is selected, the TP / SL zones will be auto-determined by the algorithm.
Risk -> The risk you're willing to take if "Dynamic" TP / SL Method is selected. Higher risk usually means a better winrate at the cost of losing more if the strategy fails. This setting is has a crucial effect on the performance of the indicator, as different tickers may have different volatility so the indicator may have increased performance when this setting is correctly adjusted.
3. Visuals
Show Zones -> Enables / Disables rendering of Accumulation (yellow) and Manipulation (red) zones.

ICT Turtle Soup | Flux Charts💎 GENERAL OVERVIEW
Introducing our new ICT Turtle Soup Indicator! This indicator is built around the ICT "Turtle Soup" model. The strategy has 5 steps for execution which are described in this write-up. For more information about the process, check the "HOW DOES IT WORK" section.
Features of the new ICT Turtle Soup Indicator :
Implementation of ICT's Turtle Soup Strategy
Adaptive Entry Method
Customizable Execution Settings
Customizable Backtesting Dashboard
Alerts for Buy, Sell, TP & SL Signals
📌 HOW DOES IT WORK ?
The ICT Turtle Soup strategy may have different implementations depending on the selected method of the trader. This indicator's implementation is described as :
1. Mark higher timerame liquidity zones.
Liquidity zones are where a lot of market orders sit in the chart. They are usually formed from the long / short position holders' "liquidity" levels. There are various ways to find them, most common one being drawing them on the latest high & low pivot points in the chart, which this indicator does.
2. Mark current timeframe market structure.
The market structure is the current flow of the market. It tells you if the market is trending right now, and the way it's trending towards. It's formed from swing higs, swing lows and support / resistance levels.
3. Wait for market to make a liquidity grab on the higher timeframe liquidity zone.
A liquidity grab is when the marked liquidity zones have a false breakout, which means that it gets broken for a brief amount of time, but then price falls back to it's previous position.
4. Buyside liquidity grabs are "Short" entries and Sellside liquidity grabs are "Long" entries by default.
5. Wait for the market-structure shift in the current timeframe for entry confirmation.
A market-structure shift happens when the current market structure changes, usually when a new swing high / swing low is formed. This indicator uses it as a confirmation for position entry as it gives an insight of the new trend of the market.
6. Place Take-Profit and Stop-Loss levels according to the risk ratio.
This indicator uses "Average True Range" when placing the stop-loss & take-profit levels. Average True Range calculates the average size of a candle and the indicator places the stop-loss level using ATR times the risk setting determined by the user, then places the take-profit level trying to keep a minimum of 1:1 risk-reward ratio.
This indicator follows these steps and inform you step by step by plotting them in your chart.
🚩UNIQUENESS
This indicator is an all-in-one suit for the ICT's Turtle Soup concept. It's capable of plotting the strategy, giving signals, a backtesting dashboard and alerts feature. It's designed for simplyfing a rather complex strategy, helping you to execute it with clean signals. The backtesting dashboard allows you to see how your settings perform in the current ticker. You can also set up alerts to get informed when the strategy is executable for different tickers.
⚙️SETTINGS
1. General Configuration
MSS Swing Length -> The swing length when finding liquidity zones for market structure-shift detection.
Higher Timeframe -> The higher timeframe to look for liquidity grabs. This timeframe setting must be higher than the current chart's timeframe for the indicator to work.
Breakout Method -> If "Wick" is selected, a bar wick will be enough to confirm a market structure-shift. If "Close" is selected, the bar must close above / below the liquidity zone to confirm a market structure-shift.
Entry Method ->
"Classic" : Works as described on the "HOW DOES IT WORK" section.
"Adaptive" : When "Adaptive" is selected, the entry conditions may chance depending on the current performance of the indicator. It saves the entry conditions and the performance of the past entries, then for the new entries it checks if it predicted the liquidity grabs correctly with the current setup, if so, continues with the same logic. If not, it changes behaviour to reverse the entries from long / short to short / long.
2. TP / SL
TP / SL Method -> If "Fixed" is selected, you can adjust the TP / SL ratios from the settings below. If "Dynamic" is selected, the TP / SL zones will be auto-determined by the algorithm.
Risk -> The risk you're willing to take if "Dynamic" TP / SL Method is selected. Higher risk usually means a better winrate at the cost of losing more if the strategy fails. This setting is has a crucial effect on the performance of the indicator, as different tickers may have different volatility so the indicator may have increased performance when this setting is correctly adjusted.

Smart Money Breakouts [ChartPrime]The " Smart Money Breakouts " indicator is designed to identify breakouts based on changes in character (CHOCH) or breaks of structure (BOS) patterns, facilitating automated trading with user-defined Take Profit (TP) level.
the indicator incorporates essential elements such as volume analysis and a data table to assist traders in optimizing their strategies.
🔸 Breakout Detection:
The indicator scans price movements for "Change in Character" (CHOCH) and "Break of Structure" (BOS) patterns, signaling potential breakout opportunities in the market.
🔸User-Defined TP :
Traders can customize the Take Profit (TP) through the indicator settings, with these levels dynamically calculated based on the Average True Range (ATR). This allows for precise risk management and profit targets that adapt to market volatility.
🔸 Volume Analysis and Trade Direction Specific Analysis:
The indicator includes a volume checker that provides valuable insights into the strength of the breakout, taking into account trade direction.
🔸If the volume label is red and the trade is long, it suggests a higher likelihood of hitting the Stop Loss (SL).
🔸If the volume label is green and the trade is long, it indicates a higher probability of hitting the Take Profit (TP).
🔸For short trades, a red volume label suggests a higher likelihood of hitting TP, while a green label suggests a higher likelihood of hitting SL.
🔸A yellow volume label suggests that the volume is inconclusive, neither favoring bullish nor bearish movements.
🔸Data Table:
The indicator features a data table that keeps track of the number of winning and losing trades for specific timeframes or configurations.
This table serves as a valuable tool for traders to analyze performance and discover optimal settings and timeframes.
The "Smart Money Breakouts" indicator provides traders with a comprehensive solution for breakout trading, combining technical analysis of changes in character and breaks of structure, volume insights, and performance tracking while dynamically adjusting TP and SL levels based on market volatility through the ATR.

EMA 9/21 with Target Price [SS]Hey everyone,
Coming back with my EMA 9/21 indicator.
My original one was removed a long time ago because I didn't really realize that there were already plenty of similar indicators (my bad!) but this one is my unique, Steversteves edition haha.
About the Indicator:
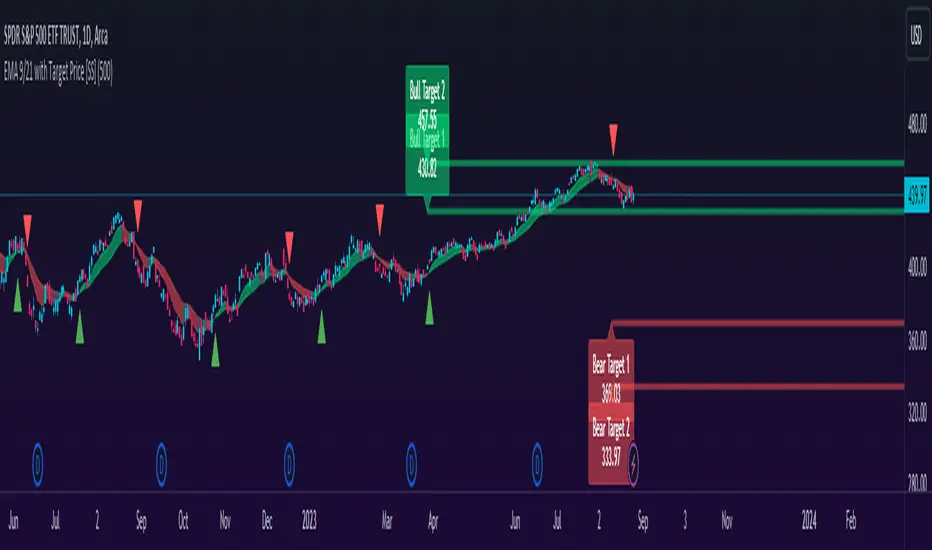
Essentially, it just combines the 2 only EMA's I ever really use (the 9 and 21) with an ATR based analysis to calculate the average range a ticker undergoes after an EMA 9 / 21 Cross-over and Cross-under.
You can see the major example being in the chart above. I use this for dramatic effect as SPY just happened to have topped at the second expected bull target on the daily. But obviously the intention for this indicator is to be used on the smaller timeframes. Let's take a look at some examples with various tickers.
TSLA:
So let's just use the previous day as example (which was Friday). If we look to the chart below:
TSLA did an EMA 9/21 crossover (bullish) in premarket. This put the immediate TP at 234.59. If we play out the chart:
We shot right to it at open.
We then did a cross under with a TP of 225.93, but that was not realized as the sentiment was too bullish. We then cross back over to the upside, putthing next TP at 238.88 which was realized:
NVDA:
On Friday, NVDA was a bit of a mess, lots of whipsaw off open. But once we finally had a cross under with 3 consecutive closes below the EMA9/21 on the 5 minute chart, it solidified the likelihood of a short:
And this was the result:
We came down to the first target, held it actually as support before finally crossing back over, setting the next TP at 475.05. We got 3 consecutive closes above the EMA 9/21, so let's see what happened:
Nothing really, we closed before we got there, but we did make progress towards it.
And last but not least SPY:
We opened the day with a bullish crossover and 3 consecutive closes above the EMA9/21, making our TP 441.38 (chart above). Let's see what happened:
We came just shy of it after the fed release volatility slammed it down, where we got a crossunder (bearish) to a TP of 436.21:
This ended up playing out, we did get a bullish crossover later in the day and so let's see what happened then:
So those are the real examples, most recent examples of trading using this. They are not all perfect, which is intentional because you need to use a bit of your own analysis, of course, when you are using this type of strategy or indicator. The EMA 9/21 is not sufficient generally on its own, but it is very helpful to gauge the immediate PA and whether the expected move aligns with your overall thesis on the day in terms of realistic target prices.
Customizability:
In terms of the customizability, this is a very basic indicator aside from the assessment of ranges. So there really is not a lot to customize.
You can toggle off and on the labels if you do not want them, you can also adjust the lookback length for the ATR assessment. The lookback length is defaulted to 500, I do really highly suggest you leave it at 500 because this has worked well for me and in back-testing, it has performed above my own expectations.
But, that said, you can take this and back-test as you wish with whatever parameters you feel are most appropriate. I haven't back-tested this on every stock known to man, my go to's are SPY, QQQ, sometimes MSFT and so it works well on those. But perhaps some others will have differing results.
Final Thoughts:
That is the indicator in a nutshell! It is really self explanatory and its likely a strategy most of you already know. This just helps to add realistic price targets and context to those cross-overs and cross-unders.
It also works fine on larger timeframes. We can see it on the 1 hour with MSFT:
On the 2 hour hour with QQQ:
And I am sure you can find other examples!
That's it everyone, safe trades!
CNTLibraryLibrary "CNTLibrary"
Custom Functions To Help Code In Pinescript V5
Coded By Christian Nataliano
First Coded In 10/06/2023
Last Edited In 22/06/2023
Huge Shout Out To © ZenAndTheArtOfTrading and his ZenLibrary V5, Some Of The Custom Functions Were Heavily Inspired By Matt's Work & His Pine Script Mastery Course
Another Shout Out To The TradingView's Team Library ta V5
//====================================================================================================================================================
// Custom Indicator Functions
//====================================================================================================================================================
GetKAMA(KAMA_lenght, Fast_KAMA, Slow_KAMA)
Calculates An Adaptive Moving Average Based On Perry J Kaufman's Calculations
Parameters:
KAMA_lenght (int) : Is The KAMA Lenght
Fast_KAMA (int) : Is The KAMA's Fastes Moving Average
Slow_KAMA (int) : Is The KAMA's Slowest Moving Average
Returns: Float Of The KAMA's Current Calculations
GetMovingAverage(Source, Lenght, Type)
Get Custom Moving Averages Values
Parameters:
Source (float) : Of The Moving Average, Defval = close
Lenght (simple int) : Of The Moving Average, Defval = 50
Type (string) : Of The Moving Average, Defval = Exponential Moving Average
Returns: The Moving Average Calculation Based On Its Given Source, Lenght & Calculation Type (Please Call Function On Global Scope)
GetDecimals()
Calculates how many decimals are on the quote price of the current market © ZenAndTheArtOfTrading
Returns: The current decimal places on the market quote price
Truncate(number, decimalPlaces)
Truncates (cuts) excess decimal places © ZenAndTheArtOfTrading
Parameters:
number (float)
decimalPlaces (simple float)
Returns: The given number truncated to the given decimalPlaces
ToWhole(number)
Converts pips into whole numbers © ZenAndTheArtOfTrading
Parameters:
number (float)
Returns: The converted number
ToPips(number)
Converts whole numbers back into pips © ZenAndTheArtOfTrading
Parameters:
number (float)
Returns: The converted number
GetPctChange(value1, value2, lookback)
Gets the percentage change between 2 float values over a given lookback period © ZenAndTheArtOfTrading
Parameters:
value1 (float)
value2 (float)
lookback (int)
BarsAboveMA(lookback, ma)
Counts how many candles are above the MA © ZenAndTheArtOfTrading
Parameters:
lookback (int)
ma (float)
Returns: The bar count of how many recent bars are above the MA
BarsBelowMA(lookback, ma)
Counts how many candles are below the MA © ZenAndTheArtOfTrading
Parameters:
lookback (int)
ma (float)
Returns: The bar count of how many recent bars are below the EMA
BarsCrossedMA(lookback, ma)
Counts how many times the EMA was crossed recently © ZenAndTheArtOfTrading
Parameters:
lookback (int)
ma (float)
Returns: The bar count of how many times price recently crossed the EMA
GetPullbackBarCount(lookback, direction)
Counts how many green & red bars have printed recently (ie. pullback count) © ZenAndTheArtOfTrading
Parameters:
lookback (int)
direction (int)
Returns: The bar count of how many candles have retraced over the given lookback & direction
GetSwingHigh(Lookback, SwingType)
Check If Price Has Made A Recent Swing High
Parameters:
Lookback (int) : Is For The Swing High Lookback Period, Defval = 7
SwingType (int) : Is For The Swing High Type Of Identification, Defval = 1
Returns: A Bool - True If Price Has Made A Recent Swing High
GetSwingLow(Lookback, SwingType)
Check If Price Has Made A Recent Swing Low
Parameters:
Lookback (int) : Is For The Swing Low Lookback Period, Defval = 7
SwingType (int) : Is For The Swing Low Type Of Identification, Defval = 1
Returns: A Bool - True If Price Has Made A Recent Swing Low
//====================================================================================================================================================
// Custom Risk Management Functions
//====================================================================================================================================================
CalculateStopLossLevel(OrderType, Entry, StopLoss)
Calculate StopLoss Level
Parameters:
OrderType (int) : Is To Determine A Long / Short Position, Defval = 1
Entry (float) : Is The Entry Level Of The Order, Defval = na
StopLoss (float) : Is The Custom StopLoss Distance, Defval = 2x ATR Below Close
Returns: Float - The StopLoss Level In Actual Price As A
CalculateStopLossDistance(OrderType, Entry, StopLoss)
Calculate StopLoss Distance In Pips
Parameters:
OrderType (int) : Is To Determine A Long / Short Position, Defval = 1
Entry (float) : Is The Entry Level Of The Order, NEED TO INPUT PARAM
StopLoss (float) : Level Based On Previous Calculation, NEED TO INPUT PARAM
Returns: Float - The StopLoss Value In Pips
CalculateTakeProfitLevel(OrderType, Entry, StopLossDistance, RiskReward)
Calculate TakeProfit Level
Parameters:
OrderType (int) : Is To Determine A Long / Short Position, Defval = 1
Entry (float) : Is The Entry Level Of The Order, Defval = na
StopLossDistance (float)
RiskReward (float)
Returns: Float - The TakeProfit Level In Actual Price
CalculateTakeProfitDistance(OrderType, Entry, TakeProfit)
Get TakeProfit Distance In Pips
Parameters:
OrderType (int) : Is To Determine A Long / Short Position, Defval = 1
Entry (float) : Is The Entry Level Of The Order, NEED TO INPUT PARAM
TakeProfit (float) : Level Based On Previous Calculation, NEED TO INPUT PARAM
Returns: Float - The TakeProfit Value In Pips
CalculateConversionCurrency(AccountCurrency, SymbolCurrency, BaseCurrency)
Get The Conversion Currecny Between Current Account Currency & Current Pair's Quoted Currency (FOR FOREX ONLY)
Parameters:
AccountCurrency (simple string) : Is For The Account Currency Used
SymbolCurrency (simple string) : Is For The Current Symbol Currency (Front Symbol)
BaseCurrency (simple string) : Is For The Current Symbol Base Currency (Back Symbol)
Returns: Tuple Of A Bollean (Convert The Currency ?) And A String (Converted Currency)
CalculateConversionRate(ConvertCurrency, ConversionRate)
Get The Conversion Rate Between Current Account Currency & Current Pair's Quoted Currency (FOR FOREX ONLY)
Parameters:
ConvertCurrency (bool) : Is To Check If The Current Symbol Needs To Be Converted Or Not
ConversionRate (float) : Is The Quoted Price Of The Conversion Currency (Input The request.security Function Here)
Returns: Float Price Of Conversion Rate (If In The Same Currency Than Return Value Will Be 1.0)
LotSize(LotSizeSimple, Balance, Risk, SLDistance, ConversionRate)
Get Current Lot Size
Parameters:
LotSizeSimple (bool) : Is To Toggle Lot Sizing Calculation (Simple Is Good Enough For Stocks & Crypto, Whilst Complex Is For Forex)
Balance (float) : Is For The Current Account Balance To Calculate The Lot Sizing Based Off
Risk (float) : Is For The Current Risk Per Trade To Calculate The Lot Sizing Based Off
SLDistance (float) : Is The Current Position StopLoss Distance From Its Entry Price
ConversionRate (float) : Is The Currency Conversion Rate (Used For Complex Lot Sizing Only)
Returns: Float - Position Size In Units
ToLots(Units)
Converts Units To Lots
Parameters:
Units (float) : Is For How Many Units Need To Be Converted Into Lots (Minimun 1000 Units)
Returns: Float - Position Size In Lots
ToUnits(Lots)
Converts Lots To Units
Parameters:
Lots (float) : Is For How Many Lots Need To Be Converted Into Units (Minimun 0.01 Units)
Returns: Int - Position Size In Units
ToLotsInUnits(Units)
Converts Units To Lots Than Back To Units
Parameters:
Units (float) : Is For How Many Units Need To Be Converted Into Lots (Minimun 1000 Units)
Returns: Float - Position Size In Lots That Were Rounded To Units
ATRTrail(OrderType, SourceType, ATRPeriod, ATRMultiplyer, SwingLookback)
Calculate ATR Trailing Stop
Parameters:
OrderType (int) : Is To Determine A Long / Short Position, Defval = 1
SourceType (int) : Is To Determine Where To Calculate The ATR Trailing From, Defval = close
ATRPeriod (simple int) : Is To Change Its ATR Period, Defval = 20
ATRMultiplyer (float) : Is To Change Its ATR Trailing Distance, Defval = 1
SwingLookback (int) : Is To Change Its Swing HiLo Lookback (Only From Source Type 5), Defval = 7
Returns: Float - Number Of The Current ATR Trailing
DangerZone(WinRate, AvgRRR, Filter)
Calculate Danger Zone Of A Given Strategy
Parameters:
WinRate (float) : Is The Strategy WinRate
AvgRRR (float) : Is The Strategy Avg RRR
Filter (float) : Is The Minimum Profit It Needs To Be Out Of BE Zone, Defval = 3
Returns: Int - Value, 1 If Out Of Danger Zone, 0 If BE, -1 If In Danger Zone
IsQuestionableTrades(TradeTP, TradeSL)
Checks For Questionable Trades (Which Are Trades That Its TP & SL Level Got Hit At The Same Candle)
Parameters:
TradeTP (float) : Is The Trade In Question Take Profit Level
TradeSL (float) : Is The Trade In Question Stop Loss Level
Returns: Bool - True If The Last Trade Was A "Questionable Trade"
//====================================================================================================================================================
// Custom Strategy Functions
//====================================================================================================================================================
OpenLong(EntryID, LotSize, LimitPrice, StopPrice, Comment, CommentValue)
Open A Long Order Based On The Given Params
Parameters:
EntryID (string) : Is The Trade Entry ID, Defval = "Long"
LotSize (float) : Is The Lot Size Of The Trade, Defval = 1
LimitPrice (float) : Is The Limit Order Price To Set The Order At, Defval = Na / Market Order Execution
StopPrice (float) : Is The Stop Order Price To Set The Order At, Defval = Na / Market Order Execution
Comment (string) : Is The Order Comment, Defval = Long Entry Order
CommentValue (string) : Is For Custom Values In The Order Comment, Defval = Na
Returns: Void
OpenShort(EntryID, LotSize, LimitPrice, StopPrice, Comment, CommentValue)
Open A Short Order Based On The Given Params
Parameters:
EntryID (string) : Is The Trade Entry ID, Defval = "Short"
LotSize (float) : Is The Lot Size Of The Trade, Defval = 1
LimitPrice (float) : Is The Limit Order Price To Set The Order At, Defval = Na / Market Order Execution
StopPrice (float) : Is The Stop Order Price To Set The Order At, Defval = Na / Market Order Execution
Comment (string) : Is The Order Comment, Defval = Short Entry Order
CommentValue (string) : Is For Custom Values In The Order Comment, Defval = Na
Returns: Void
TP_SLExit(FromID, TPLevel, SLLevel, PercentageClose, Comment, CommentValue)
Exits Based On Predetermined TP & SL Levels
Parameters:
FromID (string) : Is The Trade ID That The TP & SL Levels Be Palced
TPLevel (float) : Is The Take Profit Level
SLLevel (float) : Is The StopLoss Level
PercentageClose (float) : Is The Amount To Close The Order At (In Percentage) Defval = 100
Comment (string) : Is The Order Comment, Defval = Exit Order
CommentValue (string) : Is For Custom Values In The Order Comment, Defval = Na
Returns: Void
CloseLong(ExitID, PercentageClose, Comment, CommentValue, Instant)
Exits A Long Order Based On A Specified Condition
Parameters:
ExitID (string) : Is The Trade ID That Will Be Closed, Defval = "Long"
PercentageClose (float) : Is The Amount To Close The Order At (In Percentage) Defval = 100
Comment (string) : Is The Order Comment, Defval = Exit Order
CommentValue (string) : Is For Custom Values In The Order Comment, Defval = Na
Instant (bool) : Is For Exit Execution Type, Defval = false
Returns: Void
CloseShort(ExitID, PercentageClose, Comment, CommentValue, Instant)
Exits A Short Order Based On A Specified Condition
Parameters:
ExitID (string) : Is The Trade ID That Will Be Closed, Defval = "Short"
PercentageClose (float) : Is The Amount To Close The Order At (In Percentage) Defval = 100
Comment (string) : Is The Order Comment, Defval = Exit Order
CommentValue (string) : Is For Custom Values In The Order Comment, Defval = Na
Instant (bool) : Is For Exit Execution Type, Defval = false
Returns: Void
BrokerCheck(Broker)
Checks Traded Broker With Current Loaded Chart Broker
Parameters:
Broker (string) : Is The Current Broker That Is Traded
Returns: Bool - True If Current Traded Broker Is Same As Loaded Chart Broker
OpenPC(LicenseID, OrderType, UseLimit, LimitPrice, SymbolPrefix, Symbol, SymbolSuffix, Risk, SL, TP, OrderComment, Spread)
Compiles Given Parameters Into An Alert String Format To Open Trades Using Pine Connector
Parameters:
LicenseID (string) : Is The Users PineConnector LicenseID
OrderType (int) : Is The Desired OrderType To Open
UseLimit (bool) : Is If We Want To Enter The Position At Exactly The Previous Closing Price
LimitPrice (float) : Is The Limit Price Of The Trade (Only For Pending Orders)
SymbolPrefix (string) : Is The Current Symbol Prefix (If Any)
Symbol (string) : Is The Traded Symbol
SymbolSuffix (string) : Is The Current Symbol Suffix (If Any)
Risk (float) : Is The Trade Risk Per Trade / Fixed Lot Sizing
SL (float) : Is The Trade SL In Price / In Pips
TP (float) : Is The Trade TP In Price / In Pips
OrderComment (string) : Is The Executed Trade Comment
Spread (float) : is The Maximum Spread For Execution
Returns: String - Pine Connector Order Syntax Alert Message
ClosePC(LicenseID, OrderType, SymbolPrefix, Symbol, SymbolSuffix)
Compiles Given Parameters Into An Alert String Format To Close Trades Using Pine Connector
Parameters:
LicenseID (string) : Is The Users PineConnector LicenseID
OrderType (int) : Is The Desired OrderType To Close
SymbolPrefix (string) : Is The Current Symbol Prefix (If Any)
Symbol (string) : Is The Traded Symbol
SymbolSuffix (string) : Is The Current Symbol Suffix (If Any)
Returns: String - Pine Connector Order Syntax Alert Message
//====================================================================================================================================================
// Custom Backtesting Calculation Functions
//====================================================================================================================================================
CalculatePNL(EntryPrice, ExitPrice, LotSize, ConversionRate)
Calculates Trade PNL Based On Entry, Eixt & Lot Size
Parameters:
EntryPrice (float) : Is The Trade Entry
ExitPrice (float) : Is The Trade Exit
LotSize (float) : Is The Trade Sizing
ConversionRate (float) : Is The Currency Conversion Rate (Used For Complex Lot Sizing Only)
Returns: Float - The Current Trade PNL
UpdateBalance(PrevBalance, PNL)
Updates The Previous Ginve Balance To The Next PNL
Parameters:
PrevBalance (float) : Is The Previous Balance To Be Updated
PNL (float) : Is The Current Trade PNL To Be Added
Returns: Float - The Current Updated PNL
CalculateSlpComm(PNL, MaxRate)
Calculates Random Slippage & Commisions Fees Based On The Parameters
Parameters:
PNL (float) : Is The Current Trade PNL
MaxRate (float) : Is The Upper Limit (In Percentage) Of The Randomized Fee
Returns: Float - A Percentage Fee Of The Current Trade PNL
UpdateDD(MaxBalance, Balance)
Calculates & Updates The DD Based On Its Given Parameters
Parameters:
MaxBalance (float) : Is The Maximum Balance Ever Recorded
Balance (float) : Is The Current Account Balance
Returns: Float - The Current Strategy DD
CalculateWR(TotalTrades, LongID, ShortID)
Calculate The Total, Long & Short Trades Win Rate
Parameters:
TotalTrades (int) : Are The Current Total Trades That The Strategy Has Taken
LongID (string) : Is The Order ID Of The Long Trades Of The Strategy
ShortID (string) : Is The Order ID Of The Short Trades Of The Strategy
Returns: Tuple Of Long WR%, Short WR%, Total WR%, Total Winning Trades, Total Losing Trades, Total Long Trades & Total Short Trades
CalculateAvgRRR(WinTrades, LossTrades)
Calculates The Overall Strategy Avg Risk Reward Ratio
Parameters:
WinTrades (int) : Are The Strategy Winning Trades
LossTrades (int) : Are The Strategy Losing Trades
Returns: Float - The Average RRR Values
CAGR(StartTime, StartPrice, EndTime, EndPrice)
Calculates The CAGR Over The Given Time Period © TradingView
Parameters:
StartTime (int) : Is The Starting Time Of The Calculation
StartPrice (float) : Is The Starting Price Of The Calculation
EndTime (int) : Is The Ending Time Of The Calculation
EndPrice (float) : Is The Ending Price Of The Calculation
Returns: Float - The CAGR Values
//====================================================================================================================================================
// Custom Plot Functions
//====================================================================================================================================================
EditLabels(LabelID, X1, Y1, Text, Color, TextColor, EditCondition, DeleteCondition)
Edit / Delete Labels
Parameters:
LabelID (label) : Is The ID Of The Selected Label
X1 (int) : Is The X1 Coordinate IN BARINDEX Xloc
Y1 (float) : Is The Y1 Coordinate IN PRICE Yloc
Text (string) : Is The Text Than Wants To Be Written In The Label
Color (color) : Is The Color Value Change Of The Label Text
TextColor (color)
EditCondition (int) : Is The Edit Condition of The Line (Setting Location / Color)
DeleteCondition (bool) : Is The Delete Condition Of The Line If Ture Deletes The Prev Itteration Of The Line
Returns: Void
EditLine(LineID, X1, Y1, X2, Y2, Color, EditCondition, DeleteCondition)
Edit / Delete Lines
Parameters:
LineID (line) : Is The ID Of The Selected Line
X1 (int) : Is The X1 Coordinate IN BARINDEX Xloc
Y1 (float) : Is The Y1 Coordinate IN PRICE Yloc
X2 (int) : Is The X2 Coordinate IN BARINDEX Xloc
Y2 (float) : Is The Y2 Coordinate IN PRICE Yloc
Color (color) : Is The Color Value Change Of The Line
EditCondition (int) : Is The Edit Condition of The Line (Setting Location / Color)
DeleteCondition (bool) : Is The Delete Condition Of The Line If Ture Deletes The Prev Itteration Of The Line
Returns: Void
//====================================================================================================================================================
// Custom Display Functions (Using Tables)
//====================================================================================================================================================
FillTable(TableID, Column, Row, Title, Value, BgColor, TextColor, ToolTip)
Filling The Selected Table With The Inputed Information
Parameters:
TableID (table) : Is The Table ID That Wants To Be Edited
Column (int) : Is The Current Column Of The Table That Wants To Be Edited
Row (int) : Is The Current Row Of The Table That Wants To Be Edited
Title (string) : Is The String Title Of The Current Cell Table
Value (string) : Is The String Value Of The Current Cell Table
BgColor (color) : Is The Selected Color For The Current Table
TextColor (color) : Is The Selected Color For The Current Table
ToolTip (string) : Is The ToolTip Of The Current Cell In The Table
Returns: Void
DisplayBTResults(TableID, BgColor, TextColor, StartingBalance, Balance, DollarReturn, TotalPips, MaxDD)
Filling The Selected Table With The Inputed Information
Parameters:
TableID (table) : Is The Table ID That Wants To Be Edited
BgColor (color) : Is The Selected Color For The Current Table
TextColor (color) : Is The Selected Color For The Current Table
StartingBalance (float) : Is The Account Starting Balance
Balance (float)
DollarReturn (float) : Is The Account Dollar Reture
TotalPips (float) : Is The Total Pips Gained / loss
MaxDD (float) : Is The Maximum Drawdown Over The Backtesting Period
Returns: Void
DisplayBTResultsV2(TableID, BgColor, TextColor, TotalWR, QTCount, LongWR, ShortWR, InitialCapital, CumProfit, CumFee, AvgRRR, MaxDD, CAGR, MeanDD)
Filling The Selected Table With The Inputed Information
Parameters:
TableID (table) : Is The Table ID That Wants To Be Edited
BgColor (color) : Is The Selected Color For The Current Table
TextColor (color) : Is The Selected Color For The Current Table
TotalWR (float) : Is The Strategy Total WR In %
QTCount (int) : Is The Strategy Questionable Trades Count
LongWR (float) : Is The Strategy Total WR In %
ShortWR (float) : Is The Strategy Total WR In %
InitialCapital (float) : Is The Strategy Initial Starting Capital
CumProfit (float) : Is The Strategy Ending Cumulative Profit
CumFee (float) : Is The Strategy Ending Cumulative Fee (Based On Randomized Fee Assumptions)
AvgRRR (float) : Is The Strategy Average Risk Reward Ratio
MaxDD (float) : Is The Strategy Maximum DrawDown In Its Backtesting Period
CAGR (float) : Is The Strategy Compounded Average GRowth In %
MeanDD (float) : Is The Strategy Mean / Average Drawdown In The Backtesting Period
Returns: Void
//====================================================================================================================================================
// Custom Pattern Detection Functions
//====================================================================================================================================================
BullFib(priceLow, priceHigh, fibRatio)
Calculates A Bullish Fibonacci Value (From Swing Low To High) © ZenAndTheArtOfTrading
Parameters:
priceLow (float)
priceHigh (float)
fibRatio (float)
Returns: The Fibonacci Value Of The Given Ratio Between The Two Price Points
BearFib(priceLow, priceHigh, fibRatio)
Calculates A Bearish Fibonacci Value (From Swing High To Low) © ZenAndTheArtOfTrading
Parameters:
priceLow (float)
priceHigh (float)
fibRatio (float)
Returns: The Fibonacci Value Of The Given Ratio Between The Two Price Points
GetBodySize()
Gets The Current Candle Body Size IN POINTS © ZenAndTheArtOfTrading
Returns: The Current Candle Body Size IN POINTS
GetTopWickSize()
Gets The Current Candle Top Wick Size IN POINTS © ZenAndTheArtOfTrading
Returns: The Current Candle Top Wick Size IN POINTS
GetBottomWickSize()
Gets The Current Candle Bottom Wick Size IN POINTS © ZenAndTheArtOfTrading
Returns: The Current Candle Bottom Wick Size IN POINTS
GetBodyPercent()
Gets The Current Candle Body Size As A Percentage Of Its Entire Size Including Its Wicks © ZenAndTheArtOfTrading
Returns: The Current Candle Body Size IN PERCENTAGE
GetTopWickPercent()
Gets The Current Top Wick Size As A Percentage Of Its Entire Body Size
Returns: Float - The Current Candle Top Wick Size IN PERCENTAGE
GetBottomWickPercent()
Gets The Current Bottom Wick Size As A Percentage Of Its Entire Bodu Size
Returns: Float - The Current Candle Bottom Size IN PERCENTAGE
BullishEC(Allowance, RejectionWickSize, EngulfWick, NearSwings, SwingLookBack)
Checks If The Current Bar Is A Bullish Engulfing Candle
Parameters:
Allowance (int) : To Give Flexibility Of Engulfing Pattern Detection In Markets That Have Micro Gaps, Defval = 0
RejectionWickSize (float) : To Filter Out long (Upper And Lower) Wick From The Bullsih Engulfing Pattern, Defval = na
EngulfWick (bool) : To Specify If We Want The Pattern To Also Engulf Its Upper & Lower Previous Wicks, Defval = false
NearSwings (bool) : To Specify If We Want The Pattern To Be Near A Recent Swing Low, Defval = true
SwingLookBack (int) : To Specify How Many Bars Back To Detect A Recent Swing Low, Defval = 10
Returns: Bool - True If The Current Bar Matches The Requirements of a Bullish Engulfing Candle
BearishEC(Allowance, RejectionWickSize, EngulfWick, NearSwings, SwingLookBack)
Checks If The Current Bar Is A Bearish Engulfing Candle
Parameters:
Allowance (int) : To Give Flexibility Of Engulfing Pattern Detection In Markets That Have Micro Gaps, Defval = 0
RejectionWickSize (float) : To Filter Out long (Upper And Lower) Wick From The Bearish Engulfing Pattern, Defval = na
EngulfWick (bool) : To Specify If We Want The Pattern To Also Engulf Its Upper & Lower Previous Wicks, Defval = false
NearSwings (bool) : To Specify If We Want The Pattern To Be Near A Recent Swing High, Defval = true
SwingLookBack (int) : To Specify How Many Bars Back To Detect A Recent Swing High, Defval = 10
Returns: Bool - True If The Current Bar Matches The Requirements of a Bearish Engulfing Candle
Hammer(Fib, ColorMatch, NearSwings, SwingLookBack, ATRFilterCheck, ATRPeriod)
Checks If The Current Bar Is A Hammer Candle
Parameters:
Fib (float) : To Specify Which Fibonacci Ratio To Use When Determining The Hammer Candle, Defval = 0.382 Ratio
ColorMatch (bool) : To Filter Only Bullish Closed Hammer Candle Pattern, Defval = false
NearSwings (bool) : To Specify If We Want The Doji To Be Near A Recent Swing Low, Defval = true
SwingLookBack (int) : To Specify How Many Bars Back To Detect A Recent Swing Low, Defval = 10
ATRFilterCheck (float) : To Filter Smaller Hammer Candles That Might Be Better Classified As A Doji Candle, Defval = 1
ATRPeriod (simple int) : To Change ATR Period Of The ATR Filter, Defval = 20
Returns: Bool - True If The Current Bar Matches The Requirements of a Hammer Candle
Star(Fib, ColorMatch, NearSwings, SwingLookBack, ATRFilterCheck, ATRPeriod)
Checks If The Current Bar Is A Hammer Candle
Parameters:
Fib (float) : To Specify Which Fibonacci Ratio To Use When Determining The Hammer Candle, Defval = 0.382 Ratio
ColorMatch (bool) : To Filter Only Bullish Closed Hammer Candle Pattern, Defval = false
NearSwings (bool) : To Specify If We Want The Doji To Be Near A Recent Swing Low, Defval = true
SwingLookBack (int) : To Specify How Many Bars Back To Detect A Recent Swing Low, Defval = 10
ATRFilterCheck (float) : To Filter Smaller Hammer Candles That Might Be Better Classified As A Doji Candle, Defval = 1
ATRPeriod (simple int) : To Change ATR Period Of The ATR Filter, Defval = 20
Returns: Bool - True If The Current Bar Matches The Requirements of a Hammer Candle
Doji(MaxWickSize, MaxBodySize, DojiType, NearSwings, SwingLookBack)
Checks If The Current Bar Is A Doji Candle
Parameters:
MaxWickSize (float) : To Specify The Maximum Lenght Of Its Upper & Lower Wick, Defval = 2
MaxBodySize (float) : To Specify The Maximum Lenght Of Its Candle Body IN PERCENT, Defval = 0.05
DojiType (int)
NearSwings (bool) : To Specify If We Want The Doji To Be Near A Recent Swing High / Low (Only In Dragonlyf / Gravestone Mode), Defval = true
SwingLookBack (int) : To Specify How Many Bars Back To Detect A Recent Swing High / Low (Only In Dragonlyf / Gravestone Mode), Defval = 10
Returns: Bool - True If The Current Bar Matches The Requirements of a Doji Candle
BullishIB(Allowance, RejectionWickSize, EngulfWick, NearSwings, SwingLookBack)
Checks If The Current Bar Is A Bullish Harami Candle
Parameters:
Allowance (int) : To Give Flexibility Of Harami Pattern Detection In Markets That Have Micro Gaps, Defval = 0
RejectionWickSize (float) : To Filter Out long (Upper And Lower) Wick From The Bullsih Harami Pattern, Defval = na
EngulfWick (bool) : To Specify If We Want The Pattern To Also Engulf Its Upper & Lower Previous Wicks, Defval = false
NearSwings (bool) : To Specify If We Want The Pattern To Be Near A Recent Swing Low, Defval = true
SwingLookBack (int) : To Specify How Many Bars Back To Detect A Recent Swing Low, Defval = 10
Returns: Bool - True If The Current Bar Matches The Requirements of a Bullish Harami Candle
BearishIB(Allowance, RejectionWickSize, EngulfWick, NearSwings, SwingLookBack)
Checks If The Current Bar Is A Bullish Harami Candle
Parameters:
Allowance (int) : To Give Flexibility Of Harami Pattern Detection In Markets That Have Micro Gaps, Defval = 0
RejectionWickSize (float) : To Filter Out long (Upper And Lower) Wick From The Bearish Harami Pattern, Defval = na
EngulfWick (bool) : To Specify If We Want The Pattern To Also Engulf Its Upper & Lower Previous Wicks, Defval = false
NearSwings (bool) : To Specify If We Want The Pattern To Be Near A Recent Swing High, Defval = true
SwingLookBack (int) : To Specify How Many Bars Back To Detect A Recent Swing High, Defval = 10
Returns: Bool - True If The Current Bar Matches The Requirements of a Bearish Harami Candle
//====================================================================================================================================================
// Custom Time Functions
//====================================================================================================================================================
BarInSession(sess, useFilter)
Determines if the current price bar falls inside the specified session © ZenAndTheArtOfTrading
Parameters:
sess (simple string)
useFilter (bool)
Returns: A boolean - true if the current bar falls within the given time session
BarOutSession(sess, useFilter)
Determines if the current price bar falls outside the specified session © ZenAndTheArtOfTrading
Parameters:
sess (simple string)
useFilter (bool)
Returns: A boolean - true if the current bar falls outside the given time session
DateFilter(startTime, endTime)
Determines if this bar's time falls within date filter range © ZenAndTheArtOfTrading
Parameters:
startTime (int)
endTime (int)
Returns: A boolean - true if the current bar falls within the given dates
DayFilter(monday, tuesday, wednesday, thursday, friday, saturday, sunday)
Checks if the current bar's day is in the list of given days to analyze © ZenAndTheArtOfTrading
Parameters:
monday (bool)
tuesday (bool)
wednesday (bool)
thursday (bool)
friday (bool)
saturday (bool)
sunday (bool)
Returns: A boolean - true if the current bar's day is one of the given days
AUSSess()
Checks If The Current Australian Forex Session In Running
Returns: Bool - True If Currently The Australian Session Is Running
ASIASess()
Checks If The Current Asian Forex Session In Running
Returns: Bool - True If Currently The Asian Session Is Running
EURSess()
Checks If The Current European Forex Session In Running
Returns: Bool - True If Currently The European Session Is Running
USSess()
Checks If The Current US Forex Session In Running
Returns: Bool - True If Currently The US Session Is Running
UNIXToDate(Time, ConversionType, TimeZone)
Converts UNIX Time To Datetime
Parameters:
Time (int) : Is The UNIX Time Input
ConversionType (int) : Is The Datetime Output Format, Defval = DD-MM-YYYY
TimeZone (string) : Is To Convert The Outputed Datetime Into The Specified Time Zone, Defval = Exchange Time Zone
Returns: String - String Of Datetime

[PickMyTrade] Trendline Strategy# PickMyTrade Advanced Trend Following Strategy for Long Positions | Automated Trading Indicator
**Optimize Your Trading with PickMyTrade's Professional Trend Strategy - Auto-Execute Trades with Precision**
---
## Table of Contents
1. (#overview)
2. (#why-this-strategy-makes-money)
3. (#key-features)
4. (#how-it-works)
5. (#strategy-settings--configuration)
6. (#pickmytrade-integration)
7. (#advanced-features)
8. (#risk-management)
9. (#best-practices)
10. (#performance-optimization)
11. (#getting-started)
12. (#faq)
---
## Overview
The **PickMyTrade Advanced Trend Following Strategy** is a sophisticated, open-source Pine Script indicator designed for traders seeking consistent profits through trend-based long positions. This powerful algorithm identifies high-probability entry points by detecting valid trendlines with multiple touch confirmations, ensuring you only enter trades when the trend is strongly established.
### What Makes This Strategy Unique?
- **Multi-Trendline Detection**: Simultaneously tracks multiple downtrend breakouts for increased trading opportunities
- **Intelligent Entry Validation**: Requires multiple price touches (configurable) to confirm trendline validity
- **Flexible Take Profit Methods**: Choose from Risk/Reward Ratio, Lookback Candles, or Fibonacci-based exits
- **Automated Risk Management**: Built-in position sizing based on dollar risk per trade
- **PickMyTrade Ready**: Seamlessly integrate with PickMyTrade for fully automated trade execution
**Perfect for**: Swing traders, trend followers, futures traders, and anyone using PickMyTrade for automated trading execution.
---
## Why This Strategy Makes Money
### 1. **Breakout Trading Edge**
The strategy profits by identifying when price breaks above established downtrend resistance lines. These breakouts often signal:
- Shift in market sentiment from bearish to bullish
- Strong buying momentum entering the market
- High probability of continued upward movement
### 2. **Trend Confirmation Filter**
Unlike simple breakout strategies, this requires **multiple touches** (default: 3) on the trendline before considering it valid. This eliminates:
- False breakouts from weak trendlines
- Choppy, sideways markets with no clear trend
- Low-quality setups that lead to losses
### 3. **Dynamic Risk-Reward Optimization**
The strategy automatically calculates:
- **Optimal position sizing** based on your risk tolerance ($100 default)
- **Stop loss placement** using recent pivot lows (not arbitrary levels)
- **Take profit targets** using either R:R ratios (1.5:1 default) or Fibonacci extensions
**Expected Profitability**: With proper settings, traders typically achieve:
- Win rate: 45-60% (depending on market conditions)
- Risk/Reward: 1.5:1 to 2.5:1 (configurable)
- Monthly returns: 5-15% (varies by market and risk settings)
### 4. **Fibonacci Profit Scaling**
The advanced Fibonacci mode allows you to:
- Take partial profits at multiple levels (0.618, 1.0, 1.312, 1.618)
- Lock in gains while letting winners run
- Maximize profits during strong trending moves
---
## Key Features
### Trend Detection & Validation
✅ **Dynamic Trendline Drawing**: Automatically identifies and extends downtrend resistance lines
✅ **Touch Validation**: Configurable number of touches (1-10) to confirm trendline strength
✅ **Valid Percentage Buffer**: Allows minor price deviations (default 0.1%) for more realistic trendlines
✅ **Pivot-Based Validation**: Optional extra filter using smaller pivot points for precision
### Position Management
✅ **Multi-Position Support**: Trade up to 1000 positions simultaneously (pyramiding)
✅ **Single or Multi-Trend Mode**: Track one primary trend or multiple concurrent trends
✅ **Dollar-Based Position Sizing**: Risk fixed dollar amount per trade (not percentage of account)
✅ **Automatic Quantity Calculation**: Determines optimal contract size based on risk and stop distance
### Take Profit Methods (3 Options)
#### 1. **Risk/Reward Ratio** (Recommended for Beginners)
- Set desired R:R (default 1.5:1)
- Simple, consistent profit targets
- Works well in trending markets
#### 2. **Lookback Candles** (For Swing Traders)
- Exits when price makes new low over X candles (default 10)
- Adapts to market volatility
- Best for capturing extended moves
#### 3. **Fibonacci Extensions** (For Advanced Traders)
- Up to 4 profit targets: 61.8%, 100%, 131.2%, 161.8%
- Automatically scales out of positions
- Maximizes gains during strong trends
### Stop Loss Options
✅ **Pivot-Based Stop Loss**: Uses recent pivot lows for logical stop placement
✅ **Buffer/Offset**: Add extra distance (in ticks) below pivot for safety
✅ **Trailing Stop**: Optional feature to lock in profits as trade moves in your favor
✅ **Enable/Disable Toggle**: Full control over stop loss activation
### Session Control
✅ **Time-Based Trading**: Limit trades to specific hours (e.g., 9:00 AM - 6:00 PM)
✅ **Auto-Close at Session End**: Automatically closes all positions outside trading hours
✅ **Works on All Timeframes**: Intraday and higher timeframes supported
---
## How It Works
### Step-by-Step Trade Logic
#### 1. **Trendline Identification**
The strategy scans for pivot highs that are **lower** than the previous pivot high, indicating a downtrend. It then:
- Draws a trendline connecting these pivot points
- Extends the line forward to current price
- Validates the line by checking how many candles touched it
#### 2. **Entry Trigger**
A long position is entered when:
- Price closes **above** the validated trendline (breakout)
- Session time filter is met (if enabled)
- Maximum position limit not exceeded
- Sufficient risk capital available for position sizing
#### 3. **Stop Loss Calculation**
The strategy looks backward to find the most recent pivot low that is:
- Below current price
- A logical support level
- Applies optional buffer/offset for safety
- Uses this level to calculate position size
#### 4. **Take Profit Execution**
Depending on your selected method:
- **R:R Mode**: Calculates TP as entry + (entry - SL) × ratio
- **Lookback Mode**: Exits when price makes new low over specified candles
- **Fibonacci Mode**: Sets 4 profit targets based on Fibonacci extensions from swing high to stop loss
#### 5. **Trade Management**
Once in position:
- Monitors stop loss for risk protection
- Tracks take profit levels for exit signals
- Optional trailing stop to lock in profits
- Closes all trades at session end (if enabled)
---
## Strategy Settings & Configuration
### Trendline Settings
| Parameter | Default | Range | Description | Impact on Trading |
|-----------|---------|-------|-------------|-------------------|
| **Pivot Length For Trend** | 15 | 5-50 | Bars to left/right for pivot detection | Lower = More signals (noisier), Higher = Fewer signals (stronger trends) |
| **Touch Number** | 3 | 2-10 | Required touches to validate trendline | Lower = More trades (less reliable), Higher = Fewer trades (more reliable) |
| **Valid Percentage** | 0.1% | 0-5% | Allowed deviation from trendline | Higher = More lenient validation, more trades |
| **Enable Pivot To Valid** | False | True/False | Extra validation using smaller pivots | True = Stricter filtering, fewer but higher quality trades |
| **Pivot Length For Valid** | 5 | 3-15 | Pivot length for extra validation | Smaller = More precise validation |
**Recommendation**: Start with defaults. In choppy markets, increase touch number to 4-5. In strongly trending markets, reduce to 2.
### Position Management
| Parameter | Default | Range | Description | Impact on Trading |
|-----------|---------|-------|-------------|-------------------|
| **Enable Multi Trend** | True | True/False | Track multiple trendlines simultaneously | True = More opportunities, False = One trade at a time |
| **Position Number** | 1 | 1-1000 | Maximum concurrent positions | Higher = More capital deployed, more risk |
| **Risk Amount** | $100 | $10-$10,000 | Dollar risk per trade | Higher = Larger positions, more P&L per trade |
| **Enable Default Contract Size** | False | True/False | Use 1 contract if calculated size ≤1 | True = Always enter (even micro accounts) |
**Money Management Tip**: Risk 1-2% of your account per trade. If you have $10,000, set Risk Amount to $100-$200.
### Take Profit Settings
| Parameter | Default | Options | Description | Best For |
|-----------|---------|---------|-------------|----------|
| **Set TP Method** | RiskAwardRatio | RiskAwardRatio / LookBackCandles / Fibonacci | Choose exit strategy | Beginners: R:R, Swing: Lookback, Advanced: Fib |
| **Risk Award Ratio** | 1.5 | 1.0-5.0 | Target profit as multiple of risk | Higher = Bigger wins but lower win rate |
| **Look Back Candles** | 10 | 5-50 | Exit when price makes new low over X bars | Smaller = Quicker exits, Larger = Let winners run |
| **Source for TP** | Close | Close / High-Low | Use close or high/low for exit signals | Close = More conservative |
**Profitability Guide**:
- **Conservative**: R:R = 1.5, Lookback = 10
- **Balanced**: R:R = 2.0, Lookback = 15
- **Aggressive**: R:R = 2.5, Fibonacci mode with 1.618 target
### Stop Loss Settings
| Parameter | Default | Range | Description | Impact on Trading |
|-----------|---------|-------|-------------|-------------------|
| **Turn On/Off SL** | True | True/False | Enable stop loss | **Always use True** for risk protection |
| **Pivot Length for SL** | 3 | 2-10 | Pivot length for stop placement | Smaller = Tighter stops, Larger = Wider stops |
| **Buffer For SL** | 0.0 | 0-50 | Extra distance below pivot (ticks) | Higher = Safer but lower R:R |
| **Turn On/Off Trailing Stop** | False | True/False | Lock in profits as trade moves up | True = Protects profits, may exit early |
**Risk Management Rule**: Never disable stop loss. Use buffer in volatile markets (5-10 ticks).
### Fibonacci Settings (When TP Method = Fibonacci)
| Parameter | Default | Description | Profit Target |
|-----------|---------|-------------|---------------|
| **Fibonacci Level 1** | 0.618 | First profit target | 61.8% of swing range |
| **Fibonacci Level 2** | 1.0 | Second profit target | 100% of swing range |
| **Fibonacci Level 3** | 1.312 | Third profit target | 131.2% extension |
| **Fibonacci Level 4** | 1.618 | Fourth profit target | 161.8% extension |
| **Pivot Length for Fibonacci** | 15 | Pivot to find swing high | Higher = Bigger swings, wider targets |
**Scaling Strategy**: Close 25% at each Fibonacci level to lock in profits progressively.
### Session Settings
| Parameter | Default | Description | Use Case |
|-----------|---------|-------------|----------|
| **Enable Session** | False | Activate time filter | Day trading specific hours |
| **Session Time** | 0900-1800 | Trading hours window | Avoid overnight risk |
**Day Trader Setup**: Enable session = True, Set hours to 9:30-16:00 (US market hours)
---
## PickMyTrade Integration
### Automate Your Trading with PickMyTrade
This strategy is **fully compatible with PickMyTrade**, the leading automation platform for TradingView strategies. Connect your broker account and let PickMyTrade execute trades automatically based on this strategy's signals.
### Why Use PickMyTrade?
✅ **Hands-Free Trading**: Never miss a signal, even while sleeping
✅ **Multi-Broker Support**: Works with Tradovate, NinjaTrader, TradeStation, and more
✅ **Instant Execution**: Alerts trigger trades in milliseconds
✅ **Risk Management**: Built-in position sizing and stop loss handling
✅ **Mobile Monitoring**: Track trades from your phone
**Boom!** Your strategy is now fully automated. Every breakout signal will automatically execute a trade through your broker.
### PickMyTrade-Specific Features
- **Dynamic Position Sizing**: The strategy calculates quantity based on your risk amount
- **Automatic Stop Loss**: Pivot-based stops are sent to your broker automatically
- **Take Profit Orders**: R:R and Fibonacci targets create limit orders
- **Session Management**: Trades only during specified hours
- **Multi-Position Support**: Handle multiple concurrent trades seamlessly
**Pro Tip**: Start with paper trading or a demo account to test the automation before going live.
---
## Advanced Features
### 1. Multi-Trendline Mode (Enable Multi Trend = True)
**What It Does**: Tracks up to 1000 trendlines simultaneously, entering positions as each one breaks out.
**Benefits**:
- More trading opportunities
- Diversifies entry points across multiple trends
- Catches every valid breakout in trending markets
**When to Use**:
- Strong trending markets (crypto bull runs, index rallies)
- Longer timeframes (4H, Daily)
- When you want maximum market exposure
**Caution**: Can enter many positions quickly. Set appropriate Position Number limit and Risk Amount.
### 2. Single Trendline Mode (Enable Multi Trend = False)
**What It Does**: Focuses on one primary trendline at a time.
**Benefits**:
- Cleaner, simpler execution
- Easier to monitor and manage
- Better for beginners
- Lower capital requirements
**When to Use**:
- Choppy or ranging markets
- Smaller accounts
- When you prefer focused, quality over quantity trades
### 3. Fibonacci Profit Scaling
**How It Works**:
1. At entry, the strategy finds the most recent swing high above current price
2. Calculates the range from swing high to stop loss
3. Projects 4 Fibonacci extensions: 61.8%, 100%, 131.2%, 161.8%
4. Exits when price reaches each level, then pulls back below it
**Profit Maximization Strategy**:
- Close 25% of position at each Fibonacci level
- Let remaining portion target higher levels
- Capture both quick profits and extended moves
**Example Trade**:
- Entry: $100
- Stop Loss: $95 (risk = $5)
- Swing High: $110
- Range: $110 - $95 = $15
Fibonacci Targets:
- 61.8% = $95 + ($15 × 0.618) = $104.27 (+4.27%)
- 100% = $95 + ($15 × 1.0) = $110 (+10%)
- 131.2% = $95 + ($15 × 1.312) = $114.68 (+14.68%)
- 161.8% = $95 + ($15 × 1.618) = $119.27 (+19.27%)
**Result**: Even if only first two targets hit, you lock in +7% average gain vs. -5% risk = 1.4:1 R:R
### 4. Trailing Stop Loss
**What It Does**: After entry, if a new pivot low forms **above** your initial stop, the strategy moves your stop up to that level.
**Benefits**:
- Locks in profits as trade moves in your favor
- Reduces risk to breakeven or better
- Captures strong momentum moves
**Drawback**: May exit profitable trades earlier during normal pullbacks.
**Best Practice**: Use in strongly trending markets. Disable in choppy conditions.
### 5. Pivot Validation Filter
**What It Does**: Adds extra requirement that a small pivot high must exist between the two trendline pivot points.
**Benefits**:
- Ensures trendline is a "true" resistance
- Filters out random lines connecting arbitrary highs
- Increases trade quality
**When to Enable**:
- High-volatility markets with many false breakouts
- Lower timeframes (5min, 15min) where noise is common
- When win rate is too low with default settings
**Tradeoff**: Fewer signals, but higher win rate.
### 6. Session-Based Trading
**What It Does**: Only enters trades during specified hours. Auto-closes all positions outside session.
**Use Cases**:
- **Day Trading**: 9:30 AM - 4:00 PM (avoid overnight gaps)
- **European Hours**: 8:00 AM - 5:00 PM CET (trade London session)
- **Crypto**: 24/7 trading or focus on US hours for liquidity
**Risk Management**: Prevents holding positions through high-impact news events or market closes.
---
## Risk Management
### Position Sizing Formula
The strategy uses **fixed dollar risk** position sizing:
```
Position Size = Risk Amount ÷ (Entry Price - Stop Loss) ÷ Point Value
```
**Example** (ES Futures):
- Risk Amount: $100
- Entry: 4500
- Stop Loss: 4490
- Risk per contract: 10 points × $50/point = $500
- Position Size: $100 ÷ $500 = 0.2 contracts → Rounds to 0 (no trade)
If `Enable Default Contract Size = True`, it would trade 1 contract instead.
### Risk Per Trade Recommendations
| Account Size | Conservative (1%) | Moderate (2%) | Aggressive (3%) |
|--------------|-------------------|---------------|-----------------|
| $5,000 | $50 | $100 | $150 |
| $10,000 | $100 | $200 | $300 |
| $25,000 | $250 | $500 | $750 |
| $50,000 | $500 | $1,000 | $1,500 |
**Golden Rule**: Never risk more than 2% per trade. Even with 10 losses in a row, you'd only be down 20%.
### Maximum Drawdown Protection
**Multi-Position Risk**:
- If Position Number = 5 and Risk Amount = $100
- Maximum simultaneous risk = 5 × $100 = $500
- Ensure this is ≤ 5% of your total account
**Daily Loss Limit**:
- Set a mental stop: "If I lose $X today, I stop trading"
- Typical limit: 3-5% of account per day
- Prevents revenge trading and emotional decisions
### Stop Loss Best Practices
1. **Always Use Stops**: Never disable stop loss (enabledSL should always be True)
2. **Buffer in Volatile Markets**: Add 5-10 tick buffer to avoid stop hunts
3. **Respect Your Stops**: Don't manually override or move stops further away
4. **Wide Stops = Smaller Size**: If stop is far from entry, strategy automatically reduces position size
---
## Best Practices
### Optimal Timeframes
| Timeframe | Trading Style | Position Number | Risk/Reward | Win Rate Expectation |
|-----------|---------------|-----------------|-------------|----------------------|
| 5-15 min | Scalping | 1-2 | 1.5:1 | 50-55% |
| 30 min - 1H | Intraday | 2-3 | 2:1 | 55-60% |
| 4H | Swing Trading | 3-5 | 2.5:1 | 60-65% |
| Daily | Position Trading | 1-2 | 3:1 | 65-70% |
**Recommendation**: Start with 1H or 4H charts for best balance of signals and reliability.
### Ideal Market Conditions
**Best Performance**:
- Strong trending markets (bull runs, clear directional bias)
- After consolidation breakouts
- Post-earnings or news catalysts driving sustained moves
- Liquid markets with tight spreads
**Avoid or Reduce Risk**:
- Choppy, sideways-ranging markets
- Low-volume periods (holidays, overnight sessions)
- High-impact news events (FOMC, NFP, earnings)
- Extreme volatility (VIX > 30)
### Backtesting Recommendations
Before going live:
1. **Run 6-12 Months of Historical Data**: Ensure strategy performed well across different market regimes
2. **Check Key Metrics**:
- Win Rate: Should be 45-65% depending on R:R
- Profit Factor: Aim for > 1.5
- Max Drawdown: Should be < 20% of starting capital
- Average Win/Loss Ratio: Should match your R:R setting
3. **Stress Test**: Test during known volatile periods (March 2020, Jan 2022, etc.)
4. **Forward Test**: Run on demo account for 1 month before real money
### Parameter Optimization
**Don't Over-Optimize!** Avoid curve-fitting to past data. Instead:
1. **Start with Defaults**: Use recommended settings first
2. **Change One Parameter at a Time**: Isolate what improves performance
3. **Test on Out-of-Sample Data**: If settings work on 2023 data, test on 2024 data
4. **Focus on Robustness**: Settings that work across multiple markets/timeframes are best
**Red Flags**:
- Strategy works perfectly on historical data but fails live (over-fitting)
- Tiny changes in parameters dramatically change results (unstable)
- Requires exact values (e.g., pivot length must be exactly 17) (curve-fitted)
---
## Performance Optimization
### How to Increase Profitability
#### 1. Optimize Risk/Reward Ratio
- **Current**: 1.5:1 (default)
- **Test**: 2:1, 2.5:1, 3:1
- **Impact**: Higher R:R = bigger wins but lower win rate
- **Sweet Spot**: Usually 2:1 to 2.5:1 for trend strategies
#### 2. Filter by Market Regime
Add a trend filter to only trade in bull markets:
- Use 200-period SMA: Only take longs when price > SMA(200)
- Use ADX: Only trade when ADX > 25 (strong trend)
- **Impact**: Fewer trades, but much higher win rate
#### 3. Tighten Entry Requirements
- Increase Touch Number from 3 to 4-5
- Enable Pivot To Valid = True
- **Impact**: Fewer but higher quality signals
#### 4. Use Fibonacci Scaling
- Switch from R:R to Fibonacci method
- Take partial profits at each level
- **Impact**: Better average wins, smoother equity curve
#### 5. Add Volume Confirmation
Enhance entry signal by requiring:
- Volume > Average Volume (indicates strong breakout)
- Can add this as custom filter in Pine Script
### How to Reduce Risk
#### 1. Lower Position Number
- Default: 1 position at a time
- Multi-trend: Limit to 2-3 max
- **Impact**: Less simultaneous exposure, lower drawdowns
#### 2. Reduce Risk Amount
- Start with $50 per trade (0.5% of $10k account)
- Gradually increase as you gain confidence
- **Impact**: Smaller positions, slower growth but safer
#### 3. Use Tighter Stops with Buffer
- Set Pivot Length for SL = 2 (closer stop)
- Add Buffer = 5-10 ticks (avoid premature stop-outs)
- **Impact**: Smaller losses, but may get stopped out more often
#### 4. Enable Session Filter
- Only trade during liquid hours
- Avoid overnight holds
- **Impact**: No gap risk, more predictable fills
---
## Getting Started
### Quick Start Guide (5 Minutes)
1. **Copy the Strategy Code**
- Open the `.txt` file provided
- Copy all code to clipboard
2. **Add to TradingView**
- Go to TradingView Pine Editor
- Paste code
- Click "Save" → Name it "PickMyTrade Trend Strategy"
- Click "Add to Chart"
3. **Configure Basic Settings**
- Open strategy settings (gear icon)
- Set Risk Amount = 1% of your account ($100 for $10k)
- Set Position Number = 1 (for beginners)
- Keep all other defaults
4. **Backtest on Your Market**
- Choose your instrument (ES, NQ, AAPL, BTC, etc.)
- Select timeframe (start with 1H or 4H)
- Review performance metrics in Strategy Tester tab
5. **Optimize (Optional)**
- Adjust Touch Number (2-5) to balance signals vs. quality
- Try different TP methods (R:R vs. Fibonacci)
- Test on multiple timeframes
6. **Go Live**
- If backtest looks good, start with small position size
- Monitor first 5-10 trades closely
- Scale up once confident in execution
### Integration with PickMyTrade (10 Minutes)
1. **Sign Up for PickMyTrade**
- Visit (pickmytrade.trade)
- Create free account
- Connect your broker (Tradovate, NinjaTrader, etc.)
2. **Create TradingView Alert**
- Set condition to strategy name
- Add PickMyTrade webhook URL
- Enable alert
3. **Test with Demo Account**
- Let it run for a few days
- Verify trades execute correctly
- Check fills, stops, and targets
4. **Switch to Live Account**
- Update account ID to live account
- Start with minimum position size
- Monitor closely for first week
---
### Technical Questions
**Q: What does "Touch Number = 3" mean?**
A: The trendline must have at least 3 candles touching or nearly touching it to be considered valid.
**Q: Why am I getting no trades?**
A: Trendline requirements may be too strict. Try:
- Reduce Touch Number to 2
- Increase Valid Percentage to 0.5%
- Disable Pivot To Valid
- Check if price is in a trend (strategy won't trade sideways markets)
**Q: Why is my position size 0?**
A: Risk Amount is too small for the stop distance. Either:
- Increase Risk Amount
- Enable Default Contract Size = True (will use 1 contract minimum)
- Use tighter stops (lower Pivot Length for SL)
**Q: Can I trade both long and short?**
A: Current code is long-only. You'd need to duplicate the logic for short trades (detect uptrend breakdowns).
**Q: How do I change from TradingView strategy to indicator?**
A: Change line 5 from `strategy(...)` to `indicator(...)`. Replace `strategy.entry()` and `strategy.exit()` with `alert()` calls.
### Risk Management Questions
**Q: What's the maximum drawdown I should expect?**
A: Typically 10-20% depending on settings. If experiencing > 25%, reduce position size or tighten filters.
**Q: Should I risk more to make more money?**
A: No. Risking 2% vs. 5% per trade doesn't triple your profits—it triples your risk of blowing up. Stick to 1-2% per trade.
**Q: What if I hit 5 losses in a row?**
A: Normal. Even with 60% win rate, losing streaks happen. Don't increase position size to "win it back." Stick to your risk plan.
**Q: Do I need to watch the screen all day?**
A: No, especially with PickMyTrade automation. Check positions 1-2 times per day. Overtrading kills profits.
---
## Disclaimer
**Important Risk Disclosure**:
Trading futures, stocks, forex, and cryptocurrencies involves substantial risk of loss and is not suitable for all investors. Past performance is not indicative of future results. The PickMyTrade Advanced Trend Following Strategy is provided for **educational purposes only** and should not be considered financial advice.
**Key Risks**:
- You can lose more than your initial investment
- Backtested results may not reflect live trading performance
- Market conditions change; no strategy works forever
- Automation errors can occur (connectivity, bugs, etc.)
**Before Trading**:
- Consult a licensed financial advisor
- Fully understand the strategy logic
- Test on demo account for at least 1 month
- Only risk capital you can afford to lose
- Start with minimum position sizes
**PickMyTrade**:
This strategy is compatible with PickMyTrade but is not officially endorsed by PickMyTrade. The author is not affiliated with PickMyTrade. For PickMyTrade support, visit their official website.
**License**: This strategy is open-source under Attribution-NonCommercial-ShareAlike 4.0 International (CC BY-NC-SA 4.0). You may modify and share, but not for commercial use.
---
**Ready to automate your trading with PickMyTrade? Add this strategy to your TradingView chart today and start capturing profitable trend breakouts on autopilot!**

3TF Supertrend Resonance— 4H/1H/15m+ 3TP/SLMTF Supertrend — 4H / 1H / 15m Confluence + Dynamic TP/SL + Adaptive Trend/Range Filters
This script is a multi-timeframe Supertrend confluence system designed for traders who operate on lower timeframes (15m / 1m) but want higher-timeframe structure, trend confirmation, and dynamic TP/SL projections.
It combines 4H + 1H + 15m Supertrend, trend alignment detection, range filtering, and auto-projected risk-based targets, providing a complete directional framework for both scalping and intraday swing entries.
👉1. Multi-Timeframe Supertrend Framework (4H / 1H / 15m)
The script calculates Supertrend levels and direction on three major timeframes:
-4H Supertrend
-1H Supertrend
-15m Supertrend
Users can choose between:
-Confirmed HTF values (no repaint)
-Live HTF values (more sensitive but may repaint)
Each Supertrend level is plotted on the current chart as a horizontal line, extended far to the left and slightly to the right, with optional lightweight labels showing direction and price.
These levels function as HTF dynamic support/resistance during intraday trading.
👉2. Confluence Detection (4H = 1H = 15m)
A trend confluence occurs when:
-4H direction = 1H direction = 15m direction
When the three timeframes align:
A full-height vertical line marks the first candle of confluence (color-coded bullish/bearish).
An alert is triggered:
“Triple-TF Trend Confluence — First Candle”
This identifies the earliest moment when the market shifts into unified directional behavior.
👉3. Trend Background Coloring (15m + 1m)
When confluence is active:
-Bullish confluence → Green background
-Bearish confluence → Red background
Background visualization is applied on:
-15m timeframe (main directional chart)
-1m timeframe (scalping entries with HTF alignment)
This ensures lower-timeframe decisions always stay aligned with higher-timeframe direction.
👉4. Weak-Trend / Range Detection (Only on 15m)
Even if all three timeframes are aligned, momentum may be weak.
Range/weak-trend detection activates when:
-Confluence = true
-AND (ADX < threshold OR Choppiness > threshold)
On 15m charts:
A grey overlay appears, covering green/red confluence colors.
First candle entering range shows a vertical grey mark (optional).
Alert:
“Confluence but Weak Momentum — First Candle”
This identifies moments where the market is aligned but lacking trend strength — a “trend that doesn’t move.”
👉5. Dynamic TP/SL Projection (1.5R / 3R / 4.5R)
Using the current timeframe’s Supertrend as a structural stop-loss:
SL = current Supertrend line
Risk = | Close - SL |
The script auto-calculates:
TP1 = 1.5 × risk
TP2 = 3.0 × risk
TP3 = 4.5 × risk
All projected upward for bullish trends and downward for bearish trends.
Displayed visually:
Dotted short-range lines for SL, TP1, TP2, TP3
Lightweight left-side labels showing:
SL price + distance
Individual TP prices
This provides an immediate R-multiple framework for trade planning.
👉6. 15m Supertrend Flip Indicator (Minimalistic)
When the 15m Supertrend changes direction:
A tiny circle marker is plotted:
-Bullish flip → below the bar, green
-Bearish flip → above the bar, red
Alerts:
“15m ST Flip Up (Bear → Bull)”
“15m ST Flip Down (Bull → Bear)”
This highlights early shifts in short-term structure before confluence or major trend changes occur.
👉7. Alerts Included
The script provides alerts for:
-Triple-TF Trend Confluence — First Candle
-Weak Trend / Range Start
-15m Supertrend Flip Up
-15m Supertrend Flip Down
These are practical for automated notifications when key structural conditions appear.
Summary
This script provides:
✅ Higher-Timeframe Context
4H, 1H, and 15m Supertrend levels + direction.
✅ Directional Certainty
Triple-timeframe confluence with visual + alert confirmation.
✅ Smart Background Guidance
Color-coded trend zones for 15m & 1m.
✅ Range / Weak Trend Filtering
Avoid false trends using ADX + Choppiness.
✅ Actionable TP/SL Framework
Auto-projected 1.5R / 3R / 4.5R + SL lines based on Supertrend structure.
✅ Precise Intraday Signals
15m Supertrend flips marked with minimalistic dots.

[Kpt-Ahab] Assistant: Risk & DCA PlannerScript Description – Assistant: Risk & DCA Planner
The Risk & DCA Planner is a technical assistant for position and risk management.
It automatically calculates, based on volatility (ATR%), swing structure, and your settings:
Stop-Loss (SL) and corresponding Take-Profit targets (TPs) in R-multiples
DCA (Dollar-Cost-Averaging) levels — both price and amount
A market suitability check (based on volatility & volume)
Plus a clear table and summary label displayed on the chart
The script helps you plan risk, scaling, and profit targets consistently and quantitatively.
Core Logic
Risk Profile
Three modes: Low, Normal, High.
These define how reactive the script behaves internally:
Low → conservative, longer lookbacks, tighter analysis
Normal → balanced
High → aggressive, faster reaction, wider stops
Stop-Loss (SL)
Automatically calculated from ATR% and recent swing structure, limited by minimum and maximum thresholds.
The SL percentage defines the R-unit, which all TPs and DCA levels are based on.
Take-Profits (TPs)
Up to six targets, each a multiple of the defined risk (e.g., 1R, 2R, 3R).
Prices are automatically adjusted depending on long or short direction.
DCA Strategy
Optional. Adds scaling levels evenly between Entry and SL or in multiples of the ATR.
Each DCA allocation grows geometrically until the maximum position size is reached.
Suitability Check
Evaluates whether the market is within an appropriate ATR% range and has sufficient volume.
The table displays “OK” or “Caution” depending on volatility and historical consistency.
Visualization
Lines for SL, TPs, and DCA levels
A table with all parameters, prices, and risk data
A chart label summarizing key info (profile, direction, SL%, TPs, DCA, etc.)

SMC - Complete AnalysisMC COMPLETE TRADING SYSTEM
📊 OVERVIEW
Professional Smart Money Concepts indicator with automated BUY/SELL signals, Entry/SL/TP prices, and 4-level market analysis for disciplined trading.
🎯 MAIN FEATURES
🟢 BUY/🔴 SELL Signals - Clear entry signals with exact prices
📍 ENTRY/SL/TP - Automated price calculations
🎪 Discipline Mode - High-probability setups only
⚡ Confluence Scoring - 6-factor signal validation
🏗️ 4 ANALYSIS LEVELS
Level 1: Market Structure
BOS/CHoCH/MSS detection
Displacement & Range analysis
Internal structure mapping
Level 2: Time-Based
Kill Zones (Asian/London/NY)
Session tracking
Daily/Weekly levels
Level 3: Entry & Risk
Smart entry triggers
Auto risk calculator
Target projections
Level 4: Advanced Analytics
Auto Fibonacci levels
Trend line detection
Smart money flow analysis
Strength meter
⚙️ SETTINGS
Default (Relaxed for more signals):
Minimum Confluence: 3/6
Kill Zone Required: OFF
Strength Bias Required: OFF
Risk per Trade: 2%
Risk:Reward: 3:1
📈 RECOMMENDED PAIRS
EURUSD (Beginners)
GBPUSD (Experienced)
XAUUSD (Best SMC signals)
EURJPY (Good structure)
⏰ BEST TIMEFRAMES
H1 - Recommended balance
H4 - High quality signals
M30 - More frequent signals
🎯 TRADING RULES
Trade ONLY on BUY/SELL signals
Use exact ENTRY/SL/TP prices
Set orders immediately
Wait for SL HIT or TP HIT
No modifications allowed
🔒 DISCIPLINE MODE
Shows signals only when confluence ≥3/6
All other features hidden by default
Simple status table
Forces disciplined trading
💡 USAGE
Wait for BUY or SELL signal
Note ENTRY/SL/TP prices
Execute trade exactly as shown
Hold until exit signal
Repeat
⚠️ IMPORTANT
No signal = No trading
2% risk maximum per trade
London/NY sessions preferred
Patience is key to success
🚀 Professional SMC system for consistent profitability through disciplined trading!
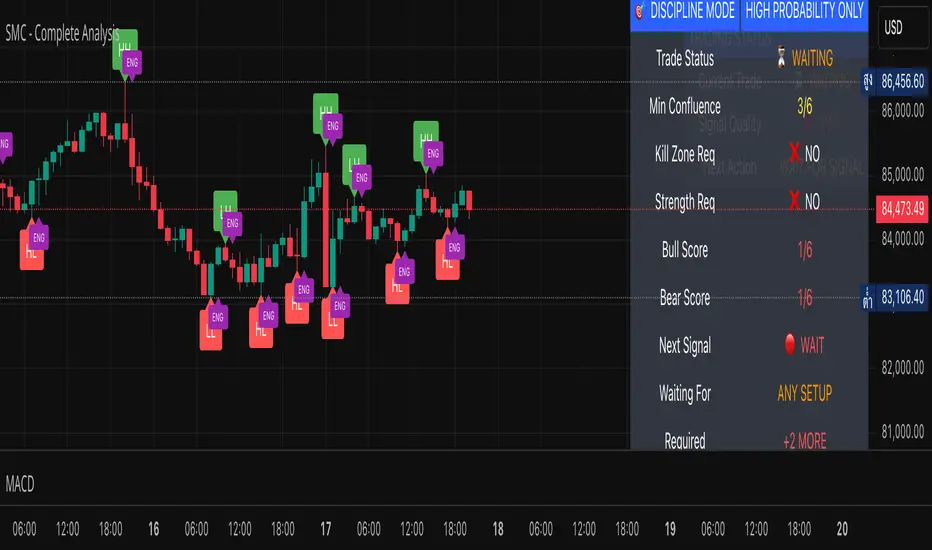
RISK MANAGEMENT CALCULATOR V3📊 RISK MANAGEMENT CALCULATOR – Lot Size, Profit & R:R Tool
This script is designed to help traders instantly calculate lot size, expected profit, and risk/reward ratio based on their trade plan.
✅ Features:
Input your Risk Amount ($), Entry, Stop Loss, and up to 3 Take Profits
Calculates:
✅ Lot Size based on risk
✅ Split profits per TP level (equally weighted)
✅ Total Profit & Risk/Reward (R:R)
Displays everything in a clean bottom-right table
Optimized for both:
🖥️ Desktop mode (larger layout)
📱 Mobile mode (toggle compact view)
💡 How to Use:
Enter your planned Entry, Stop Loss, and Risk Amount
Set any TP1, TP2, or TP3 prices (set TP to 0 if not used)
The system will auto-compute your ideal lot size and show estimated profits
🔧 Parameters:
Risk Amount ($) – how much you’re willing to lose
Entry Price – your trade entry
Stop Loss Price – your SL level
Take Profit 1/2/3 – optional TP targets
Pip Value – profit/loss per point for 1 standard lot
📱 Mobile Mode – compact the table for small screens
🔐 Notes:
No trades are executed – this is a risk planning tool only
Designed for all markets (forex, gold, indices, crypto)
TP profits are equally split (e.g. 2 TP = 50% / 50%)
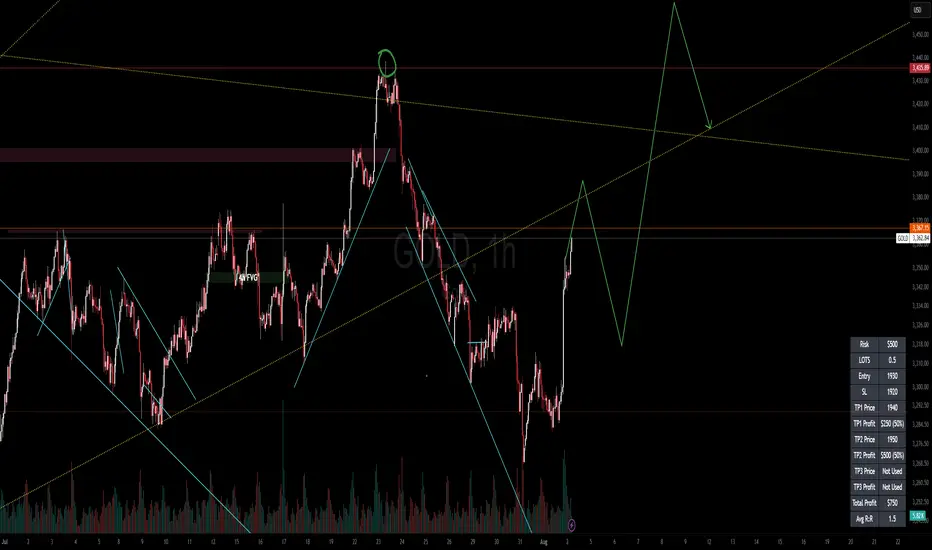
RISK MANAGEMENT CALCULATOR📊 RISK MANAGEMENT CALCULATOR – Lot Size, Profit & R:R Tool
This script is designed to help traders instantly calculate lot size, expected profit, and risk/reward ratio based on their trade plan.
✅ Features:
Input your Risk Amount ($), Entry, Stop Loss, and up to 3 Take Profits
Calculates:
✅ Lot Size based on risk
✅ Split profits per TP level (equally weighted)
✅ Total Profit & Risk/Reward (R:R)
Displays everything in a clean bottom-right table
Optimized for both:
🖥️ Desktop mode (larger layout)
📱 Mobile mode (toggle compact view)
💡 How to Use:
Enter your planned Entry, Stop Loss, and Risk Amount
Set any TP1, TP2, or TP3 prices (set TP to 0 if not used)
The system will auto-compute your ideal lot size and show estimated profits
🔧 Parameters:
Risk Amount ($) – how much you’re willing to lose
Entry Price – your trade entry
Stop Loss Price – your SL level
Take Profit 1/2/3 – optional TP targets
Pip Value – profit/loss per point for 1 standard lot
📱 Mobile Mode – compact the table for small screens
🔐 Notes:
No trades are executed – this is a risk planning tool only
Designed for all markets (forex, gold, indices, crypto)
TP profits are equally split (e.g. 2 TP = 50% / 50%)
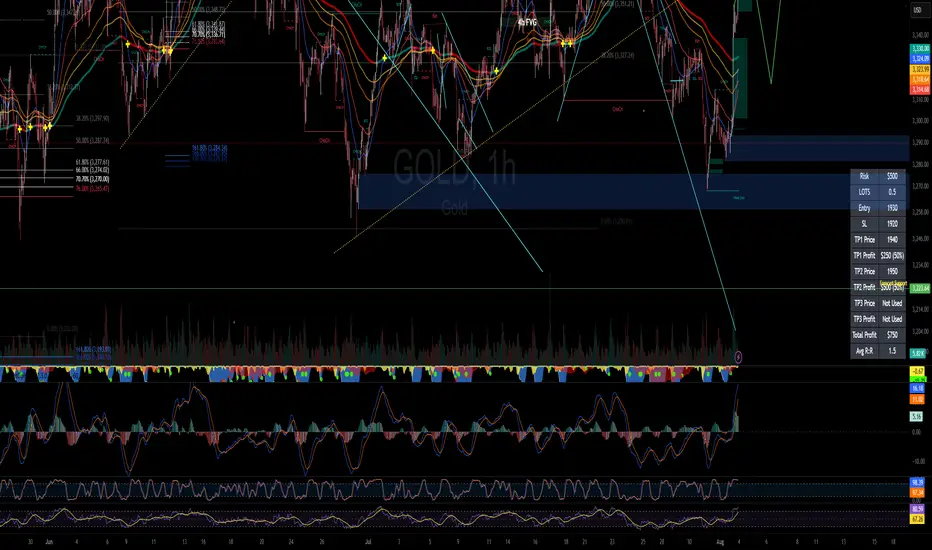
AI's Opinion Trading System V21. Complete Summary of the Indicator Script
AI’s Opinion Trading System V2 is an advanced, multi-factor trading tool designed for the TradingView platform. It combines several technical indicators (moving averages, RSI, MACD, ADX, ATR, and volume analysis) to generate buy, sell, and hold signals. The script features a customizable AI “consensus” engine that weighs multiple indicator signals, applies user-defined filters, and outputs actionable trade instructions with clear stop loss and take profit levels. The indicator also tracks sentiment, volume delta, and allows for advanced features like pyramiding (adding to positions), custom stop loss/take profit prices, and flexible signal confirmation logic. All key data and signals are displayed in a dynamic, color-coded table on the chart for easy review.
2. Full Explanation of the Table
The table is a real-time dashboard summarizing the indicator’s logic and recommendations for the most recent bars. It is color-coded for clarity and designed to help traders quickly understand market conditions and AI-driven trade signals.
Columns (from left to right):
Column Name What it Shows
Bar The time context: “Now” for the current bar, then “Bar -1”, “Bar -2”, etc. for previous bars.
Raw Consensus The raw AI consensus for each bar: “Buy”, “Sell”, or “-” (neutral).
Up Vol The amount of volume on up (rising) bars.
Down Vol The amount of volume on down (falling) bars.
Delta The difference between up and down volume. Green if positive, red if negative, gray if neutral.
Close The closing price for each bar, color-coded by price change.
Sentiment Diff The difference between the close and average sentiment price (a custom sentiment calculation).
Lookback The number of bars used for sentiment calculation (if enabled).
ADX The ADX value (trend strength).
ATR The ATR value (volatility measure).
Vol>Avg “Yes” (green) if volume is above average, “No” (red) otherwise.
Confirm Whether the AI signal is confirmed over the required bars.
Logic Output The AI’s interpreted signal after applying user-selected logic: “Buy”, “Sell”, or “-”.
Final Action The final signal after all filters: “Buy”, “Sell”, or “-”.
Trade Instruction A plain-English instruction: Buy/Sell/Add/Hold/No Action, with price, stop loss, and take profit.
Color Coding:
Green: Positive/bullish values or signals
Red: Negative/bearish values or signals
Gray: Neutral or inactive
Blue background: For all table cells, for visual clarity
White text: Default, except for color-coded cells
3. Full User Instructions for Every Input/Style Option
Below are plain-language instructions for every user-adjustable option in the indicator’s input and style pages:
Inputs
Table Location
What it does: Sets where the summary table appears on your chart.
How to use: Choose from 9 positions (Top Left, Top Center, Top Right, etc.) to avoid overlapping with other chart elements.
Decimal Places
What it does: Controls how many decimal places prices and values are displayed with.
How to use: Increase for assets with very small prices (e.g., SHIB), decrease for stocks or forex.
Show Sentiment Lookback?
What it does: Shows or hides the “Lookback” column in the table, which displays how many bars are used in the sentiment calculation.
How to use: Turn off if you want a simpler table.
AI View Mode
What it does: Selects the logic for how the AI combines signals from different indicators.
Majority: Follows the most common signal among all indicators.
Weighted: Uses custom weights for each type of signal.
Custom: Lets you define your own logic (see below).
How to use: Pick the logic style that matches your trading philosophy.
AI Consensus Weight / Vol Delta Weight / Sentiment Weight
What they do: When using “Weighted” AI View Mode, these let you set how much influence each factor (indicator consensus, volume delta, sentiment) has on the final signal.
How to use: Increase a weight to make that factor more important in the AI’s decision.
Custom AI View Logic
What it does: Lets advanced users write their own logic for when the AI should signal a trade (e.g., “ai==1 and delta>0 and sentiment>0”).
How to use: Only use if you understand basic boolean logic.
Use Custom Stop Loss/Take Profit Prices?
What it does: If enabled, you can enter your own fixed stop loss and take profit prices for buys and sells.
How to use: Turn on to override the auto-calculated SL/TP and enter your desired prices below.
Custom Buy/Sell Stop Loss/Take Profit Price
What they do: If custom SL/TP is enabled, these fields let you set exact prices for stop loss and take profit on both buy and sell trades.
How to use: Enter your preferred price, or leave at 0 for auto-calculation.
Sentiment Lookback
What it does: Sets how many bars the sentiment calculation should look back.
How to use: Increase to smooth out sentiment, decrease for faster reaction.
Max Pyramid Adds
What it does: Limits how many times you can add to an existing position (pyramiding).
How to use: Set to 1 for no adds, higher for more aggressive scaling in trends.
Signal Preset
What it does: Quick-sets a group of signal parameters (see below) for “Robust”, “Standard”, “Freedom”, or “Custom”.
How to use: Pick a preset, or select “Custom” to adjust everything manually.
Min Bars for Signal Confirmation
What it does: Sets how many bars a signal must persist before it’s considered valid.
How to use: Increase for more robust, less frequent signals; decrease for faster, but possibly less reliable, signals.
ADX Length
What it does: Sets the period for the ADX (trend strength) calculation.
How to use: Longer = smoother, shorter = more sensitive.
ADX Trend Threshold
What it does: Sets the minimum ADX value to consider a trend “strong.”
How to use: Raise for stricter trend confirmation, lower for more trades.
ATR Length
What it does: Sets the period for the ATR (volatility) calculation.
How to use: Longer = smoother volatility, shorter = more reactive.
Volume Confirmation Lookback
What it does: Sets how many bars are used to calculate the average volume.
How to use: Longer = more stable volume baseline, shorter = more sensitive.
Volume Confirmation Multiplier
What it does: Sets how much current volume must exceed average volume to be considered “high.”
How to use: Increase for stricter volume filter.
RSI Flat Min / RSI Flat Max
What they do: Define the RSI range considered “flat” (i.e., not trending).
How to use: Widen to be stricter about requiring a trend, narrow for more trades.
Style Page
Most style settings (such as plot colors, label sizes, and shapes) are preset in the script for visual clarity.
You can adjust plot visibility and colors (for signals, stop loss, take profit) in the TradingView “Style” tab as with any indicator.
Buy Signal: Shows as a green triangle below the bar when a buy is triggered.
Sell Signal: Shows as a red triangle above the bar when a sell is triggered.
Stop Loss/Take Profit Lines: Red and green lines for SL/TP, visible when a trade is active.
SL/TP Labels: Small colored markers at the SL/TP levels for each trade.
How to use:
Toggle visibility or change colors in the Style tab if you wish to match your chart theme or preferences.
In Summary
This indicator is highly customizable—you can tune every aspect of the AI logic, risk management, signal filtering, and table display to suit your trading style.
The table gives you a real-time, comprehensive view of all relevant signals, filters, and trade instructions.
All inputs are designed to be intuitive—hover over them in TradingView for tooltips, or refer to the explanations above for details.

TrendShift [MOT]📈 TrendShift – Multi-Factor Momentum & Trend Signal Suite
TrendShift is a precision-built momentum and confluence tool designed to highlight directional shifts in price action. It combines EMA slope structure, oscillator confirmation, volume behavior, and dynamic SL/TP logic into one cohesive system. Whether you're trading with the trend or catching reversals, TrendShift provides data-backed clarity and visual confidence — and it’s available free to the public.
🔍 Core Signal Logic
Buy (🟢 Long) and Sell (🔴 Short) signals are triggered when multiple conditions align within a set bar window (default: 5 bars):
Stochastic RSI K/D cross
RSI crosses above 20 (long) or below 80 (short)
Stochastic RSI breaks 20 (long) or 80 (short)
Volume exceeds 20-bar average
🧭 Visual Trend Dashboard – Signal Table
A real-time on-chart dashboard displays:
EMA Trend: Bullish / Bearish / Mixed (based on 4 EMA slopes)
Stoch RSI: Oversold / Overbought / Neutral
RSI: Exact value with zone label
Volume: Above or Below average
Dashboard theme and position are fully customizable.
📐 Trend Structure with EMA Slope Logic
Plots four EMAs (21, 50, 100, 200) color-coded by slope:
Green = Rising
Red = Falling
These feed into the dashboard's EMA Trend display.
🎯 Optional Take Profit / Stop Loss Zones
When enabled, SL/TP lines plot automatically on valid signals:
Fixed-distance targets (e.g., 10pt TP, 5pt SL)
Auto-remove on TP or SL hit
Separate lines for long vs. short trades
Fully customizable styling
🔁 Trailing Stop Filter (Internal Logic)
A custom ATR-based trailing stop helps validate directional strength:
ATR period
HHV window
ATR multiplier
Used internally — not plotted — to confirm trend progression before entry.
⚙️ Customizable Parameters
Every core component is user-configurable:
EMA periods: 21 / 50 / 100 / 200
ATR trailing logic: period, HHV, multiplier
Oscillator settings: Stoch RSI & RSI
Volume length
SL/TP toggles and point values
Bar clustering window
Dashboard theme and location
🔔 Alerts Included
BUY Signal Triggered
SELL Signal Triggered
Compatible with webhook automation or mobile push notifications.
⚠️ Disclaimer
This tool is for educational purposes only and is not financial advice. Trading involves risk — always do your own research and consult a licensed professional before making trading decisions.

Profitable Loser Model [MMT]Profitable Loser Model
Overview
The Profitable Loser Model is a powerful PineScript v6 indicator designed to enhance your trading by visualizing key price levels, session open zones, Fibonacci retracements, and premium/discount zones. This overlay indicator provides traders with a customizable toolkit to analyze market structure across any timeframe, making it ideal for intraday and swing trading strategies.
Features
Open Zone Visualization
- Plots a box based on the open and close of the first candle in a user-defined timeframe (default: 5-minute).
- Customizable box color, projection offset, and label size (Tiny, Small, Normal, Large).
- Displays a timeframe label (e.g., "5m Open Zone") for quick reference, toggleable on/off.
Session Open Lines
- Optionally draws horizontal lines at key session opens (8:30 AM, 9:30 AM, 1:30 PM, Midnight, New York time).
- Customize line color, style (Solid, Dashed, Dotted), width, and label size for each session.
- Perfect for identifying critical intraday price levels.
Premium and Discount Zones
- Highlights premium (above midpoint) and discount (below midpoint) zones based on session high/low.
- Toggleable with customizable colors and projection offsets.
- Helps traders spot overbought/oversold areas for potential mean-reversion trades.
Fibonacci Retracement Levels
- Plots user-defined Fibonacci levels (default: 0.23, 0.35, 0.5, 0.62, 0.705, 0.79, 0.886, 1, 1.1).
- Customizable line style, width, color, and labels (showing percentage and/or price).
- Dynamically adjusts based on price movement relative to the open zone.
Take Profit (TP) and Stop Loss (SL) Levels
- Highlights TP (default: 0.23) and SL (default: 1.1) Fibonacci levels with distinct colors.
- Fully customizable to align with your risk-reward strategy.
How It Works
- Session Detection : Resets daily (or per user-defined timeframe) to capture the first candle's open, high, low, and close.
- Open Zone : Draws a box between the open and close, extended forward by the projection offset.
- Session Lines : Plots lines at specified session opens with customizable styles and labels.
- Fibonacci Retracement : Adjusts levels dynamically based on session high/low and price action.
- Premium/Discount Zones : Calculated from the session range midpoint, updated in real-time.
Settings
- Open Zone :
- Timeframe (default: 5m), Calculate Timeframe (default: Daily).
- Toggle label, adjust size, box color, and projection offset.
- Session Open Lines :
- Enable/disable lines for 8:30 AM, 9:30 AM, 1:30 PM, Midnight.
- Customize color, style, width, label size, and vertical offset.
- Premium/Discount Zones :
- Toggle visibility, set colors, and adjust projection offset.
- Fibonacci Retracement :
- Toggle visibility, set custom levels, line style, width, color, and label options.
- Adjust projection offset.
- TP/SL :
- Set TP/SL Fibonacci levels and colors.
Use Cases
- Intraday Trading : Use session open lines and open zones to trade key market hours.
- Swing Trading : Leverage Fibonacci levels for potential reversal or continuation zones.
- Risk Management : Set precise TP/SL levels based on Fibonacci retracements.
- Market Structure : Identify overbought/oversold zones with premium/discount areas.
Notes
- Optimized with `dynamic_requests = true` for efficient real-time data handling.
- Visual elements (boxes, lines, labels) are cleaned up at the start of each new session.
- Session lines use New York time (`America/New_York`) for alignment with major markets.

Future is hereOverview
"Future is Here" is an original, multi-faceted Pine Script indicator designed to provide traders with a comprehensive toolset for identifying high-probability trading opportunities. By integrating volatility-based entry zones, trend-based price targets, momentum confirmation, dynamic support/resistance levels, and risk-reward ratio (RRR) calculations, this indicator offers a cohesive and actionable trading framework. Each feature is carefully designed to complement the others, ensuring a synergistic approach that enhances decision-making across various market conditions. This script is unique in its ability to combine these elements into a single, streamlined interface with clear visual cues and customizable alerts, making it suitable for both novice and experienced traders.
Key Features and How They Work Together
Volatility-Based Entry Zones
Purpose: Identifies overbought and oversold conditions using a volatility-adjusted moving average, helping traders spot potential reversal zones.
Mechanism: Utilizes a user-defined volatility length and multiplier to calculate dynamic overbought/oversold thresholds based on the standard deviation of price. Crossovers and crossunders of these levels trigger "Buy Zone" or "Sell Zone" labels.
Synergy: These zones act as the foundation for entry signals, which are later confirmed by momentum and trend filters to reduce false signals.
Trend-Based Price Targets
Purpose: Projects potential price targets based on the prevailing trend, giving traders clear objectives for profit-taking.
Mechanism: Combines a fast and slow moving average to determine trend direction, then calculates target prices using a multiplier of the price deviation from the slow MA. Labels display bullish or bearish targets when the fast MA crosses the slow MA.
Synergy: Works in tandem with entry zones and momentum signals to align targets with market conditions, ensuring traders aim for realistic price levels supported by trend strength.
Momentum Confirmation
Purpose: Validates entry signals by assessing momentum strength, filtering out weak setups.
Mechanism: Uses the momentum indicator to detect bullish or bearish momentum crossovers, labeling them as "Strong" or "Weak" based on a comparison with a smoothed momentum average.
Synergy: Enhances the reliability of buy/sell signals by ensuring momentum aligns with volatility zones and trend direction, reducing the risk of premature entries.
Dynamic Support/Resistance Levels
Purpose: Highlights key price levels where the market is likely to react, aiding in trade planning and risk management.
Mechanism: Detects pivot highs and lows over a user-defined lookback period, drawing horizontal lines for the most recent support and resistance levels (limited to two each for clarity). Labels mark these levels with price values.
Synergy: Complements entry zones and price targets by providing context for potential reversal or continuation points, helping traders set logical stop-losses or take-profits.
Buy/Sell Signals with Risk-Reward Ratios
Purpose: Generates precise buy/sell signals with integrated take-profit (TP), stop-loss (SL), and RRR calculations for disciplined trading.
Mechanism: Combines volatility zone crossovers, trend confirmation, and positive momentum to trigger signals. ATR-based TP and SL levels are calculated, and the RRR is displayed in labels for quick assessment.
Synergy: This feature ties together all previous components, ensuring signals are only generated when volatility, trend, and momentum align, while providing clear risk-reward metrics for trade evaluation.
Customizable Alerts
Purpose: Enables traders to stay informed of trading opportunities without constant chart monitoring.
Mechanism: Alert conditions are set for buy and sell signals, delivering notifications with the entry price for seamless integration into trading workflows.
Synergy: Enhances usability by allowing traders to act on high-probability setups identified by the indicator’s combined logic.
Originality
"Future is Here" is an original creation that distinguishes itself through its holistic approach to technical analysis. Unlike single-purpose indicators, it integrates volatility, trend, momentum, and support/resistance into a unified system, reducing the need for multiple scripts. The inclusion of RRR calculations directly in signal labels is a unique feature that empowers traders to evaluate trade quality instantly. The script’s design emphasizes clarity and efficiency, with cooldowns to prevent label clutter and a limit on support/resistance lines to maintain chart readability. This combination of features, along with its customizable parameters, makes it a versatile and novel tool for traders seeking a robust, all-in-one solution.
How to Use
Setup: Add the indicator to your TradingView chart and adjust input parameters (e.g., Volatility Length, Trend Length, TP/SL Multipliers) to suit your trading style and timeframe.
Interpretation:
Look for "Buy Zone" or "Sell Zone" labels to identify potential entry points.
Confirm entries with "Bull Mom" or "Bear Mom" labels and trend direction (Bull/Bear Target labels).
Use Support/Resistance lines to set logical TP/SL levels or anticipate reversals.
Evaluate Buy/Sell signals with TP, SL, and RRR for high-probability trades.
Alerts: Set up alerts for Buy/Sell signals to receive real-time notifications.
Customization: Fine-tune multipliers and lengths to adapt the indicator to different markets (e.g., stocks, forex, crypto) or timeframes.

LANZ Strategy 1.0🔷 LANZ Strategy 1.0 — Session-Based Directional Logic with Visual Multi-Account Risk Management
LANZ Strategy 1.0 is a structured and disciplined trading strategy designed for the 1-hour timeframe, operating during the NY session and executing trades overnight. It uses the directional behavior between 08:00 and 18:00 New York time to define precise limit entries for the following night. Ideal for traders who prefer time-based execution, clear visuals, and professional risk management across multiple accounts.
🧠 Core Components:
1. Session Direction Confirmation:
At 18:00 NY, the system evaluates the market direction by comparing the open at 08:00 vs the close at 18:00:
If the direction matches the previous day, it is reversed.
If it differs, the current day’s direction is kept.
This logic is designed to avoid trend exhaustion and favor potential reversal opportunities.
2. EP Level & Risk Definition:
Once direction is defined:
For BUY, EP is set at the Low of the session.
For SELL, EP is set at the High of the session.
The system automatically plots:
SL fixed at 18 pips from EP
TP at 3.00× the risk → 54 pips from EP
All levels (EP, SL, TP) are shown with visual lines and price labels.
3. Time-Restricted Entry Execution:
The entry is only valid if price touches the EP between 19:00 and 08:00 NY.
If EP is not touched before 08:00 NY, the trade is automatically cancelled.
4. Multi-Account Lot Sizing:
Traders can configure up to five different accounts, each with its own capital and risk percentage.
The system calculates and displays the lot size per account, based on SL distance and pip value, in a dynamic floating label.
5. Outcome Tracking:
If TP is hit, a +3.00% profit label is displayed along with a congratulatory alert.
If SL is hit, a -1.00% label appears with a loss alert.
If the trade is still open by 09:00 NY, it is manually closed, and the result is shown as a percentage of the initial risk.
📊 Visual Features:
Custom-colored angle and guide lines.
Dynamic angle line starts at 08:00 NY and tracks price until 18:00.
Shaded backgrounds for key time zones (e.g., 08:00, 18:00, 19:00).
BUY/SELL signals shown at 19:00 based on match/divergence logic.
Label panel showing risk metrics and lot size for each active account.
⚙️ How It Works:
08:00 NY: Marks the session open and initiates a dynamic angle line.
18:00 NY: Evaluates the session direction and calculates EP/SL/TP based on outcome.
19:00 NY: Activates limit order monitoring.
During the night (until 08:00 NY): If EP is touched, the trade is triggered.
At 08:00 NY: If no touch occurred, trade is cancelled.
Overnight: TP/SL logic is enforced, showing percentage outcomes.
At 09:00 NY: If still open, trade is closed manually and result is labeled visually.
🔔 Alerts:
🚀 EP execution alert when touched
💢 Stop Loss hit alert
⚡ Take Profit hit alert
✅ Manual close at 09:00 NY with performance result
🔔 Daily reminder at 19:00 NY to configure and prepare the trade
📝 Notes:
Strategy is exclusive to the 1-hour timeframe.
Works best on assets with clean NY session movement.
Perfect for structured, semi-automated swing/overnight trading styles.
Fully visual, self-explanatory, and backtest-friendly.
👨💻 Credits:
Developed by LANZ
A strategy created with precision, discipline, and a vision for traders who value time-based entries, clean execution logic, and visual confidence on the chart.
Special thanks to Kairos — your AI assistant — for the detailed structure, scripting, and documentation of the strategy.
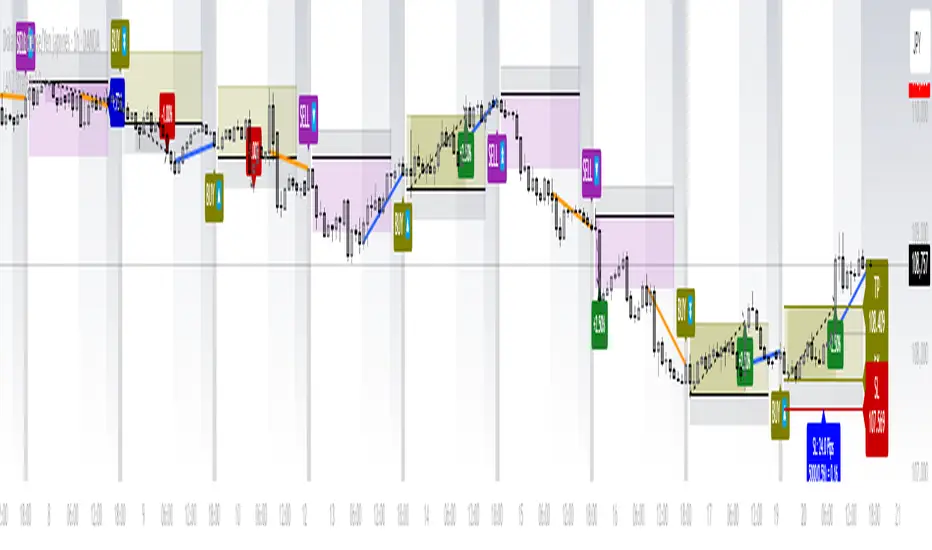
[Mustang Algo] Channel Strategy# Mustang Algo Channel Strategy - Universal Market Sentiment Oscillator
## 🎯 ORIGINAL CONCEPT
This strategy employs a unique market sentiment oscillator that works on ALL financial assets. It uses Bitcoin supply dynamics combined with stablecoin market capitalization as a macro sentiment indicator to generate universal timing signals across stocks, forex, commodities, indices, and cryptocurrencies.
## 🌐 UNIVERSAL APPLICATION
- **Any Asset Class:** Stocks, Forex, Commodities, Indices, Crypto, Bonds
- **Market-Wide Timing:** BTC/Stablecoin ratio serves as a global risk sentiment gauge
- **Cross-Market Signals:** Trade any instrument using macro liquidity conditions
- **Ecosystem Approach:** One oscillator for all financial markets
## 🧮 METHODOLOGY
**Core Calculation:** BTC Supply / (Combined Stablecoin Market Cap / BTC Price)
- **Data Sources:** DAI + USDT + USDC market capitalizations
- **Signal Generation:** RSI(14) applied to the ratio, double-smoothed with WMA
- **Timing Logic:** Crossover signals filtered by overbought/oversold zones
- **Multi-Timeframe:** Configurable timeframe analysis (default: Daily)
## 📈 TRADING STRATEGY
**LONG Entries:** Bullish crossover when market sentiment is oversold (<48)
**SHORT Entries:** Bearish crossover when market sentiment is overbought (>55)
**Universal Timing:** These macro signals apply to trading any financial instrument
## ⚙️ FLEXIBLE RISK MANAGEMENT
**Three SL/TP Calculation Modes:**
- **Percentage Mode:** Traditional % based (4% SL, 12% TP default)
- **Ticks Mode:** Precise tick-based calculation (50/150 ticks default)
- **Pips Mode:** Forex-style pip calculation (50/150 pips default)
**Realistic Parameters:**
- Commission: 0.1% (adjustable for different asset classes)
- Slippage: 2 ticks
- Position sizing: 10% of equity (conservative)
- No pyramiding (single position management)
## 📊 KEY ADVANTAGES
✅ **Universal Application:** One strategy for all asset classes
✅ **Macro Foundation:** Based on global liquidity and risk sentiment
✅ **False Signal Filtering:** Overbought/oversold zones reduce noise
✅ **Flexible Risk Management:** Multiple SL/TP calculation methods
✅ **No Lookahead Bias:** Clean backtesting with realistic results
✅ **Cross-Market Correlation:** Captures broad market risk cycles
## 🎛️ CONFIGURATION GUIDE
1. **Asset Selection:** Apply to stocks, forex, commodities, indices, crypto
2. **Timeframe Setup:** Daily recommended for swing trading
3. **Sentiment Bounds:** Adjust 48/55 levels based on market volatility
4. **Risk Management:** Choose appropriate SL/TP mode for your asset class
5. **Direction Filter:** Select Long Only, Short Only, or Both
## 📋 BACKTESTING STANDARDS
**Compliant with TradingView Guidelines:**
- ✅ Realistic commission structure (0.1% default)
- ✅ Appropriate slippage modeling (2 ticks)
- ✅ Conservative position sizing (10% equity)
- ✅ Sustainable risk ratios (1:3 SL/TP)
- ✅ No lookahead bias (proper historical simulation)
- ✅ Sufficient sample size potential (100+ trades possible)
## 🔬 ORIGINAL RESEARCH
This strategy introduces a revolutionary approach to financial markets by treating the BTC/Stablecoin ratio as a global risk sentiment gauge. Unlike traditional indicators that analyze individual asset price action, this oscillator captures macro liquidity flows that affect ALL financial markets - from stocks to forex to commodities.
## 🎯 MARKET APPLICATIONS
**Stocks & Indices:** Risk-on/risk-off sentiment timing
**Forex:** Global liquidity flow analysis for major pairs
**Commodities:** Risk appetite for inflation hedges
**Bonds:** Flight-to-safety vs. risk-seeking behavior
**Crypto:** Native application with direct correlation
## ⚠️ RISK DISCLOSURE
- Designed for intermediate to long-term trading across all timeframes
- Market sentiment can remain extreme longer than expected
- Always use appropriate position sizing for your specific asset class
- Adjust commission and slippage settings for different markets
- Past performance does not guarantee future results
## 🚀 INNOVATION SUMMARY
**What makes this strategy unique:**
- First to use BTC/Stablecoin ratio as universal market sentiment indicator
- Applies macro-economic principles to technical analysis across all assets
- Single oscillator provides timing signals for entire financial ecosystem
- Bridges traditional finance with digital asset insights
- Combines fundamental liquidity analysis with technical precision

LANZ Strategy 2.0 [Backtest]🔷 LANZ Strategy 2.0 — Structural Breakout Logic with Dynamic Swing Protection
LANZ Strategy 2.0 is a precision-focused backtesting system built for intraday traders who rely on structural confirmations before the London session to guide directional bias. This tool uses smart swing detection, risk-defined position sizing, and strict time-based execution to simulate real trading conditions with clarity and control.
🧠 Core Components:
Structural Confirmation (Trend & BoS): Detects trend direction and break of structure (BoS) using a three-swing logic, aligning trade entries with valid structural movement.
Time-Based Execution: Trades are triggered exclusively at 02:00 a.m. New York time, ensuring disciplined and repeatable intraday testing.
Swing-Based SL Models: Traders can select between three stop-loss protection types:
First Swing: Most recent structural level
Second Swing: Prior level
Full Coverage: All recent swing levels + configurable pip buffer
Dynamic TP Calculation: Take-Profit is projected as a risk-based multiple (RR), fully adjustable via input.
Capital-Based Risk Management: Risk is defined as a percentage of a fixed account size (e.g., $100 per trade from $10,000), and lot size is automatically calculated based on SL distance.
Fallback Entry Logic: If structural breakout is present but trend is not confirmed, a secondary entry is triggered.
End-of-Session Management: Any open trades are automatically closed at 11:45 a.m. NY time, with optional manual labeling or review.
📊 Visual Features (Optional in Indicator Version):
(Note: Visuals apply to the indicator version of LANZ 2.0, not this backtest script)
Swing level labels (1st, 2nd) and dynamic SL/TP lines.
Real-time session coloring for clarity: Pre-London, Entry Window, and NY Close.
Outcome labels: +RR, -RR, or net % at close.
Auto-cleanup of previous drawings for a clean chart per session.
⚙️ How It Works:
Detects last trend and BoS using swing logic before 02:00 a.m. NY.
At 02:00 a.m., evaluates directional bias and executes BUY or SELL if confirmed.
Applies selected SL logic (1st, 2nd, or full swing protection).
Sets TP based on the RR multiplier.
Closes the trade either on SL, TP, or at 11:45 a.m. NY manually.
🔔 Alerts:
Time-of-day alert at 02:00 a.m. NY to monitor execution.
Can be extended to cover SL/TP triggers or new BoS events.
📝 Notes:
Designed for backtesting precision and discretionary decision-making.
Ideal for Forex pairs, indices, or assets active during the London session.
Fully customizable: session timing, swing logic, SL buffer, and RR.
👤 Credits:
Strategy built by @rau_u_lanz using Pine Script v6, combining structural logic, capital-based risk control, and London-session timing in a backtest-ready framework for traders who demand accuracy and structure.

Apex Edge - Session Sweep ProApex Edge Session Sweep Pro
By Apex Edge | 2025 Edition
🔍 What is it?
The Apex Session Sweep Pro is a precision trading tool designed for identifying high-probability liquidity sweep entries during key global market sessions. It combines powerful sweep detection logic with dynamic candle colouring, session visualization, TP projections, and real-time alerts — all within a clean, performance-optimized Pine Script engine.
This is not your average session box indicator. This is Apex-grade.
⚙️ How it Works
The indicator detects session liquidity sweeps by tracking price action relative to previous session highs and lows. When a session high/low is swept (i.e., price breaches it and then closes in the opposite direction), it generates a signal:
Buy Signal → Price sweeps previous low and closes back above it
Sell Signal → Price sweeps previous high and closes back below it
Each session is boxed on the chart (Tokyo, London, New York, Sydney), color-coded, and dynamically labelled.
Upon detecting a valid sweep, the script:
Plots a small entry label (toggleable)
Projects up to 5 customizable TP levels
Coloured candles for visual trade direction
Alerts for Buy or Sell sweep signals (optional)
All elements are memory-managed and customizable to suit your trading style.
🧠 Key Features
✅ Smart Sweep Detection Logic
✅ Global Market Session Boxes (Custom Times)
✅ Toggleable Entry Labels + TP Levels
✅ Candle Colouring by Signal
✅ Manual TP input + TP toggles
✅ Real-time Alerts for Apex entries
🕒 Why Are My Sessions Offset?
Your chart’s time zone may be different from UTC. This script is UTC-based by design, so if your chart is set to UTC+1, for example, the sessions will appear one hour later. Either:
Adjust your chart to UTC or or Exchange for perfect alignment,
Or tweak the session input times manually.
🧰 Who is this for?
This tool is made for:
Intraday traders looking for sweeps into liquidity
SMC (Smart Money Concept) strategists
Forex, crypto, and indices traders
Anyone who uses session-based levels to define entries
Whether you scalp London or ride NY swings, this tool frames each session cleanly — and shows you where the traps are laid.
🚨 Disclaimer
This indicator is a technical tool, not financial advice. Use proper risk management. Past performance ≠ future results.
