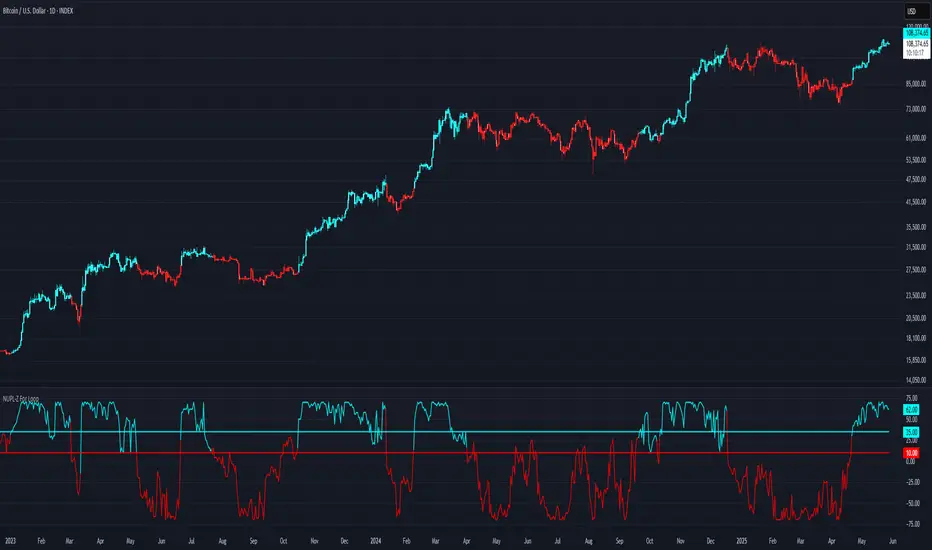
NUPL-Z For Loop🧠 Overview
NUPL-Z For Loop is a trend-following indicator built on Bitcoin’s on-chain Net Unrealized Profit/Loss (NUPL) metric. It uses a Z-scored transformation of NUPL and a custom loop-based scoring system to measure the consistency of directional movement. Rather than identifying tops and bottoms, this tool is designed to track sustained trends and filter out short-term noise, making it ideal for momentum-aligned strategies.
🧩 Key Features
Loop-Based Trend Logic: Assesses trend strength by summing the number of upward vs. downward moves in Z-scored NUPL across a custom lookback.
Z-Score Normalization: Applies long-term statistical normalization to NUPL to emphasize deviation from average behavior over time.
Threshold-Based Regime Shifts: Custom input thresholds define when trend strength is significant enough to trigger long or short signals.
Directional Market State Tracking: Internally tracks bullish, bearish, or neutral conditions to guide trend entries.
BTC-Focused On-Chain Analysis: Tailored specifically for Bitcoin using Market Cap and Realized Cap inputs.
🔍 How It Works
NUPL Calculation: Derived as the percentage of net unrealized profit relative to market cap: (MC - RMC) / MC * 100.
Z-Scoring: NUPL is normalized using a rolling mean and standard deviation over a long window (default 1300 days) to create a smoothed trend signal.
Directional Loop: A custom loop iterates from the start_loop to the end_loop, comparing the current Z-score to past values.
Each instance where NUPL_Z > NUPL_Z adds +1 to the score; otherwise, it subtracts -1.
This cumulative score reflects how consistently NUPL-Z has been trending.
Signal Logic:
Long signal when loop score exceeds long_threshold.
Short signal when score falls below short_threshold.
CD State Engine: Maintains the current trend regime (1 for long, -1 for short), which drives plot coloring and overlays.
🔁 Use Cases & Applications
Momentum Trend Filter: Detects and confirms sustained directional strength in BTC’s profit/loss positioning.
Noise Suppression: Avoids reactive signals from one-off spikes or dips in NUPL by requiring a consistent trend before confirming bias.
Best Suited for BTC: Designed specifically for Bitcoin’s price and on-chain structure, using its unique NUPL dynamics.
✅ Conclusion
NUPL-Z For Loop transforms a traditionally mean-reverting indicator into a trend-following signal engine. By scoring the consistency of movement in normalized NUPL, this tool identifies trend strength rather than reversal potential — providing more reliable context for momentum-aligned trades on Bitcoin.
⚠️ Disclaimer
The content provided by this indicator is for educational and informational purposes only. Nothing herein constitutes financial or investment advice. Trading and investing involve risk, including the potential loss of capital. Always backtest and apply risk management suited to your strategy.
在腳本中搜尋"track"
Multiple AVWAP [OmegaTools]The Multiple AVWAP indicator is a sophisticated trading tool designed for professional traders who require precision in volume-weighted price tracking. This indicator allows for the deployment of multiple Anchored Volume Weighted Average Price (AVWAP) calculations simultaneously, offering deep insights into price movements, dynamic support and resistance levels, and trend structures across multiple timeframes.
This indicator caters to both institutional and retail traders by integrating flexible anchoring methods, multi-timeframe adaptability, and enhanced visualization features. It also includes deviation bands for statistical analysis, making it a comprehensive volume-based trading solution.
Key Features & Functionalities
1. Multiple AVWAP Configurations
Users can configure up to four distinct AVWAP calculations to track different market conditions.
Supports various anchoring methods:
Fixed: A traditional AVWAP that starts from a defined historical point.
Perpetual: A rolling VWAP that continuously adjusts over time.
Extension: An extension-based AVWAP that projects from past calculations.
High Volume: Anchors AVWAP to the highest volume bar within a specified period.
None: Option to disable AVWAP calculation if not required.
2. Advanced Deviation Bands
Implements standard deviation bands (1st and 2nd deviation) to provide a statistical measure of price dispersion from the AVWAP.
Serves as a dynamic method for identifying overbought and oversold conditions relative to VWAP pricing.
Deviation bands are customizable in terms of visibility, color, and transparency.
3. Multi-Timeframe Support
Users can assign different timeframes to each AVWAP calculation for macro and micro analysis.
Helps in identifying long-term institutional trading levels alongside short-term intraday trends.
4. Z-Score Normalization Mode
Option to standardize oscillator values based on AVWAP deviations.
Converts price movements into a statistical Z-score, allowing traders to measure price strength in a normalized range.
Helps in detecting extreme price dislocations and mean-reversion opportunities.
5. Customizable Visual & Aesthetic Settings
Fully customizable line colors, transparency, and thickness to enhance clarity.
Users can modify AVWAP and deviation band colors to distinguish between different levels.
Configurable display options to match personal trading preferences.
6. Oscillator Mode for Trend & Momentum Analysis
The indicator converts price deviations into an oscillator format, displaying AVWAP strength and weakness dynamically.
This provides traders with a momentum-based perspective on volume-weighted price movements.
User Guide & Implementation
1. Configuring AVWAPs for Optimal Use
Choose the mode for each AVWAP instance:
Fixed (set historical point)
Perpetual (rolling, continuously updated AVWAP)
Extension (projection from past AVWAP levels)
High Volume (anchored to highest volume bar)
None (disables the AVWAP line)
Adjust the length settings to fine-tune calculation sensitivity.
2. Utilizing Deviation Bands for Market Context
Activate deviation bands to see statistical boundaries of price action.
Monitor +1 / -1 and +2 / -2 standard deviation levels for extended price movements.
Consider price action outside of deviation bands as potential mean-reversion signals.
3. Multi-Timeframe Analysis for Institutional-Level Insights
Assign different timeframes to each AVWAP to compare:
Daily VWAP (institutional trading levels)
Weekly VWAP (swing trading trends)
Intraday VWAPs (short-term momentum shifts)
Helps identify where institutional liquidity is positioned relative to price.
4. Activating the Oscillator for Momentum & Bias Confirmation
The oscillator converts AVWAP deviations into a normalized value.
Use overbought/oversold levels to determine strength and potential reversals.
Combine with other indicators (RSI, MACD) for confluence-based trading decisions.
Trading Applications & Strategies
5. Trend Confirmation & Institutional VWAP Tracking
If price consistently holds above the primary AVWAP, it signals a bullish trend.
If price remains below AVWAP, it indicates selling pressure and a bearish trend.
Monitor retests of AVWAP levels for potential trend continuation or reversal.
6. Dynamic Support & Resistance Levels
AVWAP lines act as dynamic floating support and resistance zones.
Price bouncing off AVWAP suggests continuation, whereas breakdowns indicate a shift in momentum.
Look for confluence with high-volume zones for stronger trade signals.
7. Mean Reversion & Statistical Edge Trading
Prices that deviate beyond +2 or -2 standard deviations often revert toward AVWAP.
Mean reversion traders can fade extended moves and target AVWAP re-tests.
Helps in identifying exhaustion points in trending markets.
8. Institutional Liquidity & Volume Footprints
Institutions often execute large trades near VWAP zones, causing price reactions.
Tracking multi-timeframe AVWAP levels allows traders to anticipate key liquidity areas.
Use higher timeframe AVWAPs as macro support/resistance for swing trading setups.
9. Enhancing Momentum Trading with AVWAP Oscillator
The oscillator provides a momentum-based measure of AVWAP deviations.
Helps in confirming entry and exit timing for trend-following trades.
Useful for pairing with stochastic oscillators, MACD, or RSI to validate trade decisions.
Best Practices & Trading Tips
Use in Conjunction with Volume Analysis: Combine with volume profiles, OBV, or CVD for increased accuracy.
Adjust Timeframes Based on Trading Style: Scalpers can focus on short-term AVWAP, while swing traders benefit from weekly/daily AVWAP tracking.
Backtest Different AVWAP Configurations: Experiment with different anchoring methods and lookback periods to optimize trade performance.
Monitor Institutional Order Flow: Identify key VWAP zones where institutional traders may be active.
Use with Other Technical Indicators: Enhance trading confidence by integrating with moving averages, Bollinger Bands, or Fibonacci retracements.
Final Thoughts & Disclaimer
The Multiple AVWAP indicator provides a comprehensive approach to volume-weighted price tracking, making it ideal for professional traders. While this tool enhances market clarity and trade decision-making, it should be used as part of a well-rounded trading strategy with risk management principles in place.
This indicator is provided for informational and educational purposes only. Trading involves risk, and past performance is not indicative of future results. Always conduct your own analysis and due diligence before executing trades.
OmegaTools - Enhancing Market Clarity with Precision Indicators

Triad Trade MatrixOverview
Triad Trade Matrix is an advanced multi-strategy indicator built using Pine Script v5. It is designed to simultaneously track and display key trading metrics for three distinct trading styles on a single chart:
Swing Trading (Swing Supreme):
This mode captures longer-term trends and is designed for trades that typically span several days. It uses customizable depth and deviation parameters to determine swing signals.
Day Trading (Day Blaze):
This mode focuses on intraday price movements. It generates signals that are intended to be executed within a single trading session. The parameters for depth and deviation are tuned to capture more frequent, shorter-term moves.
Scalping (Scalp Surge):
This mode is designed for very short-term trades where quick entries and exits are key. It uses more sensitive parameters to detect rapid price movements suitable for scalping strategies.
Each trading style is represented by its own merged table that displays real-time metrics. The tables update automatically as new trading signals are generated.
Key Features
Multi-Style Tracking:
Swing Supreme (Large): For swing trading; uses a purple theme.
Day Blaze (Medium): For day trading; uses an orange theme.
Scalp Surge (Small): For scalping; uses a green theme.
Real-Time Metrics:
Each table displays key trade metrics including:
Entry Price: The price at which the trade was entered.
Exit Price: The price at which the previous trade was exited.
Position Size: Calculated as the account size divided by the entry price.
Direction: Indicates whether the trade is “Up” (long) or “Down” (short).
Time: The time when the trade was executed (formatted to hours and minutes).
Wins/Losses: The cumulative number of winning and losing trades.
Current Price & PnL: The current price on the chart and the profit/loss computed relative to the entry price.
Duration: The number of bars that the trade has been open.
History Column: A merged summary column that shows the most recent trade’s details (entry, exit, and result).
Customizability:
Column Visibility: Users can toggle individual columns (Ticker, Timeframe, Entry, Exit, etc.) on or off according to their preference.
Appearance Settings: You can customize the table border width, frame color, header background, and text colors.
History Toggle: The merged history column can be enabled or disabled.
Chart Markers: There is an option to show or hide chart markers (labels and lines) that indicate trade entries and exits on the chart.
Trade History Management:
The indicator maintains a rolling history (up to three recent trades per trading style) and displays the latest summary in the merged table.
This history column provides a quick reference to recent performance.
How It Works
Signal Generation & Trade Metrics
Trade Entry/Exit Calculation:
For each trading style, the indicator uses built-in functions (such as ta.lowestbars and ta.highestbars) to analyze price movements. Based on a customizable "depth" and "deviation" parameter, it determines the point of entry for a trade.
Swing Supreme: Uses larger depth/deviation values to capture swing trends.
Day Blaze: Uses intermediate values for intraday moves.
Scalp Surge: Uses tighter parameters to pick up rapid price changes.
Metrics Update:
When a new trade signal is generated (i.e., when the trade entry price is updated), the indicator calculates:
The current PnL as the difference between the current price and the entry price (or vice versa, depending on the trade direction).
The duration as the number of bars since the trade was opened.
The position size using the formula: accountSize / entryPrice.
History Recording:
Each time a new trade is triggered (i.e., when the entry price is updated), a summary string is created (showing entry, exit, and win/loss status) and appended to the corresponding trade history array. The merged table then displays the latest summary from this history.
Table Display
Merged Table Structure:
Each trading style (Swing Supreme, Day Blaze, and Scalp Surge) is represented by a table that has 15 columns. The columns are:
Trade Type (e.g., Swing Supreme)
Ticker
Timeframe
Entry Price
Exit Price
Position Size
Direction
Time of Entry
Account Size
Wins
Losses
Current Price
Current PnL
Duration (in bars)
History (the latest trade summary)
User Customization:
Through the settings panel, users can choose which columns to display.
If a column is toggled off, its cells will remain blank, allowing traders to focus on the metrics that matter most to them.
Appearance & Themes:
The table headers and cell backgrounds are customizable via color inputs. The trading style names are color-coded:
Swing Supreme (Large): Uses a purple theme.
Day Blaze (Medium): Uses an orange theme.
Scalp Surge (Small): Uses a green theme.
How to Use the Indicator
Add the Indicator to Your Chart:
Once published, add "Triad Trade Matrix" to your TradingView chart.
Configure the Settings:
Adjust the Account Size to match your trading capital.
Use the Depth and Deviation inputs for each trading style to fine-tune the signal sensitivity.
Toggle the Chart Markers on if you want visual entry/exit markers on the chart.
Customize which columns are visible via the column visibility toggles.
Enable or disable the History Column to show the merged trade history in the table.
Adjust the appearance settings (colors, border width, etc.) to suit your chart background and preferences.
Interpret the Tables:
Swing Supreme:
This table shows metrics for swing trades.
Look for changes in entry price, PnL, and trade duration to monitor longer-term moves.
Day Blaze:
This table tracks day trading activity.It will update more frequently, reflecting intraday trends.
Scalp Surge:
This table is dedicated to scalping signals.Use it to see quick entry/exit data and rapid profit/loss changes.
The History column (if enabled) gives you a snapshot of the most recent trade (e.g., "E:123.45 X:124.00 Up Win").
Use allerts:
The indicator includes alert condition for new trade entries(both long and short)for each trading style.
Summary:
Triad Trade Matrix provides an robust,multi-dimensional view of your trading performance across swing trading, day trading, and scalping.
Best to be used whith my other indicators
True low high
Vma Ext_Adv_CustomTbl
This indicator is ideal for traders who wish to monitor multiple trading styles simultaneously, with a clear, technical, and real-time display of performance metrics.
Happy Trading!

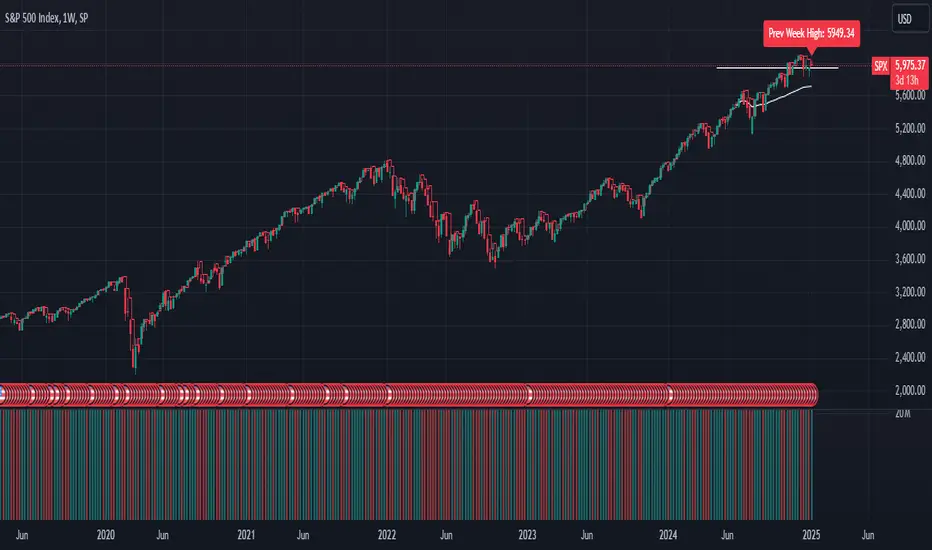
GL_Prev Week HighThe GL_Prev Week High Indicator is a powerful tool designed to enhance your trading analysis by displaying the previous week's high price directly on your chart. With clear and customizable visuals, this indicator helps traders quickly identify critical price levels, enabling more informed decision-making.
Key Features:
Previous Week's High Line:
Displays the previous week's high as a red line on your chart for easy reference.
Customizable Horizontal Line:
Includes a white horizontal line for enhanced clarity, with adjustable length, color, and width settings.
All-Time High Tracking:
Automatically tracks the all-time high from the chart's history and places a dynamic label above it.
Real-Time Updates:
The indicator updates in real-time to ensure accuracy as new bars are added.
User Inputs for Personalization:
Adjust the left and right span of the horizontal line.
Customize line width and color to suit your preferences.
Use Case:
This indicator is ideal for traders looking to integrate the previous week's high as a key support or resistance level in their trading strategy. Whether you are analyzing trends, identifying breakout zones, or planning entry/exit points, this tool provides valuable insights directly on the chart.
How to Use:
Add the indicator to your chart.
Customize the settings (line length, width, and color) through the input panel to match your preferences.
Use the red line to track the previous week's high and the label to monitor all-time highs effortlessly.
License:
This script is shared under the Mozilla Public License 2.0. Feel free to use and adapt the script as per the license terms.
Globex time (New York Time)This indicator is designed to highlight and analyze price movements within the Globex session. Primarily geared toward the Globex Trap trading strategy, this tool visually identifies the session's high and low prices, allowing traders to better assess price action during extended hours. Here’s a comprehensive breakdown of its features and functionality:
Purpose
The "Globex Time (New York Time)" indicator tracks price levels during the Globex trading session, providing a clear view of overnight market activity. This session, typically running from 6 p.m. ET (18:00) until the following morning at 8:30 a.m. ET, is a critical period where significant market positioning can occur before the regular session opens. In the Globex Trap strategy, the session high and low are essential levels, as price movements around these areas often indicate potential support, resistance, or reversal zones, which traders use to set up entries or exits when the regular trading session begins.
Key Features
Customizable Session Start and End Times
The indicator allows users to specify the exact start and end times of the Globex session in New York time. The default settings are:
Start: 6 p.m. ET (18:00)
End: 8:30 a.m. ET
These settings can be adjusted to align with specific market hours or personal preferences.
Session High and Low Identification
Throughout the defined session, the indicator dynamically calculates and tracks:
Session High: The highest price reached within the session.
Session Low: The lowest price reached within the session.
These levels are essential for the Globex Trap strategy, as price action around them can indicate likely breakout or reversal points when regular trading resumes.
Vertical Lines for Session Start and End
The indicator draws vertical lines at both the session start and end times:
Session Start Line: A solid line marking the exact beginning of the Globex session.
Session End Line: A similar vertical line marking the session’s conclusion.
Both lines are customizable in terms of color and thickness, making it easy to distinguish the session boundaries visually on the chart.
Horizontal Lines for Session High and Low
At the end of the session, the indicator plots horizontal lines representing the Globex session's high and low levels. Users can customize these lines:
Color: Define specific colors for the session high (default: red) and session low (default: green) to easily differentiate them.
Line Style: Options to set the line style (solid, dashed, or dotted) provide flexibility for visual preferences and chart organization.
Automatic Reset for Daily Tracking
To adapt to the next trading day, the indicator resets the session high and low data once the current session ends. This reset prepares it to start tracking new levels at the beginning of the next session without manual intervention.
Practical Application in the Globex Trap Strategy
In the Globex Trap strategy, traders are primarily interested in price behavior around the high and low levels established during the overnight session. Common applications of this indicator for this strategy include:
Breakout Trades: Watching for price to break above the Globex high or below the Globex low, indicating potential momentum in the breakout direction.
Reversal Trades: Monitoring for failed breakouts or traps where price tests and rejects the Globex high or low, suggesting a reversal as liquidity is trapped in these zones.
Support and Resistance Zones: Using the session high and low as key support and resistance levels during the regular trading session, with potential entry or exit points when price approaches these areas.
Additional Configuration Options
Vertical Line Color and Width: Define the color and thickness of the vertical session start and end lines to match your chart’s theme.
Upper and Lower Line Colors and Styles: Customize the appearance of the session high and low horizontal lines by setting color and line style (solid, dashed, or dotted), making it easy to distinguish these critical levels from other chart markings.
Summary
This indicator is a valuable tool for traders implementing the Globex Trap strategy. It visually segments the Globex session and marks essential price levels, helping traders analyze market behavior overnight. Through its customizable options and clear visual representation, it simplifies tracking overnight price activity and identifying strategic levels for potential trade setups during the regular session.

Parent Session Sweeps + Alert Killzone Ranges with Parent Session Sweep
Key Features:
1. Multiple Session Support: The script tracks three major trading sessions - Asia, London, and New York. Users can customize the timing of these sessions.
2. Killzone Visualization: The strategy visually represents each session's range, either as filled boxes or lines, allowing traders to easily identify key price levels.
3. Parent Session Logic: The core of the strategy revolves around identifying a "parent" session - a session that encompasses the range of the following session. This parent session becomes the basis for potential trade setups.
4. Sweep and Reclaim Setups: The strategy looks for price movements that sweep (break above or below) the parent session's high or low, followed by a reclaim of that level. This price action often indicates a potential reversal.
5. Risk-Reward Filtering: Each potential setup is evaluated based on a user-defined minimum risk-reward ratio, ensuring that only high-quality trade opportunities are considered.
6. Candle Close Filter: An optional filter that checks the characteristics of the candle that reclaims the parent session level, adding an extra layer of confirmation to the setup.
7. Performance Tracking: The strategy keeps track of bullish and bearish setup success rates, providing valuable feedback on its performance over time.
8. Visual Aids: The script draws lines to mark the parent session's high and low, making it easy for traders to identify key levels.
How It Works:
1. The script continuously monitors price action across the defined sessions.
2. When a session fully contains the range of the next session, it's identified as a potential parent session.
3. The strategy then waits for price to sweep either the high or low of this parent session.
4. If a sweep occurs, it looks for a reclaim of the swept level within the parameters set by the user.
5. If a valid setup is identified, the script generates an alert and places a trade (if backtesting or running live).
6. The strategy continues to monitor the trade for either reaching the target (opposite level of the parent session) or hitting the stop loss.
Considerations for Signals:
- Sweep: A break of the parent session's high or low.
- Reclaim: A close back inside the parent session range after a sweep.
- Candle Characteristics: Optional filter for the reclaim candle (e.g., bullish candle for long setups).
- Risk-Reward: Each setup must meet or exceed the user-defined minimum risk-reward ratio.
- Session Timing: The strategy is sensitive to the defined session times, which should be set according to the trader's preferred time zone.
This strategy aims to capitalize on institutional order flow and liquidity patterns in the forex market, providing traders with a systematic approach to identifying potential reversal points with favorable risk-reward profiles.

CAGR - Candle based BackTesterThe "CAGR - Candle based BackTester" is a tool for traders and investors seeking precise insights into individual candle performance!
Do you want to backtest based on candles and understand their CAGR? Curious about the average CAGR of all candles? Interested in comparing how an individual candle performs against others? Then this tool is your go-to solution.
How It Works:
Candle Selection: Specify a start date, and watch as the script tracks investments from that point forward.
Dynamic Calculations: Experience real-time CAGR calculations that adapt as market conditions evolve.
CAGR Display: At the final candle, gain insights into individual CAGR, average CAGR of all candles, alpha (difference), and outperformance percentage—all conveniently displayed for informed decision-making.
Key Features:
Accurate Candle-based CAGR Calculation: Gain clarity on investment performance with precise CAGR metrics.
Lumpsum Investment Tracking: Track lumpsum investments seamlessly with detailed share and investment calculations.
Outperformance Metrics: Measure how your investment performs relative to others with dedicated outperformance metrics.
User-Friendly Visualization: Access intuitive charts and visuals that simplify complex financial data.

Body Close Continuity & failure Backtesting @MaxMaseratiThis indicator, is a highly advanced institutional-grade tool designed to track the "lifespan" of a trend based on Body Close (BC) sequences.
Unlike basic indicators that just show direction, this script analyzes the structural integrity of a trend by monitoring how many candles continue the move before a "Touch" (retest) or a "Break" (failure) occurs.
The Continuity & Failure Stats indicator tracks sequences of Bullish Body Closes (BuBC) and Bearish Body Closes (BeBC). It measures three critical phases: Building (pure momentum), Touching (price retesting the low/high of the sequence), and Resumption (price continuing the trend after a retest). It provides a statistical distribution of how long these "buildings" typically last before failing, allowing traders to know exactly when a trend is overextended.
This comprehensive analysis blends the statistical breakdown of the Continuity & Failure Stats indicator to provide a deep understanding of the structural momentum for the S&P 500 E-mini (ES1!) on a 4-hour timeframe.
1. Extensive Table Breakdown
A. Building Distribution (Left Table): The Fatigue Gauge
This table acts as a histogram of momentum, tracking the "Building Count"—the number of consecutive candles closing in a trend without price returning to its origin.
Count Column: Represents the streak length (e.g., 1, 2, or 3 candles).
Touch Column: Shows how many times a streak was interrupted by a retest ("touch") but remained structurally intact.
Break Column: Counts total structural failures where price closed beyond the sequence's anchor.
Data Insight: For BuBC, 92 sequences reached Count 1, but only 28 remained by Count 4. This reveals a steep momentum decay after the 3rd candle, establishing a "Statistical Wall" where only 2 sequences in history reached a count of 9.
B. MMM Summary Stats (Top Right): The Mathematical DNA
This table provides the "Expected Value" and behavior of a trend over the lookback period.
Avg Building (2.39 for BuBC): On average, a bullish move lasts ~2.4 candles of pure momentum before a retest or reversal occurs.
Avg Touches (0.8): This low number indicates "clean" trends that rarely wobble back to retest levels multiple times before reaching a conclusion.
Avg R Cycles (0.55): This suggests that once a bullish trend is interrupted, it only successfully resumes its momentum about half the time.
Max R Count (1): Typically, once a trend is "touched," it only manages one more push before failing.
C. Multi-Timeframe (MTF) Quick Stats (Bottom Right): Trend Weight
This compares the 4H chart against other layers of the market to identify "global" alignment.
Sample Comparison: There are 3,594 tracked BuBC sequences on the 4H compared to only 142 on the Weekly chart.
Fractal Law: The Avg Building (2.4) is consistent across several timeframes, implying that the "Rule of Three" (momentum fading after 3 candles) is a fractal characteristic of this asset.
2. Table Comparison: Synthesizing the Data
To trade effectively, you must compare Distribution (timing) against Summary Stats (averages):
Continuity vs. Failure: The Summary Stats show an average building of 2.39. When checking the Distribution table at Count 2, the "Break" count (58) is already high relative to the "Total". This confirms that the risk of failure increases exponentially the moment you exceed the average.
Momentum vs. Mean Reversion: Distribution tells you when a trend is "tired". If the 4H is at a "Building Count 4" (statistically overextended) while the Weekly chart is at "Building Count 1" (fresh momentum), you may choose to prioritize the higher timeframe's strength despite the local overextension.
3. Strategic Summary & Application
This indicator proves that market momentum follows a predictable "Building" cycle rather than an infinite streak.
The "Rule of Three" for ES1! 4H:
The Entry Zone (Momentum Start): The most profitable entries occur at Building Count 1. Statistically, you have a high probability of reaching a count of 2 or 3.
The Exit Zone (Momentum Limit): Take profits or tighten stops at Count 3. The data shows the sample size drops by nearly 50% between Count 3 and Count 4.
The "Touch" Rule (Retest Reliability): If price returns to the sequence low (a "Touch"), do not expect a massive continuation. The Max R Count of 1 tells us that resumptions are usually short-lived.
Danger Zone: Entering at Building Count 4 or higher is statistically dangerous, as the "Break" probability significantly outweighs the "Touch" or continuation probability.

Flux Portfolio Visualizer | GL0WDASHFlux Portfolio Visualizer | GL0WDASH
Flux Portfolio Visualizer lets you simulate and track the performance of a multi-asset portfolio directly on the chart.
Choose up to 10 assets, assign custom allocation weights, and set a start date to generate a real-time equity curve based on historical price data.
The script performs one-time proportional allocation at the start date and then tracks equity forward without rebalancing, giving you a realistic view of how your portfolio would have evolved over time. It also includes a maximum equity drawdown tracker and an optional level line for reference.
Features:
• Allocate to up to 10 assets with custom weight percentages
• Specify initial capital and simulation start date
• Real-time equity curve based on confirmed bars
• Maximum equity drawdown tracking + table display
• Optional horizontal reference line
• Designed for long-horizon allocation experiments
Great for:
• Passive portfolio stress-testing
• Comparing allocation strategies
• Evaluating long-term crypto/asset mixes
• Visualizing risk via max drawdowns
This tool does not execute trades or rebalance—its purpose is pure visualization, giving traders clarity about how portfolios behave under different allocation assumptions.
If you expand or modify the indicator, please credit the original author.

Trading Volatility Clock⏰ TRADING VOLATILITY CLOCK - Know When the Action Happens (Anywhere in the World)
A real-time session tracker with multi-timezone support for active traders who need to know when US market volatility strikes - no matter where they are in the world. Perfect for day traders, scalpers, and anyone trading liquid US markets.
══════════════════════════════════════════════════════
📊 WHAT IT DOES
This indicator displays a live clock showing:
- Current time in YOUR selected timezone (10 major timezones supported)
- Active US market session with color-coded volatility levels
- Countdown timer showing time remaining in current session
- Preview of the next upcoming session
- Optional alerts when entering high-volatility periods
══════════════════════════════════════════════════════
🌍 MULTI-TIMEZONE SUPPORT
SESSIONS ALWAYS TRACK US MARKET HOURS (Eastern Time):
No matter which timezone you select, the sessions always trigger at the correct US market times. Perfect for international traders who want to:
• See their local time while tracking US market sessions
• Know exactly when US volatility hits in their timezone
• Plan their trading day around US market hours
SUPPORTED TIMEZONES:
• America/New_York (ET) - Eastern Time
• America/Chicago (CT) - Central Time
• America/Los_Angeles (PT) - Pacific Time
• Europe/London (GMT) - Greenwich Mean Time
• Europe/Berlin (CET) - Central European Time
• Asia/Tokyo (JST) - Japan Standard Time
• Asia/Shanghai (CST) - China Standard Time
• Asia/Hong_Kong (HKT) - Hong Kong Time
• Australia/Sydney (AEDT) - Australian Eastern Time
• UTC - Coordinated Universal Time
EXAMPLE: A trader in Tokyo selects "Asia/Tokyo"
• Clock shows: 11:30 PM JST
• Session shows: "Opening Drive" 🔥 HIGH
• They know: US market just opened (9:30 AM ET in New York)
══════════════════════════════════════════════════════
🎯 WHY IT'S USEFUL
Whether you trade futures, high-volume stocks, or ETFs, volatility isn't constant throughout the day. Knowing WHEN to expect movement is critical:
🔥 HIGH VOLATILITY (Red):
• Opening Drive (9:30-10:30 AM ET) - Highest volume of the day
• Power Hour (3:00-4:00 PM ET) - Second-highest volume, final push
⚡ MEDIUM VOLATILITY (Yellow):
• Pre-Market (8:00-9:30 AM ET) - Building momentum
• Lunch Return (1:00-2:00 PM ET) - Traders returning
• Afternoon Session (2:00-3:00 PM ET) - Trend continuation
• After Hours (4:00-5:00 PM ET) - News reactions
💤 LOW VOLATILITY (Gray):
• Overnight Grind (12:00-8:00 AM ET) - Thin volume
• Mid-Morning Chop (10:30-11:30 AM ET) - Ranges form
• Lunch Hour (11:30 AM-1:00 PM ET) - Dead zone
• Evening Fade (5:00-8:00 PM ET) - Volume dropping
══════════════════════════════════════════════════════
⚙️ CUSTOMIZATION OPTIONS
TIMEZONE SETTINGS:
• Select from 10 major timezones worldwide
• Clock automatically displays in your local time
• Sessions remain locked to US market hours
SESSION TIME CUSTOMIZATION:
• Every session boundary is adjustable (in minutes from midnight ET)
• Perfect for traders who define sessions differently
• Advanced users can create custom volatility schedules
DISPLAY OPTIONS:
• Toggle next session preview on/off
• Enable/disable high volatility alerts
• Clean, unobtrusive table display in top-right corner
══════════════════════════════════════════════════════
💡 HOW TO USE
1. Add indicator to any chart (works on all timeframes)
2. Select your timezone in Settings → Timezone Settings
3. Set your chart to 1-minute timeframe for real-time updates
4. Customize session times if needed (Settings → Session Time Customization)
5. Watch the top-right corner for live session tracking
TRADING APPLICATIONS:
• Avoid trading during dead zones (lunch hour, mid-morning chop)
• Increase position size during high volatility windows
• Set alerts for Opening Drive and Power Hour
• Plan your trading day around US market volatility schedule
• International traders can track US sessions in their local time
══════════════════════════════════════════════════════
🎓 EDUCATIONAL VALUE
This indicator teaches traders:
• Market microstructure and volume patterns
• Why certain times produce better opportunities
• How institutional flows create intraday patterns
• The importance of timing in active trading
• How to adapt US market trading to any timezone
══════════════════════════════════════════════════════
⚠️ IMPORTANT NOTES
- Works best on 1-minute charts for frequent updates
- Sessions are ALWAYS based on US Eastern Time (ET)
- Timezone selection only changes the clock display
- Clock updates when new bar closes (not tick-by-tick)
- Alerts trigger once per bar when enabled
- Perfect for international traders tracking US markets
══════════════════════════════════════════════════════
📈 BEST USED WITH
- High-volume US stocks: TSLA, NVDA, AAPL, AMD, META
- Major US ETFs: SPY, QQQ, IWM, DIA
- US Futures: ES, NQ, RTY, YM, MES, MNQ
- Any liquid US instrument with clear intraday volume patterns
══════════════════════════════════════════════════════
🌏 FOR INTERNATIONAL TRADERS
This tool is specifically designed for traders outside the US who need to:
• Track US market sessions in their local timezone
• Know when to be at their desk for US volatility
• Avoid waking up for low-volatility periods
• Maximize trading efficiency around US market hours
No more timezone confusion. No more missing the opening bell. Just set your timezone and trade with confidence.
══════════════════════════════════════════════════════
This is an open-source educational tool. Feel free to modify and adapt to your trading style!
Happy Trading! 🚀

Extreme Candle Pattern Visualizer🟠 OVERVIEW
This indicator compares the current candle's percentage change against historical data, then highlights past candles with equal or bigger magnitude of movement. Also, for all the highlighted past candles, it tracks how far price extends before recovering to its starting point. It also provides statistical context through percentile rankings.
IN SHORT: Quickly spot similar price movements in the past and understand how unusual the current candle is using percentile rankings.
🟠 CORE CONCEPT
The indicator operates on two fundamental principles:
1. Statistical Rarity Detection
The script calculates the percentage change (open to close) of every candle within a user-defined lookback period and determines where the current candle ranks in this distribution. A candle closing at -9% might fall in the bottom 5th percentile, indicating it's more extreme than 95% of recent candles. This percentile ranking helps traders identify statistically unusual moves that often precede reversals or extended trends.
2. Recovery Path Mapping
Once extreme candles are identified (those matching or exceeding the current candle's magnitude), the indicator tracks their subsequent price action. For bearish candles, it measures how far price dropped before recovering back to the candle's opening price. For bullish candles, it tracks how high price climbed before returning to the open. This reveals whether extreme moves typically extend further or reverse quickly.
🟠 PRACTICAL APPLICATIONS
Mean Reversion Trading:
Candles in extreme percentiles (below 10% or above 90%) often signal oversold/overbought conditions. The recovery lines show typical extension distances, helping traders set profit targets for counter-trend entries.
Momentum Continuation:
When extreme candles show small recovery percentages before price reverses back, it suggests strong directional momentum that may continue.
Stop Loss Placement:
Historical recovery data reveals typical extension ranges after extreme moves, informing more precise stop loss positioning beyond noise but before major reversals.
Pattern Recognition:
By visualizing how similar historical extremes resolved, traders gain context for current price action rather than trading in isolation.
🟠 VISUAL ELEMENTS
Orange Circles: Mark historical candles with similar or greater magnitude to current candle
Red Lines: Track downward extensions after bearish extreme candles
Green Lines: Track upward extensions after bullish extreme candles
Percentage Labels: Show exact extension distance from candle close to extreme point
Percentile Label: Color-coded box displaying current candle's statistical ranking
Hollow Candles: Background rendering for clean chart presentation
🟠 ORIGINALITY
This indicator uniquely combines statistical percentile analysis with forward-looking recovery tracking. While many indicators identify extreme moves, few show what happened next across multiple historical instances simultaneously. The dual approach provides both the "how rare is this?" question (percentile) and "what typically happens after?" answer (recovery paths) in a single visual framework.

Squeeze Hour Frequency [CHE]Squeeze Hour Frequency (ATR-PR) — Standalone — Tracks daily squeeze occurrences by hour to reveal time-based volatility patterns
Summary
This indicator identifies periods of unusually low volatility, defined as squeezes, and tallies their frequency across each hour of the day over historical trading sessions. By aggregating counts into a sortable table, it helps users spot hours prone to these conditions, enabling better scheduling of trading activity to avoid or target specific intraday regimes. Signals gain robustness through percentile-based detection that adapts to recent volatility history, differing from fixed-threshold methods by focusing on relative lowness rather than absolute levels, which reduces false positives in varying market environments.
Motivation: Why this design?
Traders often face uneven intraday volatility, with certain hours showing clustered low-activity phases that precede or follow breakouts, leading to mistimed entries or overlooked calm periods. The core idea of hourly squeeze frequency addresses this by binning low-volatility events into 24 hourly slots and counting distinct daily occurrences, providing a historical profile of when squeezes cluster. This reveals time-of-day biases without relying on real-time alerts, allowing proactive adjustments to session focus.
What’s different vs. standard approaches?
- Reference baseline: Classical volatility tools like simple moving average crossovers or fixed ATR thresholds, which flag squeezes uniformly across the day.
- Architecture differences:
- Uses persistent arrays to track one squeeze per hour per day, preventing overcounting within sessions.
- Employs custom sorting on ratio arrays for dynamic table display, prioritizing top or bottom performers.
- Handles timezones explicitly to ensure consistent binning across global assets.
- Practical effect: Charts show a persistent table ranking hours by squeeze share, making intraday patterns immediately visible—such as a top hour capturing over 20 percent of total events—unlike static overlays that ignore temporal distribution, which matters for avoiding low-liquidity traps in crypto or forex.
How it works (technical)
The indicator first computes a rolling volatility measure over a specified lookback period. It then derives a relative ranking of the current value against recent history within a window of bars. A squeeze is flagged when this ranking falls below a user-defined cutoff, indicating the value is among the lowest in the recent sample.
On each bar, the local hour is extracted using the selected timezone. If a squeeze occurs and the bar has price data, the count for that hour increments only if no prior mark exists for the current day, using a persistent array to store the last marked day per hour. This ensures one tally per unique trading day per slot.
At the final bar, arrays compile counts and ratios for all 24 hours, where the ratio represents each hour's share of total squeezes observed. These are sorted ascending or descending based on display mode, and the top or bottom subset populates the table. Background shading highlights live squeezes in red for visual confirmation. Initialization uses zero-filled arrays for counts and negative seeds for day tracking, with state persisting across bars via variable declarations.
No higher timeframe data is pulled, so there is no repaint risk from external fetches; all logic runs on confirmed bars.
Parameter Guide
ATR Length — Controls the lookback for the volatility measure, influencing sensitivity to short-term fluctuations; shorter values increase responsiveness but add noise, longer ones smooth for stability — Default: 14 — Trade-offs/Tips: Use 10-20 for intraday charts to balance quick detection with fewer false squeezes; test on historical data to avoid over-smoothing in trending markets.
Percentile Window (bars) — Sets the history depth for ranking the current volatility value, affecting how "low" is defined relative to past; wider windows emphasize long-term norms — Default: 252 — Trade-offs/Tips: 100-300 bars suit daily cycles; narrower for fast assets like crypto to catch recent regimes, but risks instability in sparse data.
Squeeze threshold (PR < x) — Defines the cutoff for flagging low relative volatility, where values below this mark a squeeze; lower thresholds tighten detection for rarer events — Default: 10.0 — Trade-offs/Tips: 5-15 percent for conservative signals reducing false positives; raise to 20 for more frequent highlights in high-vol environments, monitoring for increased noise.
Timezone — Specifies the reference for hourly binning, ensuring alignment with market sessions — Default: Exchange — Trade-offs/Tips: Set to "America/New_York" for US assets; mismatches can skew counts, so verify against chart timezone.
Show Table — Toggles the results display, essential for reviewing frequencies — Default: true — Trade-offs/Tips: Disable on mobile for performance; pair with position tweaks for clean overlays.
Pos — Places the table on the chart pane — Default: Top Right — Trade-offs/Tips: Bottom Left avoids candle occlusion on volatile charts.
Font — Adjusts text readability in the table — Default: normal — Trade-offs/Tips: Tiny for dense views, large for emphasis on key hours.
Dark — Applies high-contrast colors for visibility — Default: true — Trade-offs/Tips: Toggle false in light themes to prevent washout.
Display — Filters table rows to focus on extremes or full list — Default: All — Trade-offs/Tips: Top 3 for quick scans of risky hours; Bottom 3 highlights safe low-squeeze periods.
Reading & Interpretation
Red background shading appears on bars meeting the squeeze condition, signaling current low relative volatility. The table lists hours as "H0" to "H23", with columns for daily squeeze counts, percentage share of total squeezes (summing to 100 percent across hours), and an arrow marker on the top hour. A summary row above details the peak count, its share, and the leading hour. A label at the last bar recaps total days observed, data-valid days, and top hour stats. Rising shares indicate clustering, suggesting regime persistence in that slot.
Practical Workflows & Combinations
- Trend following: Scan for hours with low squeeze shares to enter during stable regimes; confirm with higher highs or lower lows on the 15-minute chart, avoiding top-share hours post-news like tariff announcements.
- Exits/Stops: Tighten stops in high-share hours to guard against sudden vol spikes; use the table to shift to conservative sizing outside peak squeeze times.
- Multi-asset/Multi-TF: Defaults work across crypto pairs on 5-60 minute timeframes; for stocks, widen percentile window to 500 bars. Combine with volume oscillators—enter only if squeeze count is below average for the asset.
Behavior, Constraints & Performance
Logic executes on closed bars, with live bars updating counts provisionally but finalizing on confirmation; table refreshes only at the last bar, avoiding intrabar flicker. No security calls or higher timeframes, so no repaint from external data. Resources include a 5000-bar history limit, loops up to 24 iterations for sorting and totals, and arrays sized to 24 elements; labels and table are capped at 500 each for efficiency. Known limits: Skips hours without bars (e.g., weekends), assumes uniform data availability, and may undercount in sparse sessions; timezone shifts can alter profiles without warning.
Sensible Defaults & Quick Tuning
Start with ATR Length at 14, Percentile Window at 252, and threshold at 10.0 for broad crypto use. If too many squeezes flag (noisy table), raise threshold to 15.0 and narrow window to 100 for stricter relative lowness. For sluggish detection in calm markets, drop ATR Length to 10 and threshold to 5.0 to capture subtler dips. In high-vol assets, widen window to 500 and threshold to 20.0 for stability.
What this indicator is—and isn’t
This is a historical frequency tracker and visualization layer for intraday volatility patterns, best as a filter in multi-tool setups. It is not a standalone signal generator, predictive model, or risk manager—pair it with price action, news filters, and position sizing rules.
Disclaimer
The content provided, including all code and materials, is strictly for educational and informational purposes only. It is not intended as, and should not be interpreted as, financial advice, a recommendation to buy or sell any financial instrument, or an offer of any financial product or service. All strategies, tools, and examples discussed are provided for illustrative purposes to demonstrate coding techniques and the functionality of Pine Script within a trading context.
Any results from strategies or tools provided are hypothetical, and past performance is not indicative of future results. Trading and investing involve high risk, including the potential loss of principal, and may not be suitable for all individuals. Before making any trading decisions, please consult with a qualified financial professional to understand the risks involved.
By using this script, you acknowledge and agree that any trading decisions are made solely at your discretion and risk.
Do not use this indicator on Heikin-Ashi, Renko, Kagi, Point-and-Figure, or Range charts, as these chart types can produce unrealistic results for signal markers and alerts.
Best regards and happy trading
Chervolino
Thanks to Duyck
for the ma sorter

BOCS Channel Scalper Indicator - Mean Reversion Alert System# BOCS Channel Scalper Indicator - Mean Reversion Alert System
## WHAT THIS INDICATOR DOES:
This is a mean reversion trading indicator that identifies consolidation channels through volatility analysis and generates alert signals when price enters entry zones near channel boundaries. **This indicator version is designed for manual trading with comprehensive alert functionality.** Unlike automated strategies, this tool sends notifications (via popup, email, SMS, or webhook) when trading opportunities occur, allowing you to manually review and execute trades. The system assumes price will revert to the channel mean, identifying scalp opportunities as price reaches extremes and preparing to bounce back toward center.
## INDICATOR VS STRATEGY - KEY DISTINCTION:
**This is an INDICATOR with alerts, not an automated strategy.** It does not execute trades automatically. Instead, it:
- Displays visual signals on your chart when entry conditions are met
- Sends customizable alerts to your device/email when opportunities arise
- Shows TP/SL levels for reference but does not place orders
- Requires you to manually enter and exit positions based on signals
- Works with all TradingView subscription levels (alerts included on all plans)
**For automated trading with backtesting**, use the strategy version. For manual control with notifications, use this indicator version.
## ALERT CAPABILITIES:
This indicator includes four distinct alert conditions that can be configured independently:
**1. New Channel Formation Alert**
- Triggers when a fresh BOCS channel is identified
- Message: "New BOCS channel formed - potential scalp setup ready"
- Use this to prepare for upcoming trading opportunities
**2. Long Scalp Entry Alert**
- Fires when price touches the long entry zone
- Message includes current price, calculated TP, and SL levels
- Notification example: "LONG scalp signal at 24731.75 | TP: 24743.2 | SL: 24716.5"
**3. Short Scalp Entry Alert**
- Fires when price touches the short entry zone
- Message includes current price, calculated TP, and SL levels
- Notification example: "SHORT scalp signal at 24747.50 | TP: 24735.0 | SL: 24762.75"
**4. Any Entry Signal Alert**
- Combined alert for both long and short entries
- Use this if you want a single alert stream for all opportunities
- Message: "BOCS Scalp Entry: at "
**Setting Up Alerts:**
1. Add indicator to chart and configure settings
2. Click the Alert (⏰) button in TradingView toolbar
3. Select "BOCS Channel Scalper" from condition dropdown
4. Choose desired alert type (Long, Short, Any, or Channel Formation)
5. Set "Once Per Bar Close" to avoid false signals during bar formation
6. Configure delivery method (popup, email, webhook for automation platforms)
7. Save alert - it will fire automatically when conditions are met
**Alert Message Placeholders:**
Alerts use TradingView's dynamic placeholder system:
- {{ticker}} = Symbol name (e.g., NQ1!)
- {{close}} = Current price at signal
- {{plot_1}} = Calculated take profit level
- {{plot_2}} = Calculated stop loss level
These placeholders populate automatically, creating detailed notification messages without manual configuration.
## KEY DIFFERENCE FROM ORIGINAL BOCS:
**This indicator is designed for traders seeking higher trade frequency.** The original BOCS indicator trades breakouts OUTSIDE channels, waiting for price to escape consolidation before entering. This scalper version trades mean reversion INSIDE channels, entering when price reaches channel extremes and betting on a bounce back to center. The result is significantly more trading opportunities:
- **Original BOCS**: 1-3 signals per channel (only on breakout)
- **Scalper Indicator**: 5-15+ signals per channel (every touch of entry zones)
- **Trade Style**: Mean reversion vs trend following
- **Hold Time**: Seconds to minutes vs minutes to hours
- **Best Markets**: Ranging/choppy conditions vs trending breakouts
This makes the indicator ideal for active day traders who want continuous alert opportunities within consolidation zones rather than waiting for breakout confirmation. However, increased signal frequency also means higher potential commission costs and requires disciplined trade selection when acting on alerts.
## TECHNICAL METHODOLOGY:
### Price Normalization Process:
The indicator normalizes price data to create consistent volatility measurements across different instruments and price levels. It calculates the highest high and lowest low over a user-defined lookback period (default 100 bars). Current close price is normalized using: (close - lowest_low) / (highest_high - lowest_low), producing values between 0 and 1 for standardized volatility analysis.
### Volatility Detection:
A 14-period standard deviation is applied to the normalized price series to measure price deviation from the mean. Higher standard deviation values indicate volatility expansion; lower values indicate consolidation. The indicator uses ta.highestbars() and ta.lowestbars() to identify when volatility peaks and troughs occur over the detection period (default 14 bars).
### Channel Formation Logic:
When volatility crosses from a high level to a low level (ta.crossover(upper, lower)), a consolidation phase begins. The indicator tracks the highest and lowest prices during this period, which become the channel boundaries. Minimum duration of 10+ bars is required to filter out brief volatility spikes. Channels are rendered as box objects with defined upper and lower boundaries, with colored zones indicating entry areas.
### Entry Signal Generation:
The indicator uses immediate touch-based entry logic. Entry zones are defined as a percentage from channel edges (default 20%):
- **Long Entry Zone**: Bottom 20% of channel (bottomBound + channelRange × 0.2)
- **Short Entry Zone**: Top 20% of channel (topBound - channelRange × 0.2)
Long signals trigger when candle low touches or enters the long entry zone. Short signals trigger when candle high touches or enters the short entry zone. Visual markers (arrows and labels) appear on chart, and configured alerts fire immediately.
### Cooldown Filter:
An optional cooldown period (measured in bars) prevents alert spam by enforcing minimum spacing between consecutive signals. If cooldown is set to 3 bars, no new long alert will fire until 3 bars after the previous long signal. Long and short cooldowns are tracked independently, allowing both directions to signal within the same period.
### ATR Volatility Filter:
The indicator includes a multi-timeframe ATR filter to avoid alerts during low-volatility conditions. Using request.security(), it fetches ATR values from a specified timeframe (e.g., 1-minute ATR while viewing 5-minute charts). The filter compares current ATR to a user-defined minimum threshold:
- If ATR ≥ threshold: Alerts enabled
- If ATR < threshold: No alerts fire
This prevents notifications during dead zones where mean reversion is unreliable due to insufficient price movement. The ATR status is displayed in the info table with visual confirmation (✓ or ✗).
### Take Profit Calculation:
Two TP methods are available:
**Fixed Points Mode**:
- Long TP = Entry + (TP_Ticks × syminfo.mintick)
- Short TP = Entry - (TP_Ticks × syminfo.mintick)
**Channel Percentage Mode**:
- Long TP = Entry + (ChannelRange × TP_Percent)
- Short TP = Entry - (ChannelRange × TP_Percent)
Default 50% targets the channel midline, a natural mean reversion target. These levels are displayed as visual lines with labels and included in alert messages for reference when manually placing orders.
### Stop Loss Placement:
Stop losses are calculated just outside the channel boundary by a user-defined tick offset:
- Long SL = ChannelBottom - (SL_Offset_Ticks × syminfo.mintick)
- Short SL = ChannelTop + (SL_Offset_Ticks × syminfo.mintick)
This logic assumes channel breaks invalidate the mean reversion thesis. SL levels are displayed on chart and included in alert notifications as suggested stop placement.
### Channel Breakout Management:
Channels are removed when price closes more than 10 ticks outside boundaries. This tolerance prevents premature channel deletion from minor breaks or wicks, allowing the mean reversion setup to persist through small boundary violations.
## INPUT PARAMETERS:
### Channel Settings:
- **Nested Channels**: Allow multiple overlapping channels vs single channel
- **Normalization Length**: Lookback for high/low calculation (1-500, default 100)
- **Box Detection Length**: Period for volatility detection (1-100, default 14)
### Scalping Settings:
- **Enable Long Scalps**: Toggle long alert generation on/off
- **Enable Short Scalps**: Toggle short alert generation on/off
- **Entry Zone % from Edge**: Size of entry zone (5-50%, default 20%)
- **SL Offset (Ticks)**: Distance beyond channel for stop (1+, default 5)
- **Cooldown Period (Bars)**: Minimum spacing between alerts (0 = no cooldown)
### ATR Filter:
- **Enable ATR Filter**: Toggle volatility filter on/off
- **ATR Timeframe**: Source timeframe for ATR (1, 5, 15, 60 min, etc.)
- **ATR Length**: Smoothing period (1-100, default 14)
- **Min ATR Value**: Threshold for alert enablement (0.1+, default 10.0)
### Take Profit Settings:
- **TP Method**: Choose Fixed Points or % of Channel
- **TP Fixed (Ticks)**: Static distance in ticks (1+, default 30)
- **TP % of Channel**: Dynamic target as channel percentage (10-100%, default 50%)
### Appearance:
- **Show Entry Zones**: Toggle zone labels on channels
- **Show Info Table**: Display real-time indicator status
- **Table Position**: Corner placement (Top Left/Right, Bottom Left/Right)
- **Long Color**: Customize long signal color (default: darker green for readability)
- **Short Color**: Customize short signal color (default: red)
- **TP/SL Colors**: Customize take profit and stop loss line colors
- **Line Length**: Visual length of TP/SL reference lines (5-200 bars)
## VISUAL INDICATORS:
- **Channel boxes** with semi-transparent fill showing consolidation zones
- **Colored entry zones** labeled "LONG ZONE ▲" and "SHORT ZONE ▼"
- **Entry signal arrows** below/above bars marking long/short alerts
- **TP/SL reference lines** with emoji labels (⊕ Entry, 🎯 TP, 🛑 SL)
- **Info table** showing channel status, last signal, entry/TP/SL prices, risk/reward ratio, and ATR filter status
- **Visual confirmation** when alerts fire via on-chart markers synchronized with notifications
## HOW TO USE:
### For 1-3 Minute Scalping with Alerts (NQ/ES):
- ATR Timeframe: "1" (1-minute)
- ATR Min Value: 10.0 (for NQ), adjust per instrument
- Entry Zone %: 20-25%
- TP Method: Fixed Points, 20-40 ticks
- SL Offset: 5-10 ticks
- Cooldown: 2-3 bars to reduce alert spam
- **Alert Setup**: Configure "Any Entry Signal" for combined long/short notifications
- **Execution**: When alert fires, verify chart visuals, then manually place limit order at entry zone with provided TP/SL levels
### For 5-15 Minute Day Trading with Alerts:
- ATR Timeframe: "5" or match chart
- ATR Min Value: Adjust to instrument (test 8-15 for NQ)
- Entry Zone %: 20-30%
- TP Method: % of Channel, 40-60%
- SL Offset: 5-10 ticks
- Cooldown: 3-5 bars
- **Alert Setup**: Configure separate "Long Scalp Entry" and "Short Scalp Entry" alerts if you trade directionally based on bias
- **Execution**: Review channel structure on alert, confirm ATR filter shows ✓, then enter manually
### For 30-60 Minute Swing Scalping with Alerts:
- ATR Timeframe: "15" or "30"
- ATR Min Value: Lower threshold for broader market
- Entry Zone %: 25-35%
- TP Method: % of Channel, 50-70%
- SL Offset: 10-15 ticks
- Cooldown: 5+ bars or disable
- **Alert Setup**: Use "New Channel Formation" to prepare for setups, then "Any Entry Signal" for execution alerts
- **Execution**: Larger timeframes allow more analysis time between alert and entry
### Webhook Integration for Semi-Automation:
- Configure alert webhook URL to connect with platforms like TradersPost, TradingView Paper Trading, or custom automation
- Alert message includes all necessary order parameters (direction, entry, TP, SL)
- Webhook receives structured data when signal fires
- External platform can auto-execute based on alert payload
- Still maintains manual oversight vs full strategy automation
## USAGE CONSIDERATIONS:
- **Manual Discipline Required**: Alerts provide opportunities but execution requires judgment. Not all alerts should be taken - consider market context, trend, and channel quality
- **Alert Timing**: Alerts fire on bar close by default. Ensure "Once Per Bar Close" is selected to avoid false signals during bar formation
- **Notification Delivery**: Mobile/email alerts may have 1-3 second delay. For immediate execution, use desktop popups or webhook automation
- **Cooldown Necessity**: Without cooldown, rapidly touching price action can generate excessive alerts. Start with 3-bar cooldown and adjust based on alert volume
- **ATR Filter Impact**: Enabling ATR filter dramatically reduces alert count but improves quality. Track filter status in info table to understand when you're receiving fewer alerts
- **Commission Awareness**: High alert frequency means high potential trade count. Calculate if your commission structure supports frequent scalping before acting on all alerts
## COMPATIBLE MARKETS:
Works on any instrument with price data including stock indices (NQ, ES, YM, RTY), individual stocks, forex pairs (EUR/USD, GBP/USD), cryptocurrency (BTC, ETH), and commodities. Volume-based features are not included in this indicator version. Multi-timeframe ATR requires higher-tier TradingView subscription for request.security() functionality on timeframes below chart timeframe.
## KNOWN LIMITATIONS:
- **Indicator does not execute trades** - alerts are informational only; you must manually place all orders
- **Alert delivery depends on TradingView infrastructure** - delays or failures possible during platform issues
- **No position tracking** - indicator doesn't know if you're in a trade; you must manage open positions independently
- **TP/SL levels are reference only** - you must manually set these on your broker platform; they are not live orders
- **Immediate touch entry can generate many alerts** in choppy zones without adequate cooldown
- **Channel deletion at 10-tick breaks** may be too aggressive or lenient depending on instrument tick size
- **ATR filter from lower timeframes** requires TradingView Premium/Pro+ for request.security()
- **Mean reversion logic fails** in strong breakout scenarios - alerts will fire but trades may hit stops
- **No partial closing capability** - full position management is manual; you determine scaling out
- **Alerts do not account for gaps** or overnight price changes; morning alerts may be stale
## RISK DISCLOSURE:
Trading involves substantial risk of loss. This indicator provides signals for educational and informational purposes only and does not constitute financial advice. Past performance does not guarantee future results. Mean reversion strategies can experience extended drawdowns during trending markets. Alerts are not guaranteed to be profitable and should be combined with your own analysis. Stop losses may not fill at intended levels during extreme volatility or gaps. Never trade with capital you cannot afford to lose. Consider consulting a licensed financial advisor before making trading decisions. Always verify alerts against current market conditions before executing trades manually.
## ACKNOWLEDGMENT & CREDITS:
This indicator is built upon the channel detection methodology created by **AlgoAlpha** in the "Smart Money Breakout Channels" indicator. Full credit and appreciation to AlgoAlpha for pioneering the normalized volatility approach to identifying consolidation patterns. The core channel formation logic using normalized price standard deviation is AlgoAlpha's original contribution to the TradingView community.
Enhancements to the original concept include: mean reversion entry logic (vs breakout), immediate touch-based alert generation, comprehensive alert condition system with customizable notifications, multi-timeframe ATR volatility filtering, cooldown period for alert management, dual TP methods (fixed points vs channel percentage), visual TP/SL reference lines, and real-time status monitoring table. This indicator version is specifically designed for manual traders who prefer alert-based decision making over automated execution.

BTC Momentum Detector 1h# BTC Momentum Detector 1h
This indicator is designed to detect significant momentum movements in Bitcoin price on the 1-hour timeframe. It identifies candles with percentage changes within a specific range, which often precede larger price movements.
## How It Works
The indicator analyzes price movements to detect potential momentum shifts:
- Identifies candles with percentage changes between configurable thresholds (default: 1.7% - 2.8%)
- Requires neutral or inverse movement in the prior candle to avoid false signals
- Optional volume filter ensures signals are confirmed by above-average trading activity
- Tracks price continuation to calculate success rates and average returns
## Key Features
- **Signal Detection**: Green triangles below price bars indicate upward momentum signals; red triangles above price bars indicate downward momentum signals
- **Continuation Tracking**: Dashed horizontal lines show the entry price levels of active signals being tracked
- **Statistics Panel**: Displays real-time metrics including signal counts, success rates, and average returns
- **Current Status**: Shows the current price change percentage and active signals being monitored
## Parameters
- **Minimum Percentage Threshold**: Minimum price change to trigger a signal (default: 1.7%)
- **Maximum Percentage Threshold**: Maximum price change to filter out extreme moves (default: 2.8%)
- **Continuation Periods**: Number of periods to track after signal (default: 2)
- **Require Prior Neutral/Inverse**: Filters signals by requiring neutral or opposite prior movement
- **Neutral Threshold**: Defines what's considered a neutral movement (default: 0.1%)
- **Volume Filter**: Option to require above-average volume for confirmation
- **Volume Multiplier**: Volume must exceed average by this factor (default: 2x)
## Strategy Concept
The underlying strategy is based on the concept that when Bitcoin makes a controlled, significant move (not too small, not too large) after a period of neutral or opposite movement, it often continues in that direction for the next few periods. This pattern reflects the early stages of momentum development in the market.

Average Price Range Screener [KFB Quant]Average Price Range Screener
Overview:
The Average Price Range Screener is a technical analysis tool designed to provide insights into the average price volatility across multiple symbols over user-defined time periods. The indicator compares price ranges from different assets and displays them in a visual table and chart for easy reference. This can be especially helpful for traders looking to identify symbols with high or low volatility across various time frames.
Key Features:
Multiple Symbols Supported:
The script allows for analysis of up to 10 symbols, such as major cryptocurrencies and market indices. Symbols can be selected by the user and configured for tracking price volatility.
Dynamic Range Calculation:
The script calculates the average price range of each symbol over three distinct time periods (default are 30, 60, and 90 bars). The price range for each symbol is calculated as a percentage of the bar's high-to-low difference relative to its low value.
Range Visualization:
The results are visually represented using:
- A color-coded table showing the calculated average ranges of each symbol and the current chart symbol.
- A line plot that visually tracks the volatility for each symbol on the chart, with color gradients representing the range intensity from low (red/orange) to high (blue/green).
Customizable Inputs:
- Length Inputs: Users can define the time lengths (default are 30, 60, and 90 bars) for calculating average price ranges for each symbol.
- Symbol Inputs: 10 symbols can be tracked at once, with default values set to popular crypto pairs and indices.
- Color Inputs: Users can customize the color scheme for the range values displayed in the table and chart.
Real-Time Ranking:
The indicator ranks symbols by their average price range, providing a clear view of which assets are exhibiting higher volatility at any given time.
Each symbol's range value is color-coded based on its relative volatility within the selected symbols (using a gradient from low to high range).
Data Table:
The table shows the average range values for each symbol in real-time, allowing users to compare volatility across multiple assets at a glance. The table is dynamically updated as new data comes in.
Interactive Labels:
The indicator adds labels to the chart, showing the average range for each symbol. These labels adjust in real-time as the price range values change, giving users an immediate view of volatility rankings.
How to Use:
Set Time Periods: Adjust the time periods (lengths) to match your trading strategy's timeframe and volatility preference.
Symbol Selection: Add and track the price range for your preferred symbols (cryptocurrencies, stocks, indices).
Monitor Volatility: Use the visual table and plot to identify symbols with higher or lower volatility, and adjust your trading strategy accordingly.
Interpret the Table and Chart: Ranges that are color-coded from red/orange (lower volatility) to blue/green (higher volatility) allow you to quickly gauge which symbols are most volatile.
Disclaimer: This tool is provided for informational and educational purposes only and should not be considered as financial advice. Always conduct your own research and consult with a licensed financial advisor before making any investment decisions.

Winning and Losing StreaksThe Pine Script indicator "Winning and Losing Streaks" tracks and visualizes the length of consecutive winning and losing streaks in a financial series, such as stock prices. Here’s a detailed description of the indicator, including the relevance of statistical analysis and streak tracking.
Indicator Description
The "Winning and Losing Streaks" indicator in Pine Script is designed to analyze and display streaks of consecutive winning and losing days in trading data. It helps traders and analysts understand the persistence of trends in price movements.
Here’s how it functions:
Streak Calculation:
Winning Streak: A series of consecutive days where the closing price is higher than the previous day's closing price.
Losing Streak: A series of consecutive days where the closing price is lower than the previous day's closing price.
Doji Candles: The indicator also considers Doji candles, where the difference between the opening and closing prices is minimal relative to the high-low range, and excludes these from being counted as winning or losing days.
Statistical Analysis:
The indicator computes the maximum and average lengths of winning and losing streaks.
It also tracks the current streak lengths and maintains arrays to store the historical streak data.
Visualization:
Histograms: Winning and losing streaks are visualized using histograms, which provide a clear graphical representation of streak lengths over time.
Relevance of Statistical Analysis and Streak Tracking
1. Statistical Significance of Streaks
Tracking winning and losing streaks has significant statistical implications for trading strategies and risk management:
Autocorrelation: Streaks in financial time series can reveal autocorrelation, where past returns influence future returns. Studies have shown that financial time series often exhibit autocorrelation, which can be used to forecast future price movements (Lo, 1991; Jegadeesh & Titman, 1993). Understanding streaks helps in identifying and leveraging these patterns.
Behavioral Finance: Streak analysis aligns with concepts from behavioral finance, such as the "hot-hand fallacy," where investors may perceive trends as more persistent than they are (Gilovich, Vallone, & Tversky, 1985). Statistical streak analysis provides a more objective view of trend persistence, helping to avoid biases.
2. Risk Management and Strategy Development
Risk Assessment: Identifying the length and frequency of losing streaks is crucial for managing risk and adjusting trading strategies. Long losing streaks can indicate potential strategy weaknesses or market regime changes, prompting a reassessment of trading rules and risk management practices (Brock, Lakonishok, & LeBaron, 1992).
Strategy Optimization: Statistical analysis of streaks can aid in optimizing trading strategies. For example, understanding the average length of winning and losing streaks can help in setting more effective stop-loss and take-profit levels, as well as in determining the optimal position sizing (Fama & French, 1993).
Scientific References:
Lo, A. W. (1991). "Long-Term Memory in Stock Market Prices." Econometrica, 59(5), 1279-1313. This paper discusses the presence of long-term memory in stock prices, which is relevant for understanding the persistence of streaks.
Jegadeesh, N., & Titman, S. (1993). "Returns to Buying Winners and Selling Losers: Implications for Stock Market Efficiency." Journal of Finance, 48(1), 65-91. This study explores momentum and reversal strategies, which are related to the concept of streaks.
Gilovich, T., Vallone, R., & Tversky, A. (1985). "The Hot Hand in Basketball: On the Misperception of Random Sequences." Cognitive Psychology, 17(3), 295-314. This paper provides insight into the psychological aspects of streaks and persistence.
Brock, W., Lakonishok, J., & LeBaron, B. (1992). "Simple Technical Trading Rules and the Stochastic Properties of Stock Returns." Journal of Finance, 47(5), 1731-1764. This research examines the effectiveness of technical trading rules, relevant for streak-based strategies.
Fama, E. F., & French, K. R. (1993). "Common Risk Factors in the Returns on Stocks and Bonds." Journal of Financial Economics, 33(1), 3-56. This paper provides a foundation for understanding risk factors and strategy performance.
By analyzing streaks, traders can gain valuable insights into market dynamics and refine their trading strategies based on empirical evidence.

Crypto McClellan Oscillator (SLN Fix)This is an adaption of the Mcclellan Oscillator for crypto. Instead of tracking the S&P500 it tracks a selection of cryptos to make sure the indicator follows this sector instead.
Full credit goes to the creator of this indicator: Fadior. It has since been fixed by SLN.
The following description explains the standard McClellan Oscillator. Full credit to Investopedia , my fav source of financial explanations.
The same principles applies to its use in the crypto sector, but please be cautious of the last point, the limitations. Since crypto is more volatile, that could amplify choppy behavior.
This is not financial advice, please be extremely cautious. This indicator is only suitable as a confirmation signal and needs support of other signals to be profitable.
This indicator usually produces the best signals on slightly above daily time frame. I personally like 2 or 3 day, but you have to find the settings suitable for your trading style.
What Is the McClellan Oscillator?
The McClellan Oscillator is a market breadth indicator that is based on the difference between the number of advancing and declining issues on a stock exchange, such as the New York Stock Exchange (NYSE) or NASDAQ.
The indicator is used to show strong shifts in sentiment in the indexes, called breadth thrusts. It also helps in analyzing the strength of an index trend via divergence or confirmation.
The McClellan Oscillator formula can be applied to any stock exchange or group of stocks.
A reading above zero helps confirm a rise in the index, while readings below zero confirm a decline in the index.
When the index is rising but the oscillator is falling, that warns that the index could start declining too. When the index is falling and the oscillator is rising, that indicates the index could start rising soon. This is called divergence.
A significant change, such as moving 100 points or more, from a negative reading to a positive reading is called a breadth thrust. It may indicate a strong reversal from downtrend to uptrend is underway on the stock exchange.
How to Calculate the McClellan Oscillator
To get the calculation started, track Advances - Declines on a stock exchange for 19 and 39 days. Calculate a simple average for these, not exponential moving average (EMA).
Use these simple values as the Prior Day EMA values in the 19- and 39-day EMA formulas.
Calculate the 19- and 39-day EMAs.
Calculate the McClellan Oscillator value.
Now that the value has been calculated, on the next calculation use this value for the Prior Day EMA. Start calculating EMAs for the formula instead of simple averages.
If using the adjusted formula, the steps are the same, except use ANA instead of using Advances - Declines.
What Does the McClellan Oscillator Tell You?
The McClellan Oscillator is an indicator based on market breadth which technical analysts can use in conjunction with other technical tools to determine the overall state of the stock market and assess the strength of its current trend.
Since the indicator is based on all the stocks in an exchange, it is compared to the price movements of indexes that reflect that exchange, or compared to major indexes such as the S&P 500.
Positive and negative values indicate whether more stocks, on average, are advancing or declining. The indicator is positive when the 19-day EMA is above the 39-day EMA, and negative when the 19-day EMA is below the 39-day EMA.
A positive and rising indicator suggests that stocks on the exchange are being accumulated. A negative and falling indicator signals that stocks are being sold. Typically such action confirms the current trend in the index.
Crossovers from positive to negative, or vice versa, may signal the trend has changed in the index or exchange being tracked. When the indicator makes a large move, typically of 100 points or more, from negative to positive territory, that is called a breadth thrust.
It means a large number of stocks moved up after a bearish move. Since the stock market tends to rise over time, this a positive signal and may indicate that a bottom in the index is in and prices are heading higher overall.
When index prices and the indicator are moving in different directions, then the current index trend may lack strength. Bullish divergence occurs when the oscillator is rising while the index is falling. This indicates the index could head higher soon since more stocks are starting to advance.
Bearish divergence is when the index is rising and the indicator is falling. This means fewer stocks are keeping the advance going and prices may start to head lower.
Limitations of Using the McClellan Oscillator
The indicator tends to produce lots of signals. Breadth thrusts, divergence, and crossovers all occur with some frequency, but not all these signals will result in the price/index moving in the expected direction.
The indicator is prone to producing false signals and therefore should be used in conjunction with price action analysis and other technical indicators.
The indicator can also be quite choppy, moving between positive and negative territory rapidly. Such action indicates a choppy market, but this isn't evident until the indicator has made this whipsaw move a few times.
Good luck and a big thanks to Fadior!

Session Highlighter with Kill Zones [Exponential-X]Session Highlighter with Kill Zones
Overview
This indicator provides comprehensive visualization of major forex trading sessions (Asian, London, and New York) with integrated kill zone detection and real-time session analytics. It helps traders identify optimal trading times by highlighting high-volatility periods and tracking session-specific price ranges.
What Makes This Original
While session indicators are common, this script uniquely combines several features that work together:
Kill Zone Integration: Highlights specific high-volatility windows within sessions (London: 02:00-05:00 EST, NY: 08:30-11:00 EST) when institutional activity typically peaks
Session Overlap Detection: Automatically detects and highlights when major sessions overlap (London-NY, Asian-London) with distinct visual cues
Real-Time Range Tracking: Calculates and displays percentage-based session ranges as they develop, not just historical data
Dynamic Statistics Dashboard: Live table showing current active session, session times, and comparative range percentages
Customizable Visual System: Flexible styling options including background shading, box overlays, and configurable line styles for session boundaries
How It Works
Session Detection Logic
The script uses timezone-normalized session detection based on EST/EDT times. It converts the current bar's timestamp to New York time and determines which session(s) are active using minute-based calculations. This approach ensures accurate session detection regardless of your chart's timezone settings.
Kill Zones
Kill zones represent periods within sessions when institutional traders are most active. The London kill zone (02:00-05:00 EST) captures pre-London open volatility, while the NY kill zone (08:30-11:00 EST) aligns with US economic data releases and market open activity.
Range Calculations
Session highs, lows, and opens are tracked from the first bar of each session and updated in real-time. Range percentages are calculated as: ((High - Low) / Low) × 100 , providing a volatility measure that's comparable across different instruments and price levels.
Visual System
Background shading: Color-coded zones for each session
Session boxes: Outline entire session ranges
H/L lines: Dynamic lines showing current session extremes
Open lines: Reference levels from session start
Overlap highlighting: Distinct colors when multiple sessions are active simultaneously
How to Use
Intraday Trading: Use kill zones to time entries during high-liquidity periods
Session Breakouts: Monitor for price breaks above/below session highs/lows
Range Trading: Trade between session boundaries during consolidation
Session Continuity: Observe how price behaves as sessions transition
Volatility Assessment: Compare current session ranges to typical values
Recommended Timeframes: Works on any timeframe, but most useful on 1m to 1H charts for intraday trading.
Settings Explained
Sessions Group
Toggle each major session on/off independently
Customize colors for visual clarity
Enable/disable overlap highlighting
Levels Group
Show/hide session high/low lines
Show/hide session open levels
Choose line styles (Solid/Dashed/Dotted)
Kill Zones Group
Toggle kill zone highlighting
Select which kill zones to display
Customize kill zone color intensity
Display Group
Show/hide statistics table
Show/hide session labels on chart
Important Notes
All times are displayed in EST/EDT
Session ranges reset at the start of each new session
Kill zones are session sub-periods, not separate sessions
Overlap colors override individual session colors when multiple sessions are active
The statistics table updates in real-time and shows percentage-based ranges for cross-instrument comparison
Session Times Reference
Asian Session: 19:00 - 04:00 EST (Tokyo open through early Sydney close)
London Session: 03:00 - 12:00 EST (Full European trading hours)
New York Session: 08:00 - 17:00 EST (US market hours)
London Kill Zone: 02:00 - 05:00 EST (Pre-London volatility spike)
NY Kill Zone: 08:30 - 11:00 EST (US open and news releases)
Alerts Available
The script includes six pre-configured alert conditions:
London Kill Zone start
NY Kill Zone start
London-NY Overlap start
Asian Session open
London Session open
NY Session open
Create alerts through TradingView's alert system to get notified when specific sessions or kill zones begin.
Disclaimer: This indicator is for informational purposes only. Session times and kill zones are based on typical market patterns but do not guarantee specific trading outcomes. Always use proper risk management.

FVG Maxing - Fair Value Gaps, Equilibrium, and Candle Patterns
What this script does
This open-source indicator highlights 3-candle fair value gaps (FVGs) on the active chart timeframe, draws their midpoint ("equilibrium") line, tracks when each gap is mitigated, and optionally marks simple candle patterns (engulfing and doji) for confluence. It is intended as an educational tool to study how price interacts with imbalances.
3-candle bullish and bearish FVG zones drawn as forward-extending boxes.
Equilibrium line at 50% of each gap.
Different styling for mitigated vs unmitigated gaps.
Compact statistics panel showing how many gaps are currently active and filled.
Optional overlays for bullish/bearish engulfing patterns and doji candles.
1. FVG logic (3-candle gaps)
The script focuses on a strict 3-candle definition of a fair value gap:
Three consecutive candles with the same body direction.
The wick of candle 3 is separated from the wick of candle 1 (no overlap).
A bullish gap is created when price moves up fast enough to leave a gap between candle 1 and 3. A bearish gap is the mirror case to the downside.
In Pine, the core detection looks like this:
// Three candles with the same body direction
bull_seq = close > open and close > open and close > open
bear_seq = close < open and close < open and close < open
// Wick gap between candle 1 and candle 3
bull_gap = bull_seq and low > high
bear_gap = bear_seq and high < low
// Final FVG flags
is_bull_fvg = bull_gap
is_bear_fvg = bear_gap
For each detected FVG:
Bullish FVG range: from high up to low (gap below current price).
Bearish FVG range: from low down to high (gap above current price).
Each zone is stored in a custom FVGData structure so it can be updated when price later trades back inside it.
2. Equilibrium line (0.5 of the gap)
Every FVG box gets an optional equilibrium line plotted at the midpoint between its top and bottom:
eq_level = (top + bottom) / 2.0
right_index = extend_boxes ? bar_index + extend_length_bars : bar_index
bx = box.new(bar_index - 2, top, right_index, bottom)
eq_ln = line.new(bar_index - 2, eq_level, right_index, eq_level)
line.set_style(eq_ln, line.style_dashed)
line.set_color(eq_ln, eq_color)
You can use this line as a neutral “fair value” reference inside the zone, or as a simple way to think in terms of premium/discount within each gap.
3. Mitigation rules and styling
Each FVG stays active until price trades back into the gap:
Bullish FVG is considered mitigated when the low touches or moves below the top of the gap.
Bearish FVG is considered mitigated when the high touches or moves above the bottom of the gap.
When that happens, the script:
Marks the internal FVGData entry as mitigated.
Softens the box fill and border colors.
Optionally updates the label text from "BULL EQ / BEAR EQ" to "BULL FILLED / BEAR FILLED".
Can hide mitigated zones almost completely if you only want to see unfilled imbalances.
This allows you to distinguish between current areas of interest and zones that have already been traded through.
4. Candle pattern overlays (engulfing and doji)
For additional confluence, the script can mark simple candle patterns on top of the FVG view:
Bullish engulfing — current candle body fully wraps the previous bearish body and is larger in size.
Bearish engulfing — current candle body fully wraps the previous bullish body and is larger in size.
Doji — candles where the real body is small relative to the full range (high–low).
The detection is based on basic body and range geometry:
curr_body = math.abs(close - open)
prev_body = math.abs(close - open )
curr_range = high - low
body_ratio = curr_range > 0 ? curr_body / curr_range : 1.0
bull_engulfing = close > open and close < open and open <= close and close >= open and curr_body > prev_body
bear_engulfing = close < open and close > open and open >= close and close <= open and curr_body > prev_body
is_doji = curr_range > 0 and body_ratio <= doji_body_ratio
On the chart, they appear as:
Small triangle markers below bullish engulfing candles.
Small triangle markers above bearish engulfing candles.
Small circles above doji candles.
All three overlays are optional and can be turned on or off and recolored in the CANDLE PATTERNS group of inputs.
5. Inputs overview
The script organizes settings into clear groups:
DISPLAY SETTINGS : Show bullish/bearish FVGs, show/hide mitigated zones, box extension length, box border width, and maximum number of boxes.
EQUILIBRIUM : Toggle equilibrium lines, color, and line width.
LABELS : Enable labels, choose whether to label unmitigated and/or mitigated zones, and select label size.
BULLISH COLORS / BEARISH COLORS : Separate fill and border colors for bullish and bearish gaps.
MITIGATED STYLE : Opacity used when a gap is marked as mitigated.
STATISTICS : Toggle the on-chart FVG statistics panel.
CANDLE PATTERNS : Show engulfing patterns, show dojis, colors, and the body-to-range threshold that defines a doji.
6. Statistics panel
An optional table in the corner of the chart summarizes the current state of all tracked gaps:
Total number of FVGs still being tracked.
Number of bullish vs bearish FVGs.
Number of unfilled vs mitigated FVGs.
Simple fill rate: percentage of tracked FVGs that have been marked as mitigated.
This can help you study how a particular market tends to treat gaps over time.
7. How you might use it (examples)
These are usage ideas only, not recommendations:
Study how often your symbol mitigates gaps and where inside the zone price tends to react.
Use higher-timeframe context and then refine entries near the equilibrium line on your trading timeframe.
Combine FVG zones with basic candle patterns (engulfing/doji) as an extra visual anchor, if that fits your process.
Hope you enjoy, give your feedback in the comments!
- officialjackofalltrades

Bar Index & TimeLibrary to convert a bar index to a timestamp and vice versa.
Utilizes runtime memory to store the 𝚝𝚒𝚖𝚎 and 𝚝𝚒𝚖𝚎_𝚌𝚕𝚘𝚜𝚎 values of every bar on the chart (and optional future bars), with the ability of storing additional custom values for every chart bar.
█ PREFACE
This library aims to tackle some problems that pine coders (from beginners to advanced) often come across, such as:
I'm trying to draw an object with a 𝚋𝚊𝚛_𝚒𝚗𝚍𝚎𝚡 that is more than 10,000 bars into the past, but this causes my script to fail. How can I convert the 𝚋𝚊𝚛_𝚒𝚗𝚍𝚎𝚡 to a UNIX time so that I can draw visuals using xloc.bar_time ?
I have a diagonal line drawing and I want to get the "y" value at a specific time, but line.get_price() only accepts a bar index value. How can I convert the timestamp into a bar index value so that I can still use this function?
I want to get a previous 𝚘𝚙𝚎𝚗 value that occurred at a specific timestamp. How can I convert the timestamp into a historical offset so that I can use 𝚘𝚙𝚎𝚗 ?
I want to reference a very old value for a variable. How can I access a previous value that is older than the maximum historical buffer size of 𝚟𝚊𝚛𝚒𝚊𝚋𝚕𝚎 ?
This library can solve the above problems (and many more) with the addition of a few lines of code, rather than requiring the coder to refactor their script to accommodate the limitations.
█ OVERVIEW
The core functionality provided is conversion between xloc.bar_index and xloc.bar_time values.
The main component of the library is the 𝙲𝚑𝚊𝚛𝚝𝙳𝚊𝚝𝚊 object, created via the 𝚌𝚘𝚕𝚕𝚎𝚌𝚝𝙲𝚑𝚊𝚛𝚝𝙳𝚊𝚝𝚊() function which basically stores the 𝚝𝚒𝚖𝚎 and 𝚝𝚒𝚖𝚎_𝚌𝚕𝚘𝚜𝚎 of every bar on the chart, and there are 3 more overloads to this function that allow collecting and storing additional data. Once a 𝙲𝚑𝚊𝚛𝚝𝙳𝚊𝚝𝚊 object is created, use any of the exported methods:
Methods to convert a UNIX timestamp into a bar index or bar offset:
𝚝𝚒𝚖𝚎𝚜𝚝𝚊𝚖𝚙𝚃𝚘𝙱𝚊𝚛𝙸𝚗𝚍𝚎𝚡(), 𝚐𝚎𝚝𝙽𝚞𝚖𝚋𝚎𝚛𝙾𝚏𝙱𝚊𝚛𝚜𝙱𝚊𝚌𝚔()
Methods to retrieve the stored data for a bar index:
𝚝𝚒𝚖𝚎𝙰𝚝𝙱𝚊𝚛𝙸𝚗𝚍𝚎𝚡(), 𝚝𝚒𝚖𝚎𝙲𝚕𝚘𝚜𝚎𝙰𝚝𝙱𝚊𝚛𝙸𝚗𝚍𝚎𝚡(), 𝚟𝚊𝚕𝚞𝚎𝙰𝚝𝙱𝚊𝚛𝙸𝚗𝚍𝚎𝚡(), 𝚐𝚎𝚝𝙰𝚕𝚕𝚅𝚊𝚛𝚒𝚊𝚋𝚕𝚎𝚜𝙰𝚝𝙱𝚊𝚛𝙸𝚗𝚍𝚎𝚡()
Methods to retrieve the stored data at a number of bars back (i.e., historical offset):
𝚝𝚒𝚖𝚎(), 𝚝𝚒𝚖𝚎𝙲𝚕𝚘𝚜𝚎(), 𝚟𝚊𝚕𝚞𝚎()
Methods to retrieve all the data points from the earliest bar (or latest bar) stored in memory, which can be useful for debugging purposes:
𝚐𝚎𝚝𝙴𝚊𝚛𝚕𝚒𝚎𝚜𝚝𝚂𝚝𝚘𝚛𝚎𝚍𝙳𝚊𝚝𝚊(), 𝚐𝚎𝚝𝙻𝚊𝚝𝚎𝚜𝚝𝚂𝚝𝚘𝚛𝚎𝚍𝙳𝚊𝚝𝚊()
Note: the library's strong suit is referencing data from very old bars in the past, which is especially useful for scripts that perform its necessary calculations only on the last bar.
█ USAGE
Step 1
Import the library. Replace with the latest available version number for this library.
//@version=6
indicator("Usage")
import n00btraders/ChartData/
Step 2
Create a 𝙲𝚑𝚊𝚛𝚝𝙳𝚊𝚝𝚊 object to collect data on every bar. Do not declare as `var` or `varip`.
chartData = ChartData.collectChartData() // call on every bar to accumulate the necessary data
Step 3
Call any method(s) on the 𝙲𝚑𝚊𝚛𝚝𝙳𝚊𝚝𝚊 object. Do not modify its fields directly.
if barstate.islast
int firstBarTime = chartData.timeAtBarIndex(0)
int lastBarTime = chartData.time(0)
log.info("First `time`: " + str.format_time(firstBarTime) + ", Last `time`: " + str.format_time(lastBarTime))
█ EXAMPLES
• Collect Future Times
The overloaded 𝚌𝚘𝚕𝚕𝚎𝚌𝚝𝙲𝚑𝚊𝚛𝚝𝙳𝚊𝚝𝚊() functions that accept a 𝚋𝚊𝚛𝚜𝙵𝚘𝚛𝚠𝚊𝚛𝚍 argument can additionally store time values for up to 500 bars into the future.
//@version=6
indicator("Example `collectChartData(barsForward)`")
import n00btraders/ChartData/1
chartData = ChartData.collectChartData(barsForward = 500)
var rectangle = box.new(na, na, na, na, xloc = xloc.bar_time, force_overlay = true)
if barstate.islast
int futureTime = chartData.timeAtBarIndex(bar_index + 100)
int lastBarTime = time
box.set_lefttop(rectangle, lastBarTime, open)
box.set_rightbottom(rectangle, futureTime, close)
box.set_text(rectangle, "Extending box 100 bars to the right. Time: " + str.format_time(futureTime))
• Collect Custom Data
The overloaded 𝚌𝚘𝚕𝚕𝚎𝚌𝚝𝙲𝚑𝚊𝚛𝚝𝙳𝚊𝚝𝚊() functions that accept a 𝚟𝚊𝚛𝚒𝚊𝚋𝚕𝚎𝚜 argument can additionally store custom user-specified values for every bar on the chart.
//@version=6
indicator("Example `collectChartData(variables)`")
import n00btraders/ChartData/1
var map variables = map.new()
variables.put("open", open)
variables.put("close", close)
variables.put("open-close midpoint", (open + close) / 2)
variables.put("boolean", open > close ? 1 : 0)
chartData = ChartData.collectChartData(variables = variables)
var fgColor = chart.fg_color
var table1 = table.new(position.top_right, 2, 9, color(na), fgColor, 1, fgColor, 1, true)
var table2 = table.new(position.bottom_right, 2, 9, color(na), fgColor, 1, fgColor, 1, true)
if barstate.isfirst
table.cell(table1, 0, 0, "ChartData.value()", text_color = fgColor)
table.cell(table2, 0, 0, "open ", text_color = fgColor)
table.merge_cells(table1, 0, 0, 1, 0)
table.merge_cells(table2, 0, 0, 1, 0)
for i = 1 to 8
table.cell(table1, 0, i, text_color = fgColor, text_halign = text.align_left, text_font_family = font.family_monospace)
table.cell(table2, 0, i, text_color = fgColor, text_halign = text.align_left, text_font_family = font.family_monospace)
table.cell(table1, 1, i, text_color = fgColor)
table.cell(table2, 1, i, text_color = fgColor)
if barstate.islast
for i = 1 to 8
float open1 = chartData.value("open", 5000 * i)
float open2 = i < 3 ? open : -1
table.cell_set_text(table1, 0, i, "chartData.value(\"open\", " + str.tostring(5000 * i) + "): ")
table.cell_set_text(table2, 0, i, "open : ")
table.cell_set_text(table1, 1, i, str.tostring(open1))
table.cell_set_text(table2, 1, i, open2 >= 0 ? str.tostring(open2) : "Error")
• xloc.bar_index → xloc.bar_time
The 𝚝𝚒𝚖𝚎 value (or 𝚝𝚒𝚖𝚎_𝚌𝚕𝚘𝚜𝚎 value) can be retrieved for any bar index that is stored in memory by the 𝙲𝚑𝚊𝚛𝚝𝙳𝚊𝚝𝚊 object.
//@version=6
indicator("Example `timeAtBarIndex()`")
import n00btraders/ChartData/1
chartData = ChartData.collectChartData()
if barstate.islast
int start = bar_index - 15000
int end = bar_index - 100
// line.new(start, close, end, close) // !ERROR - `start` value is too far from current bar index
start := chartData.timeAtBarIndex(start)
end := chartData.timeAtBarIndex(end)
line.new(start, close, end, close, xloc.bar_time, width = 10)
• xloc.bar_time → xloc.bar_index
Use 𝚝𝚒𝚖𝚎𝚜𝚝𝚊𝚖𝚙𝚃𝚘𝙱𝚊𝚛𝙸𝚗𝚍𝚎𝚡() to find the bar that a timestamp belongs to.
If the timestamp falls in between the close of one bar and the open of the next bar,
the 𝚜𝚗𝚊𝚙 parameter can be used to determine which bar to choose:
𝚂𝚗𝚊𝚙.𝙻𝙴𝙵𝚃 - prefer to choose the leftmost bar (typically used for closing times)
𝚂𝚗𝚊𝚙.𝚁𝙸𝙶𝙷𝚃 - prefer to choose the rightmost bar (typically used for opening times)
𝚂𝚗𝚊𝚙.𝙳𝙴𝙵𝙰𝚄𝙻𝚃 (or 𝚗𝚊) - copies the same behavior as xloc.bar_time uses for drawing objects
//@version=6
indicator("Example `timestampToBarIndex()`")
import n00btraders/ChartData/1
startTimeInput = input.time(timestamp("01 Aug 2025 08:30 -0500"), "Session Start Time")
endTimeInput = input.time(timestamp("01 Aug 2025 15:15 -0500"), "Session End Time")
chartData = ChartData.collectChartData()
if barstate.islastconfirmedhistory
int startBarIndex = chartData.timestampToBarIndex(startTimeInput, ChartData.Snap.RIGHT)
int endBarIndex = chartData.timestampToBarIndex(endTimeInput, ChartData.Snap.LEFT)
line1 = line.new(startBarIndex, 0, startBarIndex, 1, extend = extend.both, color = color.new(color.green, 60), force_overlay = true)
line2 = line.new(endBarIndex, 0, endBarIndex, 1, extend = extend.both, color = color.new(color.green, 60), force_overlay = true)
linefill.new(line1, line2, color.new(color.green, 90))
// using Snap.DEFAULT to show that it is equivalent to drawing lines using `xloc.bar_time` (i.e., it aligns to the same bars)
startBarIndex := chartData.timestampToBarIndex(startTimeInput)
endBarIndex := chartData.timestampToBarIndex(endTimeInput)
line.new(startBarIndex, 0, startBarIndex, 1, extend = extend.both, color = color.yellow, width = 3)
line.new(endBarIndex, 0, endBarIndex, 1, extend = extend.both, color = color.yellow, width = 3)
line.new(startTimeInput, 0, startTimeInput, 1, xloc.bar_time, extend.both, color.new(color.blue, 85), width = 11)
line.new(endTimeInput, 0, endTimeInput, 1, xloc.bar_time, extend.both, color.new(color.blue, 85), width = 11)
• Get Price of Line at Timestamp
The pine script built-in function line.get_price() requires working with bar index values. To get the price of a line in terms of a timestamp, convert the timestamp into a bar index or offset.
//@version=6
indicator("Example `line.get_price()` at timestamp")
import n00btraders/ChartData/1
lineStartInput = input.time(timestamp("01 Aug 2025 08:30 -0500"), "Line Start")
chartData = ChartData.collectChartData()
var diagonal = line.new(na, na, na, na, force_overlay = true)
if time <= lineStartInput
line.set_xy1(diagonal, bar_index, open)
if barstate.islastconfirmedhistory
line.set_xy2(diagonal, bar_index, close)
if barstate.islast
int timeOneWeekAgo = timenow - (7 * timeframe.in_seconds("1D") * 1000)
// Note: could also use `timetampToBarIndex(timeOneWeekAgo, Snap.DEFAULT)` and pass the value directly to `line.get_price()`
int barsOneWeekAgo = chartData.getNumberOfBarsBack(timeOneWeekAgo)
float price = line.get_price(diagonal, bar_index - barsOneWeekAgo)
string formatString = "Time 1 week ago: {0,number,#}\n - Equivalent to {1} bars ago\n\n𝚕𝚒𝚗𝚎.𝚐𝚎𝚝_𝚙𝚛𝚒𝚌𝚎(): {2,number,#.##}"
string labelText = str.format(formatString, timeOneWeekAgo, barsOneWeekAgo, price)
label.new(timeOneWeekAgo, price, labelText, xloc.bar_time, style = label.style_label_lower_right, size = 16, textalign = text.align_left, force_overlay = true)
█ RUNTIME ERROR MESSAGES
This library's functions will generate a custom runtime error message in the following cases:
𝚌𝚘𝚕𝚕𝚎𝚌𝚝𝙲𝚑𝚊𝚛𝚝𝙳𝚊𝚝𝚊() is not called consecutively, or is called more than once on a single bar
Invalid 𝚋𝚊𝚛𝚜𝙵𝚘𝚛𝚠𝚊𝚛𝚍 argument in the 𝚌𝚘𝚕𝚕𝚎𝚌𝚝𝙲𝚑𝚊𝚛𝚝𝙳𝚊𝚝𝚊() function
Invalid 𝚟𝚊𝚛𝚒𝚊𝚋𝚕𝚎𝚜 argument in the 𝚌𝚘𝚕𝚕𝚎𝚌𝚝𝙲𝚑𝚊𝚛𝚝𝙳𝚊𝚝𝚊() function
Invalid 𝚕𝚎𝚗𝚐𝚝𝚑 argument in any of the functions that accept a number of bars back
Note: there is no runtime error generated for an invalid 𝚝𝚒𝚖𝚎𝚜𝚝𝚊𝚖𝚙 or 𝚋𝚊𝚛𝙸𝚗𝚍𝚎𝚡 argument in any of the functions. Instead, the functions will assign 𝚗𝚊 to the returned values.
Any other runtime errors are due to incorrect usage of the library.
█ NOTES
• Function Descriptions
The library source code uses Markdown for the exported functions. Hover over a function/method call in the Pine Editor to display formatted, detailed information about the function/method.
//@version=6
indicator("Demo Function Tooltip")
import n00btraders/ChartData/1
chartData = ChartData.collectChartData()
int barIndex = chartData.timestampToBarIndex(timenow)
log.info(str.tostring(barIndex))
• Historical vs. Realtime Behavior
Under the hood, the data collector for this library is declared as `var`. Because of this, the 𝙲𝚑𝚊𝚛𝚝𝙳𝚊𝚝𝚊 object will always reflect the latest available data on realtime updates. Any data that is recorded for historical bars will remain unchanged throughout the execution of a script.
//@version=6
indicator("Demo Realtime Behavior")
import n00btraders/ChartData/1
var map variables = map.new()
variables.put("open", open)
variables.put("close", close)
chartData = ChartData.collectChartData(variables)
if barstate.isrealtime
varip float initialOpen = open
varip float initialClose = close
varip int updateCount = 0
updateCount += 1
float latestOpen = open
float latestClose = close
float recordedOpen = chartData.valueAtBarIndex("open", bar_index)
float recordedClose = chartData.valueAtBarIndex("close", bar_index)
string formatString = "# of updates: {0}\n\n𝚘𝚙𝚎𝚗 at update #1: {1,number,#.##}\n𝚌𝚕𝚘𝚜𝚎 at update #1: {2,number,#.##}\n\n"
+ "𝚘𝚙𝚎𝚗 at update #{0}: {3,number,#.##}\n𝚌𝚕𝚘𝚜𝚎 at update #{0}: {4,number,#.##}\n\n"
+ "𝚘𝚙𝚎𝚗 stored in memory: {5,number,#.##}\n𝚌𝚕𝚘𝚜𝚎 stored in memory: {6,number,#.##}"
string labelText = str.format(formatString, updateCount, initialOpen, initialClose, latestOpen, latestClose, recordedOpen, recordedClose)
label.new(bar_index, close, labelText, style = label.style_label_left, force_overlay = true)
• Collecting Chart Data for Other Contexts
If your use case requires collecting chart data from another context, avoid directly retrieving the 𝙲𝚑𝚊𝚛𝚝𝙳𝚊𝚝𝚊 object as this may exceed memory limits .
//@version=6
indicator("Demo Return Calculated Results")
import n00btraders/ChartData/1
timeInput = input.time(timestamp("01 Sep 2025 08:30 -0500"), "Time")
var int oneMinuteBarsAgo = na
// !ERROR - Memory Limits Exceeded
// chartDataArray = request.security_lower_tf(syminfo.tickerid, "1", ChartData.collectChartData())
// oneMinuteBarsAgo := chartDataArray.last().getNumberOfBarsBack(timeInput)
// function that returns calculated results (a single integer value instead of an entire `ChartData` object)
getNumberOfBarsBack() =>
chartData = ChartData.collectChartData()
chartData.getNumberOfBarsBack(timeInput)
calculatedResultsArray = request.security_lower_tf(syminfo.tickerid, "1", getNumberOfBarsBack())
oneMinuteBarsAgo := calculatedResultsArray.size() > 0 ? calculatedResultsArray.last() : na
if barstate.islast
string labelText = str.format("The selected timestamp occurs 1-minute bars ago", oneMinuteBarsAgo)
label.new(bar_index, hl2, labelText, style = label.style_label_left, size = 16, force_overlay = true)
• Memory Usage
The library's convenience and ease of use comes at the cost of increased usage of computational resources. For simple scripts, using this library will likely not cause any issues with exceeding memory limits. But for large and complex scripts, you can reduce memory issues by specifying a lower 𝚌𝚊𝚕𝚌_𝚋𝚊𝚛𝚜_𝚌𝚘𝚞𝚗𝚝 amount in the indicator() or strategy() declaration statement.
//@version=6
// !ERROR - Memory Limits Exceeded using the default number of bars available (~20,000 bars for Premium plans)
//indicator("Demo `calc_bars_count` parameter")
// Reduce number of bars using `calc_bars_count` parameter
indicator("Demo `calc_bars_count` parameter", calc_bars_count = 15000)
import n00btraders/ChartData/1
map variables = map.new()
variables.put("open", open)
variables.put("close", close)
variables.put("weekofyear", weekofyear)
variables.put("dayofmonth", dayofmonth)
variables.put("hour", hour)
variables.put("minute", minute)
variables.put("second", second)
// simulate large memory usage
chartData0 = ChartData.collectChartData(variables)
chartData1 = ChartData.collectChartData(variables)
chartData2 = ChartData.collectChartData(variables)
chartData3 = ChartData.collectChartData(variables)
chartData4 = ChartData.collectChartData(variables)
chartData5 = ChartData.collectChartData(variables)
chartData6 = ChartData.collectChartData(variables)
chartData7 = ChartData.collectChartData(variables)
chartData8 = ChartData.collectChartData(variables)
chartData9 = ChartData.collectChartData(variables)
log.info(str.tostring(chartData0.time(0)))
log.info(str.tostring(chartData1.time(0)))
log.info(str.tostring(chartData2.time(0)))
log.info(str.tostring(chartData3.time(0)))
log.info(str.tostring(chartData4.time(0)))
log.info(str.tostring(chartData5.time(0)))
log.info(str.tostring(chartData6.time(0)))
log.info(str.tostring(chartData7.time(0)))
log.info(str.tostring(chartData8.time(0)))
log.info(str.tostring(chartData9.time(0)))
if barstate.islast
result = table.new(position.middle_right, 1, 1, force_overlay = true)
table.cell(result, 0, 0, "Script Execution Successful ✅", text_size = 40)
█ EXPORTED ENUMS
Snap
Behavior for determining the bar that a timestamp belongs to.
Fields:
LEFT : Snap to the leftmost bar.
RIGHT : Snap to the rightmost bar.
DEFAULT : Default `xloc.bar_time` behavior.
Note: this enum is used for the 𝚜𝚗𝚊𝚙 parameter of 𝚝𝚒𝚖𝚎𝚜𝚝𝚊𝚖𝚙𝚃𝚘𝙱𝚊𝚛𝙸𝚗𝚍𝚎𝚡().
█ EXPORTED TYPES
Note: users of the library do not need to worry about directly accessing the fields of these types; all computations are done through method calls on an object of the 𝙲𝚑𝚊𝚛𝚝𝙳𝚊𝚝𝚊 type.
Variable
Represents a user-specified variable that can be tracked on every chart bar.
Fields:
name (series string) : Unique identifier for the variable.
values (array) : The array of stored values (one value per chart bar).
ChartData
Represents data for all bars on a chart.
Fields:
bars (series int) : Current number of bars on the chart.
timeValues (array) : The `time` values of all chart (and future) bars.
timeCloseValues (array) : The `time_close` values of all chart (and future) bars.
variables (array) : Additional custom values to track on all chart bars.
█ EXPORTED FUNCTIONS
collectChartData()
Collects and tracks the `time` and `time_close` value of every bar on the chart.
Returns: `ChartData` object to convert between `xloc.bar_index` and `xloc.bar_time`.
collectChartData(barsForward)
Collects and tracks the `time` and `time_close` value of every bar on the chart as well as a specified number of future bars.
Parameters:
barsForward (simple int) : Number of future bars to collect data for.
Returns: `ChartData` object to convert between `xloc.bar_index` and `xloc.bar_time`.
collectChartData(variables)
Collects and tracks the `time` and `time_close` value of every bar on the chart. Additionally, tracks a custom set of variables for every chart bar.
Parameters:
variables (simple map) : Custom values to collect on every chart bar.
Returns: `ChartData` object to convert between `xloc.bar_index` and `xloc.bar_time`.
collectChartData(barsForward, variables)
Collects and tracks the `time` and `time_close` value of every bar on the chart as well as a specified number of future bars. Additionally, tracks a custom set of variables for every chart bar.
Parameters:
barsForward (simple int) : Number of future bars to collect data for.
variables (simple map) : Custom values to collect on every chart bar.
Returns: `ChartData` object to convert between `xloc.bar_index` and `xloc.bar_time`.
█ EXPORTED METHODS
method timestampToBarIndex(chartData, timestamp, snap)
Converts a UNIX timestamp to a bar index.
Namespace types: ChartData
Parameters:
chartData (series ChartData) : The `ChartData` object.
timestamp (series int) : A UNIX time.
snap (series Snap) : A `Snap` enum value.
Returns: A bar index, or `na` if unable to find the appropriate bar index.
method getNumberOfBarsBack(chartData, timestamp)
Converts a UNIX timestamp to a history-referencing length (i.e., number of bars back).
Namespace types: ChartData
Parameters:
chartData (series ChartData) : The `ChartData` object.
timestamp (series int) : A UNIX time.
Returns: A bar offset, or `na` if unable to find a valid number of bars back.
method timeAtBarIndex(chartData, barIndex)
Retrieves the `time` value for the specified bar index.
Namespace types: ChartData
Parameters:
chartData (series ChartData) : The `ChartData` object.
barIndex (int) : The bar index.
Returns: The `time` value, or `na` if there is no `time` stored for the bar index.
method time(chartData, length)
Retrieves the `time` value of the bar that is `length` bars back relative to the latest bar.
Namespace types: ChartData
Parameters:
chartData (series ChartData) : The `ChartData` object.
length (series int) : Number of bars back.
Returns: The `time` value `length` bars ago, or `na` if there is no `time` stored for that bar.
method timeCloseAtBarIndex(chartData, barIndex)
Retrieves the `time_close` value for the specified bar index.
Namespace types: ChartData
Parameters:
chartData (series ChartData) : The `ChartData` object.
barIndex (series int) : The bar index.
Returns: The `time_close` value, or `na` if there is no `time_close` stored for the bar index.
method timeClose(chartData, length)
Retrieves the `time_close` value of the bar that is `length` bars back from the latest bar.
Namespace types: ChartData
Parameters:
chartData (series ChartData) : The `ChartData` object.
length (series int) : Number of bars back.
Returns: The `time_close` value `length` bars ago, or `na` if there is none stored.
method valueAtBarIndex(chartData, name, barIndex)
Retrieves the value of a custom variable for the specified bar index.
Namespace types: ChartData
Parameters:
chartData (series ChartData) : The `ChartData` object.
name (series string) : The variable name.
barIndex (series int) : The bar index.
Returns: The value of the variable, or `na` if that variable is not stored for the bar index.
method value(chartData, name, length)
Retrieves a variable value of the bar that is `length` bars back relative to the latest bar.
Namespace types: ChartData
Parameters:
chartData (series ChartData) : The `ChartData` object.
name (series string) : The variable name.
length (series int) : Number of bars back.
Returns: The value `length` bars ago, or `na` if that variable is not stored for the bar index.
method getAllVariablesAtBarIndex(chartData, barIndex)
Retrieves all custom variables for the specified bar index.
Namespace types: ChartData
Parameters:
chartData (series ChartData) : The `ChartData` object.
barIndex (series int) : The bar index.
Returns: Map of all custom variables that are stored for the specified bar index.
method getEarliestStoredData(chartData)
Gets all values from the earliest bar data that is currently stored in memory.
Namespace types: ChartData
Parameters:
chartData (series ChartData) : The `ChartData` object.
Returns: A tuple:
method getLatestStoredData(chartData, futureData)
Gets all values from the latest bar data that is currently stored in memory.
Namespace types: ChartData
Parameters:
chartData (series ChartData) : The `ChartData` object.
futureData (series bool) : Whether to include the future data that is stored in memory.
Returns: A tuple:

Dynamic Swing Anchored VWAP (Zeiierman)█ Overview
Dynamic Swing Anchored VWAP (Zeiierman) is a price–volume tool that anchors VWAP at fresh swing highs/lows and then adapts its responsiveness as conditions change. Instead of one static VWAP that drifts away over time, this indicator re-anchors at meaningful structure points (swings). It computes a decayed, volume-weighted average that can speed up in volatile markets and slow down during quiet periods.
Blending swing structure with an adaptive VWAP engine creates a fair-value path that stays aligned with current price behavior, making retests, pullbacks, and mean reversion opportunities easier to spot and trade.
█ How It Works
⚪ Swing Anchor Engine
The script scans for swing highs/lows using your Swing Period.
When market direction flips (new pivot confirmed), the indicator anchors a new VWAP at that pivot and starts tracking from there.
⚪ Adaptive VWAP Core
From each anchor , VWAP is computed using a decay model (recent price×volume matters more; older data matters less).
Adaptive Price Tracking lets you set the base responsiveness in “bars.” Lower = more reactive, higher = smoother.
Volatility Adjustment (ATR vs Avg ATR) can automatically speed up the VWAP during spikes and slow it during compression, so the line stays relevant to live conditions.
█ Why This Adaptive Approach Beats a Simple VWAP
Standard VWAP is cumulative from the anchor point. As time passes and volume accumulates, it often drifts far from current price, especially in prolonged trends or multi-session moves. That drift makes retests rare and unreliable.
Dynamic Swing Anchored VWAP solves this in two ways:
⚪ Event-Driven Anchoring (Swings):
By restarting at fresh swing highs/lows, the VWAP reference reflects today’s structure. You get frequent, meaningful retests because the anchor stays near the action.
⚪ Adaptive Responsiveness (Volatility-Aware):
Markets don’t move at one speed. When volatility expands, a fixed VWAP lags; when volatility contracts, it can overreact to noise. Here, the “tracking speed” can auto-adjust using ATR vs its average.
High Volatility → faster tracking: VWAP hugs price more tightly, preserving retest relevance.
Low Volatility → smoother tracking: VWAP filters chop and stays stable.
Result: A VWAP that follows price more accurately, creating plenty of credible retest opportunities and more trustworthy mean-reversion/continuation reads than a simple, ever-growing VWAP.
█ How to Use
⚪ S wing-Aware Fair Value
Use the VWAP as a dynamic fair-value guide that restarts at key structural pivots. Pullbacks to the VWAP after impulsive moves often provide retest entries.
⚪ Trend Trading
In trends, the adaptive VWAP will ride closer to price, offering continuation pullbacks.
█ Settings
Swing Period: Number of bars to confirm swing highs/lows. Larger = bigger, cleaner pivots (slower); smaller = more frequent pivots (noisier).
Adaptive Price Tracking: Sets the base reaction speed (in bars). Lower = faster, tighter to price; higher = smoother, slower.
Adapt APT by ATR ratio: When ON, the tracking speed auto-adjusts with market volatility (ATR vs its own average). High vol → faster; low vol → calmer.
Volatility Bias: Controls how strongly volatility affects the speed. >1 = stronger effect; <1 = lighter touch.
-----------------
Disclaimer
The content provided in my scripts, indicators, ideas, algorithms, and systems is for educational and informational purposes only. It does not constitute financial advice, investment recommendations, or a solicitation to buy or sell any financial instruments. I will not accept liability for any loss or damage, including without limitation any loss of profit, which may arise directly or indirectly from the use of or reliance on such information.
All investments involve risk, and the past performance of a security, industry, sector, market, financial product, trading strategy, backtest, or individual's trading does not guarantee future results or returns. Investors are fully responsible for any investment decisions they make. Such decisions should be based solely on an evaluation of their financial circumstances, investment objectives, risk tolerance, and liquidity needs.

Ultimate Market Structure [Alpha Extract]Ultimate Market Structure
A comprehensive market structure analysis tool that combines advanced swing point detection, imbalance zone identification, and intelligent break analysis to identify high-probability trading opportunities.Utilizing a sophisticated trend scoring system, this indicator classifies market conditions and provides clear signals for structure breaks, directional changes, and fair value gap detection with institutional-grade precision.
🔶 Advanced Swing Point Detection
Identifies pivot highs and lows using configurable lookback periods with optional close-based analysis for cleaner signals. The system automatically labels swing points as Higher Highs (HH), Lower Highs (LH), Higher Lows (HL), and Lower Lows (LL) while providing advanced classifications including "rising_high", "falling_high", "rising_low", "falling_low", "peak_high", and "valley_low" for nuanced market analysis.
swingHighPrice = useClosesForStructure ? ta.pivothigh(close, swingLength, swingLength) : ta.pivothigh(high, swingLength, swingLength)
swingLowPrice = useClosesForStructure ? ta.pivotlow(close, swingLength, swingLength) : ta.pivotlow(low, swingLength, swingLength)
classification = classifyStructurePoint(structureHighPrice, upperStructure, true)
significance = calculateSignificance(structureHighPrice, upperStructure, true)
🔶 Significance Scoring System
Each structure point receives a significance level on a 1-5 scale based on its distance from previous points, helping prioritize the most important levels. This intelligent scoring system ensures traders focus on the most meaningful structure breaks while filtering out minor noise.
🔶 Comprehensive Trend Analysis
Calculates momentum, strength, direction, and confidence levels using volatility-normalized price changes and multi-timeframe correlation. The system provides real-time trend state tracking with bullish (+1), bearish (-1), or neutral (0) direction assessment and 0-100 confidence scoring.
// Calculate trend momentum using rate of change and volatility
calculateTrendMomentum(lookback) =>
priceChange = (close - close ) / close * 100
avgVolatility = ta.atr(lookback) / close * 100
momentum = priceChange / (avgVolatility + 0.0001)
momentum
// Calculate trend strength using multiple timeframe correlation
calculateTrendStrength(shortPeriod, longPeriod) =>
shortMA = ta.sma(close, shortPeriod)
longMA = ta.sma(close, longPeriod)
separation = math.abs(shortMA - longMA) / longMA * 100
strength = separation * slopeAlignment
❓How It Works
🔶 Imbalance Zone Detection
Identifies Fair Value Gaps (FVGs) between consecutive candles where price gaps create unfilled areas. These zones are displayed as semi-transparent boxes with optional center line mitigation tracking, highlighting potential support and resistance levels where institutional players often react.
// Detect Fair Value Gaps
detectPriceImbalance() =>
currentHigh = high
currentLow = low
refHigh = high
refLow = low
if currentOpen > currentClose
if currentHigh - refLow < 0
upperBound = currentClose - (currentClose - refLow)
lowerBound = currentClose - (currentClose - currentHigh)
centerPoint = (upperBound + lowerBound) / 2
newZone = ImbalanceZone.new(
zoneBox = box.new(bar_index, upperBound, rightEdge, lowerBound,
bgcolor=bullishImbalanceColor, border_color=hiddenColor)
)
🔶 Structure Break Analysis
Determines Break of Structure (BOS) for trend continuation and Directional Change (DC) for trend reversals with advanced classification as "continuation", "reversal", or "neutral". The system compares pre-trend and post-trend states for each break, providing comprehensive trend change momentum analysis.
🔶 Intelligent Zone Management
Features partial mitigation tracking when price enters but doesn't fully fill zones, with automatic zone boundary adjustment during partial fills. Smart array management keeps only recent structure points for optimal performance while preventing duplicate signals from the same level.
🔶 Liquidity Zone Detection
Automatically identifies potential liquidity zones at key structure points for institutional trading analysis. The system tracks broken structure points and provides adaptive zone extension with configurable time-based limits for imbalance areas.
🔶 Visual Structure Mapping
Provides clear visual indicators including swing labels with color-coded significance levels, dashed lines connecting break points with BOS/DC labels, and break signals for continuation and reversal patterns. The adaptive zones feature smart management with automatic mitigation tracking.
🔶 Market Structure Interpretation
HH/HL patterns indicate bullish market structure with trend continuation likelihood, while LH/LL patterns signal bearish structure with downtrend continuation expected. BOS signals represent structure breaks in trend direction for continuation opportunities, while DC signals warn of potential reversals.
🔶 Performance Optimization
Automatic cleanup of old structure points (keeps last 8 points), recent break tracking (keeps last 5 break events), and efficient array management ensure smooth performance across all timeframes and market conditions.
Why Choose Ultimate Market Structure ?
This indicator provides traders with institutional-grade market structure analysis, combining multiple analytical approaches into one comprehensive tool. By identifying key structure levels, imbalance zones, and break patterns with advanced significance scoring, it helps traders understand market dynamics and position themselves for high-probability trade setups in alignment with smart money concepts. The sophisticated trend scoring system and intelligent zone management make it an essential tool for any serious trader looking to decode market structure with precision and confidence.

Eigenvector Centrality Drift (ECD) - Market State Network What is Eigenvector Centrality Drift (ECD)?
Eigenvector Centrality Drift (ECD) is a groundbreaking indicator that applies concepts from network science to financial markets. Instead of viewing price as a simple series, ECD models the market as a dynamic network of “micro-states”—distinct combinations of price, volatility, and volume. By tracking how the influence of these states changes over time, ECD helps you spot regime shifts and transitions in market character before they become obvious in price.
This is not another moving average or momentum oscillator. ECD is inspired by eigenvector centrality—a measure of influence in network theory—and adapts it to the world of price action, volatility, and volume. It’s about understanding which market states are “in control” and when that control is about to change.
Theoretical Foundation
Network Science: In complex systems, nodes (states) and edges (transitions) form a network. Eigenvector centrality measures how influential a node is, not just by its direct connections, but by the influence of the nodes it connects to.
Market Micro-States: Each bar is classified into a “state” based on price change, volatility, and volume. The market transitions between these states, forming a network of possible regimes.
Centrality Drift: By tracking the centrality (influence) of the current state, and how it changes (drifts) over time, ECD highlights when the market’s “center of gravity” is shifting—often a precursor to major moves or regime changes.
How ECD Works
State Classification: Each bar is assigned to one of N market micro-states, based on a weighted combination of normalized price change, volatility, and volume.
Transition Matrix: Over a rolling window, ECD tracks how often the market transitions from each state to every other state, forming a transition probability matrix.
Centrality Calculation: Using a simplified eigenvector approach, ECD calculates the “influence” score for each state, reflecting how central it is to the network of recent market behavior.
Centrality Drift: The indicator tracks the Z-score of the change in centrality for the current state. Rapid increases or decreases, or a shift in the dominant state, signal a potential regime shift.
Dominant State: ECD also highlights which state currently has the highest influence, providing insight into the prevailing market character.
Inputs:
🌐 Market State Configuration
Number of Market States (n_states, default 6): Number of distinct micro-states to track.
3–4: Simple (Up/Down/Sideways)
5–6: Balanced (recommended)
7–9: Complex, more nuanced
Price Change Weight (price_weight, default 0.4):
How much price movement defines a state. Higher = more directional.
Volatility Weight (vol_weight, default 0.3):
How much volatility defines a state. Higher = more regime focus.
Volume Weight (volume_weight, default 0.3):
How much volume defines a state. Higher = more participation focus.
🔗 Network Analysis
Transition Matrix Window (transition_window, default 50): Lookback for building the state transition matrix.
Shorter: Adapts quickly
Longer: More stable
Influence Decay Factor (influence_decay, default 0.85): How much influence propagates through the network.
Higher: Distant transitions matter more
Lower: Only immediate transitions matter
Drift Detection Sensitivity (drift_sensitivity, default 1.5): Z-score threshold for significant centrality drift.
Lower: More signals
Higher: Only major shifts
🎨 Visualization
Show Network Visualization (show_network, default true): Background color and effects based on network structure.
Show Centrality Score (show_centrality, default true): Plots the current state’s centrality measure.
Show Drift Indicator (show_drift, default true): Plots the centrality drift Z-score.
Show State Map (show_state_map, default true): Dashboard showing all state centralities and which is dominant.
Color Scheme (color_scheme, default "Quantum"):
“Quantum”: Cyan/Magenta
“Neural”: Green/Blue
“Plasma”: Yellow/Pink
“Matrix”: Green/Black
Color Schemes
Dynamic gradients reflect the current state’s centrality and drift, using your chosen color palette.
Background network effect: The more central the current state, the more intense the background.
Centrality and drift lines: Color-coded for clarity and regime shift detection.
Visual Logic
Centrality Score Line: Plots the influence of the current state, with glow for emphasis.
Drift Indicator: Histogram of centrality drift Z-score, green for positive, red for negative.
Threshold Lines: Dotted lines mark the drift sensitivity threshold for regime shift alerts.
State Map Dashboard: Top-right panel shows all state centralities, highlights the current and dominant state, and visualizes influence with bars.
Information Panel: Bottom-left panel summarizes current state, centrality, dominant state, drift Z-score, and regime shift status.
How to Use ECD
Centrality Score: High = current state is highly influential; low = state is peripheral.
Drift Z-Score:
Large positive/negative = rapid change in influence, regime shift likely.
Near zero = stable network, no major shift.
Dominant State: The state with the highest centrality is “in control” of the market’s transitions.
State Map: Use to see which states are rising or falling in influence.
Tips:
Use fewer states for simple markets, more for nuanced analysis.
Watch for drift Z-score crossing the threshold—these are your regime shift signals.
Combine with your own system for confirmation.
Alerts:
ECD Regime Shift: Significant centrality drift detected—potential regime change.
ECD State Change: Market state transition occurred.
ECD Dominance Shift: Dominant market state has changed.
Originality & Usefulness
ECD is not a mashup or rehash of standard indicators. It is a novel application of network science and eigenvector centrality to market microstructure, providing a new lens for understanding regime shifts and market transitions. The state network, centrality drift, and dashboard are unique to this script. ECD is designed for anticipation, not confirmation—helping you see the market’s “center of gravity” shift before price action makes it obvious.
Chart Info
Script Name: Eigenvector Centrality Drift (ECD) – Market State Network
Recommended Use: Any asset, any timeframe. Tune parameters to your style.
Disclaimer
This script is for research and educational purposes only. It does not provide financial advice or direct buy/sell signals. Always use proper risk management and combine with your own strategy. Past performance is not indicative of future results.
See the market as a network. Anticipate the shift in influence.
— Dskyz , for DAFE Trading Systems
