Key Levels: Daily, Weekly, Monthly [BackQuant]Key Levels: Daily, Weekly, Monthly
Map the market’s “memory” in one glance—yesterday’s range, this week’s chosen day high/low, and D/W/M opens—then auto-clean levels once they break.
What it does
This tool plots three families of high-signal reference lines and keeps them tidy as price evolves:
Chosen Day High/Low (per week) — Pick a weekday (e.g., Monday). For each past week, the script records that day’s session high and low and projects them forward for a configurable number of bars. These act like “memory levels” that price often revisits.
Daily / Weekly / Monthly Opens — Plots the opening price of each new day, week, and month with separate styling. These opens frequently behave like magnets/flip lines intraday and anchors for regime on higher timeframes.
Auto-pruning — When price breaks a stored level, the script can automatically remove it to reduce clutter and refocus you on still-active lines. See: (broken levels removed).
Why these levels matter
Liquidity pockets — Prior day’s high/low and the daily open concentrate stops and pending orders. Mapping them quickly reveals likely sweep or fade zones. Example: previous day highs + daily open highlighting liquidity:
Context & regime — Monthly opens frame macro bias; trading above a rising cluster of monthly opens vs. below gives a clean top-down read. Example: monthly-only “macro outlook” view:
Cleaner charts — Auto-remove broken lines so you focus on what still matters right now.
What it plots (at a glance)
Past Chosen Day High/Low for up to N prior weeks (your choice), extended right.
Current Daily Open , Weekly Open , and Monthly Open , each with its own color, label, and forward extension.
Optional short labels (e.g., “Mon High”) or full labels (with week/month info).
How breaks are detected & cleaned
You control both the evidence and the timing of a “break”:
Break uses — Choose Close (more conservative) or Wick (more sensitive).
Inclusive? — If enabled, equality counts (≥ high or ≤ low). If disabled, you need a strict cross.
Allow intraday breaks? — If on, a level can break during the tracked day; if off, the script only counts breaks after the session completes.
Remove Broken Levels — When a break is confirmed, the line/label is deleted automatically. (See the demo: )
Quick start
Pick a Day of Week to Track (e.g., Monday).
Set how many weeks back to show (e.g., 8–10).
Choose how far to extend each family (bars to the right for chosen-day H/L and D/W/M opens).
Decide if a break uses Close or Wick , and whether equality counts.
Toggle Remove Broken Levels to keep the chart clean automatically.
Tips by use-case
Intraday bias — Watch the Daily Open as a magnet/flip. If price gaps above and holds, pullbacks to the daily open often decide direction. Pair with last day’s high/low for sweep→reversal or true breakout cues. See:
Weekly structure — Track the week’s chosen day (e.g., Monday) high/low across prior weeks. If price stalls near a cluster of old “Monday Highs,” look for sweep/reject patterns or continuation on reclaim.
Macro regime — Hide daily/weekly lines and keep only Monthly Opens to read bigger cycles at a glance (BTC/crypto especially). Example:
Customization
Use wicks or bodies for highs/lows (wicks capture extremes; bodies are stricter).
Line style & thickness — solid/dashed/dotted, width 1–5, plus global transparency.
Labels — Abbreviated (“Mon High”, “D Open”) or full (month/week/day info).
Color scheme — Separate colors for highs, lows, and each of D/W/M opens.
Capacity controls — Set how many daily/weekly/monthly opens and how many weeks of chosen-day H/L to keep visible.
What’s under the hood
On your selected weekday, the script records that session’s true high and true low (using wicks or body-based extremes—your choice), then projects a horizontal line forward for the next bars.
At each new day/week/month , it records the opening price and projects that line forward as well.
Each bar, the script checks your “break” rules; once broken, lines/labels are removed if auto-cleaning is on.
Everything updates in real time; past levels don’t repaint after the session finishes.
Recommended presets
Day trading — Weeks back: 6–10; extend D/W opens: 50–100 bars; Break uses: Close ; Inclusive: off; Auto-remove: on.
Swing — Fewer daily opens, more weekly opens (2–6), and 8–12 weeks of chosen-day H/L.
Macro — Show only Monthly Opens (1–6 months), dashed style, thicker lines for clarity.
Reading the examples
Broken lines disappear — decluttering in action:
Macro outlook — monthly opens as cycle rails:
Liquidity map — previous day highs + daily open:
Final note
These are not “signals”—they’re reference points that many participants watch. By standardising how you draw them and automatically clearing the ones that no longer matter, you turn a noisy chart into a focused map: where liquidity likely sits, where price memory lives, and which lines are still in play.
在腳本中搜尋"track"

POC Migration Velocity (POC-MV) [PhenLabs]📊POC Migration Velocity (POC-MV)
Version: PineScript™v6
📌Description
The POC Migration Velocity indicator revolutionizes market structure analysis by tracking the movement, speed, and acceleration of Point of Control (POC) levels in real-time. This tool combines sophisticated volume distribution estimation with velocity calculations to reveal hidden market dynamics that conventional indicators miss.
POC-MV provides traders with unprecedented insight into volume-based price movement patterns, enabling the early identification of continuation and exhaustion signals before they become apparent to the broader market. By measuring how quickly and consistently the POC migrates across price levels, traders gain early warning signals for significant market shifts and can position themselves advantageously.
The indicator employs advanced algorithms to estimate intra-bar volume distribution without requiring lower timeframe data, making it accessible across all chart timeframes while maintaining sophisticated analytical capabilities.
🚀Points of Innovation
Micro-POC calculation using advanced OHLC-based volume distribution estimation
Real-time velocity and acceleration tracking normalized by ATR for cross-market consistency
Persistence scoring system that quantifies directional consistency over multiple periods
Multi-signal detection combining continuation patterns, exhaustion signals, and gap alerts
Dynamic color-coded visualization system with intensity-based feedback
Comprehensive customization options for resolution, periods, and thresholds
🔧Core Components
POC Calculation Engine: Estimates volume distribution within each bar using configurable price bands and sophisticated weighting algorithms
Velocity Measurement System: Tracks the rate of POC movement over customizable lookback periods with ATR normalization
Acceleration Calculator: Measures the rate of change of velocity to identify momentum shifts in POC migration
Persistence Analyzer: Quantifies how consistently POC moves in the same direction using exponential weighting
Signal Detection Framework: Combines trend analysis, velocity thresholds, and persistence requirements for signal generation
Visual Rendering System: Provides dynamic color-coded lines and heat ribbons based on velocity and price-POC relationships
🔥Key Features
Real-time POC calculation with 10-100 configurable price bands for optimal precision
Velocity tracking with customizable lookback periods from 5 to 50 bars
Acceleration measurement for detecting momentum changes in POC movement
Persistence scoring to validate signal strength and filter false signals
Dynamic visual feedback with blue/orange color scheme indicating bullish/bearish conditions
Comprehensive alert system for continuation patterns, exhaustion signals, and POC gaps
Adjustable information table displaying real-time metrics and current signals
Heat ribbon visualization showing price-POC relationship intensity
Multiple threshold settings for customizing signal sensitivity
Export capability for use with separate panel indicators
🎨Visualization
POC Connecting Lines: Color-coded lines showing POC levels with intensity based on velocity magnitude
Heat Ribbon: Dynamic colored ribbon around price showing POC-price basis intensity
Signal Markers: Clear exhaustion top/bottom signals with labeled shapes
Information Table: Real-time display of POC value, velocity, acceleration, basis, persistence, and current signal status
Color Gradients: Blue gradients for bullish conditions, orange gradients for bearish conditions
📖Usage Guidelines
POC Calculation Settings
POC Resolution (Price Bands): Default 20, Range 10-100. Controls the number of price bands used to estimate volume distribution within each bar
Volume Weight Factor: Default 0.7, Range 0.1-1.0. Adjusts the influence of volume in POC calculation
POC Smoothing: Default 3, Range 1-10. EMA smoothing period applied to the calculated POC to reduce noise
Velocity Settings
Velocity Lookback Period: Default 14, Range 5-50. Number of bars used to calculate POC velocity
Acceleration Period: Default 7, Range 3-20. Period for calculating POC acceleration
Velocity Significance Threshold: Default 0.5, Range 0.1-2.0. Minimum normalized velocity for continuation signals
Persistence Settings
Persistence Lookback: Default 5, Range 3-20. Number of bars examined for persistence score calculation
Persistence Threshold: Default 0.7, Range 0.5-1.0. Minimum persistence score required for continuation signals
Visual Settings
Show POC Connecting Lines: Toggle display of colored lines connecting POC levels
Show Heat Ribbon: Toggle display of colored ribbon showing POC-price relationship
Ribbon Transparency: Default 70, Range 0-100. Controls transparency level of heat ribbon
Alert Settings
Enable Continuation Alerts: Toggle alerts for continuation pattern detection
Enable Exhaustion Alerts: Toggle alerts for exhaustion pattern detection
Enable POC Gap Alerts: Toggle alerts for significant POC gaps
Gap Threshold: Default 2.0 ATR, Range 0.5-5.0. Minimum gap size to trigger alerts
✅Best Use Cases
Identifying trend continuation opportunities when POC velocity aligns with price direction
Spotting potential reversal points through exhaustion pattern detection
Confirming breakout validity by monitoring POC gap behavior
Adding volume-based context to traditional technical analysis
Managing position sizing based on POC-price basis strength
⚠️Limitations
POC calculations are estimations based on OHLC data, not true tick-by-tick volume distribution
Effectiveness may vary in low-volume or highly volatile market conditions
Requires complementary analysis tools for complete trading decisions
Signal frequency may be lower in ranging markets compared to trending conditions
Performance optimization needed for very short timeframes below 1-minute
💡What Makes This Unique
Advanced Estimation Algorithm: Sophisticated method for calculating POC without requiring lower timeframe data
Velocity-Based Analysis: Focus on POC movement dynamics rather than static levels
Comprehensive Signal Framework: Integration of continuation, exhaustion, and gap detection in one indicator
Dynamic Visual Feedback: Intensity-based color coding that adapts to market conditions
Persistence Validation: Unique scoring system to filter signals based on directional consistency
🔬How It Works
Volume Distribution Estimation:
Divides each bar into configurable price bands for volume analysis
Applies sophisticated weighting based on OHLC relationships and proximity to close
Identifies the price level with maximum estimated volume as the POC
Velocity and Acceleration Calculation:
Measures POC rate of change over specified lookback periods
Normalizes values using ATR for consistent cross-market performance
Calculates acceleration as the rate of change of velocity
Signal Generation Process:
Combines trend direction analysis using EMA crossovers
Applies velocity and persistence thresholds to filter signals
Generates continuation, exhaustion, and gap alerts based on specific criteria
💡Note:
This indicator provides estimated POC calculations based on available OHLC data and should be used in conjunction with other analysis methods. The velocity-based approach offers unique insights into market structure dynamics but requires proper risk management and complementary analysis for optimal trading decisions.

X or AVWAPX OR AVWAP is a multi-layered market mapping tool designed to combine Opening Range analysis, Anchored VWAP (AVWAP) positioning, and SMA markers into a unified visual framework.
Opening Range (OR) Mapping
The indicator supports two independent Opening Ranges, allowing traders to define both a primary range and a micro range for finer analysis. This is particularly effective when viewing lower timeframes, where a smaller OR inside the larger OR reveals intraday microstructure.
OR #1 and OR #2 each have configurable session times, colors, and optional midpoint lines.
Historical OR boxes can be shown or hidden, with the ability to extend levels forward in time.
Optional Fibonacci-based expansion levels (0.5x, 1x, 1.5x, 2x, 3x OR) are available for projecting breakout targets and retracement zones.
Traders can toggle high/low lines, midpoints, and labels independently for cleaner chart presentation.
Anchored VWAP (AVWAP) Layers
To track institutional capital flow and session bias, the indicator offers three separate AVWAP anchors, each independently controlled:
Can be anchored to custom events, sessions, or manual reference points.
Enables granular capital flow mapping down to 4-hour increments, helping traders align intraday trades with broader directional bias.
Each AVWAP can be toggled on/off to avoid clutter and isolate the most relevant flow line for the current setup.
SMA Markers
For additional context, simple moving average markers can be displayed alongside OR and AVWAP structure, helping gauge trend direction and mean-reversion potential.
Use Case
This tool is built for traders who want to combine structure, flow, and trend in a single view. On lower timeframes, the dual OR feature allows for a “range-within-a-range” perspective, revealing short-term liquidity pockets inside the day’s primary auction boundaries. The multi-anchor AVWAPs track how price interacts with session-based weighted averages, highlighting points where institutional bias may shift. When combined with SMA markers, the trader gains a comprehensive map for scalping, intraday swing trading, and capital flow tracking.

Long/Short/Exit/Risk management Strategy # LongShortExit Strategy Documentation
## Overview
The LongShortExit strategy is a versatile trading system for TradingView that provides complete control over entry, exit, and risk management parameters. It features a sophisticated framework for managing long and short positions with customizable profit targets, stop-loss mechanisms, partial profit-taking, and trailing stops. The strategy can be enhanced with continuous position signals for visual feedback on the current trading state.
## Key Features
### General Settings
- **Trading Direction**: Choose to trade long positions only, short positions only, or both.
- **Max Trades Per Day**: Limit the number of trades per day to prevent overtrading.
- **Bars Between Trades**: Enforce a minimum number of bars between consecutive trades.
### Session Management
- **Session Control**: Restrict trading to specific times of the day.
- **Time Zone**: Specify the time zone for session calculations.
- **Expiration**: Optionally set a date when the strategy should stop executing.
### Contract Settings
- **Contract Type**: Select from common futures contracts (MNQ, MES, NQ, ES) or custom values.
- **Point Value**: Define the dollar value per point movement.
- **Tick Size**: Set the minimum price movement for accurate calculations.
### Visual Signals
- **Continuous Position Signals**: Implement 0 to 1 visual signals to track position states.
- **Signal Plotting**: Customize color and appearance of position signals.
- **Clear Visual Feedback**: Instantly see when entry conditions are triggered.
### Risk Management
#### Stop Loss and Take Profit
- **Risk Type**: Choose between percentage-based, ATR-based, or points-based risk management.
- **Percentage Mode**: Set SL/TP as a percentage of entry price.
- **ATR Mode**: Set SL/TP as a multiple of the Average True Range.
- **Points Mode**: Set SL/TP as a fixed number of points from entry.
#### Advanced Exit Features
- **Break-Even**: Automatically move stop-loss to break-even after reaching specified profit threshold.
- **Trailing Stop**: Implement a trailing stop-loss that follows price movement at a defined distance.
- **Partial Profit Taking**: Take partial profits at predetermined price levels:
- Set first partial exit point and percentage of position to close
- Set second partial exit point and percentage of position to close
- **Time-Based Exit**: Automatically exit a position after a specified number of bars.
#### Win/Loss Streak Management
- **Streak Cutoff**: Automatically pause trading after a series of consecutive wins or losses.
- **Daily Reset**: Option to reset streak counters at the start of each day.
### Entry Conditions
- **Source and Value**: Define the exact price source and value that triggers entries.
- **Equals Condition**: Entry signals occur when the source exactly matches the specified value.
### Performance Analytics
- **Real-Time Stats**: Track important performance metrics like win rate, P&L, and largest wins/losses.
- **Visual Feedback**: On-chart markers for entries, exits, and important events.
### External Integration
- **Webhook Support**: Compatible with TradingView's webhook alerts for automated trading.
- **Cross-Platform**: Connect to external trading systems and notification platforms.
- **Custom Order Execution**: Implement advanced order flows through external services.
## How to Use
### Setup Instructions
1. Add the script to your TradingView chart.
2. Configure the general settings based on your trading preferences.
3. Set session trading hours if you only want to trade specific times.
4. Select your contract specifications or customize for your instrument.
5. Configure risk parameters:
- Choose your preferred risk management approach
- Set appropriate stop-loss and take-profit levels
- Enable advanced features like break-even, trailing stops, or partial profit taking as needed
6. Define entry conditions:
- Select the price source (such as close, open, high, or an indicator)
- Set the specific value that should trigger entries
### Entry Condition Examples
- **Example 1**: To enter when price closes exactly at a whole number:
- Long Source: close
- Long Value: 4200 (for instance, to enter when price closes exactly at 4200)
- **Example 2**: To enter when an indicator reaches a specific value:
- Long Source: ta.rsi(close, 14)
- Long Value: 30 (triggers when RSI equals exactly 30)
### Best Practices
1. **Always backtest thoroughly** before using in live trading.
2. **Start with conservative risk settings**:
- Small position sizes
- Reasonable stop-loss distances
- Limited trades per day
3. **Monitor and adjust**:
- Use the performance table to track results
- Adjust parameters based on how the strategy performs
4. **Consider market volatility**:
- Use ATR-based stops during volatile periods
- Use fixed points during stable markets
## Continuous Position Signals Implementation
The LongShortExit strategy can be enhanced with continuous position signals to provide visual feedback about the current position state. These signals can help you track when the strategy is in a long or short position.
### Adding Continuous Position Signals
Add the following code to implement continuous position signals (0 to 1):
```pine
// Continuous position signals (0 to 1)
var float longSignal = 0.0
var float shortSignal = 0.0
// Update position signals based on your indicator's conditions
longSignal := longCondition ? 1.0 : 0.0
shortSignal := shortCondition ? 1.0 : 0.0
// Plot continuous signals
plot(longSignal, title="Long Signal", color=#00FF00, linewidth=2, transp=0, style=plot.style_line)
plot(shortSignal, title="Short Signal", color=#FF0000, linewidth=2, transp=0, style=plot.style_line)
```
### Benefits of Continuous Position Signals
- Provides clear visual feedback of current position state (long/short)
- Signal values stay consistent (0 or 1) until condition changes
- Can be used for additional calculations or alert conditions
- Makes it easier to track when entry conditions are triggered
### Using with Custom Indicators
You can adapt the continuous position signals to work with any custom indicator by replacing the condition with your indicator's logic:
```pine
// Example with moving average crossover
longSignal := fastMA > slowMA ? 1.0 : 0.0
shortSignal := fastMA < slowMA ? 1.0 : 0.0
```
## Webhook Integration
The LongShortExit strategy is fully compatible with TradingView's webhook alerts, allowing you to connect your strategy to external trading platforms, brokers, or custom applications for automated trading execution.
### Setting Up Webhooks
1. Create an alert on your chart with the LongShortExit strategy
2. Enable the "Webhook URL" option in the alert dialog
3. Enter your webhook endpoint URL (from your broker or custom trading system)
4. Customize the alert message with relevant information using TradingView variables
### Webhook Message Format Example
```json
{
"strategy": "LongShortExit",
"action": "{{strategy.order.action}}",
"price": "{{strategy.order.price}}",
"quantity": "{{strategy.position_size}}",
"time": "{{time}}",
"ticker": "{{ticker}}",
"position_size": "{{strategy.position_size}}",
"position_value": "{{strategy.position_value}}",
"order_id": "{{strategy.order.id}}",
"order_comment": "{{strategy.order.comment}}"
}
```
### TradingView Alert Condition Examples
For effective webhook automation, set up these alert conditions:
#### Entry Alert
```
{{strategy.position_size}} != {{strategy.position_size}}
```
#### Exit Alert
```
{{strategy.position_size}} < {{strategy.position_size}} or {{strategy.position_size}} > {{strategy.position_size}}
```
#### Partial Take Profit Alert
```
strategy.order.comment contains "Partial TP"
```
### Benefits of Webhook Integration
- **Automated Trading**: Execute trades automatically through supported brokers
- **Cross-Platform**: Connect to custom trading bots and applications
- **Real-Time Notifications**: Receive trade signals on external platforms
- **Data Collection**: Log trade data for further analysis
- **Custom Order Management**: Implement advanced order types not available in TradingView
### Compatible External Applications
- Trading bots and algorithmic trading software
- Custom order execution systems
- Discord, Telegram, or Slack notification systems
- Trade journaling applications
- Risk management platforms
### Implementation Recommendations
- Test webhook delivery using a free service like webhook.site before connecting to your actual trading system
- Include authentication tokens or API keys in your webhook URL or payload when required by your external service
- Consider implementing confirmation mechanisms to verify trade execution
- Log all webhook activities for troubleshooting and performance tracking
## Strategy Customization Tips
### For Scalping
- Set smaller profit targets (1-3 points)
- Use tighter stop-losses
- Enable break-even feature after small profit
- Set higher max trades per day
### For Day Trading
- Use moderate profit targets
- Implement partial profit taking
- Enable trailing stops
- Set reasonable session trading hours
### For Swing Trading
- Use longer-term charts
- Set wider stops (ATR-based often works well)
- Use higher profit targets
- Disable daily streak reset
## Common Troubleshooting
### Low Win Rate
- Consider widening stop-losses
- Verify that entry conditions aren't triggering too frequently
- Check if the equals condition is too restrictive; consider small tolerances
### Missing Obvious Trades
- The equals condition is extremely precise. Price must exactly match the specified value.
- Consider using floating-point precision for more reliable triggers
### Frequent Stop-Outs
- Try ATR-based stops instead of fixed points
- Increase the stop-loss distance
- Enable break-even feature to protect profits
## Important Notes
- The exact equals condition is strict and may result in fewer trade signals compared to other conditions.
- For instruments with decimal prices, exact equality might be rare. Consider the precision of your value.
- Break-even and trailing stop calculations are based on points, not percentage.
- Partial take-profit levels are defined in points distance from entry.
- The continuous position signals (0 to 1) provide valuable visual feedback but don't affect the strategy's trading logic directly.
- When implementing continuous signals, ensure they're aligned with the actual entry conditions used by the strategy.
---
*This strategy is for educational and informational purposes only. Always test thoroughly before using with real funds.*

Time-Based Fair Value Gaps (FVG) with Inversions (iFVG)Overview
The Time-Based Fair Value Gaps (FVG) with Inversions (iFVG) (ICT/SMT) indicator is a specialized tool designed for traders using Inner Circle Trader (ICT) methodologies. Inspired by LuxAlgo's Fair Value Gap indicator, this script introduces significant enhancements by integrating ICT principles, focusing on precise time-based FVG detection, inversion tracking, and retest signals tailored for institutional trading strategies. Unlike LuxAlgo’s general FVG approach, this indicator filters FVGs within customizable 10-minute windows aligned with ICT’s macro timeframes and incorporates ICT-specific concepts like mitigation, liquidity grabs, and session-based gap prioritization.
This tool is optimized for 1–5 minute charts, though probably best for 1 minute charts, identifying bullish and bearish FVGs, tracking their mitigation into inverted FVGs (iFVGs) as key support/resistance zones, and generating retest signals with customizable “Close” or “Wick” confirmation. Features like ATR-based filtering, optional FVG labels, mitigation removal, and session-specific FVG detection (e.g., first FVG in AM/PM sessions) make it a powerful tool for ICT traders.
Originality and Improvements
While inspired by LuxAlgo’s FVG indicator (credit to LuxAlgo for their foundational work), this script significantly extends the original concept by:
1. Time-Based FVG Detection: Unlike LuxAlgo’s continuous FVG identification, this script filters FVGs within user-defined 10-minute windows each hour (:00–:10, :10–:20, etc.), aligning with ICT’s emphasis on specific periods of institutional activity, such as hourly opens/closes or kill zones (e.g., New York 7:00–11:00 AM EST). This ensures FVGs are relevant to high-probability ICT setups.
2. Session-Specific First FVG Option: A unique feature allows traders to display only the first FVG in ICT-defined AM (9:30–10:00 AM EST) or PM (1:30–2:00 PM EST) sessions, reflecting ICT’s focus on initial market imbalances during key liquidity events.
3. ICT-Driven Mitigation and Inversion Logic: The script tracks FVG mitigation (when price closes through a gap) and converts mitigated FVGs into iFVGs, which serve as ICT-style support/resistance zones. This aligns with ICT’s view that mitigated gaps become critical reversal points, unlike LuxAlgo’s simpler gap display.
4. Customizable Retest Signals: Retest signals for iFVGs are configurable for “Close” (conservative, requiring candle body confirmation) or “Wick” (faster, using highs/lows), catering to ICT traders’ need for precise entry timing during liquidity grabs or Judas swings.
5. ATR Filtering and Mitigation Removal: An optional ATR filter ensures only significant FVGs are displayed, reducing noise, while mitigation removal declutters the chart by removing filled gaps, aligning with ICT’s principle that mitigated gaps lose relevance unless inverted.
6. Timezone and Timeframe Safeguards: A timezone offset setting aligns FVG detection with EST for ICT’s New York-centric strategies, and a timeframe warning alerts users to avoid ≥1-hour charts, ensuring accuracy in time-based filtering.
These enhancements make the script a distinct tool that builds on LuxAlgo’s foundation while offering ICT traders a tailored, high-precision solution.
How It Works
FVG Detection
FVGs are identified when a candle’s low is higher than the high of two candles prior (bullish FVG) or a candle’s high is lower than the low of two candles prior (bearish FVG). Detection is restricted to:
• User-selected 10-minute windows (e.g., :00–:10, :50–:60) to capture ICT-relevant periods like hourly transitions.
• AM/PM session first FVGs (if enabled), focusing on 9:30–10:00 AM or 1:30–2:00 PM EST for key market opens.
An optional ATR filter (default: 0.25× ATR) ensures only gaps larger than the threshold are displayed, prioritizing significant imbalances.
Mitigation and Inversion
When price closes through an FVG (e.g., below a bullish FVG’s bottom), the FVG is mitigated and becomes an iFVG, plotted as a support/resistance zone. iFVGs are critical in ICT for identifying reversal points where institutional orders accumulate.
Retest Signals
The script generates signals when price retests an iFVG:
• Close: Triggers when the candle body confirms the retest (conservative, lower noise).
• Wick: Triggers when the candle’s high/low touches the iFVG (faster, higher sensitivity). Signals are visualized with triangular markers (▲ for bullish, ▼ for bearish) and can trigger alerts.
Visualization
• FVGs: Displayed as colored boxes (green for bullish, red for bearish) with optional “Bull FVG”/“Bear FVG” labels.
• iFVGs: Shown as extended boxes with dashed midlines, limited to the user-defined number of recent zones (default: 5).
• Mitigation Removal: Mitigated FVGs/iFVGs are removed (if enabled) to keep the chart clean.
How to Use
Recommended Settings
• Timeframe: Use 1–5 minute charts for precision, avoiding ≥1-hour timeframes (a warning label appears if misconfigured).
• Time Windows: Enable :00–:10 and :50–:60 for hourly open/close FVGs, or use the “Show only 1st presented FVG” option for AM/PM session focus.
• ATR Filter: Keep enabled (multiplier 0.25–0.5) for significant gaps; disable on 1-minute charts for more FVGs during volatility.
• Signal Preference: Use “Close” for conservative entries, “Wick” for aggressive setups.
• Timezone Offset: Set to -5 for EST (or -4 for EDT) to align with ICT’s New York session.
Trading Strategy
1. Macro Timeframes: Focus on New York (7:00–11:00 AM EST) or London (2:00–5:00 AM EST) kill zones for high institutional activity.
2. FVG Entries: Trade bullish FVGs as support in uptrends or bearish FVGs as resistance in downtrends, especially in :00–:10 or :50–:60 windows.
3. iFVG Retests: Enter on retest signals (▲/▼) during liquidity grabs or Judas swings, using “Close” for confirmation or “Wick” for speed.
4. Session FVGs: Use the “Show only 1st presented FVG” option to target the first gap in AM/PM sessions, often tied to ICT’s market maker algorithms.
5. Risk Management: Combine with ICT concepts like order blocks or breaker blocks for confluence, and set stops beyond FVG/iFVG boundaries.
Alerts
Set alerts for:
• “Bullish FVG Detected”/“Bearish FVG Detected”: New FVGs in selected windows.
• “Bullish Signal”/“Bearish Signal”: iFVG retest confirmations.
Settings Description
• Show Last (1–100, default: 5): Number of recent iFVGs to display. Lower values reduce clutter.
• Show only 1st presented FVG : Limits FVGs to the first in 9:30–10:00 AM or 1:30–2:00 PM EST sessions (overrides time window checkboxes).
• Time Window Checkboxes: Enable/disable FVG detection in 10-minute windows (:00–:10, :10–:20, etc.). All enabled by default.
• Signal Preference: “Close” (default) or “Wick” for iFVG retest signals.
• Use ATR Filter: Enables ATR-based size filtering (default: true).
• ATR Multiplier (0–∞, default: 0.25): Sets FVG size threshold (higher values = larger gaps).
• Remove Mitigated FVGs: Removes filled FVGs/iFVGs (default: true).
• Show FVG Labels: Displays “Bull FVG”/“Bear FVG” labels (default: true).
• Timezone Offset (-12 to 12, default: -5): Aligns time windows with EST.
• Colors: Customize bullish (green), bearish (red), and midline (gray) colors.
Why Use This Indicator?
This indicator empowers ICT traders with a tool that goes beyond generic FVG detection, offering precise, time-filtered gaps and inversion tracking aligned with institutional trading principles. By focusing on ICT’s macro timeframes, session-specific imbalances, and customizable signal logic, it provides a clear edge for scalping, swing trading, or reversal setups in high-liquidity markets.

Average Entry Price Calculator# Average Entry Price Calculator
This powerful indicator helps you track your average entry price across multiple positions, displaying it clearly on your chart with customizable lines and labels.
## Features:
• Calculate average entry price for up to 5 different positions
• Display current price and profit/loss calculations
• Show percentage and absolute change from your average entry
• Customizable line styles, colors, and label positions
• Track your entry prices with clear visual references
## How It Works:
Enter your position details (entry price and amount in USDT), and the indicator will calculate your average entry price, displaying it as a horizontal line on your chart. The indicator also shows your individual entry prices as separate lines, making it easy to visualize your overall position.
## Perfect For:
• DCA (Dollar-Cost Averaging) strategies
• Position tracking across multiple entries
• Risk management and profit taking
• Visualizing entry zones on your chart
## Instructions:
1. Add the indicator to your chart
2. Enter your position details (price and amount)
3. Customize the visual appearance as needed
4. Use the displayed average entry line for decision making
All calculations are done locally in your browser - no sensitive data is transmitted or stored.
Enjoy more informed trading decisions with this essential position tracking tool!

Multitimeframe Fair Value Gap – FVG (Zeiierman)█ Overview
The Multitimeframe Fair Value Gap – FVG (Zeiierman) indicator provides a dynamic and customizable visualization of institutional imbalances (Fair Value Gaps) across multiple timeframes. Built for traders who seek to analyze price inefficiencies, this tool helps highlight potential entry points, unmitigated gaps, and directional bias using smart volume logic and adaptive visual elements.
A Fair Value Gap (FVG) forms when there's a three-candle sequence in which a market imbalance leaves a "gap" between the wicks of candle 1 and candle 3. These areas are often considered footprints of institutional activity, and this indicator gives you the tools to track them with surgical precision across any timeframe you choose—regardless of the one you're viewing.
This indicator also includes a trend filter powered by a low-pass Butterworth filter, enabling traders to distinguish between countertrend vs. trend-aligned FVGs for more intelligent decision-making. On top of that, it features a dynamic FVG table for live tracking and bull/bear volume power visualization inside each gap, adding powerful clarity to market intent.
█ How It Works
The indicator analyzes the open, high, low, close, and volume of candles from a user-selected timeframe. It identifies Fair Value Gaps based on wick logic and only confirms those that meet customizable strength criteria. Once detected, the indicator visualizes each FVG with dynamically extending boxes, optional buy/sell volume bars, and a real-time mitigation check.
⚪ Multitimeframe Logic
Users can analyze FVGs from a higher or lower timeframe regardless of their current chart.
This is achieved using request.security() to fetch OHLCV data from the chosen timeframe.
⚪ Wick Sensitivity & Impulse Filter
The script measures the wick size of potential FVG candles and compares them to a running average. Only FVGs with wick sizes above a certain sensitivity threshold (user-controlled) are plotted. This ensures only meaningful price dislocations (e.g., strong impulsive moves) are shown, reducing noise.
⚪ Midpoint Mitigation Logic
FVGs are marked as "mitigated" when the price revisits the gap area. Traders can choose whether full gap closure or just a midpoint touch is required. This allows faster reactivity in real-time trading environments.
⚪ Bull & Bear Power – Volume-Weighted Visualization
Every Fair Value Gap box includes sub-bars representing the estimated buy and sell effort that created the gap. These are calculated using the candle's close in relation to its high/low range and volume:
Buy Volume % ≈ effort from low to close
Sell Volume % ≈ effort from high to close
Each sub-bar inside the FVG:
Is color-coded (UpCol for bullish, DnCol for bearish)
Is drawn proportionally to the strength of buyers or sellers
Visually displays who was in control during the imbalance
⚪ FVG Table – Dynamic On-Chart Overview
The indicator includes an optional on-chart table that displays all currently active (unmitigated) FVGs in a side panel format:
Automatic updates as gaps are formed and mitigated
Color-coded rows to show bullish vs. bearish FVGs
Timestamps to know precisely when the gap formed
User-controlled position via Table Left and Table Right
This is a gap watchlist overlay, giving traders a concise view of current inefficiencies without manually scanning the chart.
⚪ FVG Trend Filter (Butterworth Smoother)
Using a two-pole Butterworth low-pass filter, the indicator computes a trendline based on average FVG values, offering a smooth but responsive directional signal.
Passband Ripple (dB): Controls sensitivity and overshoot tolerance
Cutoff Frequency (0–0.5): Sets how quickly the trendline reacts
The trendline helps categorize each FVG:
Trend up → favor bullish FVGs
Trend down → favor bearish FVGs
It adds an extra dimension to FVG entries, helping distinguish between trend-aligned and countertrend signals.
█ How to Use
⚪ Identify Institutional Gaps
Use this tool to identify areas where institutions may have left imbalances behind quickly.
These areas often become:
Strong support/resistance zones
Areas where price might react sharply
Targets for liquidity sweeps or retracements
⚪ React to Trend or Countertrend
The built-in trendline helps categorize each FVG:
Trend up → Bullish FVGs have higher validity
Trend down → Bearish FVGs have higher validity
⚪ Volume Context via Bull/Bear Power
Each Fair Value Gap is more than just a price imbalance — it’s a story of effort and intent. The Bull/Bear Power feature visualizes the buy and sell pressure behind each FVG, helping you understand how the gap was formed and who was in control.
A bullish FVG with a strong buy effort suggests continuation potential — buyers dominated the move.
A bullish FVG with a dominant sell effort could signal a trap or reversal — sellers may have overwhelmed the breakout.
These insights allow you to confirm imbalance strength, spot traps early, and add confidence to entries based on dominant volume profiles.
Instead of viewing gaps as static zones, this feature turns each into a live volume map — a visual breakdown of who moved the market and whether that move had conviction.
⚪ Plan with the FVG Table
The FVG Table acts as your on-chart control center for tracking active imbalances. When enabled, it provides a clear summary of all unmitigated Fair Value Gaps, helping you stay organized and focused during fast-moving sessions.
Track live and historical gaps: See exactly when and where each FVG formed.
Monitor older, still-valid zones: Gaps off-screen but not mitigated remain in play — perfect for anticipating future reactions.
Gauge market bias at a glance: The balance of bullish vs. bearish FVGs helps you understand overall directional pressure.
Plan entries confidently: Use the table to reference all zones for risk management, confluence stacking, or layered execution strategies.
Instead of manually scanning your chart, the FVG Table offers a clean, at-a-glance overview of the market’s inefficiencies — giving you the structure needed to act with precision.
█ Settings
FVG Timeframe
Select any timeframe to source FVGs independent of your current chart.
Sensitivity
Filter FVGs by how impulsive the move is — it helps you eliminate weak gaps.
Mitigated on Mid
Control whether gaps are removed at midpoint touch or full fill.
Table Settings
Control the table position and width. Cleanly view all active FVGs.
FVG Style
Customize gap box colors, length, and bullish/bearish overlays.
Trend Filter
Enable or disable the smoothed FVG-based trendline with customizable smoothing controls.
-----------------
Disclaimer
The content provided in my scripts, indicators, ideas, algorithms, and systems is for educational and informational purposes only. It does not constitute financial advice, investment recommendations, or a solicitation to buy or sell any financial instruments. I will not accept liability for any loss or damage, including without limitation any loss of profit, which may arise directly or indirectly from the use of or reliance on such information.
All investments involve risk, and the past performance of a security, industry, sector, market, financial product, trading strategy, backtest, or individual's trading does not guarantee future results or returns. Investors are fully responsible for any investment decisions they make. Such decisions should be based solely on an evaluation of their financial circumstances, investment objectives, risk tolerance, and liquidity needs.

Hourly Volatility Explorer📊 Hourly Volatility Explorer: Master The Market's Pulse
Unlock the hidden rhythms of price action with this sophisticated volatility analysis tool. The Hourly Volatility Explorer reveals the most potent trading hours across multiple time zones, giving you a strategic edge in timing your trades.
🌟 Key Features:
⏰ Multi-Timezone Analysis
• GMT (UTC+0)
• EST (UTC-5) - New York
• BST (UTC+1) - London
• JST (UTC+9) - Tokyo
• AEST (UTC+10) - Sydney
Perfect for tracking major market sessions and their overlaps!
📈 Dynamic Visualization
• Color-gradient hourly bars for instant pattern recognition
• Real-time volatility comparison
• Interactive data table with comprehensive statistics
• Automatic highlighting of peak volatility periods
🎯 Strategic Applications:
Day Trading:
• Identify optimal trading windows
• Avoid low-liquidity periods
• Capitalize on session overlaps
• Fine-tune entry/exit timing
Risk Management:
• Set appropriate stop losses based on hourly volatility
• Adjust position sizes for different market hours
• Optimize risk-reward ratios
• Plan around high-impact hours
Global Market Analysis:
• Track volatility across all major sessions
• Spot institutional trading patterns
• Identify quiet vs. active periods
• Monitor 24/7 market dynamics
💡 Perfect For:
• Forex traders navigating global sessions
• Crypto traders in 24/7 markets
• Day traders optimizing execution times
• Algorithmic traders fine-tuning strategies
• Risk managers calibrating exposure
📊 Advanced Features:
• Rolling 3-month analysis for reliable patterns
• Precise pip movement calculations
• Sample size tracking for statistical validity
• Real-time current hour comparison
• Color-coded visual system for instant insights
⚡ Pro Trading Tips:
• Use during major session overlaps for maximum opportunity
• Compare patterns across different instruments
• Combine with volume analysis for deeper insights
• Track seasonal variations in hourly patterns
• Build trading schedules around peak hours
🎓 Educational Value:
• Understand market microstructure
• Learn global market dynamics
• Master timezone relationships
• Develop timing intuition
🛠️ Customization:
• Adjustable lookback period
• Flexible pip multiplier
• Multiple timezone options
• Visual preference settings
Whether you're scalping the 1-minute chart or managing longer-term positions, the Hourly Volatility Explorer provides the precise timing intelligence needed for today's global markets.
Transform your trading schedule from guesswork to science. Know exactly when markets move, why they move, and how to position yourself for maximum opportunity.
#TechnicalAnalysis #Trading #Volatility #MarketTiming #DayTrading #Forex #Crypto #TradingView #PineScript #MarketAnalysis #TradingStrategy #RiskManagement #GlobalMarkets #FinancialMarkets #TradingTools #MarketStructure #PriceAction #Scalping #SwingTrading #AlgoTrading

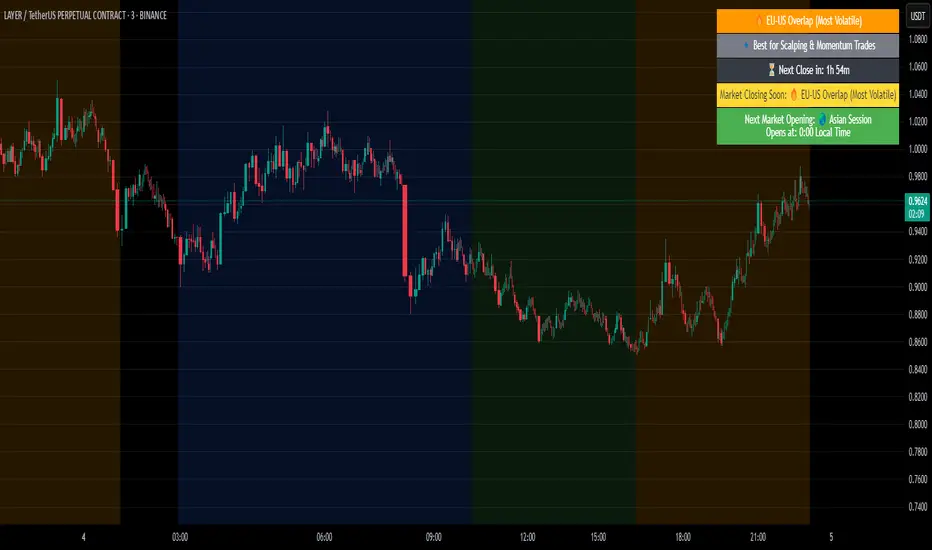
Crypto Market Session Guide with Local TimeMaster the Markets with the Ultimate Trading Session Indicator
Timing is everything in trading. Knowing when liquidity is at its peak and when market sessions overlap can make all the difference in your strategy. This Market Session Guide Indicator helps you navigate the trading day with real-time session tracking, countdown timers, and local time adjustments—giving you a clear edge in the market.
Key Features
Live Session Tracking – Instantly see which trading session is active: Asian, European, US, or the high-volatility EU-US overlap.
Automatic Local Time Conversion – No need to convert UTC manually—session times adjust automatically based on your TradingView exchange settings.
Daylight Saving Time Adjustments – The US market opening and closing times are automatically adjusted for summer and winter shifts.
Countdown Timer for Session Close – Know exactly when the current session will end so you can time your trades effectively.
Next Market Opening Display – Always be prepared by knowing which market opens next and at what exact time in your local timezone.
Clear Visual Guide – A structured table in the top-right of your chart provides all essential session details without cluttering your screen.
How It Works
This indicator tracks the three main trading sessions:
Asian Session (Tokyo, Sydney): 00:00 - 09:00 UTC
European Session (London, Frankfurt): 07:00 - 16:00 UTC
US Session (New York, Chicago): 13:30 - 22:00 UTC (adjusts automatically for Daylight Saving Time)
EU-US Overlap: 12:00 - 16:00 UTC, the most volatile period of the trading day
It also highlights when a session is about to close and when the next one will begin, ensuring you are always aware of liquidity shifts in the market.
Why You Need This Indicator
Optimized for Forex, Crypto, and Indices – Helps traders align their strategies with the most active market hours.
Ideal for Scalping and Day Trading – Enter trades during peak volatility to maximize opportunities.
Eliminates Guesswork – Stop manually tracking time zones and market schedules—everything updates dynamically for you.
Upgrade Your Trading Strategy Today
This indicator simplifies market timing, ensuring you're always trading when liquidity and volatility are at their highest. Whether you're trading Forex, Crypto, or Stocks, knowing when markets open and close is essential for making informed decisions.
Try it out, and if you find it useful, consider sharing it with other traders. Your feedback is always welcome!
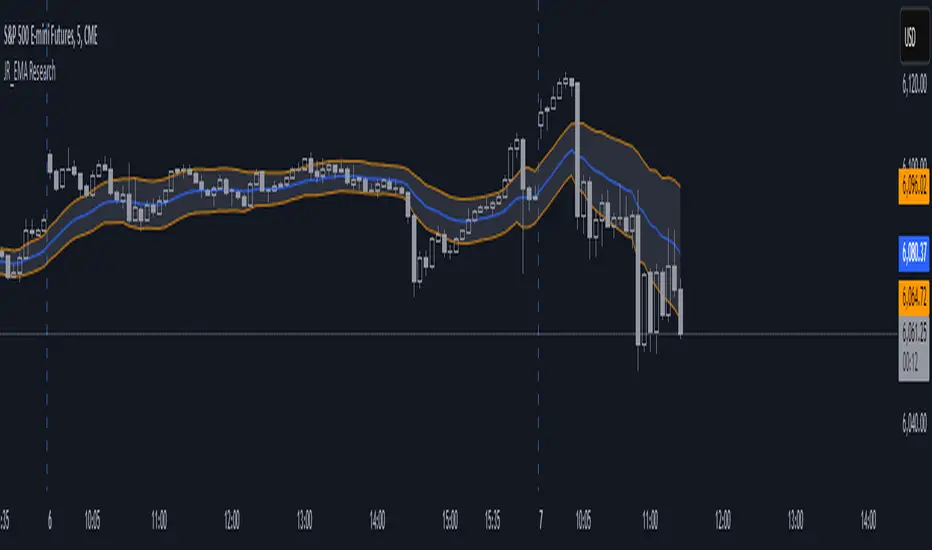
EMA Study Script for Price Action Traders, v2JR_EMA Research Tool Documentation
Version 2 Enhancements
Version 2 of the JR_EMA Research Tool introduces several powerful features that make it particularly valuable for studying price action around Exponential Moving Averages (EMAs). The key improvements focus on tracking and analyzing price-EMA interactions:
1. Cross Detection and Counting
- Implements flags for crossing bars that instantly identify when price crosses above or below the EMA
- Maintains running counts of closes above and below the EMA
- This feature helps students understand the persistence of trends and the frequency of EMA interactions
2. Bar Number Tracking
- Records the specific bar number when EMA crosses occur
- Stores the previous crossing bar number for reference
- Enables precise measurement of time between crosses, helping identify typical trend durations
3. Variable Reset Management
- Implements sophisticated reset logic for all counting variables
- Ensures accuracy when analyzing multiple trading sessions
- Critical for maintaining clean data when studying patterns across different timeframes
4. Cross Direction Tracking
- Monitors the direction of the last EMA cross
- Helps students identify the current trend context
- Essential for understanding trend continuation vs reversal scenarios
Educational Applications
Price-EMA Relationship Studies
The tool provides multiple ways to study how price interacts with EMAs:
1. Visual Analysis
- Customizable EMA bands show typical price deviation ranges
- Color-coded fills help identify "normal" vs "extreme" price movements
- Three different band calculation methods offer varying perspectives on price volatility
2. Quantitative Analysis
- Real-time tracking of closes above/below EMA
- Running totals help identify persistent trends
- Cross counting helps understand typical trend duration
Research Configurations
EMA Configuration
- Adjustable EMA period for studying different trend timeframes
- Customizable EMA color for visual clarity
- Ideal for comparing different EMA periods' effectiveness
Bands Configuration
Three distinct calculation methods:
1. Full Average Bar Range (ABR)
- Uses the entire range of price movement
- Best for studying overall volatility
2. Body Average Bar Range
- Focuses on the body of the candle
- Excellent for studying conviction in price moves
3. Standard Deviation
- Traditional statistical approach
- Useful for comparing to other technical studies
Signal Configuration
- Optional signal plotting for entry/exit studies
- Helps identify potential trading opportunities
- Useful for backtesting strategy ideas
Using the Tool for Study
Basic Analysis Steps
1. Start with the default 20-period EMA
2. Observe how price interacts with the EMA line
3. Monitor the data window for quantitative insights
4. Use band settings to understand normal price behavior
Advanced Analysis
1. Pattern Recognition
- Use the cross counting system to identify typical pattern lengths
- Study the relationship between cross frequency and trend strength
- Compare different timeframes for fractal analysis
2. Volatility Studies
- Compare different band calculation methods
- Identify market regimes through band width changes
- Study the relationship between volatility and trend persistence
3. Trend Analysis
- Use the closing price count system to measure trend strength
- Study the relationship between trend duration and subsequent reversals
- Compare different EMA periods for optimal trend following
Best Practices for Research
1. Systematic Approach
- Start with longer timeframes and work down
- Document observations about price behavior in different market conditions
- Compare results across multiple symbols and timeframes
2. Data Collection
- Use the data window to record significant events
- Track the number of bars between crosses
- Note market conditions when signals appear
3. Optimization Studies
- Test different EMA periods for your market
- Compare band calculation methods for your trading style
- Document which settings work best in different market conditions
Technical Implementation Notes
This tool is particularly valuable for educational purposes because it combines visual and quantitative analysis in a single interface, allowing students to develop both intuitive and analytical understanding of price-EMA relationships.
R-based Strategy Template [Daveatt]Have you ever wondered how to properly track your trading performance based on risk rather than just profits?
This template solves that problem by implementing R-multiple tracking directly in TradingView's strategy tester.
This script is a tool that you must update with your own trading entry logic.
Quick notes
Before we dive in, I want to be clear: this is a template focused on R-multiple calculation and visualization.
I'm using a basic RSI strategy with dummy values just to demonstrate how the R tracking works. The actual trading signals aren't important here - you should replace them with your own strategy logic.
R multiple logic
Let's talk about what R-multiple means in practice.
Think of R as your initial risk per trade.
For instance, if you have a $10,000 account and you're risking 1% per trade, your 1R would be $100.
A trade that makes twice your risk would be +2R ($200), while hitting your stop loss would be -1R (-$100).
This way of measuring makes it much easier to evaluate your strategy's performance regardless of account size.
Whenever the SL is hit, we lose -1R
Proof showing the strategy tester whenever the SL is hit: i.imgur.com
The magic happens in how we calculate position sizes.
The script automatically determines the right position size to risk exactly your specified percentage on each trade.
This is done through a simple but powerful calculation:
risk_amount = (strategy.equity * (risk_per_trade_percent / 100))
sl_distance = math.abs(entry_price - sl_price)
position_size = risk_amount / (sl_distance * syminfo.pointvalue)
Limitations with lower timeframe gaps
This ensures that if your stop loss gets hit, you'll lose exactly the amount you intended to risk. No more, no less.
Well, could be more or less actually ... let's assume you're trading futures on a 15-minute chart but in the 1-minute chart there is a gap ... then your 15 minute SL won't get filled and you'll likely to not lose exactly -1R
This is annoying but it can't be fixed - and that's how trading works anyway.
Features
The template gives you flexibility in how you set your stop losses. You can use fixed points, ATR-based stops, percentage-based stops, or even tick-based stops.
Regardless of which method you choose, the position sizing will automatically adjust to maintain your desired risk per trade.
To help you track performance, I've added a comprehensive statistics table in the top right corner of your chart.
It shows you everything you need to know about your strategy's performance in terms of R-multiples: how many R you've won or lost, your win rate, average R per trade, and even your longest winning and losing streaks.
Happy trading!
And remember, measuring your performance in R-multiples is one of the most classical ways to evaluate and improve your trading strategies.
Daveatt

ROI Levels IndicatorROI Levels Indicator 📈💰
Description: The "ROI Levels Indicator" helps you visualize key Return on Investment (ROI) levels directly on your chart, making it easier to track your profit milestones! 🚀 This tool allows you to enter your entry price, and it calculates levels from 100% up to 1000% ROI, each with a spread to represent potential support and resistance zones. The levels are visually represented by red rectangles to help identify zones where the market might react. This is a great way for traders to easily understand profit-taking points and psychological price levels!
Features:
🛠️ Custom Entry Price: Set your own entry price to start calculating ROI levels.
📊 Multiple ROI Levels: Levels from 100% to 1000%, with a customizable spread for visual clarity.
🔴 Visual Representation: Each level is marked with a full-screen-width rectangle and label, making it easy to track.
🚨 Entry Price Plot: A red dashed line marks your entry price for easy reference.
How to Use:
Enter Your Price: Use the "Entry Price" input field to specify the entry price of your trade.
Spread Adjustment: Adjust the spread percentage if you want more or less tolerance around each ROI level.
View the Levels: The script automatically plots 100% to 1000% ROI levels. Each level is represented by a red rectangle and labeled on the right side for quick identification.
Track Profit Zones: Use the plotted ROI levels to identify key profit-taking areas or potential zones of support and resistance.
Pro Tip: Use these levels as reference points to decide when to scale out of positions or manage risk effectively! 🎯
Happy trading, and may your ROI always be on the rise! 📈🔥

Statistics plot1. setting the price range
At the beginning of the script, set the price range (interval). Price ranges are used to divide prices into several groups (buckets) and record how many prices have been reached within each group. For example, setting the price range to “10” will divide the price into intervals 0-10, 10-20, 20-30, and so on.
The price range can also be set manually by the user or automatically calculated based on the initial price. This allows for flexibility in adjusting price ranges for different assets and different time frames.
2. aggregate the number of times a price is reached
Record how many times the price reached each price range (e.g., 100-110, 110-120, etc.). This aggregate data is stored in a data structure called an array.
Each element of the array corresponds to a price range, and when a price reaches that range, the corresponding array value is incremented by one. This process is performed in real time, tracking price movements.
3. initializing and extending price ranges
The first bar of the script (when the chart is first loaded) divides the price ranges into several groups and initializes a count of 0 for each range.
When a price reaches a new range, the array is expanded as needed to add the new price range. This allows the script to work with any price movement, even if the price range continues to grow.
4. visualize the number of price arrivals with a histogram
The aggregated number of arrivals per price range is visually displayed in the form of a histogram. This histogram is designed to allow the user to see at a glance which price range is being reached most frequently.
For example, if prices frequently reach the 100-110 range, the histogram bar corresponding to that range will appear higher than the other ranges. This allows you to visually identify price “dwell points” or support and resistance levels.
5. display of moving averages
A moving average (MA) of the number of times a price has been reached is drawn above the histogram. Moving averages are indicators that show a smooth trend for the number of price arrivals and are useful for understanding the overall direction of price movements.
The duration of the moving average (how many data points it is calculated based on) can be set by the user. This allows for flexible analysis of short or long term price trends. 6.
6. price range tracking and labeling
The script keeps track of which price range the current price is located in. Based on this, information related to the current price range is displayed on the chart as labels.
In particular, labels indicate the beginning and end points of the price range, including which range the price was in at the beginning and which range the price reached at the end. These labels are a useful feature to visually identify price ranges on the chart.
7. labeling of current price range
To confirm which price range the current price is in, when a price reaches a specific price range, a label corresponding to that price range is displayed. This label indicates the position of the price in real-time, allowing traders to visually track where the current price is in the area.
8. calculating the start and end points of the range
The script calculates the start and end points of a range with a non-zero number of price arrivals to find the minimum and maximum of the range. This calculation allows you to see where prices are concentrated within a range.
9. out-of-range price processing
When a price reaches outside the range, the script automatically adds the array element corresponding to that price range and inserts the data in the appropriate location for the count. This allows the script to follow the price as it moves unexpectedly.

Simultaneous INSIDE Bar Break IndicatorSimultaneous Inside Bar Break Indicator (SIBBI) for The Strat Community
Overview:
The Simultaneous Inside Bar Break Indicator (SIBBI) is designed to help traders using The Strat methodology identify one of the most powerful breakout patterns: the Simultaneous Inside Bar Break across multiple symbols. This indicator detects when all four user-selected symbols form inside bars on the previous candle and then break those inside bars in the same direction (either bullish or bearish) on the current candle.
Inside bars represent consolidation periods where price action does not break the high or low of the previous candle. When a simultaneous break occurs across multiple symbols, this often signals a strong move in the market, making this a key actionable signal in The Strat trading strategy.
Key Features:
Multi-Symbol Analysis: You can track up to four different symbols simultaneously. By default, the indicator comes with SPY, QQQ, IWM, and DIA, but you can modify these to track any other assets or symbols.
Inside Bar Detection: The indicator checks whether all four symbols have inside bars on the previous candle. It only triggers when all symbols meet this condition, making it a highly specific and reliable signal.
Simultaneous Break Detection: Once all symbols have inside bars, the indicator waits for a breakout in the same direction across all four symbols. A simultaneous bullish break (prices breaking above the previous candle’s high) triggers a green label, while a simultaneous bearish break (prices breaking below the previous candle’s low) triggers a red label.
Dynamic Label Timeframe: The indicator dynamically adjusts the timeframe in the label based on the user’s selected timeframe. This allows traders to know precisely which timeframe the break is occurring on. If the user selects "Chart Timeframe," the indicator will evolve with the current chart's timeframe, making it more versatile.
Timeframe Flexibility: The indicator can be set to analyze any timeframe—15-minute, 30-minute, 60-minute, daily, weekly, and so on. It only works for the specific timeframe you set it to in the settings. If set to "Chart Timeframe," the label will adapt dynamically based on the timeframe you are currently viewing.
Customizable Labels: The user can choose the size of the labels (tiny, small, or normal), ensuring that the visual output is tailored to individual preferences and chart layouts.
Best Use Case:
The Simultaneous Inside Bar Break Indicator is particularly powerful when applied to multiple timeframes. Here’s how to use it for maximum impact:
Multi-Timeframe Setup: Set the indicator on various timeframes (e.g., 15-minute, 30-minute, 60-minute, and daily) across multiple charts. This allows you to monitor different timeframes and identify when lower timeframe breaks trigger potential moves on higher timeframes.
Anticipating Strong Moves: When a simultaneous inside bar break occurs on one timeframe (e.g., 30-minute), keep an eye on the higher timeframes (e.g., 60-minute or daily) to see if those timeframes also break. This stacking of inside bar breaks can signal powerful market moves.
Higher Conviction Signals: The indicator is designed to provide high-conviction signals. Since it requires all four symbols to break in the same direction simultaneously, it reduces false signals and focuses on higher probability setups, which is crucial for traders using The Strat to time their trades effectively.
How the Indicator Works:
Inside Bar Formation: The indicator first checks that all four selected symbols had inside bars in the previous bar (i.e., the current high and low are contained within the previous bar’s high and low).
Simultaneous Break Detection: After detecting inside bars, the indicator checks if all four symbols break out in the same direction—bullish (breaking above the previous bar’s high) or bearish (breaking below the previous bar’s low).
Label Display: When a simultaneous inside bar break occurs, a label is plotted on the chart—either green for a bullish break (below the candle) or red for a bearish break (above the candle). The label will display the timeframe you set in the settings (e.g., "IBSB 60" for a 60-minute break).
Chart Timeframe Option: If you prefer, you can set the indicator to evolve with the chart’s current timeframe. In this mode, the label will not show a specific timeframe but will still display the simultaneous inside bar break when it occurs.
Recommendations for Usage:
Focus on Multiple Timeframes: The Strat methodology is all about understanding the relationship between different timeframes. Use this indicator on multiple timeframes to get a better picture of potential moves.
Pair with Other Strat Techniques: This indicator is most powerful when combined with other Strat tools, such as broadening formations, timeframe continuity, and actionable signals (e.g., 2-2 reversals). The simultaneous inside bar break can help confirm or invalidate other signals.
Customize Symbols and Timeframes: Although the default symbols are SPY, QQQ, IWM, and DIA, feel free to replace them with symbols more relevant to your trading. This indicator works well across equities, indices, futures, and forex pairs.
How to Set It Up:
Select Symbols: Choose four symbols that you want to track. These can be index ETFs (like SPY and QQQ), individual stocks, or any other tradable instruments.
Set Timeframe: In the indicator’s settings, choose a specific timeframe (e.g., 15-minute, 30-minute, daily). The label will reflect the selected timeframe, making it clear which time-based break you are seeing.
Optional - Chart Timeframe Mode: If you want the indicator to adapt to the chart’s current timeframe, select the "Chart Timeframe" option in the settings. The indicator will plot the breaks without showing a specific timeframe in the label.
Customize Label Size: Depending on your chart layout and personal preference, you can adjust the size of the labels (tiny, small, or normal) in the settings.
Conclusion:
The Simultaneous Inside Bar Break Indicator is a powerful tool for traders using The Strat methodology, offering a highly specific and reliable signal that can indicate potential large market moves. By monitoring multiple symbols and timeframes, you can gain deeper insight into the market's behavior and act with greater confidence. This indicator is ideal for traders looking to catch high-conviction moves and align their trades with broader market continuity.
Note: The indicator works best when paired with multi-timeframe analysis, allowing you to see how breaks on lower timeframes might influence larger trends. For traders who prefer simplicity, setting it to the "Chart Timeframe" mode offers flexibility while maintaining the core benefits of this indicator.

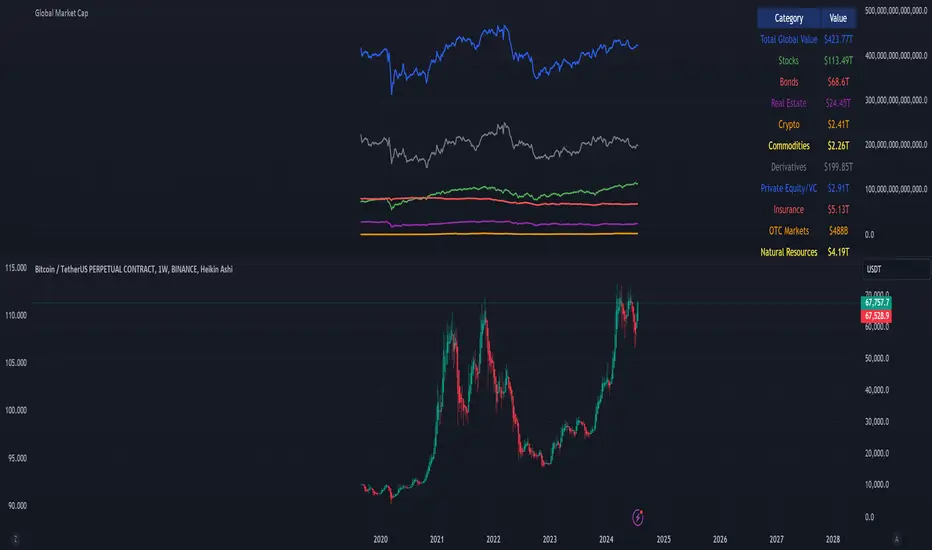
Global Market Cap of all measuable assets# Comprehensive Global Market Cap Overview
This indicator provides a dynamic, real-time estimate of the total global market value across multiple asset classes and economic sectors. It aims to give traders and analysts a broad perspective on the state of global markets and wealth.
## Features:
- Real-time data for major market segments including stocks, bonds, real estate, cryptocurrencies, and commodities
- Estimates for hard-to-quantify sectors like derivatives, private equity, and OTC markets
- Includes often-overlooked categories such as cash deposits, insurance markets, and natural resources
- Static estimates for art/collectibles and intellectual property
- Total global value calculation and breakdown by category
- Easy-to-read table display of all categories
## Categories Tracked:
1. Global Stock Market
2. Global Bond Market
3. Real Estate
4. Cryptocurrencies
5. Commodities
6. Derivatives Market
7. Private Equity and Venture Capital
8. Cash and Bank Deposits
9. Insurance Markets
10. Sovereign Wealth Funds
11. OTC Markets
12. Natural Resources
13. Art and Collectibles
14. Intellectual Property
## Data Sources:
- Uses popular ETFs and indices as proxies for global markets where possible
- Incorporates data from specific company stocks to represent certain markets (e.g., CME for derivatives, OTCM for OTC markets)
- Utilizes FRED data for bank deposits
- Includes static estimates for categories without reliable real-time data sources
## Notes:
- All values are approximate and should be used for general perspective rather than precise financial analysis
- Some categories use scaled proxy data, which may not perfectly represent global totals
- Static estimates are used where real-time data is unavailable and should be updated periodically
- The total global value includes human capital but this is not displayed in the table due to its speculative nature
This indicator is designed to provide a comprehensive overview of global market value, going beyond traditional market capitalization metrics. It's ideal for traders, researchers, and anyone interested in gaining a broader understanding of global wealth distribution across various sectors.
Please note that due to the complexity of global markets and limitations in data availability, all figures should be considered estimates and used as part of a broader analysis rather than as definitive values.
Temporal Value Tracker: Inception-to-Present Inflation Lens!What we're looking at here is a chart that does more than just display the price of gold. It offers us a time-traveling perspective on value. The blue line, that's our nominal price—it's the straightforward market price of gold over time. But it's the red line that takes us on a deeper journey. This line adjusts the nominal price for inflation, showing us the real purchasing power of gold.
Now, when we talk about 'real value,' we're not just philosophizing. We're anchoring our prices to a point in time when the journey began—let's say when gold trading started on the markets, or any inception point we choose. By 'shadowing' certain years—say, from the 1970s when the gold standard was abandoned—we can adjust this chart to reflect what the inflation-adjusted price means since that key moment in history.
By doing so, we're effectively isolating our view to start from that pivotal year, giving us insight into how gold, or indeed any asset, has held up against the backdrop of economic changes, policy shifts, and the inevitable rise in the cost of living. If you're analyzing a stock index like the S&P 500, you might begin your inflation-adjusted view from the index's inception date, which allows you to measure the true growth of the market basket from the moment it started.
This adjustment isn't just academic. It influences how we perceive value and growth. Consider a period where the nominal price skyrockets. We might toast to our brilliance in investment! But if the inflation-adjusted line lags, what we're seeing is nominal growth without real gains. On the other hand, if our red line outpaces the blue even during stagnant market periods, we're witnessing real growth—our asset is outperforming the eroding effects of inflation.
Every asset class can be evaluated this way. Stocks, bonds, real estate—they all have their historical narratives, and inflation adjustment tells us if these stories are tales of genuine growth or illusions masked by inflation.
So, as informed traders and investors, we need to keep our eyes on this inflation-adjusted line. It's our measure against the silent thief that is inflation. It ensures we're not just keeping up with the Joneses of the market, but actually outpacing them, building real wealth over time

Regression Candle Conversion IndicatorHey everyone!
I got a pseudo-request a while ago for something like this, essentially the ability to track where another ticker would fall based on an alternative ticker.
I did create my ticker correlation reference indicator which directly looks at the correlation between 2 tickers. However, this is an indicator that operates on the same principle but is more pragmatic for trading.
What does it do?
Well, in keeping with the theme of what I call my indicators, this has a title that explains exactly what it does, "Regression Candle Conversion Indicator" or "RCCI" for short. It uses simple regression to convert one ticker to another. So while you are tracking one indicator, you can see where the expected value should fall on the other.
Applications?
The big application of this for me is being able to track where SPY/QQQ or IWM is falling during overnight trading sessions. Extended trading hours close at 8 pm NYSE time. After that, you have to guess where futures prices will put the ETF version of it. This indicator will allow you to track where, theoretically, the underlying ETF ticker will fall based on the current trading behaviour.
Some other applications are just the ability to track how similar or dissimilar one stock is to the other. For example, if we wanted to trade, say, Boeing using shares of DFEN or ITA (a defence specific ETF), here is what we get:
In the chart above we can see BA as the primary chart and ITA as the RCCI converted chart. We will see 2 major things that should cause us concern.
First, there is a really poor correlation between the two tickers. This indicates that ITA may not produce the best exposure if I am directly looking for Boeing exposure.
Second, there is a wide standard error. this means that the results that the RCCI is providing may be skewed up to +/- 2 points (as indicated by the standard error chart).
Let's take a look at BA and DFEN:
In the above, we can see that the correlation is not great, but the standard error is quite low.
This means that, while this may not be the best ticker for Boeing exposure, the RCCI is able to confidently calculate the ticker within +/- 0.50 cents based on BA's underlying data.
However, its important to note that it is not advisable to really rely on these results if the correlation is less than + 0.5 or greater than -0.5.
Let's take a look at a few more examples:
Above we have BA (NYSE) vs BA (NEO TSX CAD Hedged). We can see the strong relationship and high confidence calculations.
And some others:
SPX (primary) and ES1! (secondary):
RTY and IWM:
ES1! and SPY:
Customizations:
As you can see above, it is pretty straight forward. There are 3 options:
Lookback Length: Determines the length of assessment for correlation and the regression assessment.
Manual Ticker Input: The indicator will pull the data from your current chart and compare it against a manually selected indicator. You must tell the indicator which ticker you are comparing against.
Data Table: This will show you the data table which contains the standard error assessment and the correlation assessment. These are determined by your lookback length. The lookback length is defaulted to 500.
And that's the indicator! It's pretty straight forward. Hopefully you find it helpful, especially if you track futures during overnight sessions.
Leave your comments/questions and feedback below.
Thanks for checking it out!

Automated Anchored VWAPThis was reasonably easy to put together and I can't find one that does this in the Library and I've been wanting one. Of course, the drawing tool is just fantastic, but sometimes it can be forgotten as new pivots emerge.
What you'll find elsewhere in the Library is a nice variety of fancier methods for determining an anchor point with labels, lines, timestamps and standard deviations.
This is just a simple script to pull the Anchored VWAP off of the most recent pivot and update that as new pivots become defined.
I wanted it to be really portable so it could easily work into other things you're working on while also keeping the chart reasonably clean.
The way this functions is as follows: A new pivot is found and VWAP is calculated from it. At that point the prior aVWAP is no longer tracked and it picks up from the new pivot .
Of course this means that the plot doesn't generate until the pivot is actually confirmed, which in turn means that the plot doesn't reach back to the pivot , it begins based on whatever "right bars" period you end up choosing.
I kind of like it that way, because you have your eyes on the one that matters until the new one matters.
The downside is that it doesn't track old pivots . The old aVWAP might still be in play. But if you track all of the old one's you'll have a 100 lines on your chart and no one wants that.
I recommend when you look back and think the old one is still in play, use the drawing tool to keep it on the chart.
Otherwise, let the script do the work for you.
Hope its helpful. Let me know what you think should be done to make it better.

Moving Average Structure ZigZag [Stable & Filtered]
(日本語説明)
このインジケーターは、移動平均線(MA)の転換に基づき、相場の「真の構造」を可視化するために開発されました。 通常のZigZagのように価格の単純な反転に依存せず、「MAのトレンド転換 + 指定した値幅の到達」という2つの条件を用いることで、レンジ相場の細かなノイズ(ダマシ)を排除し、ダウ理論に基づいた重要な高値・安値だけを結びます。
💡 主な機能
MAタイプの切り替え: SMA, EMA, HMA, VW-HMAなど、目的に合わせたトレンド感度を選択可能。
値幅フィルター(Min Deviation): 添付画像のように、小さな値動きをカットし、大きな市場構造だけを抽出します。
価格アクションへの追従: ラインはMAの数値ではなく、期間内の実最高値・最安値を正確に結び、高値更新時には自動で延伸されます。
🛠 活用シーン
環境認識: 上位足での大きな波形を確認し、現在のフェーズを定義。
ノイズ除去: 市場の主要な節目(レジサポ候補)の特定。
ダウ理論の視覚化: 高値・安値の切り上がり・切り下がりを明確化。
(English Description)
This indicator was developed to visualize the "True Market Structure" based on Moving Average (MA) reversals. Unlike standard ZigZag which relies solely on price reversals, this tool combines MA Trend Reversals and a Minimum Deviation filter to eliminate market noise and highlight significant swing highs and lows based on Dow Theory.
💡 Key Features
Multiple MA Types: Select from SMA, EMA, HMA, VW-HMA, etc., to match your preferred trend sensitivity.
Min Deviation Filter: As shown in the attached image, it filters out minor price fluctuations to extract only the major market waves.
Price Action Tracking: The lines connect the actual High/Low prices within the period, not the MA values themselves. Lines automatically extend when a trend continues to new highs/lows.
🛠 Use Cases
Market Context: Identify major wave patterns on higher timeframes to define the current phase.
Noise Reduction: Pinpoint key market levels and potential support/resistance.
Dow Theory Visualization: Clearly visualize higher highs/lows and trend shifts.
Settings
MA Type: Choose the type of Moving Average.
Moving Average Length: The lookback period for structure.
Min Deviation (Pips): The threshold to filter noise. Adjust according to the volatility of the pair.

Options Gamma Flip Zones [BackQuant]Options Gamma Flip Zones
A market-structure style “gamma flip” mapper that builds adaptive strike-like zones, scores how price interacts with them, then promotes the strongest candidates into confirmed flip zones. Designed to highlight pinning, failed breaks, and rotational behavior without needing live options chain data.
What this indicator does
This script identifies price levels that behave like “strike magnets” during conditions that resemble options pinning, then draws dynamic zones around those levels.
Instead of assuming every round number matters, it:
Creates a strike ladder (auto or manual step).
Applies a regime filter that looks for “pin-friendly” market conditions.
Tracks and scores repeated interactions with the level.
Upgrades a zone from candidate to confirmed when enough evidence accumulates.
Invalidates zones when price achieves sustained acceptance away from them.
The output is a set of shaded boxes (zones) centered on strike-like levels, with text readouts that show the current state of each zone.
Key concept: “Gamma proxy”
A true gamma flip requires options positioning data. This indicator does not use options chain gamma.
Instead, it uses a proxy approach:
When markets have elevated volatility relative to their recent baseline AND trend strength is weak, price often behaves “sticky” around key levels.
In those conditions, repeated touches and failed escapes around a level behave similarly to pinning around strikes.
So this tool is best read as:
“Where would a strike-like magnet likely exist right now, based on price behavior and regime conditions?”
How zones are created
Zones only start forming when the script detects a pin-friendly regime.
1) Strike Ladder (level selection)
Auto Strike Step selects a step size based on current price magnitude (bigger price, bigger step).
Manual Strike Step lets you force a fixed increment.
The current “active level” is the nearest rounded level to price.
Major Level Every optionally marks major ladder levels (multiples of step).
2) Band construction (zone thickness)
Each zone is a symmetric band around the level, using one of two modes:
ATR mode scales thickness with volatility.
Percent mode scales thickness as a fraction of price.
This matters because “pin behavior” is not a single tick. It’s a region where price repeatedly probes and rejects.
Regime filter (when the script is allowed to believe in pinning)
A zone is only eligible to form and strengthen when Pin Regime is active. Pin Regime is a conjunction of:
1) IV proxy (ATR z-score)
Uses ATR as a volatility proxy.
Converts ATR% into a z-score relative to a long lookback.
IV Proxy Threshold controls how elevated volatility must be before the script considers pinning likely.
2) Weak trend requirement
The script also requires price action to be non-trending:
EMA spread must be small (fast vs slow EMA not diverging strongly).
ADX must be below a ceiling, confirming weak directional trend strength.
Interpretation:
High “IV proxy” + weak trend is where pin-like behavior is most common.
If trend is strong, zones are less meaningful because price is more likely to accept away from levels.
Flip confirmation logic (what upgrades a zone)
A zone is not “confirmed” just because price is near it once. The script builds conviction via evidence accumulation.
Evidence types:
Touches : price comes close to the level within tolerance.
Failed escapes : price pushes outside the band but closes back inside (rejection).
Acceptance run : consecutive closes outside the band, suggesting price is accepting away from the zone.
Protections:
Touch Cooldown prevents counting the same micro-chop as multiple touches.
Acceptance Bars defines what “real acceptance” means, so the zone does not get invalidated by one noisy bar.
A zone becomes confirmed when:
Touches meet the “evidence” requirement.
Failed escapes meet the “rejection” requirement.
The regime filter still says the market is pin-friendly.
That is important, it avoids promoting levels that only worked briefly in a trending tape.
Zone scoring and lifecycle
Each zone maintains a score that evolves over time. Think of score as “how much this level has recently behaved like a magnet.”
Score dynamics:
Decay per bar : score fades over time if price stops respecting the zone.
+ per touch : repeated proximity increases score.
+ per failed escape : rejections add stronger reinforcement.
- per acceptance bar : sustained trading outside reduces score.
Min score to draw : prevents clutter from weak, low-confidence zones.
Invalidation:
If the score becomes very weak AND price achieves sustained acceptance away from the zone, the zone is deleted.
This keeps the chart clean and ensures zones represent current market behavior, not ancient levels.
How to read the plot on chart
1) Zone fill and border
Each zone is drawn as a box extended to the right.
Fill opacity adapts to zone strength, strong zones are visually more prominent.
Border color encodes the current directional context and special events.
2) Bullish vs bearish coloring
A zone is colored bullish when price is currently trading above the zone’s mid-level.
A zone is colored bearish when price is currently trading below it.
This is not a trade signal by itself, it is a state cue for “which side is in control around the level.”
3) Failed escape highlighting
If price attempts to break above the band and fails, the border temporarily highlights as a failed up escape.
If price attempts to break below the band and fails, the border temporarily highlights as a failed down escape.
These are the moments where pin behavior is most visible:
Break attempt.
Immediate rejection.
Return to the band.
4) Midline (optional)
The zone midline is the strike-like level itself.
It is dotted to distinguish it from price structure lines.
5) Optional strike ladder overlay
When enabled, the script draws major and minor ladder lines near current price.
Major levels are thicker and less transparent.
This is a visualization aid for “where the algorithm is rounding,” not a prediction tool.
On-chart text readout (what the box text means)
Each box prints a compact state summary, designed for fast scanning:
Γ CANDIDATE means the zone is being tracked but not yet validated.
Γ FLIP (PROXY) means the zone has met confirmation requirements.
BULL/BEAR indicates which side price is on relative to the mid-level.
L prints the level value.
T is touch count, repeated proximity events.
F is fail count, rejected escape attempts.
IVz is the volatility proxy z-score at the moment.
ADX is the trend strength context.
Practical use cases
1) Pinning and range trading context
Confirmed zones often act like gravity wells in sideways or rotational regimes.
When price repeatedly fails to escape, fading outer edges can be reasonable context for mean reversion workflows.
2) Breakout validation
If price achieves acceptance outside the band for multiple bars, that is stronger breakout context than a single wick.
Zones that invalidate cleanly can mark transitions from pinning to directional move.
3) Time your “do nothing” periods
When Pin Regime is active and a zone is confirmed, the tape often becomes sticky and inefficient for trend chasing.
This helps avoid taking trend entries into a pin environment.
Alerts
Standalone alertconditions are included:
Zone Confirmed : a candidate becomes confirmed.
Zone Touch : price touches an active zone within tolerance.
Zone Invalidated : the zone loses relevance and is removed.
Tuning guidelines
Sensitivity vs quality
Lower Touches Needed and Failed Escapes Needed creates more zones faster, but with lower quality.
Higher values create fewer zones, but the ones that remain are more behaviorally “proven.”
Band width
ATR mode adapts to volatility and is typically safer across assets.
Percent mode is consistent visually but can feel too tight in high vol or too wide in low vol if not tuned.
Regime thresholds
If you want fewer zones, raise IV proxy threshold and tighten weak-trend filters.
If you want more zones, lower IV proxy threshold and loosen weak-trend filters.
Limitations
This is a proxy model, not live options gamma.
In strong trends, pinning assumptions can break, the regime filter is there to reduce that risk, but not eliminate it.
Auto strike step is designed for typical market ranges, manual step is recommended for niche tick sizes or custom markets.
Disclaimer
Educational and informational only, not financial advice.
Not a complete trading system.
Always validate settings per asset and timeframe.

CME Quarterly ShiftsCME Quarterly Shifts - Institutional Quarter Levels
Overview:
The CME Quarterly Shifts indicator tracks price action based on actual CME futures contract rollover dates, not calendar quarters. This indicator plots the Open, High, Low, and Close (OHLC) for each quarter, with quarters defined by the third Friday of March, June, September, and December - the exact dates when CME quarterly futures contracts expire and roll over.
Why CME Contract Dates Matter:
Institutional traders, hedge funds, and large market participants typically structure their positions around futures contract expiration cycles. By tracking quarters based on CME rollover dates rather than calendar months, this indicator aligns with how major institutional players view quarterly timeframes and position their capital.
Key Features:
✓ Automatic CME contract rollover date calculation (3rd Friday of Mar/Jun/Sep/Dec)
✓ Displays Quarter Open, High, Low, and Close levels
✓ Vertical break lines marking the start of each new quarter
✓ Quarter labels (Q1, Q2, Q3, Q4) for easy identification
✓ Adjustable history - show up to 20 previous quarters
✓ Fully customizable colors and line widths
✓ Works on any instrument and timeframe
✓ Toggle individual OHLC levels on/off
How to Use:
Quarter Open: The opening price when the new quarter begins (at CME rollover)
Quarter High: The highest price reached during the current quarter
Quarter Low: The lowest price reached during the current quarter
Quarter Close: The closing price from the previous quarter
These levels often act as key support/resistance zones as institutions reference them for quarterly performance, rebalancing, and position management.
Settings:
Display Options: Toggle quarterly break lines, OHLC levels, and labels
Max Quarters: Control how many historical quarters to display (1-20)
Colors: Customize colors for each level and break lines
Styles: Adjust line widths for OHLC levels and quarterly breaks
Best Practices:
Combine with other Smart Money Concepts (liquidity, order blocks, FVGs)
Watch for price reactions at quarterly Open levels
Monitor quarterly highs/lows as potential targets or stop levels
Use on higher timeframes (4H, Daily, Weekly) for clearer institutional perspective
Pairs well with monthly and yearly levels for multi-timeframe confluence
Perfect For:
ICT (Inner Circle Trader) methodology followers
Smart Money Concepts traders
Swing and position traders
Institutional-focused technical analysis
Traders tracking quarterly performance levels
Works on all markets: Forex, Indices, Commodities, Crypto, Stocks

PDH/PDL Breakout Pip MeasurerThe indicator tracks and measures daily breakout performance when price breaks the Previous Day's High (PDH) or Previous Day's Low (PDL). This indicator provides exact pip/point measurements of how far breakouts travel before hitting your stop-loss, with comprehensive statistics for strategy optimization.
Function
Tracks breakouts above PDH (Previous Day's High) and below PDL (Previous Day's Low)
Measures maximum distance price travels after breakout before stop-loss hit
Calculates exact pip/point gains for every breakout move
Provides statistical analysis of breakout performance over time
Identifies only first breakout of each day for clean signals
Performance Metrics
Exact pip measurement for every breakout move
Statistics table with Count, Average, Min, Max pips
Separate tracking for bullish and bearish breakouts
Historical performance accumulation over time
Active breakout monitoring in real-time
Settings
Adjustable pip multiplier - works with any instrument (Forex, indices, crypto)
Separate stop-loss settings for bull/bear breakouts
Visual control - show/hide levels, labels, table
Built-in alerts for breakout notifications

SMC Alpha Sentiment Hunter [Crypto Trade]The SMC Alpha Sentiment Hunter is an institutional-grade decision-support tool developed by the Crypto Trade community.
Unlike traditional lagging indicators, this script focuses on Smart Money Concepts (SMC) by analyzing real-time market sentiment data directly from Binance Futures.
Key Features:
- Real-time Open Interest (OI) Tracking: Confirms institutional capital flow.
- Long/Short Ratio (LSR) Analysis: Identifies retail positioning to spot "liquidity traps".
- Volume & Volatility Filters: Built-in ATR and Volume Moving Average to validate entry signals.
- Multi-Asset Compatibility: Optimized for a broad range of Binance Futures pairs on the 15-minute timeframe.
Logic:
Signals are triggered when institutional interest (OI) rises while retail traders (LSR) are caught on the wrong side of the trend, confirmed by RSI exhaustion and strong volume.
Disclaimer: For educational purposes only. Trading involves risk.
