FOMC Federal Fund Rate Tracker [MHA Finverse]The FOMC Rate Tracker is a comprehensive indicator that visualizes Federal Reserve interest rate decisions and tracks market behavior during FOMC meeting periods. This tool helps traders analyze historical rate changes and anticipate market movements around Federal Open Market Committee announcements.
Key Features:
• Visual FOMC Periods - Automatically highlights each FOMC meeting period with colored boxes spanning from announcement to the next meeting
• Complete Rate Data - Displays actual rates, forecasts, previous rates, and rate differences for every meeting from 2021-2026
• Multiple Color Modes - Choose between cycle colors for visual distinction or rate difference colors (green for hikes, red for cuts, gray for holds)
• Smart Filtering - Filter periods by rate hikes only, cuts only, no change, or surprise moves to focus on specific market conditions
• Performance Metrics - Track average returns during rate hikes, cuts, and holds to identify historical patterns
• Volatility Analysis - Measure and compare price volatility across different FOMC periods
• Statistical Dashboard - View total hikes, cuts, holds, surprises, and longest hold streaks at a glance
• Built-in Alerts - Get notified 1 day before FOMC meetings, on meeting day, or when rates change
How It Works:
The indicator divides your chart into distinct periods between FOMC meetings, with each period showing a labeled box containing the meeting date, actual rate, forecast, previous rate, and rate difference. Future meetings are marked as "UPCOMING" to help you prepare for scheduled announcements.
Use Cases:
- Analyze how markets typically react to rate hikes vs. cuts
- Identify volatility patterns around FOMC announcements
- Backtest strategies based on monetary policy cycles
- Plan trades around upcoming Federal Reserve meetings
- Study the impact of surprise rate decisions on price action
Customization Options:
- Adjustable box transparency and outlines
- Customizable label sizes and colors
- Toggle individual dashboards on/off
- Filter specific types of rate decisions
- Configure alert preferences
This indicator is ideal for traders who incorporate fundamental analysis and monetary policy into their trading decisions. The historical data provides context for understanding market reactions to Federal Reserve actions.
在腳本中搜尋"track"

Real Time UVXY Spike Level TrackerKey Features
Real Time All-Time Low Tracking: Continuously updates the ATL using daily timeframe data.
Multiple Spike Levels: Displays +20%, +50%, +75%, and +100% levels above the ATL.
Real-Time Spike Percentage: Shows current distance from ATL in an easy-to-read table.
Understanding the Chart Lines
Red Line (ATL): The all-time low baseline. This is your reference point for measuring volatility spikes.
Yellow Line (+20%): First level of moderate volatility increase. Minor market stress or routine volatility expansion.
Blue Line (+50%): Significant volatility event. Indicates elevated market concern or technical dislocation.
Purple Line (+75%): Major volatility spike. Typically coincides with substantial market selloffs or uncertainty.
Fuchsia Line (+100%): Extreme volatility event. Rare occurrences associated with market crashes, black swan events, or severe panic.
The Data Table Displays: Current Spike %: Real-time percentage showing how far price is above the ATL (highlighted in green)
Level Column: Each spike threshold level
Price Column: Exact price at each level for quick reference
Understanding UVXY spike levels is valuable for several reasons:
Market Timing & Entry/Exit Points UVXY typically experiences extreme spikes during market panics or crashes. Knowing historical spike levels helps you:
Identify extreme fear levels - When UVXY hits unusually high levels, it often signals peak panic and potential market bottoms
Avoid chasing volatility - Understanding what constitutes an "extreme" spike prevents buying in after the move is already exhausted Mean Reversion Trading
UVXY has a strong tendency to decay over time due to its leveraged structure and the contango in VIX futures. Spike levels matter because:
High probability reversals - When UVXY reaches extreme levels (say 2-3x normal), there's historically been a high probability of reversion
Risk/reward assessment - You can better evaluate whether a short position or volatility-selling strategy makes sense Leveraged ETF enthusiasts and volatility traders often use specific spike percentages as triggers to open short positions. For example, some traders might short when UVXY spikes 5-50%+ in a week or reaches certain percentage thresholds, betting on the inevitable decay back down

London Breakout Tracker - Box Style📊 London Breakout Tracker (Pine Script v6)
This script is designed to track the Asian session range and identify breakout opportunities when the London session begins. It highlights high-probability trade setups and helps avoid fakeouts or overly wide ranges.
🧱 1. Session Time Definitions (Adjusted for Kenyan Time)
The Asian session is defined as:
3:00 AM to 11:00 AM (Kenyan Time)
🔐 2. Asian Session High & Low
During the Asian session:
The script tracks the highest high and lowest low to define the range.
These are stored in variables: asianHigh and asianLow.
🧊 3. Box Drawing for the Asian Range
Once the Asian session ends:
A visual box is drawn around the session using box.new().
This box spans from the session start to end bars and from the high to low.
It helps visually see the range price must break out from.
🚨 4. Breakout Signals
After the Asian session:
A Long Breakout signal is generated if:
The candle closes above the Asian High.
A Short Breakout signal is generated if:
The candle closes below the Asian Low.
This corresponds to 00:00 to 08:00 UTC
These are shown with:
✅ Green up label for long breakouts
❌ Red down label for short breakouts
🧯 5. Fakeout Detection
If price breaks out but closes back inside the Asian range, it’s marked as a Fakeout:
Long Fakeout: Price breaks above high, then closes back below.
Short Fakeout: Price breaks below low, then closes back above.
These are marked with orange X-crosses above or below candles.
⚠️ 6. Wide Range Filter
If the Asian session range is too wide (e.g. > 40 pips), a gray background is drawn.
This warns you not to trade that day since breakouts from wide ranges are unreliable.
📣 7. Alert Conditions
The script can trigger alerts in TradingView when:
🔔 A Long or Short Breakout occurs
⚠️ A Fakeout is detected
You can set these up via the TradingView alert system.
🎯 Overall Purpose:
The script helps you:
Clearly see the Asian session range
Identify breakout opportunities at the London open
Avoid trading during fakeouts or wide-range sessions
Get alerted when breakout/fakeout conditions occur

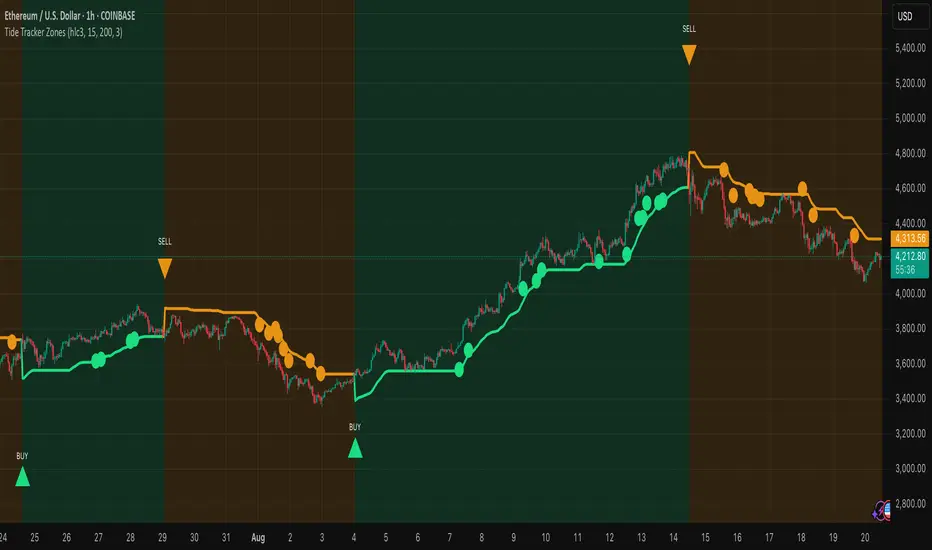
Tide Tracker ZonesTide Tracker Zones – Advanced Trend & Pullback Visualizer
Overview
Tide Tracker Zones is a sophisticated trading tool designed for traders who require clarity, precision, and actionable insights in real time. The indicator converts price action into dynamic trend zones, allowing users to instantly recognize market direction, potential reversals, and low-risk entry opportunities. By visualizing the market in this way, traders can focus on execution rather than deciphering complex charts.
Unlike static indicators, Tide Tracker Zones adapts to market volatility, providing a clear picture of bullish and bearish pressure across multiple timeframes. Its visual design, including color-coded trend zones, a prominent guide line, and carefully placed signals, ensures that market behavior is easy to interpret, making it suitable for scalping, swing trading, and longer-term strategies alike.
How It Works
The indicator relies on dynamic upper and lower bands derived from recent price ranges and a configurable multiplier. These bands expand during volatile periods and contract when price action stabilizes, creating flexible zones that reflect the dominant market tide.
A guide line tracks the active band, serving as a continuous reference for trend direction. Unlike traditional moving averages, the guide line does not clutter the chart but instead provides a subtle, intuitive indication of whether the market is in a bullish or bearish phase. Background shading reinforces this trend visually, highlighting bullish zones in one color and bearish zones in another, so the prevailing market flow is immediately clear.
The system continuously evaluates price relative to the bands to determine trend direction and detect potential reversals. When price crosses a band and flips the trend, the guide line updates, and signals are generated, providing traders with actionable information without overwhelming the chart.
Signals and Pullbacks
Tide Tracker Zones offers visual cues that make entry points more obvious and less speculative. Trend reversal arrows are plotted when the market changes direction: BUY arrows indicate a shift from bearish to bullish, and SELL arrows indicate a shift from bullish to bearish.
The indicator also highlights first pullbacks within an active trend. These pullback dots mark low-risk opportunities to enter a trend in progress, filtered to ensure that only the most relevant signals are displayed. The system uses ATR-based spacing to place arrows and dots vertically on the chart, preventing visual clutter and ensuring readability even during periods of high volatility.
Color-coded zones enhance situational awareness. Bullish zones are displayed in a customizable orange, while bearish zones are shown in green. Transparency is dynamically adjusted to maintain chart clarity while still providing a clear indication of trend strength.
Strategy Integration
Tide Tracker Zones can be used effectively for both trend-following and pullback strategies. Traders may enter positions in the direction of the guide line and colored zone, using trend reversal arrows for confirmation. First pullback dots offer tactical entries with reduced risk, allowing traders to enter a trend after a brief retracement.
Stop-loss levels can be placed just beyond the opposing trend zone, while take-profit targets may be determined using the width of the bands to account for market volatility. The indicator adapts seamlessly across multiple timeframes. Higher timeframes provide context and filter noise, while lower timeframes allow traders to refine entry timing. This makes it a versatile tool for scalping, swing trading, or longer-term positions.
Advanced Techniques
For traders seeking greater precision, Tide Tracker Zones can be combined with volume or momentum indicators to validate signals. Observing the sequence of trend arrows and pullback dots allows users to develop a systematic approach to entries and exits. Monitoring the width and behavior of the bands over time can also provide insights into periods of expanding or contracting volatility, helping traders anticipate market shifts.
Adjustments to the spread length and multiplier allow the indicator to be tuned for different assets and market conditions. By understanding the interaction between the guide line, trend zones, and pullback signals, traders can create a robust framework for decision-making, reducing guesswork and improving consistency.
Why Use Tide Tracker Zones
Tide Tracker Zones provides instant clarity and actionable insight in any market. Its dynamic zones and guide line give a clear visual understanding of trend direction, while trend reversal arrows and pullback dots highlight potential entry points. Unlike traditional indicators, it adapts to volatility and changing conditions, making it reliable across multiple asset classes and timeframes.
By combining trend detection, pullback analysis, and intuitive visual guidance, Tide Tracker Zones equips traders with a complete framework for disciplined, confident trading, transforming complex price action into a visual map of opportunity.
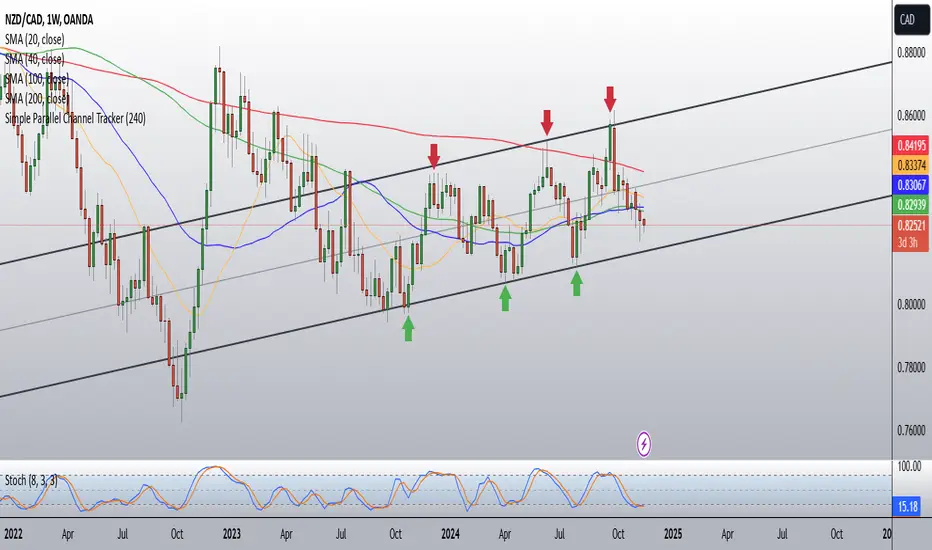
Simple Parallel Channel TrackerThis script will automatically draw price channels with two parallel trends lines, the upper trendline and lower trendline. These lines can be changed in terms of appearance at any time.
The Script takes in fractals from local and historic price action points and connects them over a certain period or amount of candles as inputted by the user. It tracks the most recent highs and lows formed and uses this data to determine where the channel begins.
The Script will decide whether to use the most recent high, or low, depending on what comes first.
Why is this useful?
Often, Traders either have no trend lines on their charts, or they draw them incorrectly. Whichever category a trader falls into, there can only be benefits from having Trend lines and Parallel Channels drawn automatically.
Trends naturally occur in all Markets, all the time. These oscillations when tracked allow for a more reliable following of Markets and management of Market cycles.
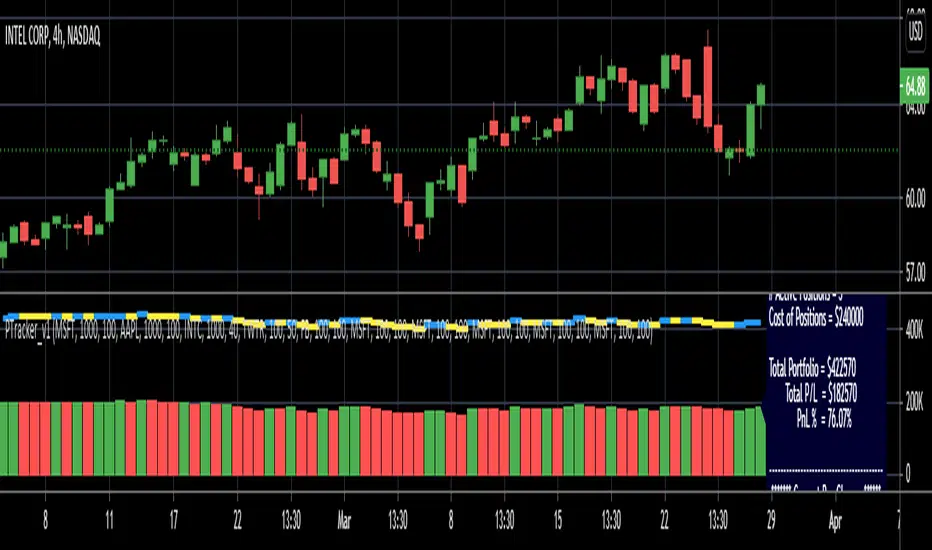
RedK Portfolio Tracker [Table Version]RedK Portfolio Tracker is a simple tool that enables a trader to monitor and track a portfolio of up to 10 holdings (+ free cash) in real time - directly on the chart
Now that we have tables in Pine, this is a table version of my previously published Portfolio Tracker
- The table works better in visualizing the various table elements (title row, column labels..etc), and is more flexible in allowing color coding of gain/loss. for many traders, myself included, these simple visual signals are valuable in helping timely trading decisions.
I'll come back and improve this script as i'm really enjoying the ability to track things this way - if you liked this and want to receive the updates, please flag / favorite it below and you'll get notified when i publish new versions.
Some new features for the table version:
- ability to change default color of various table elements (text, default background, title background, gain/loss color, border..etc)
- ability to change the text size to suit your monitor and visual preference
- ability to change table position
The "portfolio-specific" inputs are similar to the previous version - we get the ability to enter up to 10 positions, entry price and qty, then also add the free cash
- also a change from prior version, this table will plot by default on the price chart, but will have no scale - the portfolio ploy itself will also show (blue/orange stepping line) but the PnL plot will be hidden by default -- how we plot the portfolio & P/L is possibly one of the areas for improvements for next versions - also thinking of other adding valuable data i track in my own trading, like the quarterly dividends for the held positions .. we'll see - this is just a start
hope some will find this useful. feel free to comment.

Two assets correlation trackerHi, I made this simple script to see how two correlated assets are actually performing short-term. The idea comes from correlation between BTC and ETH that that usually stands 0.9 (Pearson's correlation). However Pearson's correlation doesn't indicate the relative price difference and cannot be used trading correlation when used alone.
My approach is simple - we can select the date/time from which we will start tracking the price change, and instead of tracking the price, we track 100 USD worth of BTC and ETH and how this investment perform. This gives us the price difference relative to a point in the near future, I would suggest using latest trend shift, for example.
On example of how this can be used: If we see that BTC is falling slower than ETH since trend shift, we can long BTC and short ETH in equal parts and expect to gain from the difference while hedging potential loss.

Crypto Portfolio vs BTC – Custom Blend TrackerThis tool tracks the performance of a custom-weighted crypto portfolio (SUI, BTC, SOL, DEEP, DOGE, LOFI, and Other) against BTC. Simply input your start date to anchor performance and compare your basket’s relative strength over time. Ideal for portfolio benchmarking, alt-season tracking, or macro trend validation.
Supports all timeframes. Based on BTC-relative returns (not USD). Open-source and customizable.

Smart Trend Tracker Name: Smart Trend Tracker
Description:
The Smart Trend Tracker indicator is designed to analyze market cycles and identify key trend reversal points. It automatically marks support and resistance levels based on price dynamics, helping traders better navigate market structure.
Application:
Trend Analysis: The indicator helps determine when a trend may be nearing a reversal, which is useful for making entry or exit decisions.
Support and Resistance Levels: Automatically marks key levels, simplifying chart analysis.
Reversal Signals: Provides visual signals for potential reversal points, which can be used for counter-trend trading strategies.
How It Works:
Candlestick Sequence Analysis: The indicator tracks the number of consecutive candles in one direction (up or down). If the price continues to move N bars in a row in one direction, the system records this as an impulse phase.
Trend Exhaustion Detection: After a series of directional bars, the market may reach an overbought or oversold point. If the price continues to move in the same direction but with weakening momentum, the indicator records a possible trend slowdown.
Chart Display: The indicator marks potential reversal points with numbers or special markers. It can also display support and resistance levels based on key cycle points.
Settings:
Cycle Length: The number of bars after which the possibility of a reversal is assessed.
Trend Sensitivity: A parameter that adjusts sensitivity to trend movements.
Dynamic Levels: Setting for displaying key levels.
Название: Smart Trend Tracker
Описание:
Индикатор Smart Trend Tracker предназначен для анализа рыночных циклов и выявления ключевых точек разворота тренда. Он автоматически размечает уровни поддержки и сопротивления, основываясь на динамике цены, что помогает трейдерам лучше ориентироваться в структуре рынка.
Применение:
Анализ трендов: Индикатор помогает определить моменты, когда тренд может быть близок к развороту, что полезно для принятия решений о входе или выходе из позиции.
Определение уровней поддержки и сопротивления: Автоматически размечает ключевые уровни, что упрощает анализ графика.
Сигналы разворота: Индикатор предоставляет визуальные сигналы о возможных точках разворота, что может быть использовано для стратегий, основанных на контртрендовой торговле.
Как работает:
Анализ последовательности свечей: Индикатор отслеживает количество последовательных свечей в одном направлении (вверх или вниз). Если цена продолжает движение N баров подряд в одном направлении, система фиксирует это как импульсную фазу.
Выявление истощения тренда: После серии направленных баров рынок может достичь точки перегрева. Если цена продолжает двигаться в том же направлении, но с ослаблением импульса, индикатор фиксирует возможное замедление тренда.
Отображение на графике: Индикатор отмечает точки потенциального разворота номерами или специальными маркерами. Также возможен вывод уровней поддержки и сопротивления, основанных на ключевых точках цикла.
Настройки:
Длина цикла (Cycle Length): Количество баров, после которых оценивается возможность разворота.
Фильтрация тренда (Trend Sensitivity): Параметр, регулирующий чувствительность к трендовым движениям.
Уровни поддержки/сопротивления (Dynamic Levels): Настройка для отображения ключевых уровней.

Unfilled Gaps TrackerIndicator Description: Unfilled Gaps Tracker
Overview:
The Unfilled Gaps Tracker is a powerful TradingView indicator designed to identify and visualize unfilled gaps on a price chart. This indicator highlights bullish and bearish gaps with continuous horizontal bars, helping traders quickly identify potential areas of support and resistance.
Features:
Gap Detection: Automatically detects bullish gaps (where the current low is higher than the previous close) and bearish gaps (where the current high is lower than the previous close).
Continuous Visualization: Displays gaps as horizontal bars extending to the most recent candle. Bullish gaps are filled with green, and bearish gaps are filled with red.
Single Label per Gap: Each gap is labeled once, ensuring a clean and uncluttered chart. Labels move with the gap's right edge as new bars are added.
Dynamic Updates: Gaps are dynamically updated, and the visualization adjusts as new bars are added. Gaps are removed from the chart once they are filled by subsequent price action.
Multiple Gaps: Tracks multiple gaps simultaneously, providing a comprehensive view of unfilled gaps over time.
Usage:
Adding the Indicator:
To add the Unfilled Gaps Tracker to your chart, search for "Unfilled Gaps Tracker" in the TradingView indicators menu and apply it to your desired chart.
Interpreting the Indicator:
Bullish Gaps: Represented by green horizontal bars with the label "Bull Gap." These indicate areas where the price gapped up, potentially acting as future support levels.
Bearish Gaps: Represented by red horizontal bars with the label "Bear Gap." These indicate areas where the price gapped down, potentially acting as future resistance levels.
Trading Strategy:
Use the identified gaps to inform your trading strategy. Unfilled bullish gaps can be potential buy zones, while unfilled bearish gaps can be potential sell zones.
Monitor how the price interacts with these gaps. A gap fill (where the price moves back to close the gap) can provide valuable trading signals.

Consolidation Tracker🧭 Consolidation Tracker — Visualize Market Reversals in Real Time
The Consolidation Tracker is a minimalist yet powerful tool designed to map the anatomy of market reversals and trend transitions. It highlights the structural evolution of price through four key phases, helping traders anticipate shifts with clarity and confidence.
🔄 The Four Stages of a Market Reversal:
Failure to Displace — Price fails to break beyond recent highs or lows, signaling potential exhaustion of the current trend.
Consolidation (CAMP) — A range-bound phase where price compresses between a dynamic high and low. These zones are shaded gray, representing indecision and balance.
Engulfing (ENGULF) — A decisive candle closes beyond the CAMP high or low, suggesting a directional shift. These are highlighted in orange.
Fair Value Gap (FVG) — A three-candle pattern forms a price imbalance. If this FVG also engulfs the CAMP range, it confirms the reversal and resets the CAMP. Bullish FVGs are shaded green, bearish FVGs in red.
🔁 From Reversal to Trend:
Once a reversal is confirmed via an FVG, the market often transitions into a trend cycle characterized by:
Displacement — Strong directional movement away from the prior range.
Fair Value Gaps — Continuation imbalances that offer high-probability entries on retracements.
🧠 How It Works:
The indicator dynamically tracks CAMP highs and lows, updating only when a candle engulfs the range or a valid FVG forms.
FVGs are detected when a three-candle sequence creates a gap between candle 2 and 0, and the middle candle (candle 1) breaks the CAMP boundary.
CAMP levels are plotted as horizontal lines, while background colors narrate the evolving structure in real time.
This tool is ideal for traders who value market structure, price efficiency, and narrative clarity. Whether you're anticipating reversals or riding trends, the Consolidation Tracker offers a clean, actionable lens into price behavior.

GME Bond Tracker [theUltimator5]This indicator tracks when GME 0.0% convertible notes, ticker GME6042202 sees trade volume and plots it on the chart.
This indicator is used to track bond-equity arbitrage between GME and the convertible notes. When the bonds trade, there is generally a large qualified contingent trade block at the same time, so the underlying stock volume can be matched against the bond trading.
This is used to help predict future movements of GME, as well as perform trend and reaction analysis on the bond/equity arbitrage events.

Stock Highs Tracker with IndicesThis Pine Script indicator tracks stock highs and compares them with major indices (Nifty, Nifty 500, CNX-SmallCap, and CNX-MidCap). Here’s what it does:
1. Retrieves and Displays Key Price Metrics
All-Time High (ATH): The highest price the stock has ever reached.
52-Week High: The highest price in the last 252 trading days.
Current Price: The stock’s closing price.
2. Calculates Percentage Differences
% from ATH: How much the stock is below its all-time high.
% from 52WKH: How much the stock is below its 52-week high.
3. Fetches and Compares with Indices
It retrieves similar metrics (ATH, 52-Week High, Current Price, % from ATH, % from 52WKH) for:
Nifty 50
Nifty 500
CNX-SmallCap
CNX-MidCap
This helps in assessing whether the stock's movement aligns with broader market trends.
4. Displays Data in a Table
The script creates a table positioned at the top-right corner.
It color-codes different rows for easy readability.
The table compares the stock’s performance against the major indices.
Use Case
Helps traders and investors track stock highs relative to market indices.
Identifies whether the stock is outperforming or underperforming the broader market.

Optimized Trend Tracker Oscillator OTTOOTTO - Optimized Trend Tracker Oscillator is a derivative of Anıl Özekşi's OTT - Optimized Trend Tracker:
It is more sensitive to price movements when compared to its ancestor OTT.
There are 2 more parameters of VIDYA moving average lengths FAST and SLOW.
Fast VIDYA has length of 10 bars and Slow VIDYA has 25.
Correction Constant is a crucial parameter to make the calculation more stable.
you can use 1000 to 100000000 by the powers of ten to obtain more accurate graphic values.
Buy and Sell signals make indicator more meaningful.

Goal Setting Strategies Viprasol# 🎯 Goal Setting Strategies Viprasol
A powerful goal tracking tool designed for disciplined traders who want to monitor their trading objectives, milestones, and progress directly on their charts.
## ✨ KEY FEATURES
### 📊 Flexible Goal Management
- Track anywhere from 1 to 20 trading goals simultaneously
- Adjustable goal count via simple input slider
- Each goal has its own unique emoji identifier
- Real-time progress counter
### ✅ Visual Tracking System
- Interactive checkbox system for goal completion
- Clear visual indicators (✅ completed, ⬜️ pending)
- Customizable goal names and descriptions
- Dynamic progress display
### 🎨 Full Customization
- **4 Position Options**: Top Left, Top Right, Bottom Left, Bottom Right
- **5 Font Sizes**: Tiny, Small, Normal, Large, Huge (optimized for all screen sizes)
- **Custom Colors**: Header, labels, background, achievement text
- **Premium Styling**: Modern cyber-themed design with professional appearance
### 💡 Perfect For:
- Daily/Weekly trading goal tracking
- Risk management milestones
- Profit target monitoring
- Trading plan compliance
- Personal development objectives
- Learning milestones
## 🔧 HOW TO USE
1. **Set Your Primary Goal**: Enter your main objective in "Primary Goal" field
2. **Choose Goal Count**: Select how many goals you want (1-20)
3. **Name Your Goals**: Customize each goal name in the "Goal Definitions" section
4. **Track Progress**: Check off goals as you complete them
5. **Customize Display**: Adjust colors, sizes, and position to match your chart setup
## 📐 INPUT GROUPS
### 🎯 Viprasol Goal Configuration
- Primary Goal Name
- Number of Goals (1-20)
### 📋 Goal Definitions
- All 20 goals with individual names and checkboxes
- Only enabled goals (based on count) will display
### 🌈 Premium Styling
- Goal Header Color
- Label Color
- Panel Background Color
- Achievement Color
- Header Font Size
- Milestone Font Size (Tiny/Small optimized for space)
### 📍 Elite Display
- Dashboard Position selector
## 💎 UNIQUE FEATURES
- **Space Efficient**: Tiny and Small font options for compact displays
- **Scalable**: Grow from 1 goal to 20 as your needs evolve
- **Non-Intrusive**: Overlay indicator that doesn't interfere with price action
- **Professional Design**: Clean, modern interface with cyber aesthetic
## 🎓 USE CASES
**Day Traders**: Track daily profit targets, trade count limits, max loss thresholds
**Swing Traders**: Monitor weekly/monthly goals, position management rules
**New Traders**: Learning milestones, strategy development checkpoints
**Experienced Traders**: Advanced risk management, portfolio objectives
## ⚙️ TECHNICAL DETAILS
- Version: Pine Script v5
- Type: Overlay Indicator
- Max Labels: 500
- Table-based display system
- No repainting
- Lightweight performance
## 🚀 GETTING STARTED
1. Add indicator to your chart
2. Set "Number of Goals" to your desired count (start small, scale up)
3. Customize goal names
4. Check boxes as you achieve goals
5. Watch your progress build!
## 📊 DISPLAY OPTIMIZATION
- Use "Tiny" or "Small" for maximum goals on small screens
- Use "Normal" or "Large" for standard monitors
- Use "Huge" for presentation or large displays
- Adjust position to avoid chart overlap
## 🎯 TRADING DISCIPLINE
This tool helps reinforce:
- Goal-oriented trading mindset
- Progress tracking accountability
- Milestone celebration
- Structured approach to trading development
---
**© viprasol**
*Designed for traders who take their goals seriously.*

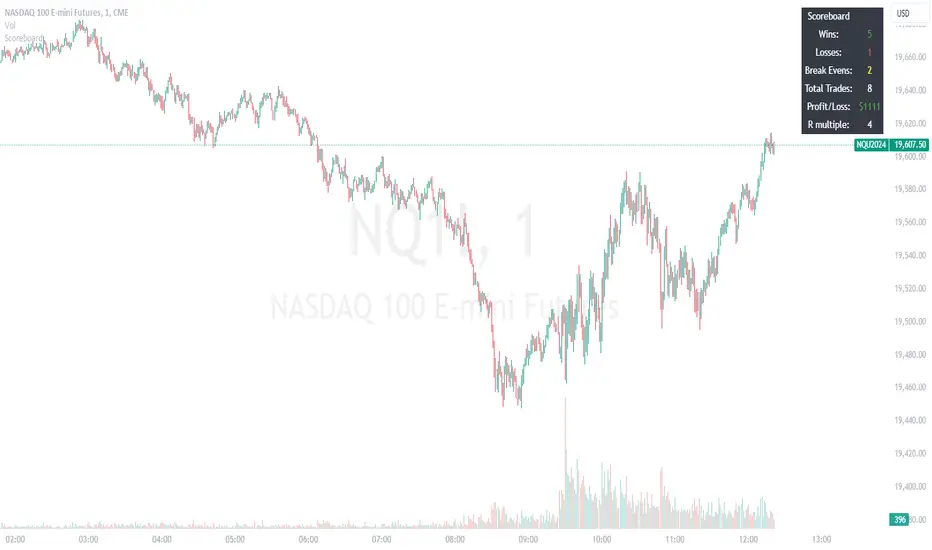
Trade ScoreboardManually track your trade record and display your results in a handy table. Good for backtesting and for making a manual ritual out of tracking your trades. This way you are less likely to overtrade during your session. This can also nice as an addendum to your charts, to show off your results and record them for later review.
Heikin Ashi and Optimized Trend Tracker and PVSRA [Erebor]Heikin Ashi Candles
Let's consider a modification to the traditional “Heikin Ashi Candles” where we introduce a new parameter: the period of calculation. The traditional HA candles are derived from the open , high low , and close prices of the underlying asset.
Now, let's introduce a new parameter, period, which will determine how many periods are considered in the calculation of the HA candles. This period parameter will affect the smoothing and responsiveness of the resulting candles.
In this modification, instead of considering just the current period, we're averaging or aggregating the prices over a specified number of periods . This will result in candles that reflect a longer-term trend or sentiment, depending on the chosen period value.
For example, if period is set to 1, it would essentially be the same as traditional Heikin Ashi candles. However, if period is set to a higher value, say 5, each candle will represent the average price movement over the last 5 periods, providing a smoother representation of the trend but potentially with delayed signals compared to lower period values.
Traders can adjust the period parameter based on their trading style, the timeframe they're analyzing, and the level of smoothing or responsiveness they prefer in their candlestick patterns.
Optimized Trend Tracker
The "Optimized Trend Tracker" is a proprietary trading indicator developed by TradingView user ANIL ÖZEKŞİ. It is designed to identify and track trends in financial markets efficiently. The indicator attempts to smooth out price fluctuations and provide clear signals for trend direction.
The Optimized Trend Tracker uses a combination of moving averages and adaptive filters to detect trends. It aims to reduce lag and noise typically associated with traditional moving averages, thereby providing more timely and accurate signals.
Some of the key features and applications of the OTT include:
• Trend Identification: The indicator helps traders identify the direction of the prevailing trend in a market. It distinguishes between uptrends, downtrends, and sideways consolidations.
• Entry and Exit Signals: The OTT generates buy and sell signals based on crossovers and direction changes of the trend. Traders can use these signals to time their entries and exits in the market.
• Trend Strength: It also provides insights into the strength of the trend by analyzing the slope and momentum of price movements. This information can help traders assess the conviction behind the trend and adjust their trading strategies accordingly.
• Filter Noise: By employing adaptive filters, the indicator aims to filter out market noise and false signals, thereby enhancing the reliability of trend identification.
• Customization: Traders can customize the parameters of the OTT to suit their specific trading preferences and market conditions. This flexibility allows for adaptation to different timeframes and asset classes.
Overall, the OTT can be a valuable tool for traders seeking to capitalize on trending market conditions while minimizing false signals and noise. However, like any trading indicator, it is essential to combine its signals with other forms of analysis and risk management strategies for optimal results. Additionally, traders should thoroughly back-test the indicator and practice using it in a demo environment before applying it to live trading.
PVSRA (Price, Volume, S&R Analysis)
“PVSRA” (Price, Volume, S&R Analysis) is a trading methodology and indicator that combines the analysis of price action, volume, and support/resistance levels to identify potential trading opportunities in financial markets. It is based on the idea that price movements are influenced by the interplay between supply and demand, and analyzing these factors together can provide valuable insights into market dynamics.
Here's a breakdown of the components of PVSRA:
• Price Action Analysis: PVSRA focuses on analyzing price movements and patterns on price charts, such as candlestick patterns, trendlines, chart patterns (like head and shoulders, triangles, etc.), and other price-based indicators. Traders using PVSRA pay close attention to how price behaves at key support and resistance levels and look for patterns that indicate potential shifts in market sentiment.
• Volume Analysis: Volume is an essential component of PVSRA. Traders monitor changes in trading volume to gauge the strength or weakness of price movements. An increase in volume during a price move suggests strong participation and conviction from market participants, reinforcing the validity of the price action. Conversely, low volume during price moves may indicate lack of conviction and potential reversals.
• Support and Resistance (S&R) Analysis: PVSRA incorporates the identification and analysis of support and resistance levels on price charts. Support levels represent areas where buying interest is expected to be strong enough to prevent further price declines, while resistance levels represent areas where selling interest may prevent further price advances. These levels are often identified using historical price data, trendlines, moving averages, pivot points, and other technical analysis tools.
The PVSRA methodology combines these three elements to generate trading signals and make trading decisions. Traders using PVSRA typically look for confluence between price action, volume, and support/resistance levels to confirm trade entries and exits. For example, a bullish reversal signal may be considered stronger if it occurs at a significant support level with increasing volume.
It's important to note that PVSRA is more of a trading approach or methodology rather than a specific indicator with predefined rules. Traders may customize their analysis based on their preferences and trading style, incorporating additional technical indicators or filters as needed. As with any trading strategy, risk management and proper trade execution are essential components of successful trading with PVSRA.
The following types of moving average have been included: "SMA", "EMA", "SMMA (RMA)", "WMA", "VWMA", "HMA", "KAMA", "LSMA", "TRAMA", "VAR", "DEMA", "ZLEMA", "TSF", "WWMA". Thanks to the authors.
Thank you for your indicator “Optimized Trend Tracker”. © kivancozbilgic
Thank you for your indicator “PVSRA Volume Suite”. © creengrack
Thank you for your programming language, indicators and strategies. © TradingView
Kind regards.
© Erebor_GIT

Portfolio Tracker For Stocks & CryptoThis is a portfolio tracker that will track individual, overall and daily profit/loss for up to 12 assets. You can set the size of your buys and price of your buys for accurate, up to date profit and loss data right on your chart. It works on all markets and timeframes.
HOW TO USE
Go into the indicator settings and you will see all of the available settings. The first is the ability to turn the tracker info table on or off from the chart, so it saves your portfolio info but let’s you remove it from the chart while trading. Second is the option to move the position of the info table to suit your preference.
Next we get into setting up your portfolio tickers, order size and price. Each ticker lets you set which stock/crypto you bought, then set how much you purchased and then what price you purchased them at.
Go through and set up all of your assets and then turn off any tickers that you don’t need. Once that is all done, your portfolio will be shown on the chart with all the data.
FEATURES
Top Section
The portfolio tracker has 2 sections. The top section shows each ticker in your portfolio individually with the following data:
- Ticker Name
- Weight of that asset compared to your total portfolio in %
- Current value of that position in $
- Profit or loss value from purchase price in %
- Todays change in value from yesterday’s close in %
The $ Value, PnL % and Today % will all change colors from green to red depending if they are in profit or not.
Bottom Section
The bottom section of the tracker will give you info for your portfolio as a whole. It has the following data:
- Total cost of your entire portfolio in $
- Current value of your entire portfolio in $
- Current profit or loss of your entire portfolio in $
- Current profit or loss of your entire portfolio in %
- Todays change of your entire portfolio value compared to yesterday’s close in %
The $ Value, PnL $, PnL % and Today % will all change colors from green to red depending if they are in profit or not.

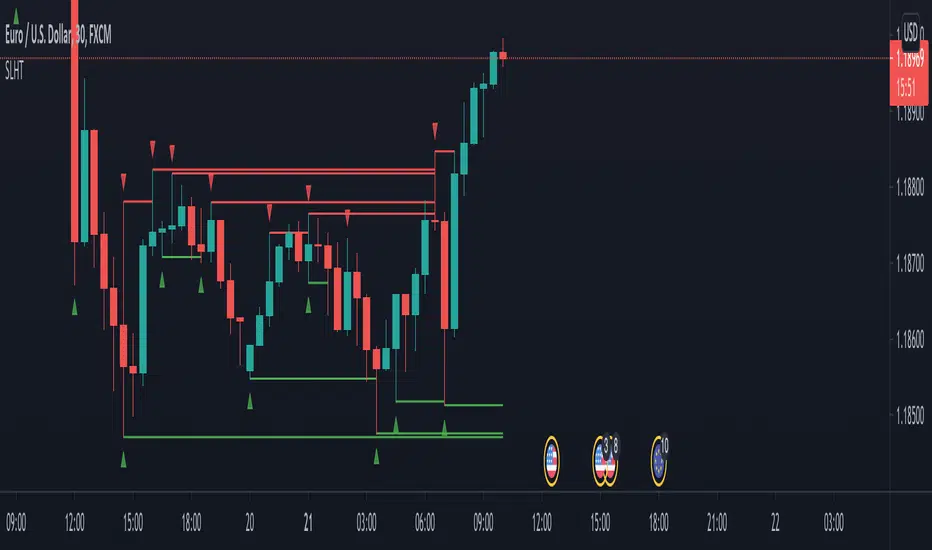
SL Hunter Tracker SL Hunter Tracker
coded by Bogdan Vaida
SL Hunter Tracker is a meticulous hunter that tracks SL hunters.
First it plots the fractals on the chart, then it draws lines from them
to the last wick that touched that height. You can add sweep alerts, once
per bar close, so that you get notified when a wick was touched.
Tested on: EURUSD 30'
USDT.D Volatility TrackerUSDT.D Volatility Tracker
Description:
This script is designed to track the volatility of USDT.D (US Dollar in cryptocurrency) on the TradingView platform. It uses a moving average and deviation from it to generate buy and sell signals, helping traders visualize changes in volatility and make informed decisions.
Input Parameters:
maPeriod: The period of the moving average (default 120). This parameter allows users to adjust the length of the period used to calculate the moving average.
devThreshold: The deviation threshold (default 0.6). This parameter defines the level of deviation that will trigger buy or sell signals.
Data Request:
The script requests closing data for USDT.D using the request.security function, allowing it to retrieve up-to-date data on the selected timeframe.
Moving Average and Deviation Calculation:
An exponential moving average (EMA) is used to calculate the deviation from the moving average, enabling the identification of current volatility.
Deviation Line Display:
The deviation rate line is displayed on the chart, allowing users to visually track changes in volatility.
Signal Generation:
If the deviation exceeds the set threshold (devThreshold), a buy signal is generated (green background).
If the deviation falls below the negative threshold (-devThreshold), a sell signal is generated (red background).
Visual Signals:
Buy signals are displayed on the chart as green triangles, while sell signals are displayed as red triangles. This helps traders quickly identify potential entry and exit points.

Systematic Investment Tracker by Ceyhun Gonul### English Description
**Systematic Investment Tracker with Enhanced Features**
This script, titled **Systematic Investment Tracker with Enhanced Features**, is a TradingView tool designed to support systematic investments across different market conditions. It provides traders with two customizable investment strategies — **Continuous Buying** and **Declining Buying** — and includes advanced dynamic investment adjustment features for each.
#### Detailed Explanation of Script Features and Originality
1. **Two Investment Strategies**:
- **Continuous Buying**: This strategy performs purchases consistently at each interval, as set by the user, regardless of market price changes. It follows the principle of dollar-cost averaging, allowing users to build an investment position over time.
- **Declining Buying**: Unlike Continuous Buying, this strategy triggers purchases only when the asset's price has declined from the previous interval's closing price. This approach helps users capitalize on lower price points, potentially improving average costs during downward trends.
2. **Dynamic Investment Adjustment**:
- For both strategies, the script includes a **Dynamic Investment Adjustment** feature. If enabled, this feature increases the purchasing amount by 50% if the current price has fallen by a specific user-defined percentage relative to the previous price. This allows users to accumulate a larger position when the asset is declining, which may benefit long-term cost-averaging strategies.
3. **Customizable Time Frames**:
- Users can specify a **start and end date** for investment, allowing them to restrict or backtest strategies within a specific timeframe. This feature is valuable for evaluating strategy performance over specific market cycles or historical periods.
4. **Graphical Indicators and Labels**:
- The script provides graphical labels on the chart that display purchase points. These indicators help users visualize their investment entries based on the strategy selected.
- A summary **performance label** is also displayed, providing real-time updates on the total amount spent, accumulated quantity, average cost, portfolio value, and profit percentage for each strategy.
5. **Language Support**:
- The script includes English and Turkish language options. Users can toggle between these languages, allowing the summary label text and descriptions to be displayed in their preferred language.
6. **Performance Comparison Table**:
- An optional **Performance Comparison Table** is available, offering a side-by-side analysis of net profit, total investment, and profit percentage for both strategies. This comparison table helps users assess which strategy has yielded better returns, providing clarity on each approach's effectiveness under the chosen parameters.
#### How the Script Works and Its Uniqueness
This closed-source script brings together two established investment strategies in a single, dynamic tool. By integrating continuous and declining purchase strategies with advanced settings for dynamic investment adjustment, the script offers a powerful, flexible tool for both passive and active investors. The design of this script provides unique benefits:
- Enables automated, systematic investment tracking, allowing users to build positions gradually.
- Empowers users to leverage declines through dynamic adjustments to optimize average cost over time.
- Presents an easy-to-read performance label and table, enabling an efficient and transparent performance comparison for informed decision-making.
---
### Türkçe Açıklama
**Gelişmiş Özellikli Sistematik Yatırım Takipçisi**
**Gelişmiş Özellikli Sistematik Yatırım Takipçisi** adlı bu TradingView scripti, çeşitli piyasa koşullarında sistematik yatırım stratejilerini desteklemek üzere tasarlanmış bir araçtır. Script, kullanıcıya iki özelleştirilebilir yatırım stratejisi — **Sürekli Alım** ve **Düşen Alım** — ve her strateji için gelişmiş dinamik yatırım ayarlama seçenekleri sunar.
#### Script Özelliklerinin Detaylı Açıklaması ve Özgünlük
1. **İki Yatırım Stratejisi**:
- **Sürekli Alım**: Bu strateji, fiyat değişimlerine bakılmaksızın kullanıcının belirlediği her aralıkta sabit bir miktar yatırım yapar. Bu yaklaşım, uzun vadede pozisyonu kademeli olarak oluşturmak isteyenler için idealdir.
- **Düşen Alım**: Sürekli Alım’ın aksine, bu strateji yalnızca fiyat bir önceki aralığın kapanış fiyatına göre düştüğünde alım yapar. Bu yöntem, yatırımcıların daha düşük fiyatlardan alım yaparak ortalama maliyeti potansiyel olarak iyileştirmelerine yardımcı olur.
2. **Dinamik Yatırım Ayarlaması**:
- Her iki strateji için de **Dinamik Yatırım Ayarlaması** özelliği bulunmaktadır. Bu özellik aktif edildiğinde, mevcut fiyatın bir önceki fiyata göre kullanıcı tarafından belirlenen bir yüzde oranında düşmesi durumunda alım miktarını %50 artırır. Bu durum, uzun vadede maliyet ortalaması stratejilerine katkıda bulunur.
3. **Özelleştirilebilir Tarih Aralığı**:
- Kullanıcılar, yatırımı belirli bir tarih aralığında sınırlandırmak veya test etmek için bir **başlangıç ve bitiş tarihi** belirleyebilir. Bu özellik, strateji performansını geçmiş piyasa döngüleri veya belirli dönemlerde değerlendirmek için kullanışlıdır.
4. **Grafiksel İşaretleyiciler ve Etiketler**:
- Script, grafik üzerinde alım noktalarını gösteren işaretleyiciler sağlar. Bu görsel göstergeler, kullanıcıların seçilen stratejiye göre yatırım girişlerini görselleştirmesine yardımcı olur.
- Ayrıca, her strateji için harcanan toplam tutar, biriken miktar, ortalama maliyet, portföy değeri ve kâr yüzdesi gibi bilgileri gerçek zamanlı olarak gösteren bir **performans etiketi** sunar.
5. **Dil Desteği**:
- Script, İngilizce ve Türkçe dillerini desteklemektedir. Kullanıcılar, performans etiketi metninin ve açıklamalarının tercih ettikleri dilde görüntülenmesi için dil seçimini yapabilir.
6. **Performans Karşılaştırma Tablosu**:
- İsteğe bağlı olarak kullanılabilen bir **Performans Karşılaştırma Tablosu**, her iki strateji için net kâr, toplam yatırım ve kâr yüzdesi gibi bilgileri yan yana analiz eder. Bu tablo, kullanıcıların hangi stratejinin daha yüksek getiri sağladığını değerlendirmesine yardımcı olur.
#### Scriptin Çalışma Prensibi ve Özgünlüğü
Bu script, iki yatırım stratejisini gelişmiş bir araçta birleştirir. Sürekli ve düşen fiyatlara dayalı alım stratejilerini dinamik yatırım ayarlama özelliğiyle entegre ederek yatırımcılar için güçlü ve esnek bir çözüm sunar. Script’in tasarımı aşağıdaki benzersiz faydaları sağlamaktadır:
- Otomatik, sistematik yatırım takibi yaparak kullanıcıların pozisyonlarını kademeli olarak oluşturmalarına olanak tanır.
- Dinamik ayarlama ile düşüşlerden yararlanarak zaman içinde ortalama maliyeti optimize etme olanağı sağlar.
- Her iki stratejinin performansını basit ve anlaşılır bir şekilde karşılaştıran etiket ve tablo ile verimli bir performans değerlendirmesi sunar.

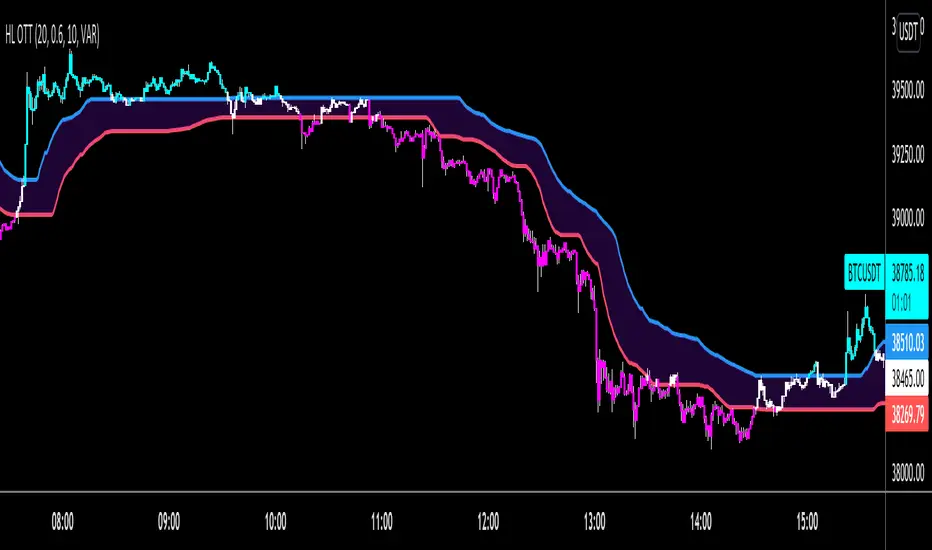
HIGH and LOW Optimized Trend Tracker HOTT LOTTAnıl Özekşi's latest development on his precious OTT - Optimized Trend Tracker:
In this version, there are two lines of OTT which are derived from HIGHEST price values (HOTT) and LOVEST price values (LOTT) which were originally sourced to CLOSE values on default OTT.
Another significant difference is there is no Support Line (Moving Average) in this version.
The area between HOTT and LOTT is FLAT ZONE which developer advises to do nothing.
Bars will be highlighted to Turquoise when candles close over HOTT, means an UPTREND SIGNAL
and to Fuchia when candles begin closing under LOTT line to indicate a DOWNTREND SIGNAL.
FLAT ZONE is highlighted also to have the maximum concentration on sideways market conditions.
There are three quantitative parameters in this indicator:
The first parameter in the OTT indicator set by the two parameters is the period/length.
OTT lines will be much sensitive to trend movements if it is smaller.
And vice versa, will be less sensitive when it is longer.
As the period increases it will become less sensitive to little trends and price actions.
In this way, your choice of period, will be closely related to which of the sort of trends you are interested in.
The OTT percent parameter in OTT is an optimization coefficient. Just like in the period
small values are better at capturing short term fluctuations, while large values
will be more suitable for long-term trends.
The final adjustable quantitative parameter is HIGHEST and LOWEST length which is the source of calculations.
Anıl Özekşi generally works on 1 minute charts so I personally advise traders to optimize parameters to have more accurate signals. Just concentrate on FLAT price zones and indicator will do the rest in trends.
Built in Moving Average type defaultly set as VAR but users can choose from 10 different Moving Average types like:
SMA : Simple Moving Average
EMA : Exponential Moving Average
DEMA : Double Exponential Moving Average
WMA : Weighted Moving Average
TMA : Triangular Moving Average
VAR : Variable Index Dynamic Moving Average a.k.a. VIDYA
WWMA : Welles Wilder's Moving Average
ZLEMA : Zero Lag Exponential Moving Average
TSF : True Strength Force
HULL : Hull Moving Average
Simple Portfolio TrackerThis is just a simple portfolio tracker that i started to play around with - i'm sure there are smarter ways to do this, but i chose the simpler way :) -- please feel free to use this, or consider it as a starting point to your own indicator.
i will come back later and add some more stuff once i get time. for example, show the total value, recent change, P&L % ..etc
So the simple idea is to track a portfolio of few positions and watch how the total portfolio and the PnL changes over time as the price of the individual holdings move up and down. it can be added to any chart.
The code is currently set to track 5 positions - settings allow to enter if the positions is used or not, symbol, amount and cost price..
** note: more positions can be added by editing the code and copying and pasting the marked "position block" that contains the input statements and the calculations, then changing/replacing the position identifier (_1, _2, ..etc) in all variables with new number..
--- don't forget to add these extra positions you insert in the code to the formula lines that calculate the totals
i tried to make this as easy as possible in the code. the code includes a sample portfolio as default values just to help "demo" how this works
the input is made easy, thanks to the recent addition of the "inline" feature in the input() statement
i don't know if some traders will find this useful ?? or if more about how to use it is needed.. let me know in the comments.. as i mentioned, i was just playing with the idea over the weekend so didn't really put a lot of work into it.
Credits and thanks to @boji1 for inspiring this :)