Consecutive Green Candles + 20% Move ScreenerConsecutive Green Candles Momentum Tracker
This indicator identifies powerful bullish momentum streaks in stocks, highlighting opportunities where consistent buying pressure has driven significant price increases.
The script tracks sequences of consecutive green (bullish) candles that collectively move a stock's price by more than 20%. It marks both the beginning of such streaks with a green label and their conclusion with a red arrow when price momentum finally reverses.
Perfect for traders looking to:
- Identify stocks experiencing strong directional momentum
- Spot potential reversal points after extended rallies
- Screen for securities with recent bullish strength
- Understand the magnitude of recent price runs
Simply adjust the minimum number of candles and percentage threshold to match your preferred momentum criteria.
在腳本中搜尋"track"

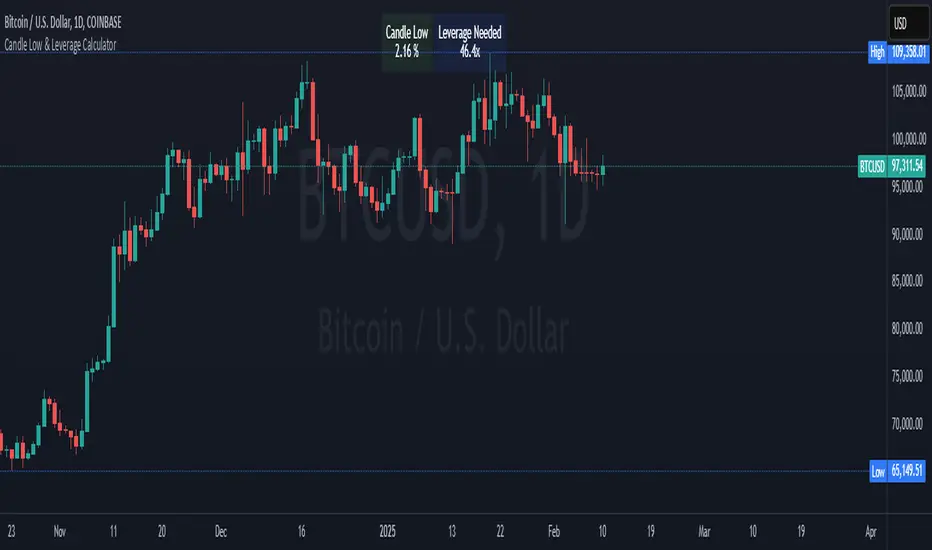
Crypto Candle Low Leverage TrackerCrypto Candle Low Leverage Tracker
The Candle Low Leverage Indicator is a powerful tool for long position traders seeking to manage risk effectively when using leverage. By evaluating the current candle's low price, this indicator helps traders make more informed decisions about potential entry points, stop losses, and leverage levels. The indicator matches the low of the candle to the leverage needed for liquidation, giving you a clear view of how leverage impacts your position.
This indicator provides two critical insights:
% from Candle Low: Tracks how much the price has moved from the low of the current candle. For long position traders, this percentage is crucial for understanding how far the price has come off the low and deciding whether it’s safe to enter a position or if further price action is needed.
Leverage Needed: Estimates the leverage required to reach the candle's low as the liquidation price. Long traders can use this information to adjust leverage to a safer level, ensuring they don’t overexpose themselves to liquidation risks by matching leverage to the candle’s low.
Key Features:
Customizable table positioning (top, middle, bottom).
Toggle options to show/hide % from Candle Low and Leverage Needed.
Visual indicators with color changes: green for positive change, red for negative change, and blue for leverage requirements.
Ideal for long traders, this tool helps evaluate market conditions, manage risks, and calculate the best leverage to use in long trades, ensuring that leverage aligns with the candle’s low to prevent unnecessary liquidations.
Market Cap & Volume Tracker with TrendsMarket Cap & Volume Tracker with Trends
This indicator provides a compact, at-a-glance view of key market data directly on your chart, specifically focusing on Market Cap, Volume, and Volume Trends over various time intervals. It helps traders and investors monitor price action and volume shifts in real-time.
Key Features:
Market Cap: Displays the market capitalization of the selected asset, calculated as the Close Price multiplied by Volume, and formatted in Millions (M).
Volume Data: Shows the volume for:
Pre-market (the volume before the main market session starts)
Current Volume (real-time volume during the current session)
After-hours Volume (volume traded after the market closes)
All volumes are formatted in Thousands (K) for easy readability.
Volume Trends: Monitors volume movement across multiple time intervals:
15-Minutes
30-Minutes
45-Minutes
1 Hour
The indicator tracks whether the volume is Increasing or Decreasing in each of these time frames to help identify trends and potential market shifts.
Customization:
Easily adjustable colors for the table background, text, and header for clear visibility and user preferences.
Option to choose the display position of the table (top or bottom right corner).
Use Case:
This indicator is ideal for traders who want quick insights into the market's activity without the need to look at multiple charts or external data points. It helps spot volume changes and trends over various time frames and supports decision-making for entries, exits, and overall market sentiment.

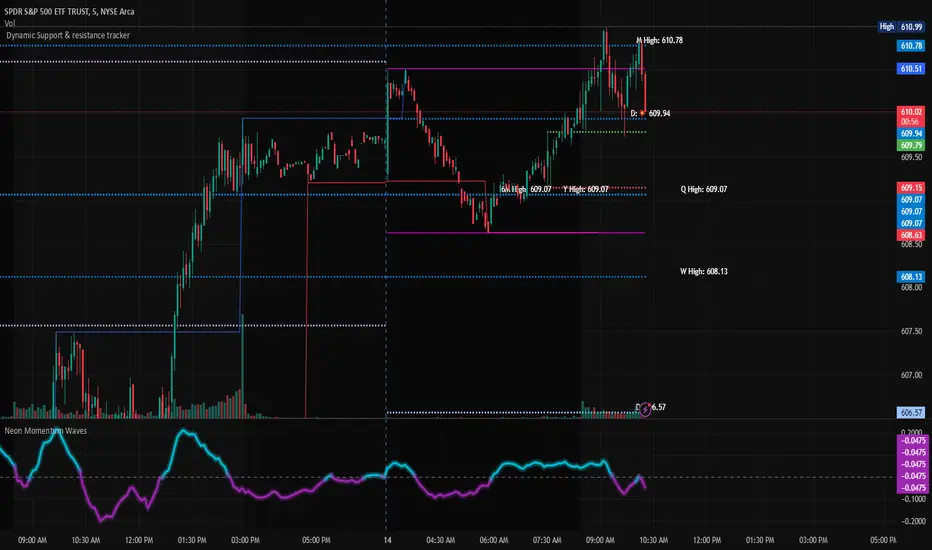
Dynamic Support & Resistance TrackerThe "Dynamic Support & Resistance Tracker" is a powerful Pine Script study designed to identify and visualize key support and resistance levels on a trading chart. This study dynamically adjusts to market conditions, providing traders with valuable insights for making informed trading decisions.
Key Features:
Dynamic Support & Resistance Lines:
The script identifies and plots support and resistance levels using pivot points based on a user-defined number of left and right bars.
Resistance lines are plotted in red, while support lines are plotted in blue, making it easy to distinguish between the two.
Toggle Breaks:
Users can choose to display or hide break signals for support and resistance levels using a simple toggle input.
Volume Threshold:
The study includes daily and weekly high and low calculations to provide a comprehensive view of market ranges.
Previous high and low lines are plotted for both daily and weekly timeframes, aiding in identifying potential breakout or breakdown levels.
Regular Market Hours:
The script defines regular market hours and tracks sessions, ensuring that support and resistance levels are relevant to active trading periods.
Midline and Extension Lines:
The study calculates and plots a midline between the previous high and low, along with extension lines above and below the range. These lines help identify potential target levels and extensions beyond the current range.
Real-time Updates:
The script ensures that all lines are updated in real-time, adjusting to new bars as they form. This dynamic feature keeps the levels relevant and accurate throughout the trading session.
Usage Instructions:
Adjust the number of left and right bars to define the sensitivity of the support and resistance levels.
Toggle the display of break signals to highlight significant breaks in support or resistance.
Monitor the daily and weekly high and low lines to understand the broader market context.
Utilize the midline and extension lines to set potential price targets and manage risk effectively.
This study provides traders with a robust tool for identifying and reacting to key market levels, enhancing their trading strategies with dynamic and real-time insights.
Periodic Activity Tracker [LuxAlgo]The Periodic Activity Tracker tool periodically tracks the cumulative buy and sell volume in a user-defined period and draws the corresponding matching bars and volume delta for each period.
Users can select a predefined aggregation period from the following options: Hourly, Daily, Weekly, and Monthly.
🔶 USAGE
This tool provides a simple and clear way of analyzing volumes for each aggregated period and is made up of the following elements:
Buy and sell volumes by period as red and green lines with color gradient area
Delta (difference) between buy & sell volume for each period
Buy & sell volume bars for each period
Separator between lines and bars, and period tags below each pair of bars for ease of reading
On the chart above we can see all the elements displayed, the volume level on the lines perfectly matches the volume level on the bars for each period.
In this case, the tool has the default settings so the anchor period is set to Daily and we can see how the period tag (each day of the week) is displayed below each pair of bars.
Users can disable the delta display and adjust the bar size.
🔹 Reading The Tool
In trading, assessing the strength of the bulls (buyers) and bears (sellers) is key to understanding the current trading environment. Which side, if any, has the upper hand? To answer this question, some traders look at volume in relation to price.
This tool provides you with a view of buy volume versus sell volume, allowing you to compare both sides of the market.
As with any volume tool, the key is to understand when the forces of the two groups are balanced or unbalanced.
As we can observe on the chart:
NOV '23: Buy volume greater than sell volume, both moving up close together, flat delta. We can see that the price is in range.
DEC '23: Buy volume bigger than Sell volume, both moving up but with a bigger difference, bigger delta than last month but still flat. We can see the price in the range above last month's range.
JAN '24: Buy and sell volume tied together, no delta whatsoever. We can see the price in range but testing above and below last month's range.
FEB '24: Buy volume explodes higher and sell volume cannot keep up, big growing delta. Price explodes higher above last month's range.
Traders need to understand that there is always an equal number of buyers and sellers in a liquid market, the quality here is how aggressive or passive they are. Who is 'attacking' and who is 'defending', who is using market orders to move prices, and who is using limit orders waiting to be filled?
This tool gives you the following information:
Lines: if the top line is green, the buyers are attacking, if it is red, the sellers are attacking.
Delta: represents the difference in their strength, if it is above 0 the buyers are stronger, if it is below 0 the sellers are stronger.
Bars: help you to see the difference in strength between buyers and sellers for each period at a glance.
🔹 Anchor Period
By default, the tool is set to Hourly. However, users can select from a number of predefined time periods.
Depending on the user's selection, the bars are displayed as follows:
Hourly : hours of the current day
Daily : days of the current week
Weekly : weeks of the current month
Monthly : months of the current year
On the chart above we can see the four periods displayed, starting at the top left and moving clockwise we have hourly, daily, weekly, and monthly.
🔶 DETAILS
🔹 Chart TimeFrame
The chart timeframe has a direct impact on the visualization of the tool, and the user should select a chart timeframe that is compatible with the Anchor period in the tool's settings panel.
For the chart timeframe to be compatible it must be less than the Anchor period parameter. If the user selects an incompatible chart timeframe, a warning message will be displayed.
As a rule of thumb, the smaller the chart timeframe, the more data the tool will collect, returning indications for longer-term price variations.
These are the recommended chart timeframes for each period:
Hourly : 5m charts or lower
Daily : 1H charts or lower
Weekly : 4H charts or lower
Monthly : 1D charts or lower
🔹 Warnings
This chart shows both types of warnings the user may receive
At the top, we can see the warning that is given when the 'Bar Width' parameter exceeds the allowed value.
At the bottom is the incompatible chart timeframe warning, which prompts the user to select a smaller chart timeframe or a larger "Anchor Period" parameter.
🔶 SETTINGS
🔹 Data Gathering
Anchor period: Time period representing each bar: hours of the day, days of the week, weeks of the month, and months of the year. The timeframe of the chart must be less than this parameter, otherwise a warning will be displayed.
🔹 Style
Bars width: Size of each bar, there is a maximum limit so a warning will be displayed if it is reached.
Volume color
Delta: Enable/Disable Delta Area Display

Trend Tracker By Prem This Script tracks change of trend and Works as a leading indicator. If anyone interested in further modifying its script please do so and share with everyone with the same name as Trend Tracker By Prem

Directional Candle Size TrackerThis indicator measures the strength of bullish and bearish momentum by tracking the average size of candles — but only when they’re moving in the intended direction.
🟢 Bullish Strength rises when green candles expand in size
🔴 Bearish Strength rises when red candles grow in size
When the market pauses or flips direction, the opposing line flatlines, preserving the last value
Unlike traditional moving averages that blend all candles together, this tracker isolates directional pressure, giving you a clearer read on which side is truly in control. It’s especially useful for spotting momentum decay, trap setups, and regime transitions.
Use it to:
Confirm breakout strength
Detect fading conviction
Compare bullish vs. bearish aggression in real time

Average Daily Range TrackerAverage Daily Range Tracker
This indicator helps you measure volatility in real time by tracking the Average Daily Range (ADR) and comparing it to the current day’s price action.
🔑 Features
Calculates the ADR over a user-defined lookback period (default = 14 days).
Displays today’s developing range (High–Low) as the session unfolds.
Shows what % of the ADR has already been consumed intraday.
Visual progress bar makes it easy to see how close today is to its historical average range.
Optional ADR plot available in a separate pane.
📈 How traders use it
Spot when a market has already made its “typical” daily move.
Adjust intraday trade expectations: avoid chasing after the bulk of the move is done.
Use % of ADR consumed as a volatility filter for setups.
Combine with support/resistance to identify exhaustion zones.
⚙️ Customization
Lookback length for ADR calculation.
Progress bar size and color.
Optional toggle to plot ADR in its own panel.

Apex Edge - London Open Session# Apex Edge - London Open Session Trading System
## Overview
The London Open Session indicator captures institutional price action during the first hour of the London forex session (8:00-9:00 AM GMT) and identifies high-probability breakout and retest opportunities. This system tracks the session's high/low range and generates precise entry signals when price breaks or retests these key institutional levels.
## Core Strategy
**Session Tracking**: Automatically identifies and marks the London Open session boundaries, creating a trading zone from the first hour's price range.
**Dual Entry Logic**:
- **Breakout Entries**: Triggers when price closes beyond the session high/low and continues in that direction
- **Retest Entries**: Activates when price returns to test the broken level as new support/resistance
**Performance Analytics**: Built-in win rate tracking displays real-time performance statistics over user-defined lookback periods, enabling data-driven optimization for each currency pair.
## Key Features
### Automated Zone Detection
- Precise London session timing with timezone offset controls
- Visual session boundaries with customizable colours
- Automatic high/low range calculation and display
### Smart Entry System
- Breakout confirmation requiring candle close beyond zone
- Retest detection with configurable pip distance tolerance
- Separate risk/reward ratios for breakout vs retest entries
- Visual entry arrows with clear trade direction labels
### Performance HUD
- Real-time win rate calculation over customizable periods (7-365 days)
- Total trades tracking with win/loss breakdown
- Average risk-reward ratio display
- Color-coded performance metrics (green >70%, yellow >50%, red <50%)
### PineConnector Integration
- Direct MT4/MT5 execution via PineConnector alerts
- Proper forex pip calculations for all currency pairs
- Customizable risk percentage per trade
- Symbol override capability for broker compatibility
- Automatic SL/TP level calculation in pips
## Critical Usage Requirements
### Pair-Specific Optimization
Each currency pair requires individual optimization due to varying volatility characteristics, institutional participation levels, and typical price ranges during London hours. The performance HUD is essential for identifying optimal settings before live trading.
**Recommended Testing Process**:
1. Apply indicator to desired currency pair and timeframe
2. Experiment with session timing - while 8:00-9:00 AM GMT is standard, some pairs may show improved performance with alternative hourly windows (e.g., 7:00-8:00 AM or 9:00-10:00 AM)
3. Adjust Stop Loss distances, Risk/Reward ratios, and Retest distances
4. Monitor win rate over 30+ day periods using the performance HUD
5. Only proceed with live alerts once consistent 60%+ win rates are achieved
6. Create separate optimized chart setups for each profitable pair/timeframe combination
### Timeframe Specifications
This indicator is specifically designed and tested for:
- **1-minute charts**: Optimal for capturing immediate institutional reactions
- **5-minute charts**: Balanced approach between noise reduction and opportunity frequency
Higher timeframes generally produce inferior results due to increased noise and reduced institutional edge during the London session window.
## Settings Configuration
### Session Timing
- **London Open/Close Hours**: Adjust for your chart's timezone
- **Rectangle End Time**: Set to 4:30 PM to stop signals before NY session close
- **Timezone Offset**: Ensure accurate London session capture
### Entry Parameters
- **Retest Distance**: 3-8 pips depending on pair volatility
- **Stop Loss Pips**: Separate settings for breakouts (10-15 pips) and retests (8-12 pips)
- **Risk/Reward Ratios**: Independent ratios for different entry types
### PineConnector Setup
- **License ID**: Your PineConnector license key
- **Symbol Override**: MT4/MT5 symbol names if different from TradingView
- **Risk Percentage**: Position size as percentage of account balance
- **Prefix/Comment**: Organize trades in terminal
## Manual Trading Limitations
Without PineConnector automation, traders face significant practical challenges:
**Settings Management**: Each currency pair requires different optimized parameters. Switching between charts means manually adjusting multiple settings each time, creating potential for errors and missed opportunities.
**Timing Sensitivity**: London Open signals can occur rapidly during high-volatility periods. Manual execution may result in slippage or missed entries.
**Multi-Pair Monitoring**: Tracking 4-11 currency pairs simultaneously while manually adjusting settings for each switch becomes impractical for most traders.
**Parameter Consistency**: Risk of using suboptimal settings when quickly switching between pairs, potentially compromising the careful optimization work.
## Recommended Workflow
1. **Historical Testing**: Use win rate HUD to identify profitable pairs and optimal parameters
2. **Demo Automation**: Test PineConnector alerts on demo accounts with optimized settings
3. **Live Implementation**: Deploy alerts only on proven profitable pair/timeframe combinations
4. **Ongoing Monitoring**: Regular review of performance metrics to maintain edge
## Risk Disclaimer
This indicator provides analysis tools and automation capabilities but does not guarantee profitable trading outcomes. Past performance does not predict future results. Users should thoroughly backtest and demo trade before risking live capital. The London session strategy works best during specific market conditions and may underperform during low volatility or unusual market environments.
## Support Requirements
Successful implementation requires:
- Basic understanding of London session market dynamics
- PineConnector subscription for automation features
- Patience for proper optimization process
- Realistic expectations about win rates and drawdown periods
This system is designed for serious traders willing to invest time in proper optimization and risk management rather than plug-and-play solutions.

[blackcat] L2 Multi-Level Price Condition TrackerOVERVIEW
The L2 Multi-Level Price Condition Tracker represents an innovative approach to analyzing financial markets by simultaneously monitoring multiple price levels, thus providing traders with a holistic view of market dynamics. By combining dynamic calculations based on moving averages and price deviations, this tool aims to deliver precise and actionable insights into potential entry and exit points. It leverages sophisticated statistical measures to identify key thresholds that signify shifts in market sentiment, thereby aiding traders in making well-informed decisions. 🎯
Key benefits encompass:
• Comprehensive calculation of midpoints and average prices indicating short-term trend directions.
• Interactive visualization elements enhancing interpretability effortlessly.
• Real-time generation of buy/sell signals driven by precise condition evaluations.
TECHNICAL ANALYSIS COMPONENTS
📉 Midpoint Calculations:
Computes central reference points derived from high-low ranges establishing baseline supports/resistances.
Utilizes Simple Moving Averages (SMAs) along with standardized deviation formulas smoothing out volatility while preserving long-term trends accurately.
Facilitates identification of directional biases reflecting underlying market forces dynamically.
🕵️♂️ Advanced Price Level Detection:
Derives upper/lower bounds adjusting sensitivities adaptively responding to changing conditions flexibly.
Employs proprietary logic distinguishing between bullish/bearish sentiments promptly signaling transitions effectively.
Ensures consistent adherence to predefined statistical protocols maintaining accuracy robustly.
🎥 Dynamic Signal Generation:
Detects crossovers indicating dominance shifts between buyers/sellers promptly triggering timely alerts.
Integrates conditional logic reinforcing signal validity minimizing erroneous activations systematically.
Supports adaptive thresholds tuning sensitivities based on evolving market conditions flexibly accommodating varying scenarios.
INDICATOR FUNCTIONALITY
🔢 Core Algorithms:
Utilizes moving averages alongside standardized deviation formulas generating precise net volume measurements.
Implements Arithmetic Mean Line Algorithm (AMLA) smoothing techniques improving interpretability.
Ensures consistent alignment with established statistical principles preserving fidelity.
🖱️ User Interface Elements:
Dedicated plots displaying real-time midpoint markers facilitating swift decision-making.
Context-sensitive color coding distinguishing positive/negative deviations intuitively highlighting key activations clearly.
Background shading emphasizing proximity to crucial threshold activations enhancing visibility focusing attention on vital signals promptly.
STRATEGY IMPLEMENTATION
✅ Entry Conditions:
Confirm bullish/bearish setups validated through multiple confirmatory signals assessing concurrent market sentiment factors.
Validate entry decisions considering alignment between calculated midpoints and broader trend directions ensuring coherence.
Monitor cumulative breaches signifying potential trend reversals executing partial/total closes contingent upon predetermined loss limits preserving capital efficiently.
🚫 Exit Mechanisms:
Trigger exits upon hitting predefined thresholds derived from historical analyses promptly executing closures.
Execute partial/total closes contingent upon cumulative loss limits preserving capital efficiently managing exposures prudently.
Conduct periodic reviews gauging strategy effectiveness rigorously identifying areas needing refinement implementing corrective actions iteratively enhancing performance metrics steadily.
PARAMETER CONFIGURATIONS
🎯 Optimization Guidelines:
Lookback Period: Governs responsiveness versus stability balancing sensitivity/stability governing moving averages aligning with preferred granularity.
Price Source: Dictates primary data series driving volume calculations selecting relevant inputs accurately tailoring strategies accordingly.
💬 Customization Recommendations:
Commence with baseline defaults; iteratively refine parameters isolating individual impacts evaluating adjustments independently prior to combined modifications minimizing disruptions.
Prioritize minimizing erroneous trigger occurrences first optimizing signal fidelity sustaining balanced risk-reward profiles irrespective of chosen settings upholding disciplined approaches preserving capital efficiently.
ADVANCED RISK MANAGEMENT
🛡️ Proactive Risk Mitigation Techniques:
Enforce strict compliance with pre-defined maximum leverage constraints adhering strictly to guidelines managing exposures prudently.
Mandatorily apply trailing stop-loss orders conforming to script outputs enforcing discipline rigorously preventing adverse consequences.
Allocate positions proportionately relative to available capital reserves conducting periodic reviews gauging effectiveness continuously identifying improvement opportunities steadily.
⚠️ Potential Pitfalls & Solutions:
Address frequent violations arising during heightened volatility phases necessitating manual interventions judiciously preparing contingency plans proactively mitigating risks effectively.
Manage false alerts warranting immediate attention avoiding adverse consequences systematically implementing corrective actions reliably.
Prepare proactive responses amid adverse movements ensuring seamless functionality amidst fluctuating conditions fortifying resilience against anomalies robustly.
PERFORMANCE MONITORING METRICS
🔍 Evaluation Criteria:
Assess win percentages consistently across diverse trading instruments gauging reliability measuring profitability efficiency accurately evaluating downside risks comprehensively uncovering systematic biases potentially skewing outcomes.
Calculate average profit ratios per successful execution benchmarking actual vs expected performances documenting results meticulously tracking progress dynamically addressing identified shortcomings proactively fostering continuous improvements.
📈 Historical Data Analysis Tools:
Maintain detailed logs capturing every triggered event recording realized profits/losses comparing simulated projections accurately identifying discrepancies warranting investigation implementing iterative refinements steadily enhancing performance metrics progressively.
Identify recurrent systematic errors demanding corrective actions implementing iterative refinements steadily addressing identified shortcomings proactively fostering continuous enhancements dynamically improving robustness resiliently.
PROBLEM SOLVING ADVICE
🔧 Frequent Encountered Challenges:
Unpredictable behaviors emerging within thinly traded markets requiring filtration processes enhancing signal integrity excluding low-liquidity assets prone to erratic movements effectively.
Latency issues manifesting during abrupt price fluctuations causing missed opportunities introducing buffer intervals safeguarding major news/event impacts mitigating distortions seamlessly verifying reliable connections ensuring uninterrupted data flows guaranteeing accurate interpretations dependably.
💡 Effective Resolution Pathways:
Limit ongoing optimization attempts preventing model degradation maintaining optimal performance levels consistently recalibrating parameters periodically adapting strategies flexibly responding appropriately amidst varying conditions dynamically improving robustness resiliently.
Verify reliable connections ensuring uninterrupted data flows guaranteeing accurate interpretations dependably bolstering overall efficacy systematically addressing identified shortcomings dynamically fostering continuous advancements.
THANKS
Heartfelt acknowledgment extends to all developers contributing invaluable insights regarding multi-level price condition-based trading methodologies! ✨

Umesh BC IST 3:30 AM Session Tracker + 4H Candles📌 IST 3:30 AM Session Tracker + 4H Candle Marker
This indicator is designed for traders who follow Indian Standard Time (IST) and want precise session tracking and 4H candle insights.
🔧 Features:
🕒 Daily Session Start at 3:30 AM IST
Automatically detects and marks the beginning of each new trading day based on 3:30 AM IST, not midnight.
Displays session Open, High, and Low lines.
Background shading for each session.
Customizable alert when a new day starts.
🟧 4H Candle Start Markers (IST Time)
Identifies every new 4-hour candle that starts at:
3:30, 7:30, 11:30, 3:30 PM, 7:30 PM, 11:30 PM IST
Adds a vertical line and label ("🟧 4H") above the candle.
Plots a dynamic line for the 4H candle's opening price.
Includes optional alert for new 4H candles.
🔔 Alerts Included:
"🕒 New IST Day Start": Triggers at 3:30 AM IST.
"🟧 New 4H Candle": Triggers at each 4H candle start (IST).
✅ Best for:
Intraday, swing, and institutional traders using IST-based analysis.
Those wanting more accurate daily sessions and clear candle structuring.

Risk TrackerThis Risk Tracker Pine Script provides traders with a customizable tool for tracking and managing trade risk directly on their chart. The script is designed to accommodate both futures and crypto trades, allowing you to monitor risk and reward parameters, adjust contract sizes, and manage leverage in real-time.
Key Features:
1. Trade Direction and Risk-Reward Ratio:
• Select between Long or Short trade directions.
• Set a custom Risk-Reward Ratio (RRR) to calculate potential profit and loss levels based on your trade setup.
2. Customizable Parameters:
• Input fields for contract size, leverage, margin, and maximum drawdown allow you to adjust the risk settings depending on the market you are trading.
• You can toggle between using a dollar-based or percentage-based risk calculation depending on whether you’re trading futures (USD-based) or crypto.
3. Real-time Stop-Loss and Take-Profit Calculation:
• The script automatically calculates and draws the Stop-Loss (SL) and Take-Profit (TP) levels on the chart based on your entry price and selected risk settings.
• The color of the SL and TP lines is customizable, allowing you to visually distinguish profit and loss levels.
4. Historical Price Levels:
• If there is no active trade, the script scans historical price data to find the last instances when the price hit the predefined stop-loss or take-profit levels, helping you understand past price behavior.
5. Risk Management Table:
• A summary table is displayed on the chart, showing the key metrics of your trade, including:
• Tick value and Dollar value for futures.
• Margin and Leverage for crypto.
• Risk-Reward Ratio, Entry price, Risk and Profit in USD or percentage terms.
• The table dynamically updates based on the current trade status.
6. Extended Chart Visualization:
• Option to extend the SL and TP lines to the left of the chart, allowing you to easily view these levels across multiple timeframes and bars.
This script helps ensure you are always aware of your trade’s risk profile, providing a clear and visual representation of potential profit and loss, both in terms of percentage and dollar value. Ideal for futures and crypto traders who rely on precise risk management to maintain profitability.

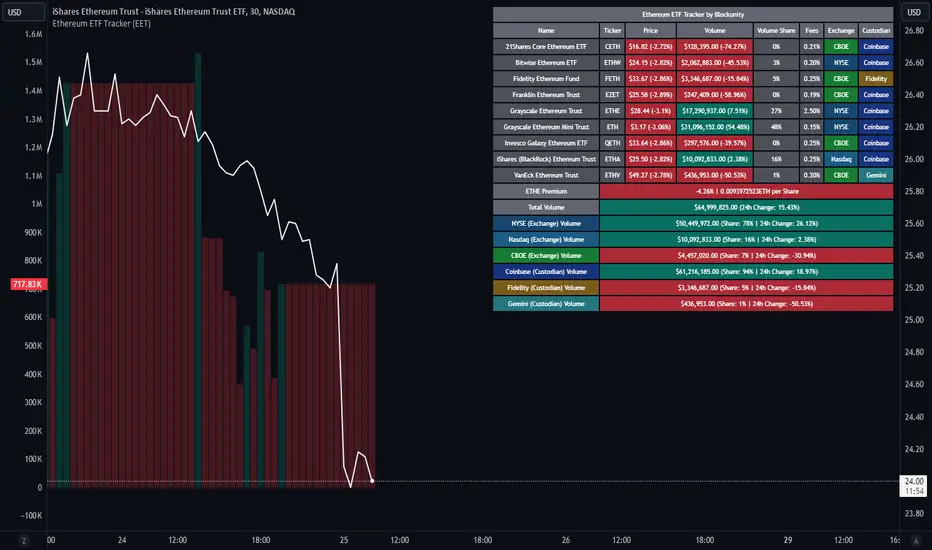
Ethereum ETF Tracker (EET)Get all the information you need about all the different Ethereum ETF.
With the Ethereum ETF Tracker, you can observe all possible Ethereum ETF data:
ETF name.
Ticker.
Price.
Volume.
Share of total ETF volume.
Fees.
Exchange.
Custodian.
At the bottom of the table, you'll find the ETHE Premium (and ETH per Share), and day's total volume.
In addition, you can see the volume for the different Exchanges, as well as for the different Custodians.
If you don't want to display these lines to save space, you can uncheck "Show Additional Data" in the indicator settings.
The Idea
The goal is to provide the community with a tool for tracking all Ethereum ETF data in a synthesized way, directly in your TradingView chart.
How to Use
Simply read the information in the table. You can hover above the Fees and Exchanges cells for more details.
The table takes space on the chart, you can remove the extra lines by unchecking "Show Additional Data" in the indicator settings or reduce text size by changing the "Table Text Size" parameter.
Aggregate volume can be displayed directly on the graph (this volume can be displayed on any asset, such as Ethereum itself). The display can be disabled in the settings.
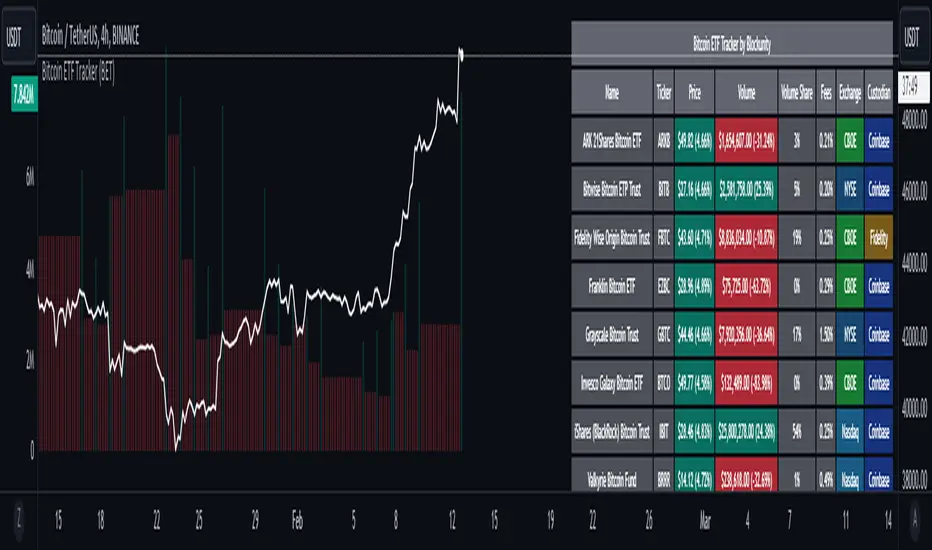
Bitcoin ETF Tracker (BET)Get all the information you need about all the different Bitcoin ETFs.
With the Bitcoin ETF Tracker, you can observe all possible Bitcoin ETF data:
The ETF name.
The ticker.
The price.
The volume.
The share of total ETF volume.
The ETF fees.
The exchange and custodian.
At the bottom of the table, you'll find the day's total volume.
In addition, you can see the volume for the different Exchanges, as well as for the different Custodians.
If you don't want to display these lines to save space, you can uncheck "Show Additional Data" in the indicator settings.
The Idea
The goal is to provide the community with a tool for tracking all Bitcoin ETF data in a synthesized way, directly in your TradingView chart.
How to Use
Simply read the information in the table. You can hover above the Fees and Exchanges cells for more details.
The table takes space on the chart, you can remove the extra lines by unchecking "Show Additional Data" in the indicator settings or reduce text size by changing the "Table Text Size" parameter.
Upcoming Features
As soon as we have a little more history, we'll add variation rates as well as plots to observe the breakdown between the various Exchanges and Custodians.
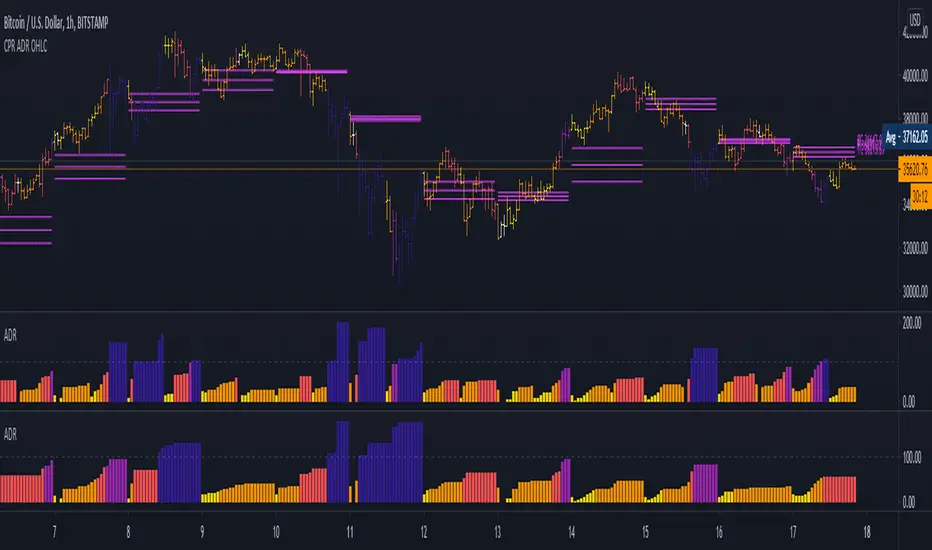
5 Day ADR ICT Intraday Tracker + Timeframes, Alerts, BarcolorsThis indicator gives you a hint on hypothetical room left for a trade by tracking todays current range as a percentage of the 5 Day ADR.
Look for entries in yellow and orange zones and exits on dark blue once the ADR is reached.
I just added a Timeframe, Alerts for High and Low Zones and an option to colorize the Bars/Candles to "5 Day ADR ICT Intraday Tracker" by BryceWH
RSI Season Tracker by KrisWatersSeason tracker identifies the momentum with tracking dominance and market capitalization data of Bitcoin , Altcoin and USDT .
With this indicator you can able to get know about Bitcoin, Altcoin and USDT dominance and market capitalization easily.
Backgrond Color Definations:
If the background color of indicator is ORANGE means that Bitcoin dominance is the most powerful. It is a good sign for Bitcoin.
If the background color of indicator is BLUE means that Altcoin dominance is the most powerful. It is a good sign for Altcoins.
If the background color of indicator is GREEN means that USDT dominance is the most powerful. It is a good sign for USDT.
Plus Sign (+) Meaning and Color Definations:
If ORANGE plus sign is visible on indicator means that market capitalization of Bitcoin is increasing. It is a good sign for Bitcoin.
If BLUE plus sign is visible on indicator means that market capitalization of Altcoin is increasing. It is a good sign for Altcoins.
If GREEN plus sign is visible on indicator means that market capitalization of Bitcoin and Altcoins are decreasing. It is not a good sign for both.
Light and Dark RSI Line Color Definations:
If the line of Bitcoin color is Orange means that, RSI value was increased compared with previous bar. It is one of the good sign of the momentum strength.
If the line of Bitcoin color is Yellow means that, RSI value was decreased compared with previous bar. It is not a good sign.
If the line of Altcoin color is Navy means that, RSI value was increased compared with previous bar. It is one of the good sign of the momentum strength.
If the line of Altcoin color is Blue means that, RSI value was decreased compared with previous bar. It is not a good sign.
If the line of USDT color is Green means that, RSI value was increased compared with previous bar. It is one of good the sign of the momentum strength.
If the line of USDT color is Lime means that, RSI value was decreased compared with previous bar. It is not a good sign.
Simple RSI rules are valid for this indicator.
RSI value is under 30 indicates that asset is OVERSOLD .
RSI value is upper 70 indicates that asset is OVERBOUGHT .
Important Notice: Dominance data is not correlated with price. For example; sometimes dominance is increasing but the price is not. And that's where the market capitalization comes in.
If the plus sign is not visible , you can get questioning for the movement. It is not a good sign at all.
If the plus sign is visible and RSI is increasing , It is a good sign for the strength of assets movement.
I recommended to use on DAILY timeframe . But you can use different timeframes as well.
Please leave comment below If you have any question or development idea.

Relative Performance Tracker [QuantAlgo]🟢 Overview
The Relative Performance Tracker is a multi-asset comparison tool designed to monitor and rank up to 30 different tickers simultaneously based on their relative price performance. This indicator enables traders and investors to quickly identify market leaders and laggards across their watchlist, facilitating rotation strategies, strength-based trading decisions, and cross-asset momentum analysis.
🟢 Key Features
1. Multi-Asset Monitoring
Track up to 30 tickers across any market (stocks, crypto, forex, commodities, indices)
Individual enable/disable toggles for each ticker to customize your watchlist
Universal compatibility with any TradingView symbol format (EXCHANGE:TICKER)
2. Ranking Tables (Up to 3 Tables)
Each ticker's percentage change over your chosen lookback period, calculated as:
(Current Price - Past Price) / Past Price × 100
Automatic sorting from strongest to weakest performers
Rank: Position from 1-30 (1 = strongest performer)
Ticker: Symbol name with color-coded background (green for gains, red for losses)
% Change: Exact percentage with color intensity matching magnitude
For example, Rank #1 has the highest gain among all enabled tickers, Rank #30 has the lowest (or most negative) return.
3. Histogram Visualization
Adjustable bar count: Display anywhere from 1 to 30 top-ranked tickers (user customizable)
Bar height = magnitude of percentage change.
Bars extend upward for gains, downward for losses. Taller bars = larger moves.
Green bars for positive returns, red for negative returns.
4. Customizable Color Schemes
Classic: Traditional green/red for intuitive interpretation
Aqua: Blue/orange combination for reduced eye strain
Cosmic: Vibrant aqua/purple optimized for dark mode
Custom: Full personalization of positive and negative colors
5. Built-In Ranking Alerts
Six alert conditions detect when rankings change:
Top 1 Changed: New #1 leader emerges
Top 3/5/10/15/20 Changed: Shifts within those tiers
🟢 Practical Applications
→ Momentum Trading: Focus on top-ranked assets (Rank 1-10) that show strongest relative strength for trend-following strategies
→ Market Breadth Analysis: Monitor how many tickers are above vs. below zero on the histogram to gauge overall market health
→ Divergence Spotting: Identify when previously leading assets lose momentum (drop out of top ranks) as potential trend reversal signals
→ Multi-Timeframe Analysis: Use different lookback periods on different charts to align short-term and long-term relative strength
→ Customized Focus: Adjust histogram bars to show only top 5-10 strongest movers for concentrated analysis, or expand to 20-30 for comprehensive overview

Coins Trend Tracker HTThe Coins Trend Tracker HT script provides a powerful tool for monitoring and comparing the trend signals of multiple cryptocurrencies based on their Exponential Moving Averages (EMAs). This script is particularly useful for traders who want to keep track of multiple coins across different timeframes and identify potential trading opportunities based on EMA crossovers.
Features:
Customizable Coin Selection: Users can select up to four different cryptocurrencies to monitor.
Flexible Timeframes: Users can choose two different timeframes for EMA calculations to suit their trading strategies.
Visual Trend Indicators: The script displays trend indicators (🚀 for bullish and 💀 for bearish) based on the EMA crossover status for each coin and timeframe.
Conditional Cell Coloring: Table cells are color-coded based on the EMA crossover conditions, helping users quickly identify bullish or bearish trends.
Opacity Control: Users can adjust the opacity of the table cell colors for better visualization on the chart.
How It Works:
Coin Selection: Users can select up to four different cryptocurrencies to monitor by entering their ticker symbols.
Timeframe Selection: Users can select two different timeframes for the EMA calculations. The script calculates the 5-period and 20-period EMAs for each coin and timeframe.
EMA Crossovers: The script checks for EMA crossovers (EMA 5 crossing above or below EMA 20) and updates the trend indicators and cell colors accordingly.
Table Display: The script displays a table with the selected coins, their current prices, and trend indicators for the chosen timeframes. The background color of the table cells changes based on the EMA crossover status.
Script Logic:
The get_price function retrieves the latest price of the selected coin for the specified timeframe.
The get_ema_cross function calculates the 5-period and 20-period EMAs and checks for crossover conditions.
The fill_row function populates the table with the coin data, trend indicators, and conditionally colored cells.
The table header and data rows are updated based on the user-selected coins, timeframes, and EMA crossover conditions.
Usage:
Add the script to your TradingView chart.
Customize the coin selection, timeframes, text color, default cell color, bullish and bearish cross colors, and cell opacity through the input settings.
The script will display a table with the selected coins, their current prices, and trend indicators based on the EMA crossovers for the chosen timeframes.

USDT Inflow TrackerUSDT INFLOW TRACKER
What does this script do? It looks for important inflow from USDT and write it below or above your chart.
Does it matter? Yes because Tether with planned USDT inflow highly manipulate the crypto market.
With this simple script you can study what and when something strange is going to happen on your favourite token.
HOW IT WORKS?
Pretty simple. It just continuosly check USDT (and USDC) Market Cap and verify if the last candle is way higher than last one. If it was way higher than expected it plot a green square and write a note with the total Inflow of USDT in the crypto market (not specifcially for your token)
Now you can see when an important inflow is done and start to plan your entry and exit strategy in the crypto market.
AUTOSET
With Autoset you can rely on standard values
5min TF : Inflow greater than of 15 mln (in 1 candle)
30min TF : Inflow greater than of 150 mln (in 1 candle)
60min TF : Inflow greater than of 300 mln (in 1 candle)
1Day TF : Inflow greater than of 900 mln (in 1 candle)
So you can check your favourite coin in no time looking for a good trading position
MANUAL SETTINGS
Otherwise you can set directly your Inflow to track based on your needs.
In the example below I've set to check everytime an Inflow of 25mln USDT or greater was done.
As you can see it highly influence the relative token.

ICT Algorithmic Macro Tracker° (Open-Source) by toodegreesDescription:
The ICT Algorithmic Macro Tracker° Indicator is a powerful tool designed to enhance your trading experience by clearly and efficiently plotting the known ICT Macro Times on your chart.
Based on the teachings of the Inner Circle Trader , these Time windows correspond to periods when the Interbank Price Delivery Algorithm undergoes a series of checks ( Macros ) and is probable to move towards Liquidity.
The indicator allows traders to visualize and analyze these crucial moments in NY Time:
- 2:33-3:00
- 4:03-4:30
- 8:50-9:10
- 9:50-10:10
- 10:50-11:10
- 11:50-12:10
- 13:10-13:50
- 15:15-15:45
By providing a clean and clutter-free representation of ICT Macros, this indicator empowers traders to make more informed decisions, optimize and build their strategies based on Time.
Massive shoutout to @reastruth for his ICT Macros Indicator , and for allowing to create one of my own, go check him out!
Indicator Features:
– Track ongoing ICT Macros to aid your Live analysis.
- Gain valuable insights by hovering over the plotted ICT Macros to reveal tooltips with interval information.
– Plot the ICT Macros in one of two ways:
"On Chart": visualize ICT Macro timeframes directly on your chart, with automatic adjustments as Price moves.
Pro Tip: toggle Projections to see exactly where Macros begin and end without difficulty.
"New Pane": move the indicator two a New Pane to see both Live and Upcoming Macro events with ease in a dedicated section
Pro Tip: this section can be collapsed by double-clicking on the main chart, allowing for seamless trading preparation.
This indicator is available only on the TradingView platform.
⚠️ Open Source ⚠️
Coders and TV users are authorized to copy this code base, but a paid distribution is prohibited. A mention to the original author is expected, and appreciated.
⚠️ Terms and Conditions ⚠️
This financial tool is for educational purposes only and not financial advice. Users assume responsibility for decisions made based on the tool's information. Past performance doesn't guarantee future results. By using this tool, users agree to these terms.

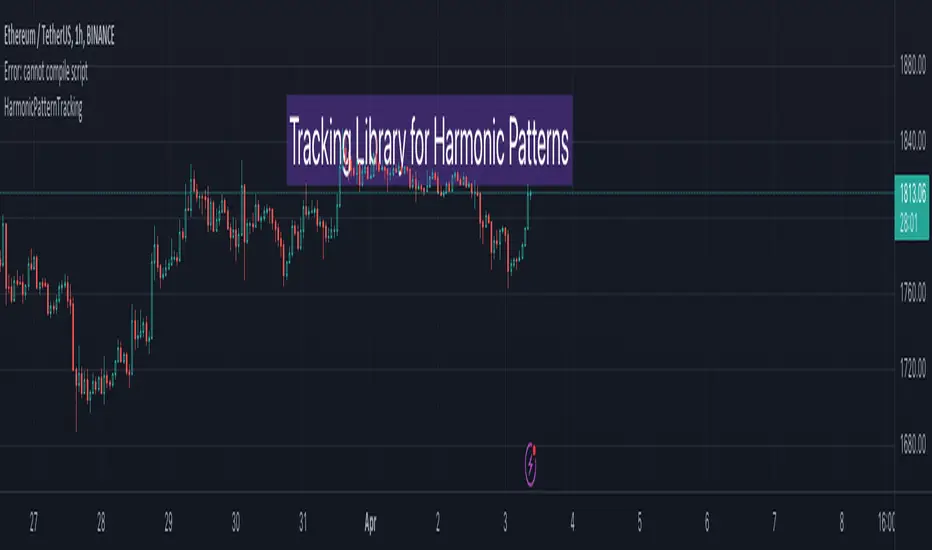
HarmonicPatternTrackingLibrary "HarmonicPatternTracking"
Library contains few data structures and methods for tracking harmonic pattern trades via pinescript.
method draw(this)
Creates and draws HarmonicDrawing object for given HarmonicPattern
Namespace types: HarmonicPattern
Parameters:
this (HarmonicPattern) : HarmonicPattern object
Returns: current HarmonicPattern object
method addTrade(this)
calculates HarmonicTrade and sets trade object for HarmonicPattern
Namespace types: HarmonicPattern
Parameters:
this (HarmonicPattern) : HarmonicPattern object
Returns: bool true if pattern trades are valid, false otherwise
method delete(this)
Deletes drawing objects of HarmonicDrawing
Namespace types: HarmonicDrawing
Parameters:
this (HarmonicDrawing) : HarmonicDrawing object
Returns: current HarmonicDrawing object
method delete(this)
Deletes drawings of harmonic pattern
Namespace types: HarmonicPattern
Parameters:
this (HarmonicPattern) : HarmonicPattern object
Returns: current HarmonicPattern object
HarmonicDrawing
Drawing objects of Harmonic Pattern
Fields:
xa (series line) : xa line
ab (series line) : ab line
bc (series line) : bc line
cd (series line) : cd line
xb (series line) : xb line
bd (series line) : bd line
ac (series line) : ac line
xd (series line) : xd line
x (series label) : label for pivot x
a (series label) : label for pivot a
b (series label) : label for pivot b
c (series label) : label for pivot c
d (series label) : label for pivot d
xabRatio (series label) : label for XAB Ratio
abcRatio (series label) : label for ABC Ratio
bcdRatio (series label) : label for BCD Ratio
xadRatio (series label) : label for XAD Ratio
HarmonicTrade
Trade tracking parameters of Harmonic Patterns
Fields:
initialEntry (series float) : initial entry when pattern first formed.
entry (series float) : trailed entry price.
initialStop (series float) : initial stop when trade first entered.
stop (series float) : current stop updated as per trailing rules.
target1 (series float) : First target value
target2 (series float) : Second target value
target3 (series float) : Third target value
target4 (series float) : Fourth target value
status (series int) : Trade status referenced as integer
retouch (series bool) : Flag to show if the price retouched after entry
HarmonicProperties
Display and trade calculation properties for Harmonic Patterns
Fields:
fillMajorTriangles (series bool) : Display property used for using linefill for harmonic major triangles
fillMinorTriangles (series bool) : Display property used for using linefill for harmonic minor triangles
majorFillTransparency (series int) : transparency setting for major triangles
minorFillTransparency (series int) : transparency setting for minor triangles
showXABCD (series bool) : Display XABCD pivot labels
lblSizePivots (series string) : Pivot label size
showRatios (series bool) : Display Ratio labels
useLogScaleForScan (series bool) : Use log scale to determine fib ratios for pattern scanning
useLogScaleForTargets (series bool) : Use log scale to determine fib ratios for target calculation
base (series string) : base on which calculation of stop/targets are made.
entryRatio (series float) : fib ratio to calculate entry
stopRatio (series float) : fib ratio to calculate initial stop
target1Ratio (series float) : fib ratio to calculate first target
target2Ratio (series float) : fib ratio to calculate second target
target3Ratio (series float) : fib ratio to calculate third target
target4Ratio (series float) : fib ratio to calculate fourth target
HarmonicPattern
Harmonic pattern object to track entire pattern trade life cycle
Fields:
id (series int) : Pattern Id
dir (series int) : pattern direction
x (series float) : X Pivot
a (series float) : A Pivot
b (series float) : B Pivot
c (series float) : C Pivot
d (series float) : D Pivot
xBar (series int) : Bar index of X Pivot
aBar (series int) : Bar index of A Pivot
bBar (series int) : Bar index of B Pivot
cBar (series int) : Bar index of C Pivot
dBar (series int) : Bar index of D Pivot
przStart (series float) : Start of PRZ range
przEnd (series float) : End of PRZ range
patterns (bool ) : array representing the patterns
patternLabel (series string) : string representation of list of patterns
patternColor (series color) : color assigned to pattern
properties (HarmonicProperties) : HarmonicProperties object containing display and calculation properties
trade (HarmonicTrade) : HarmonicTrade object to track trades
drawing (HarmonicDrawing) : HarmonicDrawing object to manage drawings
Normalized Portfolio TrackerThis script lets you create, visualize, and track a custom portfolio of up to 15 assets directly on TradingView.
It calculates a synthetic "portfolio index" by combining multiple tickers with user-defined weights, automatically normalizing them so the total allocation always equals 100%.
All assets are scaled to a common starting point, allowing you to compare your portfolio’s performance versus any benchmark like SPY, QQQ, or BTC.
🚀 Goal
This script helps traders and investors:
• Understand the combined performance of their portfolio.
• Normalize diverse assets into a single synthetic chart .
• Make portfolio-level insights without relying on external spreadsheets.
🎯 Use Cases
• Backtest your portfolio allocations directly on the chart.
• Compare your portfolio vs. benchmarks like SPY, QQQ, BTC.
• Track thematic baskets (commodities, EV supply chain, regional ETFs).
• Visualize how each component contributes to overall performance.
📊 Features
• Weighted Portfolio Performance : Combines selected assets into a synthetic value series.
• Base Price Alignment : Each asset is normalized to its starting price at the chosen date.
• Dynamic Portfolio Table : Displays symbols, normalized weights (%), equivalent shares (based on each asset’s start price, sums to 100 shares), and a total row that always sums to 100%.
• Multi-Asset Support : Works with stocks, ETFs, indices, crypto, or any TradingView-compatible symbol.
⚙️ Configuration
Flexible Portfolio Setup
• Add up to 15 assets with custom weight inputs.
• You can enter any arbitrary numbers (e.g. 30, 15, 55).
• The script automatically normalizes all weights so the total allocation always equals 100%.
Start Date Selection
• Choose any custom start date to normalize all assets.
• The portfolio value is then scaled relative to the main chart symbol, so you can directly compare portfolio performance against benchmarks like SPY or QQQ.
Chart Styles
• Candlestick chart
• Heikin Ashi chart
• Line chart
Custom Display
• Adjustable colors and line widths
• Optionally display asset list, normalized weights, and equivalent shares
⚙️ How It Works
• Fetch OHLC data for each asset.
• Normalizes weights internally so totals = 100%.
• Stores each asset’s base price at the selected start date.
• Calculates equivalent “shares” for each allocation.
• Builds a synthetic portfolio value series by summing weighted contributions.
• Renders as Candlestick, Heikin Ashi, or Line chart.
• Adds a portfolio info table for clarity.
⚠️ Notes
• This script is for visualization only . It does not place trades or auto-rebalance.
• Weight inputs are automatically normalized, so you don’t need to enter exact percentages.

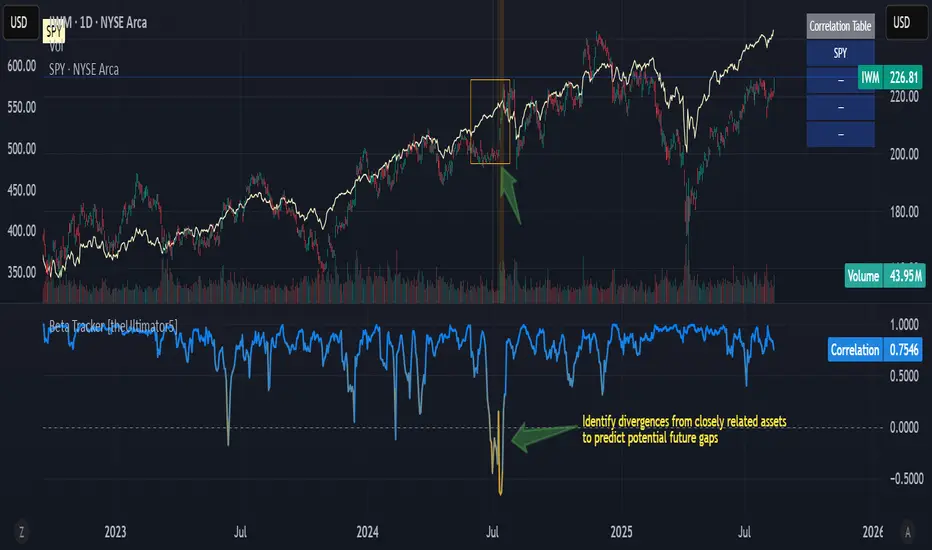
Beta Tracker [theUltimator5]This script calculates the Pearson correlation coefficient between the charted symbol and a dynamic composite of up to four other user-defined tickers. The goal is to track how closely the current asset’s normalized price behavior aligns with, or diverges from, the selected group (or basket)
How can this indicator be valuable?
You can compare the correlation of your current symbol against a basket of other tickers to see if it is moving independently, or being pulled with the basket.... or is it moving against the basket.
It can be used to help identify 'swap' baskets of stocks or other tickers that tend to generally move together and visually show when your current ticker diverges from the basket.
It can be used to track beta (or negative beta) with the market or with a specific ticker.
This is best used as a supplement to other trading signals to give a more complete picture of the external forces potentially pulling or pushing the price action of the ticker.
🛠️ How It Works
The current symbol and each selected comparison ticker are normalized over a custom lookback window, allowing fair pattern-based comparison regardless of price scale.
The normalized values from 1 to 4 selected tickers are averaged into a composite, which represents the group’s collective movement.
A Pearson correlation coefficient is computed over a separate correlation lookback period, measuring the relationship between the current asset and the composite.
The result is plotted as a dynamic line, with color gradients:
Blue = strongly correlated (near +1)
Orange = strongly inverse correlation (near –1)
Intermediate values fade proportionally
A highlighted background appears when the correlation drops below a user-defined threshold (e.g. –0.7), helping identify strong negative beta periods visually.
A toggleable info table displays which tickers are currently being compared, along with customizable screen positioning.
⚙️ User Inputs
Ticker 1–4: Symbols to compare the current asset against (blank = ignored)
Normalization Lookback: Period to normalize each series
Correlation Lookback: Period over which correlation is calculated
Negative Correlation Highlight: Toggle for background alert and threshold level
Comparison Table: Toggle and position controls for an on-screen summary of selected tickers
imgur.com
⚠️ Notes
The script uses request.security() to pull data from external symbols; these must be available for the selected chart timeframe.
A minimum of one valid ticker must be provided for the script to calculate a composite and render correlation.