Moments Functions
This script is a TradingView Pine Script (version 5) for calculating and plotting statistical moments of a financial series. Here's a breakdown of what it does:
Script Overview
Purpose:
The script calculates and visualizes moments such as Mean, Variance, Skewness, and Kurtosis of a price series.
It also provides the option to display log returns and various statistical bands.
Inputs:
Moments Selection: Choose from Mean, Variance, Skewness, or Excess Kurtosis.
Source Settings: Define the lookback period and source data (e.g., closing price or log returns).
Plot Settings: Control visibility and styling of plots, bands, and information panels.
Colors Settings: Customize colors for different plot elements.
Functions:
f_va(): Computes sample variance.
f_sd(): Computes sample standard deviation.
f_skew(): Computes sample skewness.
f_kurt(): Computes sample kurtosis.
seskew(): Calculates the standard error of skewness.
sekurt(): Calculates the standard error of kurtosis.
skewcv(): Computes critical values for skewness.
kurtcv(): Computes critical values for kurtosis.
Outputs:
Plots:
Moment values (Mean, Variance, Skewness, Kurtosis).
Log Returns (if selected).
Standard Deviation Bands (if selected).
Critical Values for Skewness and Kurtosis (if selected).
Information Panel: Displays current statistical values and their significance.
Customization:
Users can customize appearance and behavior of the script through various input options, including colors, line thickness, and background settings.
Key Variables and Constants
Constants:
zscoreS and zscoreL: Z-scores for confidence intervals based on sample size.
skewrv and kurtrv: Reference values for skewness and excess kurtosis.
Sample Functions:
f_va() and f_sd(): Custom functions to calculate sample variance and standard deviation.
f_skew() and f_kurt(): Custom functions to calculate skewness and kurtosis.
Critical Values:
Functions skewcv() and kurtcv() calculate critical values used to assess statistical significance of skewness and kurtosis.
Plotting
Plot Types:
Mean, variance, skewness, and excess kurtosis are plotted based on user selection.
Log returns are plotted if enabled.
Standard deviation bands and critical values are plotted if enabled.
Labels:
Information panel labels display mean, variance/standard deviation, skewness, and kurtosis values along with their significance.
Example Usage
To use this script:
Add it to a TradingView chart.
Adjust inputs to configure which statistical moments to display, the source data, and the appearance of the plots.
Review the plotted data and labels to analyze the statistical properties of the selected price series.
This script is useful for traders and analysts looking to perform advanced statistical analysis on financial data directly within TradingView.
When comparing two stock prices over a period of time, the statistical moments—mean, variance, skewness, and kurtosis—can provide a deep insight into the behavior of the stock prices and their distributions. Here’s what each moment signifies in this context:
1. Mean
Definition: The mean (or average) is the sum of the stock prices over the period divided by the number of data points. It represents the central value of the price series.
Interpretation: When comparing two stocks, the mean tells you the average price level of each stock over the period. A higher mean indicates that, on average, the stock price is higher compared to another stock with a lower mean.
Comparison Insight: If Stock A has a higher mean price than Stock B, it implies that Stock A's prices are generally higher than those of Stock B over the given period.
2. Variance
Definition: Variance measures the dispersion or spread of the stock prices around the mean. It is the average of the squared differences from the mean.
Interpretation: A higher variance indicates that the stock prices fluctuate more widely from the mean, implying greater volatility. Conversely, a lower variance indicates more stable and predictable prices.
Comparison Insight: Comparing the variances of two stocks helps in assessing which stock has more price volatility. If Stock A has a higher variance than Stock B, it means Stock A's prices are more volatile and less predictable compared to Stock B.
3. Skewness
Definition: Skewness measures the asymmetry of the distribution of stock prices around the mean. It can be positive, negative, or zero:
Positive Skewness: The distribution has a long right tail, with more frequent small returns and fewer large positive returns.
Negative Skewness: The distribution has a long left tail, with more frequent small returns and fewer large negative returns.
Zero Skewness: The distribution is symmetric around the mean.
Interpretation: Skewness tells you about the direction of outliers in the stock price distribution. Positive skewness means a higher probability of large positive returns, while negative skewness means a higher probability of large negative returns.
Comparison Insight: By comparing skewness, you can understand the nature of extreme returns for two stocks. For example, if Stock A has positive skewness and Stock B has negative skewness, Stock A might have more frequent large gains, whereas Stock B might have more frequent large losses.
4. Kurtosis
Definition: Kurtosis measures the "tailedness" of the distribution of stock prices. It indicates how much of the distribution is in the tails versus the center. High kurtosis means more outliers (extreme returns), while low kurtosis means fewer outliers.
Interpretation:
High Kurtosis: Indicates a higher likelihood of extreme price movements (both high and low) compared to a normal distribution.
Low Kurtosis: Indicates that extreme price movements are less common.
Comparison Insight: Comparing kurtosis between two stocks shows which stock has more extreme returns. If Stock A has higher kurtosis than Stock B, it means Stock A has more frequent extreme price changes, suggesting more risk or opportunities for large gains or losses.
Summary
Mean: Compares average price levels.
Variance: Compares price volatility.
Skewness: Compares the asymmetry of price movements.
Kurtosis: Compares the likelihood of extreme price changes.
By analyzing these statistical moments, you can gain a comprehensive view of how the two stocks behave relative to each other, which can inform investment decisions based on risk, return expectations, and the nature of price movements.
在腳本中搜尋"tradingview界面调整"
1000SATS and ORDI Market Cap RatioSure! Here is a detailed description and usage guide for your TradingView indicator:
### Indicator Description
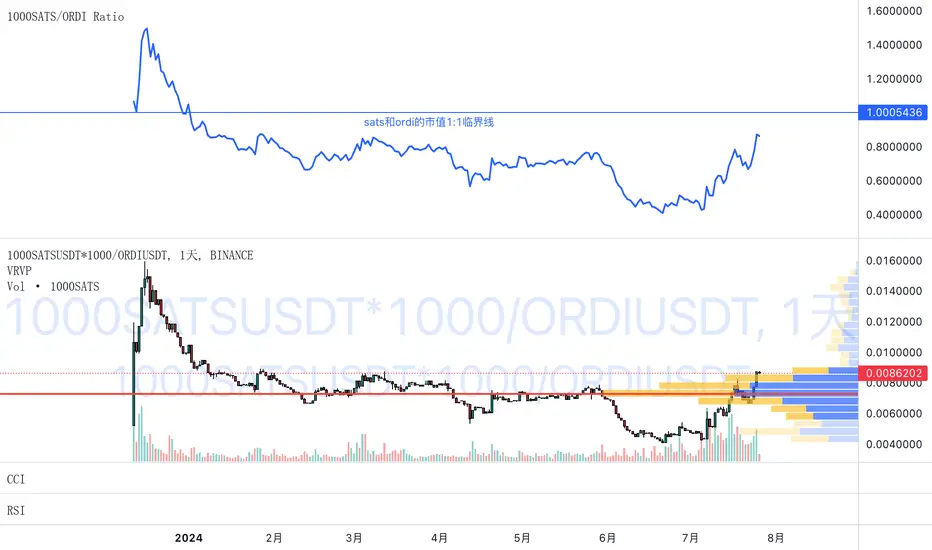
**Title**: 1000SATS/ORDI Market Cap Ratio
**Description**: The "1000SATS/ORDI Market Cap Ratio" indicator calculates and visualizes the market capitalization ratio between 1000SATS and ORDI. This indicator allows traders and investors to analyze the relative market strength and valuation trends of 1000SATS compared to ORDI over time. By tracking this ratio, users can gain insights into market dynamics and potential trading opportunities between these two assets.
### Indicator Usage
**Purpose**:
- To compare the market capitalizations of 1000SATS and ORDI.
- To identify potential undervaluation or overvaluation of 1000SATS relative to ORDI.
- To assist in making informed trading and investment decisions based on market cap trends.
**How to Use**:
1. **Add the Indicator to Your Chart**:
- Open TradingView and navigate to your chart.
- Click on the "Indicators" button at the top of the chart.
- Select "Pine Editor" and paste the provided script.
- Click "Add to Chart" to apply the indicator.
2. **Interpret the Ratio**:
- The indicator will plot a line representing the ratio of the market capitalization of 1000SATS to ORDI.
- A rising ratio indicates that the market cap of 1000SATS is increasing relative to ORDI, suggesting stronger market performance or higher valuation of 1000SATS.
- A falling ratio indicates that the market cap of 1000SATS is decreasing relative to ORDI, suggesting weaker market performance or lower valuation of 1000SATS.
3. **Analyze Trends**:
- Use the indicator to spot trends and potential reversal points in the market cap ratio.
- Combine the ratio analysis with other technical indicators and chart patterns to enhance your trading strategy.
4. **Set Alerts**:
- Set custom alerts on the ratio to notify you of significant changes or specific thresholds being reached, enabling timely decision-making.
**Example**:
- If the ratio is consistently rising, it may indicate a good opportunity to consider 1000SATS as a stronger investment relative to ORDI.
- Conversely, if the ratio is falling, it may be a signal to reevaluate the strength of 1000SATS compared to ORDI.
**Note**: Always conduct thorough analysis and consider other market factors before making trading decisions based on this indicator.
### Script
```pinescript
//@version=4
study("1000SATS and ORDI Market Cap Ratio", shorttitle="1000SATS/ORDI Ratio", overlay=true)
// Define the circulating supply for ORDI and 1000SATS
ORDI_supply = 21000000 // Circulating supply of ORDI
SATS_1000_supply = 2100000000000 // Circulating supply of 1000SATS
// Fetch the price data for ORDI
ordi_price = security("BINANCE:ORDIUSDT", timeframe.period, close)
// Fetch the price data for 1000SATS
sats_1000_price = security("BINANCE:1000SATSUSDT", timeframe.period, close)
// Calculate the market capitalizations
ordi_market_cap = ordi_price * ORDI_supply
sats_1000_market_cap = sats_1000_price * SATS_1000_supply
// Calculate the market cap ratio
ratio = sats_1000_market_cap / ordi_market_cap
// Plot the ratio
plot(ratio, title="1000SATS/ORDI Market Cap Ratio", color=color.blue, linewidth=2)
```
This description and usage guide should help users understand the purpose and functionality of your indicator, as well as how to effectively apply it in their trading activities on TradingView.
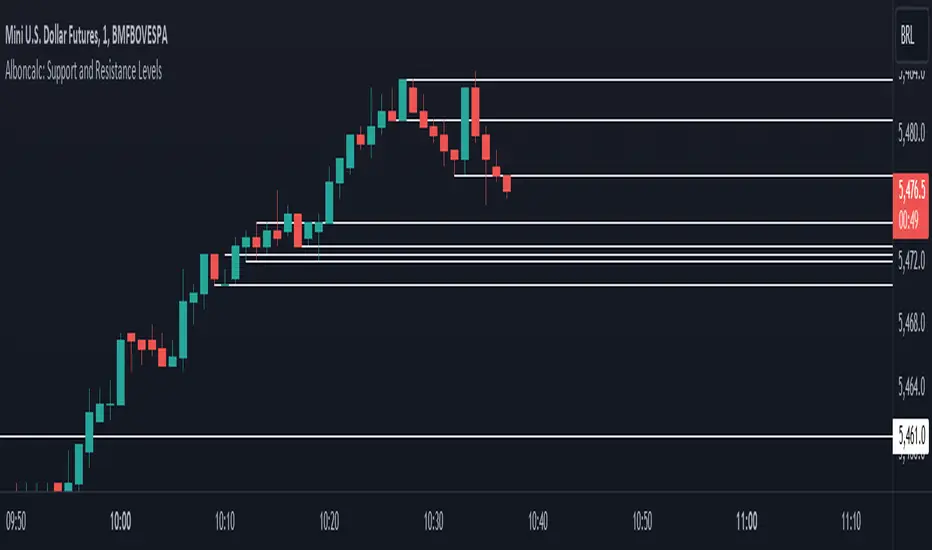
Alboncalc: Support and Resistance LevelsAlboncalc: Support and Resistance Levels
Description:
Alboncalc is an innovative TradingView indicator that identifies significant support and resistance levels based on patterns where two candles form equal highs and/or lows. This indicator automatically plots these critical levels on the chart, providing traders with clear visual cues of potential price reversal or consolidation points.
Originality and Usefulness:
Alboncalc stands out for its ability to detect specific candle patterns that indicate support and resistance, setting it apart from traditional support and resistance indicators. This specific method of price action analysis offers a unique and refined perspective for traders, adding value to the body of knowledge within the TradingView community.
How It Works:
Alboncalc analyzes historical prices to identify where two consecutive candles achieve equal highs or lows. When these conditions are met, the indicator automatically plots a support or resistance line on the chart. These levels are dynamically updated, ensuring that traders always have the most relevant and accurate information.
How to Use:
Installation: Add Alboncalc to your chart on TradingView.
Interpretation: Observe the plotted support and resistance lines. These lines indicate potential reversal or consolidation points.
Application: Use these levels to confirm breakout points or identify areas of price exhaustion. The clear visualization of technical levels helps enhance your trading strategies.
Underlying Concepts:
Alboncalc is based on price action analysis, focusing on specific candle patterns that signal important technical levels. The formation of two candles with equal highs or lows indicates a temporary balance between buyers and sellers, suggesting potential price direction changes.
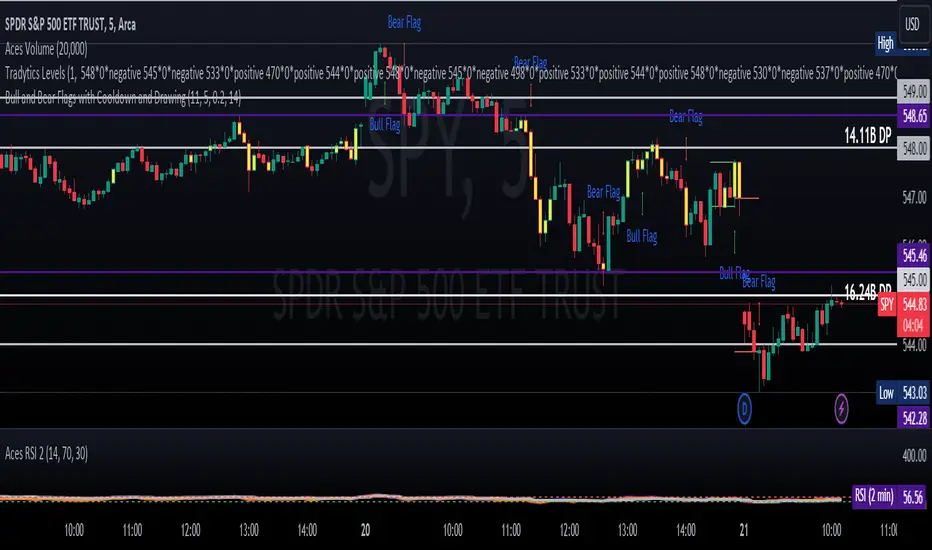
ET's FlagsPurpose:
This Pine Script is designed for the TradingView platform to identify and visually highlight specific technical chart patterns known as "Bull Flags" and "Bear Flags" on financial charts. These patterns are significant in trading as they can indicate potential continuation trends after a brief consolidation. The script includes mechanisms to manage signal frequency through a cooldown period, ensuring that the trading signals are not excessively frequent and are easier to interpret.
Functionality:
Input Parameters:
flagpole_length: Defines the number of bars to consider when identifying the initial surge in price, known as the flagpole.
flag_length: Determines the number of bars over which the flag itself is identified, representing a period of consolidation.
percent_change: Sets the minimum percentage change required to validate the presence of a flagpole.
cooldown_period: Specifies the number of bars to wait before another flag can be identified, reducing the risk of overlapping signals.
Percentage Change Calculation:
The script calculates the percentage change between two price points using a helper function percentChange(start, end). This function is crucial for determining whether the price movement within the specified flagpole_length meets the threshold set by percent_change, thus qualifying as a potential flagpole.
Flagpole Identification:
Bull Flagpole: Identified by finding the lowest close price over the flagpole_length and determining if the subsequent price rise meets or exceeds the specified percent_change.
Bear Flagpole: Identified by finding the highest close price over the flagpole_length and checking if the subsequent price drop is sufficient as per the percent_change.
Flag Identification:
After identifying a flagpole, the script assesses if the price action within the next flag_length bars consolidates in a manner that fits a flag pattern. This involves checking if the price fluctuation stays within the bounds set by the percent_change.
Signal Plotting:
If a bull or bear flag pattern is confirmed, and the cooldown period has passed since the last flag of the same type was identified, the script plots a visual shape on the chart:
Green shapes below the price bar for Bull Flags.
Red shapes above the price bar for Bear Flags.
Line Drawing:
For enhanced visualization, the script draws lines at the high and low prices of the flag during its formation period. This visually represents the consolidation phase of the flag pattern.
Debugging Labels:
The script optionally displays labels at the flag formation points, showing the exact percentage change achieved during the flagpole formation. This feature aids users in understanding why a particular segment of the price chart was identified as a flag.
Compliance and Usage:
This script does not automate trading but provides visual aids and potential signals based on historical price analysis. It adheres to TradingView's scripting policies by only accessing publicly available price data and user-defined parameters without executing trades or accessing any external data.
Conclusion:
This Pine Script is a powerful tool for traders who follow technical analysis, offering a clear, automated way to spot potential continuation patterns in the markets they monitor. By emphasizing visual clarity and reducing signal redundancy through cooldown periods, the script enhances decision-making processes for chart analysis on TradingView.
Fixed volume profile & zonesHi all!
If you like volume profile and like to create zones, where the price might react, this indicator might be for you. It plots a fixed volume profile and creates a user defined number of zones (shelves) of high volume.
If you want to know more about volume profile you can about it here on TradingView: se.tradingview.com
To do
• Add possiblity to create alerts for zone entries, breakouts and retest
• The importance of zones are now based on high volume slots only. It might be changed to include the slots around the 'master slot' to determine if the area is of high importance or not, your suggestions here are welcome!
• Show total volume in 'values'
• Error if the data cannot be fetched
• Add value area
• Make earlier (more important shelves) more visible (less transparent)
• Add possiblity to skip zones
Known issues
• Script execution is long when the volume profile is created (should be none)
• In some cases you can get overlapping shelves, avoid this
Settings
• Main
• Start/end bar of the volume profile (this is required)
• Data
• Timeframe (for getting the volume data)
• Levels (the number of slots in the volume profile)
• Shelves (the number of zones with high volume to plot) and it's color
• Max slot (have this enabled if you want the shelf's highest volume slot to have a dotted line and choose it's color
• Show info (show the order of the plotted zone)
• Style (how the volume profile will look)
• Histogram box (the color of the background of the volume profile)
• Up (the color of bullish volume)
• Down (the color of bearish volume)
• Point of control (color and if it should be extended or not)
• Values and text color (show bullish and bearish volume values)
The defaults on all settings are based on the daily timeframe. This indicator is not 'complete' and I plan to work on it when I get the time.
Note that the precision for the volume profile is per candle, so some levels can have visuals as others but lower volume.
The slot (level) volume has to have a lower difference to the volume included in the shelf than the next volume to be checked to be included. If the level being checked for inclusion in a shelf is at the end of boundaries (high and low) of the volume profile, the volume has to be higher than the golden ratio of the volume before.
You can also use this indicator if you just want a volume profile to show, just set the the number of zones to plot (in 'Shelves') to 0.
I hope I haven't forgotten anything and that it's clear, let me know otherwise.
Best of trading luck!

Candlestick Bias OscillatorCandlestick Bias Oscillator (CBO)
The Candlestick Bias Oscillator (CBO) with Signal Line is a pioneering indicator developed for the TradingView platform, designed to offer traders a nuanced analysis of market sentiment through the unique lens of candlestick patterns. This indicator stands out by merging traditional concepts of price action analysis with innovative mathematical computations, providing a fresh perspective on trend detection and potential market reversals.
Originality and Utility
At the core of the CBO's originality is its method of calculating the bias of candlesticks. Unlike conventional oscillators that may rely solely on closing prices or high-low ranges, the CBO incorporates both the body and wick of candlesticks into its analysis. This dual consideration allows for a more rounded understanding of market sentiment, capturing both the directional momentum and the strength of price rejections within a single oscillator.
Mathematical Foundations
1. Body Bias: The CBO calculates the body bias by assessing the relative position of the close to the open within the day's range, scaled to a -100 to 100 range. This calculation reflects the bullish or bearish sentiment of the market, based on the day's closing momentum.
Body Bias = (Close−Open)/(High−Low) x 100
Wick Bias: Similarly, the wick bias calculation takes into account the lengths of the upper and lower wicks, indicating rejection levels beyond the body's close. The balance between these wicks is scaled similarly to the body bias, offering insight into the market's indecision or rejection of certain price levels.
Wick Bias=(Lower Wick−Upper Wick)/(Total Wick Length) × 100
3. Overall Bias and Oscillator: By averaging the body and wick biases, the CBO yields an overall bias score, which is then smoothed over a user-defined period to create the oscillator. This oscillator provides a clear visual representation of the market's underlying sentiment, smoothed to filter out the noise.
4. Signal Line: A secondary smoothing of the oscillator creates the signal line, offering a trigger for potential trading signals when the oscillator crosses this line, indicative of a change in market momentum.
How to Use the CBO:
The CBO is versatile, suitable for various trading strategies, including scalping, swing trading, and long-term trend following. Traders can use the oscillator and signal line crossovers as indications for entry or exit points. The relative position of the oscillator to the zero line further provides insight into the prevailing market bias, enabling traders to align their strategies with the broader market sentiment.
Why It Adds Value:
The CBO's innovative approach to analyzing candlestick patterns fills a gap in the existing array of TradingView indicators. By providing a detailed analysis of both candle bodies and wicks, the CBO offers a more comprehensive view of market sentiment than traditional oscillators. This can be particularly useful for traders looking to gauge the strength of price movements and potential reversal points with greater precision.
Conclusion:
The Candle Bias Oscillator with Signal Line is not just another addition to the plethora of indicators on TradingView. It represents a significant advancement in the analysis of market sentiment, combining traditional concepts with a novel mathematical approach. By offering a deeper insight into the dynamics of candlestick patterns, the CBO equips traders with a powerful tool to navigate the complexities of the market with increased confidence.
Explore the unique insights provided by the CBO and integrate it into your trading strategy for a more informed and nuanced market analysis.

Consolidation indicator█ Overview
The "Consolidation Indicator" is a custom indicator for TradingView designed to identify consolidation periods in the price chart. Consolidation typically occurs when the price of an asset moves within a narrow range, and this indicator helps traders recognize such conditions. It can be a useful tool for traders looking to identify potential breakouts or periods of reduced volatility.
█ Indicator Settings
1 — Timeframe: This setting allows you to select the timeframe for which you want to analyze consolidation. You can choose from various timeframes available in TradingView.
2 — Price Smoothing Length: This parameter controls the smoothing of price data. You can adjust the value, with a minimum of 1, to control the level of smoothing applied to the price data.
3 — Average Range Length (range_len): This setting defines the length of the average range used in the calculation of the indicator. By default, it is set to 14.
4 — Threshold for Narrow Range (NR_threshold): The indicator will consider a price range as narrow if it falls below this threshold as a percentage of the average range. It is set to 80% by default.
5 — Consecutive Narrow Ranges for Consolidation: This parameter allows you to specify how many consecutive narrow price ranges are required to confirm a consolidation period. The default value is 3.
6 — Candle Color: You can choose the color for the consolidation candles. The default is a bright green color.
█ Indicator Output
The indicator visually displays consolidation and breakout periods on the price chart using colored candles and breakout icons.
• Candles: During a consolidation period, the indicator colorizes the candles in a specified color (default is green) with a transparency that decreases as the number of consecutive narrow ranges increases. This allows you to easily spot consolidation periods on the chart.
• Breakout Icons: The indicator also places a breakout icon (💥) below the price chart to indicate potential breakout opportunities. When a breakout condition is met, the icon appears with an orange color.
█ Alerts
The indicator provides two alert conditions:
1 — Consolidation Begins: This alert triggers when a consolidation period starts. It indicates that the price is moving within a narrow range compared to the average range.
2 — Breakout: This alert triggers when a potential breakout from the consolidation is detected.
█ How to Use
1 — Apply the "Consolidation Indicator" to your TradingView chart by adding it as a custom indicator.
2 — Customize the indicator settings based on your trading preferences, such as timeframe, smoothing length, and threshold for a narrow range.
3 — Monitor the chart for colored candles. The indicator will color candles to highlight consolidation periods.
4 — Look for the breakout icon (💥) below the chart, which indicates potential breakout opportunities.
5 — Set up alerts to be notified when a consolidation begins or a breakout is detected, helping you stay on top of potential trading opportunities.
Keep in mind that this indicator is a tool to assist in identifying consolidation periods, and it should be used in conjunction with other analysis methods for comprehensive trading decisions.

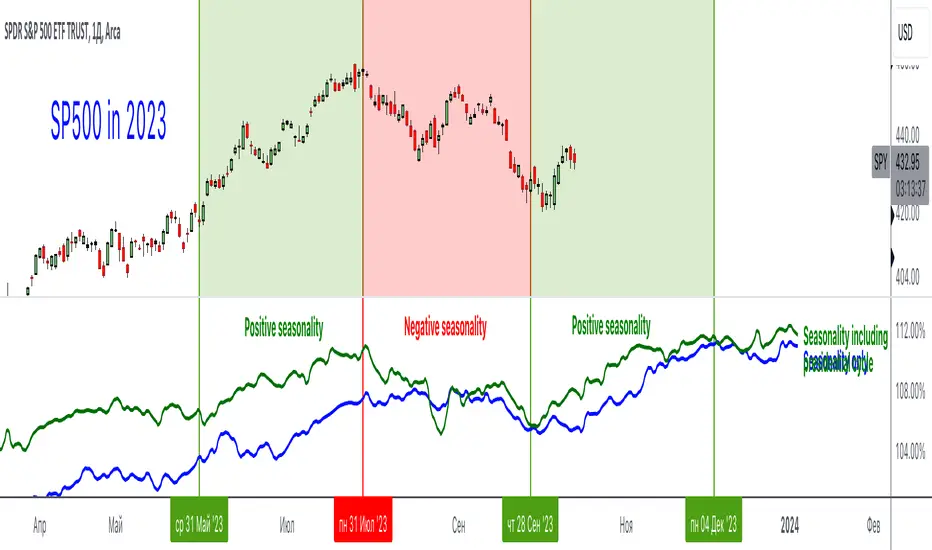
Seasonality and Presidential cycleAn incredibly useful indicator that shows seasonality and presidential cycles by indices, stocks and industries. Just type in a ticker and trade according to seasonal patterns
Blue line - seasonality excluding presidential cycles
Green line - seasonality taking into account presidential cycles
*Seasonal patterns over the last 10 years
This indicator uses the request.seed() function.
Requests data from a GitHub repository maintained by our team and returns it as a series.
Pine Seeds is a service to import custom data and access it via TradingView.
Use TradingView as frontend and use a GitHub repository as backend.
github.com
...
Rus: Невероятно полезный индикатор, который показывает сезонность и президентские циклы по индексам, акциям и отраслям. Просто вбейте тикер и торгуйте согласно сезонным паттернам
Синяя линия - сезонность без учета президентских циклов
Зеленая линия - сезонность с учетом президентских циклов
*Сезонные паттерны за последние 10 лет
Long-Only Opening Range Breakout (ORB) with Pivot PointsIntraday Trading Strategy: Long-Only Opening Range Breakout (ORB) with Pivot Points
Background:
Opening Range Breakout (ORB) is a popular long-only trading strategy that capitalizes on the early morning volatility in financial markets. It's based on the idea that the initial price movements during the first few minutes or hours of the trading day can set the tone for the rest of the session. The strategy involves identifying a price range within which the asset trades during the opening period and then taking long positions when the price breaks out to the upside of this range.
Pivot Points are a widely used technical indicator in trading. They represent potential support and resistance levels based on the previous day's price action. Pivot points are calculated using the previous day's high, low, and close prices and can help traders identify key price levels for making trading decisions.
How to Use the Script:
Initialization: This script is written in Pine Script, a domain-specific language for trading strategies on the TradingView platform. To use this script, you need to have access to TradingView.
Apply the Script: You can do this by adding it to your favorites, then selecting the script in the indicators list under favorites or by searching for it by name under community scripts.
Customize Settings: The script allows you to customize various settings through the TradingView interface. These settings include:
Opening Session: You can set the time frame for the opening session.
Max Trades per Day: Specify the maximum number of long trades allowed per trading day.
Initial Stop Loss Type: Choose between using a percentage-based stop loss or the previous candles low for stop loss calculations.
Stop Loss Percentage: If you select the percentage-based stop loss, specify the percentage of the entry price for the stop loss.
Backtesting Start and End Time: Set the time frame for backtesting the strategy.
Strategy Signals:
The script will display pivot points in blue (R1, R2, R3, R4, R5) and half-pivot points in gray (R0.5, R1.5, R2.5, R3.5, R4.5) on your chart.
The green line represents the opening range.
The script generates long (buy) signals based on specific conditions:
---The open price is below the opening range high (h).
---The current high price is above the opening range high.
---Pivot point R1 is above the opening range high.
---It's a long-only strategy designed to capture upside breakouts.
---It also respects the maximum number of long trades per day.
The script manages long positions, calculates stop losses, and adjusts long positions according to the defined rules.
Trailing Stop Mechanism
The script incorporates a dynamic trailing stop mechanism designed to protect and maximize profits for long positions. Here's how it works:
1. Initialization:
The script allows you to choose between two types of initial stop loss:
---Percentage-based: This option sets the initial stop loss as a percentage of the entry price.
---Previous day's low: This option sets the initial stop loss at the previous day's low.
2. Setting the Initial Stop Loss (`sl_long0`):
The initial stop loss (`sl_long0`) is calculated based on the chosen method:
---If "Percentage" is selected, it calculates the stop loss as a percentage of the entry price.
---If "Previous Low" is selected, it sets the stop loss at the previous day's low.
3. Dynamic Trailing Stop (`trail_long`):
The script then monitors price movements and uses a dynamic trailing stop mechanism (`trail_long`) to adjust the stop loss level for long positions.
If the current high price rises above certain pivot point levels, the trailing stop is adjusted upwards to lock in profits.
The trailing stop levels are calculated based on pivot points (`r1`, `r2`, `r3`, etc.) and half-pivot points (`r0.5`, `r1.5`, `r2.5`, etc.).
The script checks if the high price surpasses these levels and, if so, updates the trailing stop accordingly.
This dynamic trailing stop allows traders to secure profits while giving the position room to potentially capture additional gains.
4. Final Stop Loss (`sl_long`):
The script calculates the final stop loss level (`sl_long`) based on the following logic:
---If no position is open (`pos == 0`), the stop loss is set to zero, indicating there is no active stop loss.
---If a position is open (`pos == 1`), the script calculates the maximum of the initial stop loss (`sl_long0`) and the dynamic trailing stop (`trail_long`).
---This ensures that the stop loss is always set to the more conservative of the two values to protect profits.
5. Plotting the Stop Loss:
The script plots the stop loss level on the chart using the `plot` function.
It will only display the stop loss level if there is an open position (`pos == 1`) and it's not a new trading day (`not newday`).
The stop loss level is shown in red on the chart.
By combining an initial stop loss with a dynamic trailing stop based on pivot points and half-pivot points, the script aims to provide a comprehensive risk management mechanism for long positions. This allows traders to lock in profits as the price moves in their favor while maintaining a safeguard against adverse price movements.
End of Day (EOD) Exit:
The script includes an "End of Day" (EOD) exit mechanism to automatically close any open positions at the end of the trading day. This feature is designed to manage and control positions when the trading day comes to a close. Here's how it works:
1. Initialization:
At the beginning of each trading day, the script identifies a new trading day using the `is_newbar('D')` condition.
When a new trading day begins, the `newday` variable becomes `true`, indicating the start of a new trading session.
2. Plotting the "End of Day" Signal:
The script includes a plot on the chart to visually represent the "End of Day" signal. This is done using the `plot` function.
The plot is labeled "DayEnd" and is displayed as a comment on the chart. It signifies the EOD point.
3. EOD Exit Condition:
When the script detects that a new trading day has started (`newday == true`), it triggers the EOD exit condition.
At this point, the script proceeds to close all open positions that may have been active during the trading day.
4. Closing Open Positions:
The `strategy.close_all` function is used to close all open positions when the EOD exit condition is met.
This function ensures that any remaining long positions are exited, regardless of their current profit or loss.
The function also includes an `alert_message`, which can be customized to send an alert or notification when positions are closed at EOD.
Purpose of EOD Exit
The "End of Day" exit mechanism serves several essential purposes in the trading strategy:
Risk Management: It helps manage risk by ensuring that positions are not left open overnight when markets can experience increased volatility.
Capital Preservation: Closing positions at EOD can help preserve trading capital by avoiding potential adverse overnight price movements.
Rule-Based Exit: The EOD exit is rule-based and automatic, ensuring that it is consistently applied without emotions or manual intervention.
Scalability: It allows the strategy to be applied to various markets and timeframes where EOD exits may be appropriate.
By incorporating an EOD exit mechanism, the script provides a comprehensive approach to managing positions, taking profits, and minimizing risk as each trading day concludes. This can be especially important in volatile markets like cryptocurrencies, where overnight price swings can be significant.
Backtesting: The script includes a backtesting feature that allows you to test the strategy's performance over historical data. Set the start and end times for backtesting to see how the long-only strategy would have performed in the past.
Trade Execution: If you choose to use this script for live trading, make sure you understand the risks involved. It's essential to set up proper risk management, including position sizing and stop loss orders.
Monitoring: Monitor the long-only strategy's performance over time and be prepared to make adjustments as market conditions change.
Disclaimer: Trading carries a risk of capital loss. This script is provided for educational purposes and as a starting point for your own long-only strategy development. Always do your own research and consider seeking advice from a qualified financial professional before making trading decisions.

Ultimate Correlation CoefficientIt contains the Correlations for SP:SPX , TVC:DXY , CURRENCYCOM:GOLD , TVC:US10Y and TVC:VIX and is intended for INDEX:BTCUSD , but works fine for most other charts as well.
Don't worry about the colored mess, what you want is to export your chart ->
TradingView: How can I export chart data?
and then use the last line in the csv file to copy your values into a correlation table.
Order is:
SPX
DXY
GOLD
US10Y
VIX
Your last exported line should look like this:
2023-05-25T02:00:00+02:00 26329.56 26389.12 25873.34 26184.07 0 0.255895534 -0.177543633 0.011944815 0.613678565 0.387705043 0.696003298 0.566425278 0.877838156 0.721872645 0 -0.593674719 -0.839538073 -0.662553817 -0.873684242 -0.695764534 -0.682759656 -0.54393749 -0.858188808 -0.498548691 0 0.416552489 0.424444345 0.387084882 0.887054782 0.869918437 0.88455388 0.694720993 0.192263269 -0.138439783 0 -0.39773255 -0.679121698 -0.429927048 -0.780313396 -0.661460134 -0.346525721 -0.270364046 -0.877208139 -0.367313687 0 -0.615415111 -0.226501775 -0.094827955 -0.475553396 -0.408924242 -0.521943234 -0.426649404 -0.266035908 -0.424316191
The zeros are thought as a demarcation for ease of application :
2023-05-25T02:00:00+02:00 26329.56 26389.12 25873.34 26184.07 0 -> unused
// 15D 30D 60D 90D 120D 180D 360D 600D 1000D
0.255895534 -0.177543633 0.011944815 0.613678565 0.387705043 0.696003298 0.566425278 0.877838156 0.721872645 -> SPX
0
-0.593674719 -0.839538073 -0.662553817 -0.873684242 -0.695764534 -0.682759656 -0.54393749 -0.858188808 -0.498548691 -> DXY
0
0.416552489 0.424444345 0.387084882 0.887054782 0.869918437 0.88455388 0.694720993 0.192263269 -0.138439783 -> GOLD
0
-0.39773255 -0.679121698 -0.429927048 -0.780313396 -0.661460134 -0.346525721 -0.270364046 -0.877208139 -0.367313687 -> US10Y
0
-0.615415111 -0.226501775 -0.094827955 -0.475553396 -0.408924242 -0.521943234 -0.426649404 -0.266035908 -0.424316191 -> VIX

AI-Bank-Nifty Tech AnalysisThis code is a TradingView indicator that analyzes the Bank Nifty index of the Indian stock market. It uses various inputs to customize the indicator's appearance and analysis, such as enabling analysis based on the chart's timeframe, detecting bullish and bearish engulfing candles, and setting the table position and style.
The code imports an external script called BankNifty_CSM, which likely contains functions that calculate technical indicators such as the RSI, MACD, VWAP, and more. The code then defines several table cell colors and other styling parameters.
Next, the code defines a table to display the technical analysis of eight bank stocks in the Bank Nifty index. It then defines a function called get_BankComponent_Details that takes a stock symbol as input, requests the stock's OHLCV data, and calculates several technical indicators using the imported CSM_BankNifty functions.
The code also defines two functions called get_EngulfingBullish_Detection and get_EngulfingBearish_Detection to detect bullish and bearish engulfing candles.
Finally, the code calculates the technical analysis for each bank stock using the get_BankComponent_Details function and displays the results in the table. If the engulfing input is enabled, the code also checks for bullish and bearish engulfing candles and displays buy/sell signals accordingly.
The FRAMA stands for "Fractal Adaptive Moving Average," which is a type of moving average that adjusts its smoothing factor based on the fractal dimension of the price data. The fractal dimension reflects self-similarity at different scales. The FRAMA uses this property to adapt to the scale of price movements, capturing short-term and long-term trends while minimizing lag. The FRAMA was developed by John F. Ehlers and is commonly used by traders and analysts in technical analysis to identify trends and generate buy and sell signals. I tried to create this indicator in Pine.
In this context, "RS" stands for "Relative Strength," which is a technical indicator that compares the performance of a particular stock or market sector against a benchmark index.
The "Alligator" is a technical analysis tool that consists of three smoothed moving averages. Introduced by Bill Williams in his book "Trading Chaos," the three lines are called the Jaw, Teeth, and Lips of the Alligator. The Alligator indicator helps traders identify the trend direction and its strength, as well as potential entry and exit points. When the three lines are intertwined or close to each other, it indicates a range-bound market, while a divergence between them indicates a trending market. The position of the price in relation to the Alligator lines can also provide signals, such as a buy signal when the price crosses above the Alligator lines and a sell signal when the price crosses below them.
In addition to these, we have several other commonly used technical indicators, such as MACD, RSI, MFI (Money Flow Index), VWAP, EMA, and Supertrend. I used all the built-in functions for these indicators from TradingView. Thanks to the developer of this TradingView Indicator.
I also created a BankNifty Components Table and checked it on the dashboard.

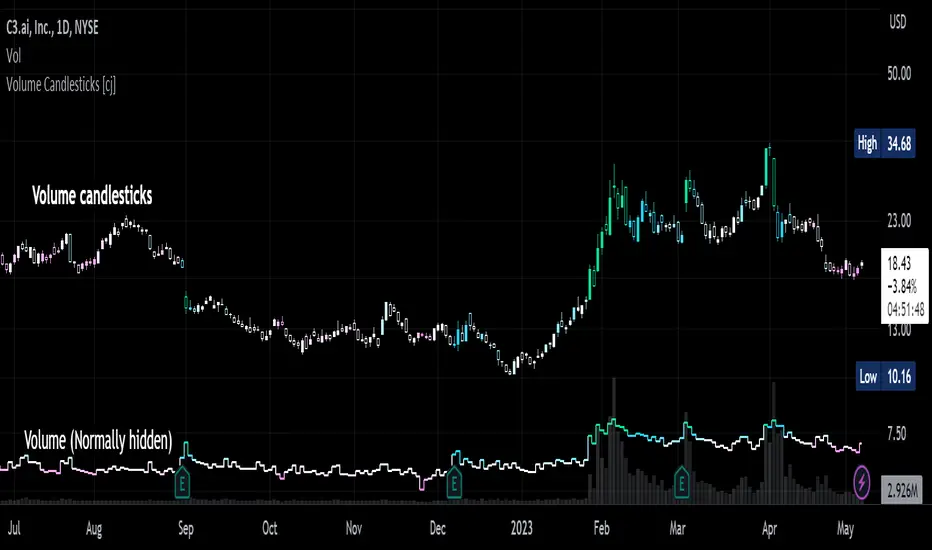
Volume Candlesticks [cajole]
This script lets you create the equivalent of "volume candlesticks" in TradingView.
"Volume candlesticks" normally vary their width according to the bar's volume. This script varies COLOUR instead of WIDTH.
Bar charts are also supported.
Candles/Bars are coloured by their distance from the average volume. You can also add a "huge volume" colour to further highlight the most extremely-high volume bars.
Note that volume is extrapolated for incomplete bars by default. So, if the average volume of the past 10 days is 5M shares, and 5M shares trade in the first 10% of today's session, that bar will be coloured as though 50M shares have traded. Set the "Extrapolate" option to 1.0 to disable this.
For this script to work properly, you should set TradingView's default candle/bar colours to be at least 20% transparent. By default, TradingView tends to overlay its own bars on top of indicators.
Nerdy details:
The script works best on a dark background, because it is easier to change the hue of white bars than of black bars. If you find a set of colours that work for white backgrounds, please comment with them!
The geometric mean is used instead of the arithmetic mean, to keep the 'average' from being strongly influenced by spikes. Bars are
then coloured by assuming a normal probability distribution and highlighting outliers. (This means that the first high-volume bars are coloured differently to later ones.)
Correlation prix [SP500, TESLA, BTCBefore you see this post I want to thank all the TradingView team. Every day that passes I learn better and better to use Pine script and I owe this to all those who publish and to the philosophy of TradingView. Thanks from Amos
This trading indicator compares the prices of the S&P 500 Index (SP500), Tesla (TSLA), and Bitcoin (BTC) to find correlations between them. To make the prices of SP500 and Tesla comparable to the price of Bitcoin, the indicator multiplies the closing price of Tesla by 114 and the closing price of the S&P 500 Index by 5.6.
In this way we can superimpose the prices on the BTC chart and see what happens.
Average BTC price/ tesla price = 114, so if we multiply the tesla price by 114 times we can superimpose it on the BTC price
At average BTC/SPX price = 5.6, also in this case we multiply the price of SPX by 5.6 to overlay the graph and see any correlations.
The indicator then calculates the average price between SP500 and Tesla, using the formula (SP500 + Tesla) / 2. This calculation creates a new line on the chart that represents the average price between these two assets.
The BTC_SP_TE variable is then calculated as the average of the closing price of Bitcoin and the previously calculated average price of SP500 and Tesla, using the formula (Btc + SP_TE) / 2. This calculation creates another line on the chart that represents the average price between Bitcoin and the previously calculated average between SP500 and Tesla.
The idea behind calculating these averages is to find correlations and patterns between the prices of these assets, which can help identify potential trading opportunities. By comparing the average prices of different assets, the trader can look for trends and patterns that might not be apparent when looking at each asset individually.
The indicator plots these prices on a chart and fills the area between them with either green or fuchsia, depending on which one is higher. The strategy suggests buying Bitcoin when the average price of SP500 and Tesla is higher than the current price of Bitcoin, and selling when it is lower.
To add visual cues to the trading strategy, the indicator uses the plotchar function to display a small triangle below the chart when it detects a potential buying opportunity. This is done with the following parameters:
Value: BTC_SP_TE < Btc and Btc > Btc1 and Btc1 > Btc , which is a logical expression that checks whether the average price of SP500 and Tesla is less than the current price of Bitcoin (BTC_SP_TE < Btc), and whether the current price of Bitcoin is higher than the price 10 bars ago (Btc > Btc1 ) and higher than the price on the previous bar (Btc1 > Btc ).
Text: "Moyen BTC_SP_Te", which is the text to display inside the marker.
Symbol: "▲", which is the symbol to use for the marker. In this case, it is a small triangle pointing upwards.
Location: location.belowbar, which specifies that the marker should be placed below the bar.
I hope this is an example of how to create an indicator on TradingView, remember that correlations do not always last, it is possible that when you see the graph this correspondence no longer exists, do your studies and get inspired.

Rule Of 20 - Fair Value Estimation by Inflation & Earnings (TG)The Rule Of 20 is a heuristic calculation to find the fair value of an asset or market given its earnings and current inflation.
Its calculation is straightforward: the fair multiple of the price or price-to-earnings ratio of a stock should be 20 minus the rate of inflation.
In math terms: fair_price-to-earnings_ratio = (20 - inflation) ; fair_value = current_price * fair_price-to-earnings_ratio / real_price-to-earnings_ratio
For example, if a stock or index was trading on 11 times earnings and inflation was 2%, then the theory would be that the fair price-to-earnings ratio would be 20-2 = 18, which is much higher than the real price-to-earnings ratio of 11, and hence the asset would be undervalued.
Conversely, a market or company that was trading on 18 times price-to-earnings ration when inflation was 8% was seen as overvalued, because of the fair price-to-earnings ratio being 20-8=12, hence much lower than the real price-to-earnings ratio of 18.
We can then project the delta between the fair PE and real PE onto the asset's value to obtain the projected fair value, which may be a target of future value the asset may reach or hover around.
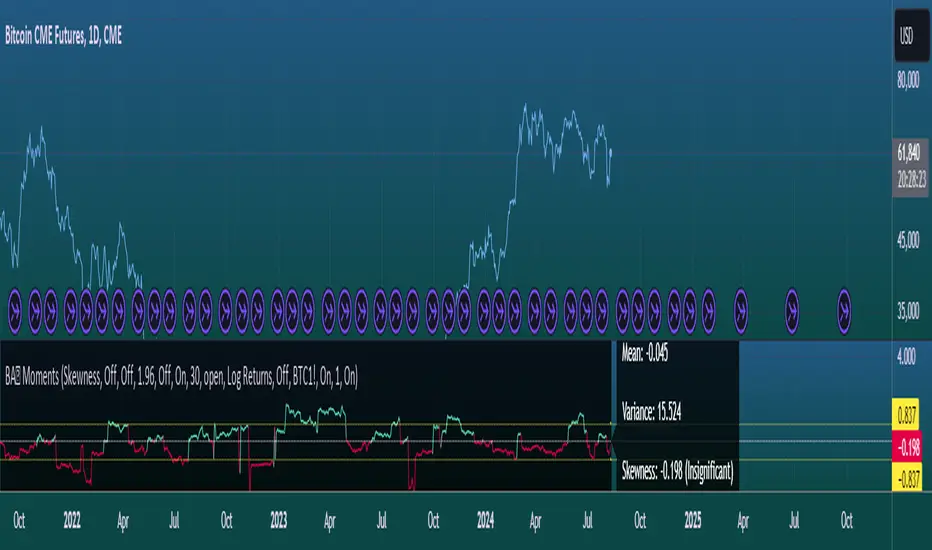
For example, as of 1st November 2022, SPX stood at 3871.97, with a PE ratio of 20.14 and an inflation in the US of 7.70. Using the Rule Of 20, we find that the fair PE ratio is 20-7.7=12.3, which is much lower than the current PE ratio of 20.14 by 39%! This may indicate a future possibility of a further downside risk by 39% from current valuation levels.
The origins of this rule are unknown, although the legendary US fund manager Peter Lynch is said to have been an active proponent when he was directing the Fidelity’s Magellan fund from 1977 to 1990.
For more infos about the Rule Of 20, reading this article is recommended: www.sharesmagazine.co.uk
This indicator implements the Rule Of 20 on any asset where the Financials are availble to TradingView, and also for the entire SP:SPX index as a way to assess the wider US stock market. Technically, the calculation is a bit different for the latter, as we cannot access earnings of SPX through Financials on TradingView, so we access it using the QUANDL:MULTPL/SP500_PE_RATIO_MONTH ticker instead.
By default are displayed:
current asset value in red
fair asset value according to the Rule Of 20 in white for SPX, or different shades of purple/maroon for other assets. Note that for SPX there is only one calculation, whereas for other assets there are multiple different ways to calculate earnings, so different fair values can be computed.
fair price-to-earnings ratio (PE ratio) in light grey.
real price-to-earnings ratio in darker grey.
This indicator can be used on SP:SPX ticker, and on most NASDAQ:* tickers, since they have Financials integrated in TradingView. Stocks tickers from other exchanges may not provide Financials data, so this indicator won't work then. If this happens, try to find the same ticker on NASDAQ instead.
Note that by default, only the US stock market is considered. If you want to consider stocks or assets in other regions of the world, please change the inflation ticker to a ticker that reflect the target region's inflation.
Also adding a table to ease interpretation was considered, but then the Timeframe MTF parameter would not work, and since the big advantage of this indicator is to allow for historical comparisons, the table was dropped.
Enjoy, and keep in mind that all models are wrong, but some are useful.
Trade safely!
TG

Regression Channel, Candles and Candlestick Patterns by MontyRegression Candles by ugurvu
Regression Channel by Tradingview
All Candlestick Patterns By Tradingview
This script was combined for a friend of mine who needed this.
This Script has regression candles by ugurvu, Regression channel and Candlestick patterns by tradingview.
The intention was to fuse these together so more information can be processed on the cost of a single indicator.

Real Woodies CCIAs always, this is not financial advice and use at your own risk. Trading is risky and can cost you significant sums of money if you are not careful. Make sure you always have a proper entry and exit plan that includes defining your risk before you enter a trade.
Ken Wood is a semi-famous trader that grew in popularity in the 1990s and early 2000s due to the establishment of one of the earliest trading forums online. This forum grew into "Woodie's CCI Club" due to Wood's love of his modified Commodity Channel Index (CCI) that he used extensively. From what I can tell, the website is still active and still follows the same core principles it did in the early days, the CCI is used for entries, range bars are used to help trader's cut down on the noise, and the optional addition of Woodie's Pivot Points can be used as further confirmation of support and resistance. This is my take on his famous "Woodie's CCI" that has become standard on many charting packages through the years, including a TradingView sponsored version as one of the many stock indicators provided by TradingView. Woodie has updated his CCI through the years to include several very cool additions outside of the standard CCI. I will have to say, I am a bit biased, but I think this is hands down one of the best indicators I have ever used, and I am far too young to have been part of the original CCI Club. Being a daytrader primarily, this fits right in my timeframe wheel house. Woodie designed this indicator to work on a day-trading time scale and he frequently uses this to trade futures and commodity contracts on the 30 minute, often even down to the one minute timeframe. This makes it unique in that it is probably one of the only daytrading-designed indicators out there that I am aware of that was not a popular indicator, like the MACD or RSI, that was just adopted by daytraders.
The CCI was originally created by Donald Lambert in 1980. Over time, it has become an extremely popular house-hold indicator, like the Stochastics, RSI, or MACD. However, like the RSI and Stochastics, there are extensive debates on how the CCI is actually meant to be used. Some trade it like a reversal indicator, where values greater than 100 or less than -100 are considered overbought or oversold, respectively. Others trade it like a typical zero-line cross indicator, where once the value goes above or below the zero-line, a trade should be considered in that direction. Lastly, some treat it as strictly a momentum indicator, where values greater than 100 or less than -100 are seen as strong momentum moves and when these values are reached, a new strong trend is establishing in the direction of the move. The CCI itself is nothing fancy, it just visualizes the distance of the closing price away from a user-defined SMA value and plots it as a line. However, Woodie's CCI takes this simple concept and adds to it with an indicator with 5 pieces to it designed to help the trader enter into the highest probability setups. Bear with me, it initially looks super complicated, but I promise it is pretty straight-forward and a fun indicator to use.
1) The CCI Histogram. This is your standard CCI value that you would find on the normal CCI. Woodie's CCI uses a value of 14 for most trades and a value of 20 when the timeframe is equal to or greater than 30minutes. I personally use this as a 20-period CCI on all time frames, simply for the fact that the 20 SMA is a very popular moving average and I want to know what the crowd is doing. This is your coloured histogram with 4 colours. A gray colouring is for any bars above or below the zero line for 1-4 bars. A yellow bar is a "trend bar", where the long period CCI has been above/below the zero line for 5 consecutive bars, indicating that a trend in the current direction has been established. Blue bars above and red bars below are simply 6+n number of bars above or below the zero line confirming trend. These are used for the Zero-Line Reject Trade (explained below). The CCI Histogram has a matching long-period CCI line that is painted the same colour as the histogram, it is the same thing but is used just to outline the Histogram a bit better.
2) The CCI Turbo line. This is a sped-up 6 period CCI. This is to be used for the Zero-Line Reject trades, trendline breaks, and to identify shorter term overbought/oversold conditions against the main trend. This is coloured as the white line.
3) The Least Squares Moving Average Baseline (LSMA) Zero Line. You will notice that the Zero Line of the indicator is either green or red. This is based on when price is above or below the 25-period LSMA on the chart. The LSMA is a 25 period linear regression moving average and is one of the best moving averages out there because it is more immune to noise than a typical MA. Statistically, an LSMA is designed to find the line of best fit across the lookback periods and identify whether price is advancing, declining, or flat, without the whipsaw that other MAs can be privy to. The zero line of the indicator will turn green when the close candle is over the LSMA or red when it is below the LSMA. This is meant to be a confirmation tool only and the CCI Histogram and Turbo Histogram can cross this zero line without any corresponding change in the colour of the zero line on that immediate candle.
4) The +100 and -100 lines are used in two ways. First, they can be used by the CCI Histogram and CCI Turbo as a sort of minor price resistance and if the CCI values cannot get through these, it is considered weakness in that trade direction until they do so. You will notice that both of these lines are multi-coloured. They have been plotted with the ChopZone Indicator, another TradingView built-in indicator. The ChopZone is a trend identification tool that uses the slope and the direction of a 34-period EMA to identify when price is trending or range bound. While there are ~10 different colours, the main two a trader needs to pay attention to are the turquoise/cyan blue, which indicates price is in an uptrend, and dark red, which indicates price is in a downtrend based on the slope and direction of the 34 EMA. All other colours indicate "chop". These colours are used solely for the Zero-Line Reject and pattern trades discussed below. They are plotted both above and below so you can easily see the colouring no matter what side of the zero line the CCI is on.
5) The +200 and -200 lines are also used in two ways. First, they are considered overbought/oversold levels where if price exceeds these lines then it has moved an extreme amount away from the average and is likely to experience a pullback shortly. This is more useful for the CCI Histogram than the Turbo CCI, in all honesty. You will also notice that these are coloured either red, green, or yellow. This is the Sidewinder indicator portion. The documentation on this is extremely sparse, only pointing to a "relationship between the LSMA and the 34 EMA" (see here: tlc.thinkorswim.com). Since I am not a member of Woodie's CCI Club and never intend to be I took some liberty here and decided that the most likely relationship here was the slope of both moving averages. Therefore, the Sidewinder will be green when both the LSMA and the 34 EMA are rising, red when both are falling, and yellow when they are not in agreement with one another (i.e. one rising/flat while the other is flat/falling). I am a big fan of Dr. Alexander Elder as those who follow me know, so consider this like Woodie's version of the Elder Impulse System. I will fully admit that this version of the Sidewinder is a guess and may not represent the real Sidewinder indicator, but it is next to impossible to find any information on this, so I apologize, but my version does do something useful anyways. This is also to be used only with the Zero-Line Reject trades. They are plotted both above and below so you can easily see the colouring no matter what side of the zero line the CCI is on.
How to Trade It According to Woodie's CCI Club:
Now that I have all of my components and history out of the way, this is what you all care about. I will only provide a brief overview of the trades in this system, but there are quite a few more detailed descriptions listed in the Woodie's CCI Club pamphlet. I have had little success trading the "patterns" but they do exist and do work on occasion. I just prefer to trade with the flow of the markets rather than getting overly scalpy. If you are interested in these patterns, see the pamphlet here (www.trading-attitude.com), hop into the forums and see for yourself, or check out a couple of the YouTube videos.
1) Zero line cross. As simple as any other momentum oscillator out there. When the long period CCI crosses above or below the zero line open a trade in that direction. Extra confirmation can be had when the CCI Turbo has already broken the +100/-100 line "resistance or support". Trend traders may wish to wait until the yellow "trend confirmation bar" has been printed.
2) Zero Line Reject. This is when the CCI Turbo heads back down to the zero line and then bounces back in the same direction of the prevailing trend. These are fantastic continuation trades if you missed the initial entry either on the zero line cross or on the trend bar establishment. ZLR trades are only viable when you have the ChopZone indicator showing a trend (turquoise/cyan for uptrend, dark red for downtrend), the LSMA line is green for an uptrend or red for a downtrend, and the SideWinder is either green confirming the uptrend or red confirming the downtrend.
3) Hook From Extreme. This is the exact same as the Zero Line Reject trade, however, the CCI Turbo now goes to the +100/-100 line (whichever is opposite the currently established trend) and then hooks back into the established trend direction. Ideally the HFE trade needs to have the Long CCI Histogram above/below the corresponding 100 level and the CCI Turbo both breaks the 100 level on the trend side and when it does break it has increased ~20 points from the previous value (i.e. CCI Histogram = +150 with LSMA, CZ, and SW all matching up and trend bars printed on CCI Histogram, CCI Turbo went to -120 and bounced to +80 on last 2 bars, current bar closes with CCI Turbo closing at +110).
4) Trend Line Break. Either the CCI Turbo or CCI Histogram, whichever you prefer (I find the Turbo a bit more accurate since its a faster value) creates a series of higher highs/lows you can draw a trend line linking them. When the line breaks the trendline that is your signal to take a counter trade position. For example, if the CCI Turbo is making consistently higher lows and then breaks the trendline through the zero line, you can then go short. This is a good continuation trade.
5) The Tony Trade. Consider this like a combination zero line reject, trend line break, and weak zero line cross all in one. The idea is that the SW, CZ, and LSMA values are all established in one direction. The CCI Histogram should be in an established trend and then cross the zero line but never break the 100 level on the new side as long as it has not printed more than 9 bars on the new side. If the CCI Histogram prints 9 or less bars on the new side and then breaks the trendline and crosses back to the original trend side, that is your signal to take a reversal trade. This is best used in the Elder Triple Screen method (discussed in final section) as a failed dip or rip.
6) The GB100 Trade. This is a similar trade as the Tony Trade, however, the CCI Histogram can break the 100 level on the new side but has to have made less than 6 bars on the new side. A trendline break is not necessary here either, it is more of a "pop and drop" or "momentum failure" trade trying in the new direction.
7) The Famir Trade. This is a failed CCI Long Histogram ZLR trade and is quite complicated. I have never traded this but it is in the pamphlet. Essentially you have a typical ZLR reject (i.e. all components saying it is likely a long/short continuation trade), but the ZLR only stays around the 50 level, goes back to the trend side, fails there as well immediately after 1 bar and then rebreaks to the new side. This is important to be considered with the LSMA value matching the side of the trade, so if the Famir says to go long, you need the LSMA indicator to also say to go long.
8) The Vegas Trade. This is essentially a trend-reversal trade that takes into account the LSMA and a cup and handle formation on the CCI Long Histogram after it has reached an extreme value (+200/-200). You will see the CCI Histogram hit the extreme value, head towards the zero line, and then sort of round out back in the direction of the extreme price. The low point where it reversed back in the direction of the extreme can be considered support or resistance on the CCI and once the CCI Long Histogram breaks this level again, with LSMA confirmation, you can take a counter trend trade with a stop under/over the highest/lowest point of the last 2 bars as you want to be out quickly if you are wrong without much damage but can get a huge win if you are right and add later to the position once a new trade has formed.
9) The Ghost Trade. This is nothing more than a(n) (inverse) head and shoulders pattern created on the CCI. Draw a trend line connecting the head and shoulders and trade a reversal trade once the CCI Long Histogram breaks the trend line. Same deal as the Vegas Trade, stop over/under the most recent 2 bar high/low and add later if it is a winner but cut quickly if it is a loser.
Like I said, this is a complicated system and could quite literally take years to master if you wanted to go into the patterns and master them. I prefer to trade it in a much simpler format, using the Elder Triple Screen System. First, since I am a day trader, I look to use the 20 period Woodie's on the hourly and look at the CZ, SW, and LSMA values to make sure they all match the direction of the CCI Long Histogram (a trend establishment is not necessary here). It shows you the hourly trend as your "tide". I then drill down to the 15 minute time frame and use the Turbo CCI break in the opposite direction of the trend as my "wave" and to indicate when there is a dip or rip against the main trend. Lastly, I drill down to a 3 minute time frame and enter when the CCI Long Histogram turns back to match the main trend ("ripple") as long as the CCI Turbo has broken the 100 level in the matched direction.
Enjoy, and please read the pamphlet if you have any questions about the patterns as they are not how I use these and will not be able to answer those questions.

Scrolling WatermarkThis is an improvement on the watermark published by TradingView.
Along with displaying a little bit of text on the corner of your chart, this text scrolls from left to right, or right to left! You choose!
This functionality works on all live charts. It will not scroll if the chart is currently inactive. :(
Even though this is based on the indicator by TradingView This script uses entirely original code and method developed by myself.
"Do keep in mind that if you use it when publishing ideas, videos or scripts, House Rules prohibit advertising on your chart." -Watermark by TradingView

Volume Pace & Pressure TableHave you ever wanted to know if a particular tickers volume is above or below average while still in the trading day? This indicator displays an easy-to-read table that informs the user exactly what is occurring in intraday volume. And a whole lot more!
Description
This indicator displays a variable table with either two or three columns and always three rows. It packs everything a user needs to know about volume in one small table. The table shows:
Current trading days volume
Average daily volume
Volume Pace
Volume Pressure (Buying & Selling)
Volume Pace
Volume Pace is a mathematical calculation invented by the author, Infinity_Trading . The problem was to figure out a way to know if the current days volume was below average or above average while still in the trading day. Calculations like Percent Daily Volume don’t work during the intraday trading hours. For example, say SPY has a 20-day volume average of 100 million shares. If in the first hour SPY has only traded 10 million shares then dividing the current volume into the average daily volume doesn’t tell the user anything when there is still 5.5 hours of trading left in the trading day. There had to be a better way! The solution was to chop up the trading day into evenly divisible time periods (i.e. <= 30 minutes). The Volume Pace algorithm takes the average daily volume and chops it up into small time periods based upon the charts current timeframe. This is the average volume per smaller time period. Then use the current days volume and the number of time periods that have occurred in the trading day so far (at the current moment in time i.e. the current candlestick) to form a calculation that returns the volume above or below the average volume up to that point in time.
Volume Pace Equations
Intraday Vol. Pace = Today’s Current Vol. - ( ( Average Daily Vol. / Time periods in trading day ) * Time periods that have occurred so far in trading day )
Postday Vol. Pace = Today’s Trading Vol. - Average Daily Vol.
^ Vol. = Volume (because TradingViews pine tags are dumb)
Volume Pace Definitions
Volume Pace is the difference in cumulative volume between todays current volume and the average daily volume up to same time of the day
Volume Pace Usage
If the Volume Pace is a positive number then it means that up to the current trading time the volume is that amount greater than the average daily volume over that same intraday time span.
If the Volume Pace is a negative number then it means that up to the current trading time the volume is that amount smaller than the average daily volume over that same intraday time span.
If the Volume Pace is positive during the intraday then the volume is on track to be an above average volume trading day.
If the Volume Pace is negative during the intraday then the volume is on track to be a below average volume trading day.
The Percent Volume Pace is the percent increase or decrease of the current volume compared to the average volume up to the same time of day. Or the Percent Volume Pace is the Volume Pace expressed as a percentage.
After the trading day is complete the Volume Pace will be the difference between the Daily Volume and the Average Daily Volume. And the same thing applies to the Percent Volume Pace.
Volume Pressure
The author, Infinity_Trading, did not invent the calculations for Volume Pressure but the definitions and explanations of Volume Pressure are their own creations. In specific terms, Volume Pressure is a mathematical calculation that uses the direction and distances of individual candlesticks bodies and wicks to assign a numerical value to volume.
buyingPressure = vol * (close - low) / (high - low)
sellingPressure = vol * (high - close) / (high - low)
^ vol = Volume (because TradingViews pine tags are dumb)
The author wants to make clear that volume “pressure” isn’t a real thing. Trades in any market require a buyer and a seller. So there is always an equal number of buyers and sellers. Thus, the idea that there are more buyers or more sellers isn’t rooted in reality. BUT the author believes that the calculation and understanding of “volume pressure” takes a very complex subject (price moment in a market) and condenses into something that intuitively makes sense to humans (pressure) and places it onto something that is already on everyone’s charts (volume bars).
The calculation for Buying Pressure is really calculating the upward distance between the low and the close of the candle. While Selling Pressure is measuring the downward distance from the high to the close. And both are using volume bars to express these measurements. So if an individual candle goes down then the red Selling Pressure will be more on the stacked bar chart than the green Buying Pressure. And vice versa for candles that went up. If a Volume Pressure bar is completely one color then it means, for a downward candle, the low and close were equivalent, and for an upward candle, the high and the close were the same. Lastly, the Buying & Selling Pressure will always add up to 100%.
Inputs and Style
In the Input section the user can set the number of days to use for all of the average calculations. All aspects of the table can be controlled. The background color, text color, border widths, and border colors. Also, the table can be moved to 9 unique locations around the chart for complete user control. Also, the user can use their cursor to hover over each cell in the table to reveal a tooltip definition of the calculation in the cell.
Special Notes
The volume table won’t display when the chart timeframe is weekly or monthly because the logic uses “daily” volume.
The Volume Pace column in the table disappears when the timeframe is greater than 30 minutes. Because for Volume Pace to work the time periods must be equally divisible into 6.5 hours (the duration of trading day).

Fib RSI++ by [JohnnySnow]Fib RSI++ by is an RSI Inspired by my absolutely favorite RSI on tradingview: RSI & EMA with Reverse Calculator Panel by balipour.
Built for quicker and easily identify prices at current RSI /possibly reversals/ RSI direction and RSI landings.
From balipour, I reuse /adapt to pinescriptV5 3 lines of code ( ) - the balipour implementation for reversing RSI formula in order to calculate price estimation based on the Given RSI level. Credits to the author.
Inspired by it, I also combine RSI with a MA but tuned to reads better the support/resistance levels (my humble opinion).
For quicker price target identification 2 features were added:
- Gridlines based on Fib levels, standard overbought/oversold levels and other levels I personally use. All of the grid lines can be configured according to user preferences.
- 2 information tables:
--First with a collection of 'close' numbers and Fib RSI levels price estimations at given RSI
--The second table allows the user to add up to 3 custom RSI levels to further target the price estimation.
Author UI Preferences to be used with this indicator: dark theme, hidden vertical and horizontal chart gridlines.

Multi-timeframe MAs + Stoch RSI SignalsHello traders,
I welcome you to my first published script on TradingView: “Multi-timeframe Moving Averages + Stochastic RSI”.
The script is based on a simple formula: Buy signals are generated when a fast moving average is above a slower moving average (uptrend) and the Stochastic RSI K line is crossing above the oversold level (entry).
Sell signals are generated when a fast moving average is below a slower moving average (downtrend) and the Stochastic RSI K line is crossing below the overbought level (entry).
This indicator works best in strong trends!
**Please note the above example has repainting turned on which may produce unrealistic results when viewing historical data. See below for more information regarding this and how you can turn it off.**
The user has the following inputs:
- Option to change the Stochastic RSI settings, including the oversold and overbought levels.
- Option to enter any value for both the Fast Moving Average and the Slow Moving Average.
- Option to change between EMA or SMA for each moving average.
- Multiple time frames to choose from, as well as the ability to selectively turn off individual time frames (both plots and alerts).
(Default time frames are 1 hour, 4 hour, and Daily. You can have a 4th time frame by changing your current time frame to something lower than the other 3 time frames)
- Turn on/off repainting: If repainting is turned on you will get an alert and buy/sell signal on chart immediately when condition is met, however the signal may disappear from chart if the condition reverses during the same candle.
If repainting is turned off, the indicator will wait for the candle to close before issuing the alert and painting the signal on chart.
For higher time frames, the indicator will wait for the candle in the higher time frame to close before issuing a signal if repaint is turned off. Default is set to Repaint on, so please be aware of this if you do not want repainting.
How to use alerts:
- Before you do anything, make sure your current time frame is the lowest time frame you’d like alerts on, as you will still receive alerts for the higher time frames you selected in settings.
- Once you have all the settings changed to how you like, save your chart first. Then right click on any of the indicator’s buy/sell signals on the chart and click “Add Alert on MAs + Stoch RSI”.
- Make sure “Any alert() function call” is selected under the Condition.
- You can delete or change the text in “Alert name” if you want as the alert message is already built into the indicator, and it will tell you in the alert message which asset and time frame to buy or sell.
Other things to note:
- The indicator will not display the buy/sell signals of lower time frames when you are on a higher time frame. This was done purposely to reduce clutter on the chart when you switch to higher time frames.
- While the alert message will tell you which time frame a signal was generated, the plots on the chart will instead show “Buy/Sell TF1, or TF2, or TF3”.
If the signal is from the current time frame that the alert was created on, then it will simply show “Buy” or “Sell”.
Hope you guys enjoy using this one, please drop a like if you found it useful. If anyone wants to modify my script in any way, please just credit me for the original work when you publish the script. Good luck!

Ultimate Screener TemplateHello Traders
With the Ultimate Strategy Template , I shared a template to connect any indicator to this template and get backtesting results in less than a few minutes
Now sharing another template ... many traders ask me to develop for them a screener/scanner based on a custom indicator on TradingView.
The current TradingView screeners are great but don't allow for much customization; as we can only select pre-defined filters
I don't know when we'll be able to natively screen among hundreds of assets with a custom indicator... then.... I created this template for the time being.... which should
A whole new world
The Ultimate Screener Template screens over 38 securities.
What's very cool is that you'll only need to create 1 alert to scan over 38 securities: Explanation with this image here
I totally understand that not all TradingView accounts have a lot of alarms; with this template, you can multiply the number of custom alerts you're initially allowed to.
What if I need to set alerts on more than 38 securities?
Pretty straightforward... you can create alerts only if the indicator is added to your chart first.
So if you need let's say 100 securities, add this indicator 3 times on your chart (38*3 > 100) and then... edit the securities for your 3 indicators
How to update your Screener settings
Alert mode
As per Pinescript reference , this template allows setting the alert frequency
Possible values are:
- alert.freq_all (all function calls trigger the alert)
- alert.freq_once_per_bar (the first function call during the bar triggers the alert)
- alert.freq_once_per_bar_close (the function call triggers the alert only when it occurs during the last script iteration of the real-time bar when it closes).
All-time-high and All-time-low
This template shows how to capture ATH and ATL alerts across many securities
I used the functions from Quantnomad:
Whenever a new ATH or ATL is made, the screener will send a personalized alarm with a personalized text based on the security triggering this alarm
The code is pretty straightforward and shows you the part you'll need to update to transform your favorite custom indicator into a powerful screener.
If anything is unclear in the code, please leave a comment and I'll respond as soon as possible
All the best
Dave
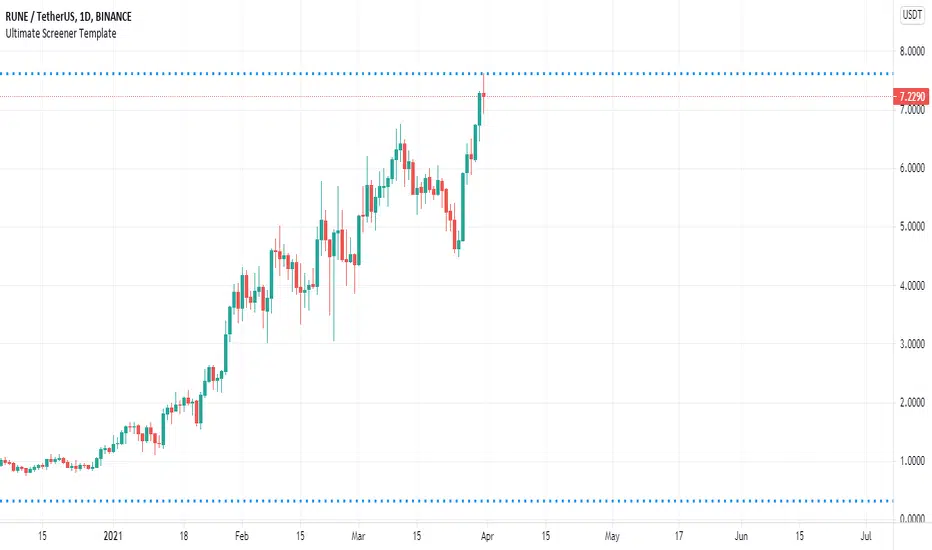
Flawless Victory Strategy - 15min BTC Machine Learning StrategyHello everyone, I am a heavy Python programmer bringing machine learning to TradingView. This 15 minute Bitcoin Long strategy was created using a machine learning library and 1 year of historical data in Python. Every parameter is hyper optimized to bring you the most profitable buy and sell signals for Bitcoin on the 15min chart. The historical Bitcoin data was gathered from Binance API, in case you want to know the best exchange to use this long strategy. It is a simple Bollinger Band and RSI strategy with two versions included in the tradingview settings. The first version has a Sharpe Ratio of 7.5 which is amazing, and the second version includes the best stop loss and take profit positions with a Sharpe Ratio of 2.5 . Let me talk a little bit more about how the strategy works. The buy signal is triggered when close price is less than lower Bollinger Band at Std Dev 1, and the RSI is greater than a certain value. The sell signal is triggered when close price is greater than upper Bollinger Band at Std Dev 1, and the RSI is greater than a certain value. What makes this strategy interesting is the parameters the Machine Learning library found when backtesting for the best Sharpe Ratio. I left my computer on for about 28 hours to fully backtest 5000 EPOCHS and get the results. I was able to create a great strategy that might be one of TradingView's best strategies out on the website today. I will continue to apply machine learning to all my strategies from here on forward. Please Let me know if you have any questions or certain strategies you would like me to hyper optimize for you. I'm always willing to create profitable strategies!
P.S. You can always pyramid this strategy for more gains! I just don't add pyramiding when creating my strategies because I want to show you the true win/loss ratio based buying one time and one selling one time. I feel like when creating a strategy that includes pyramiding right off the bat falsifies the win rate. This is my way of being transparent with you all. Have fun trading!

Squeeze MTF HeatmapHere is a multi-timeframe heat map using one of the most apreciated indicators in Tradingview: Squeeze Momentum Indicator by LazyBear.
Study shall be added to 15min chart.
It indicates squeeze and momentum at: 15 min, 30 min, 60 min, 240 min and 1 Day.
Thanks to © azimuthdynamics for inspiration and portion of code
Thanks to Lazy Bear for coding Squeeze Momentum Indicator