Renko Trend Indicator with High/LowRenko Trend Indicator with High/Low
Version: 1.0
Pine Script Version: 5
Type: Indicator
Overlay: Yes
Description
The Renko Trend Indicator with High/Low provides a visual representation of market trends using Renko-style calculations based on either a fixed brick size or ATR (Average True Range). It helps traders identify trend direction, potential reversals, and key support/resistance levels.
The indicator plots Renko-based trend signals directly on your chart and provides a colored Renko close line, making trend analysis simpler and clearer.
Features
Customizable Renko Brick Size
Fixed brick size or dynamic ATR-based bricks.
Step input for precise control over brick size.
Trend Identification
Detects uptrend and downtrend based on Renko logic.
Plots visual signals for trend direction:
Green triangle below bars → Uptrend
Red triangle above bars → Downtrend
Renko Close Line
Shows the Renko-adjusted closing price as a line.
Line color changes with trend (green for uptrend, red for downtrend).
Inputs
Name Type Default Description
Brick Size float 50 Size of Renko bricks (price units)
Use ATR for Brick Size? bool false Enable ATR-based dynamic brick sizing
ATR Period int 14 Number of periods for ATR calculation if enabled
How It Works
The indicator calculates Renko bricks using either a fixed size or ATR.
It maintains internal variables:
renko_close → Current Renko price
renko_high → Highest point of the current trend
renko_low → Lowest point of the current trend
trend → Current trend direction (1 for uptrend, -1 for downtrend)
last_extreme → Last extreme point to detect trend reversal
When price moves above or below the Renko threshold, the trend is updated.
Trend signals are plotted on the chart for easy visualization.
Plots
Plot Name Description Color
Up Trend Triangle below bar when trend is up Green
Down Trend Triangle above bar when trend is down Red
Renko Close Line connecting Renko-adjusted close prices Green (up) / Red (down)
Usage
Add the indicator to any chart with your preferred timeframe.
Configure the brick size or enable ATR-based bricks for dynamic calculation.
Observe the trend triangles and Renko line to identify trend direction and potential reversals.
Can be used in combination with other indicators or strategies for trading decisions.
Notes
This indicator is for analysis purposes only and does not place trades automatically.
ATR-based bricks adapt to market volatility, while fixed bricks provide a static reference.
Works best on liquid markets with regular price movements.
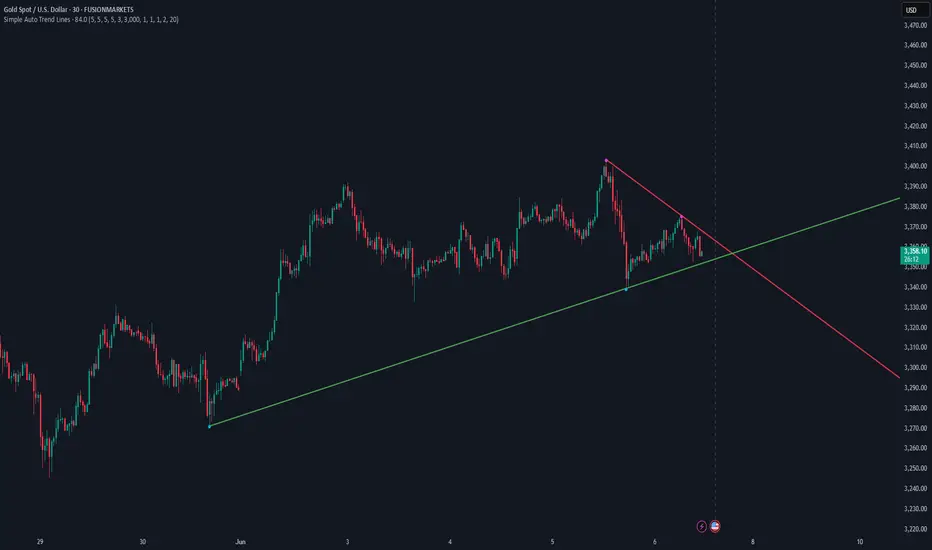
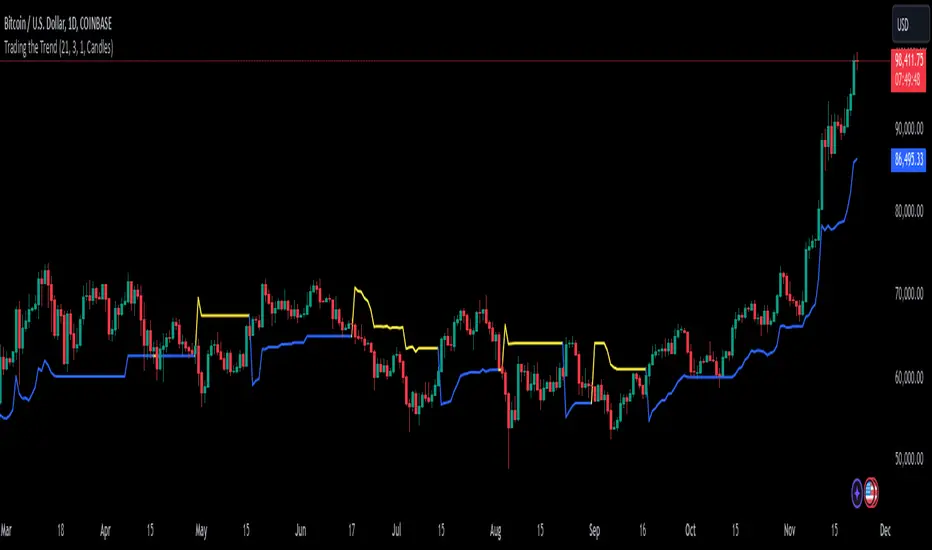
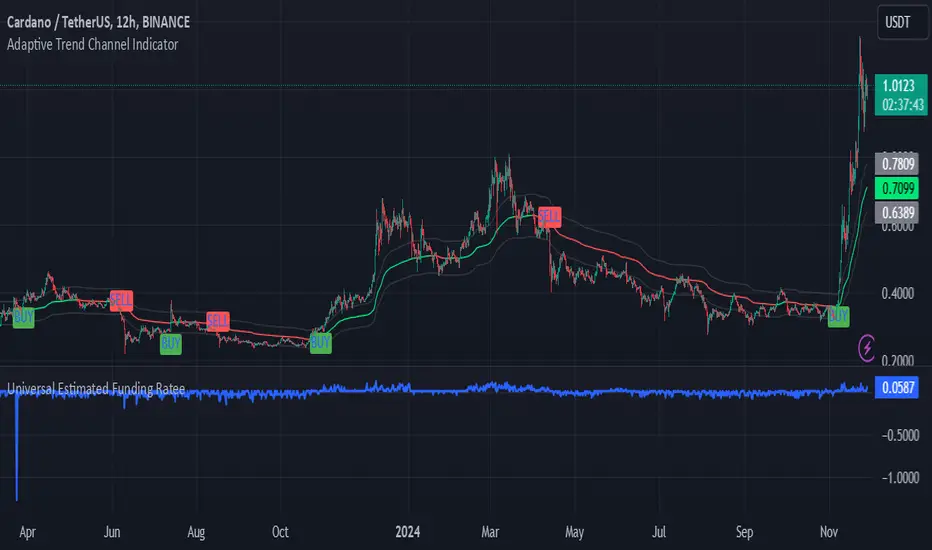
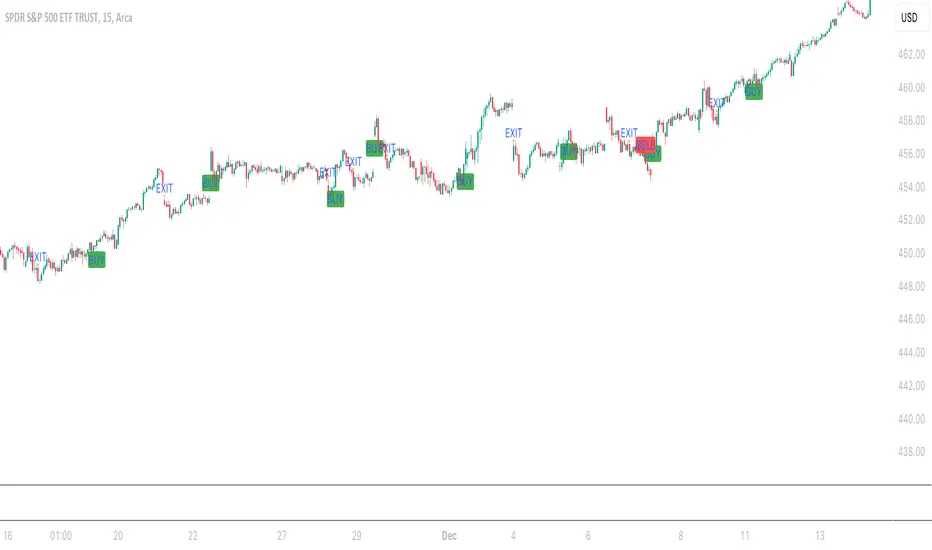
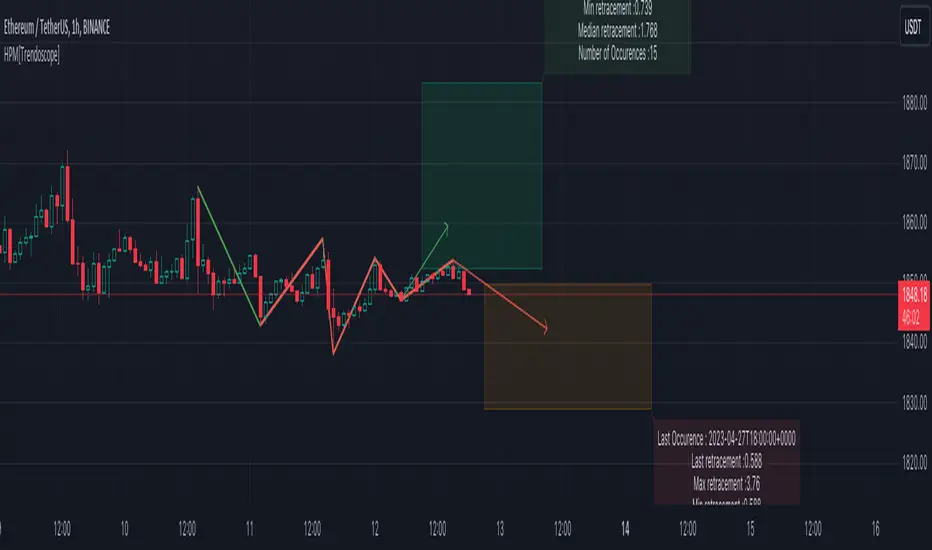
Example Chart
Green triangles below bars signal a buying trend.
Red triangles above bars signal a selling trend.
The colored Renko line shows the trend progression visually.
Author
DB
Pine Script Version: 5
License: MIT
Pine Script®指標