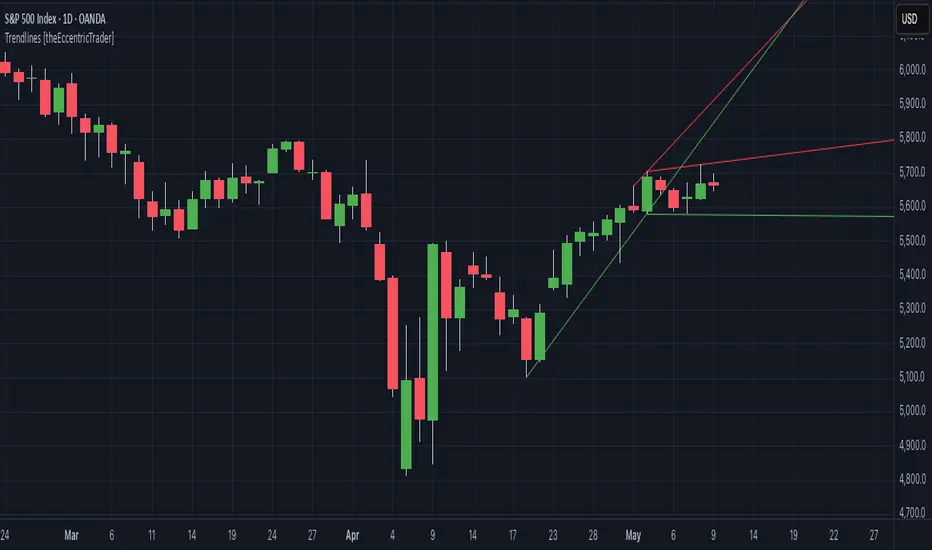
Trendlines [theEccentricTrader]█ OVERVIEW
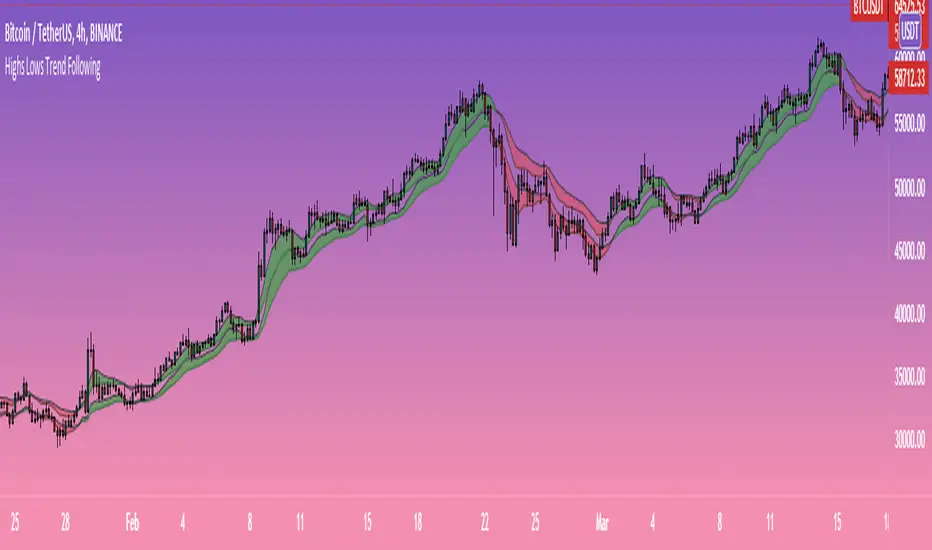
This indicator automatically draws dynamic support and resistance lines from preceding peak to current peak and from preceding trough to current trough.
█ CONCEPTS
Green and Red Candles
• A green candle is one that closes with a high price equal to or above the price it opened.
• A red candle is one that closes with a low price that is lower than the price it opened.
Swing Highs and Swing Lows
• A swing high is a green candle or series of consecutive green candles followed by a single red candle to complete the swing and form the peak.
• A swing low is a red candle or series of consecutive red candles followed by a single green candle to complete the swing and form the trough.
Peak and Trough Prices (Basic)
• The peak price of a complete swing high is the high price of either the red candle that completes the swing high or the high price of the preceding green candle, depending on which is higher.
• The trough price of a complete swing low is the low price of either the green candle that completes the swing low or the low price of the preceding red candle, depending on which is lower.
Historic Peaks and Troughs
The current, or most recent, peak and trough occurrences are referred to as occurrence zero. Previous peak and trough occurrences are referred to as historic and ordered numerically from right to left, with the most recent historic peak and trough occurrences being occurrence one.
Support and Resistance
• Support refers to a price level where the demand for an asset is strong enough to prevent the price from falling further.
• Resistance refers to a price level where the supply of an asset is strong enough to prevent the price from rising further.
Support and resistance levels are important because they can help traders identify where the price of an asset might pause or reverse its direction, offering potential entry and exit points. For example, a trader might look to buy an asset when it approaches a support level, with the expectation that the price will bounce back up. Alternatively, a trader might look to sell an asset when it approaches a resistance level, with the expectation that the price will drop back down.
It's important to note that support and resistance levels are not always relevant, and the price of an asset can also break through these levels and continue moving in the same direction.
Trendlines
Trendlines are straight lines that are drawn between two or more points on a price chart. These lines are used as dynamic support and resistance levels for making strategic decisions and predictions about future price movements. For example traders will look for price movements along, and reactions to, trendlines in the form of rejections or breakouts/downs.
█ FEATURES
Inputs
• Resistance Line Color
• Support Line Color
█ LIMITATIONS
All green and red candle calculations are based on differences between open and close prices, as such I have made no attempt to account for green candles that gap lower and close below the close price of the preceding candle, or red candles that gap higher and close above the close price of the preceding candle. This may cause some unexpected behaviour on some markets and timeframes. I can only recommend using 24-hour markets, if and where possible, as there are far fewer gaps and, generally, more data to work with.
Pine Script®指標