Derivative Based TrendsUses a combination of moving averages to establish trends, and finite-difference derivative approximations to predict possible reversals. Seems to work best on 1 hour charts of less volatile currency pairs.Pine Script®策略由roni511提供36
TWAP TrendHere we are experimenting with using TWAP for trend analysis. It appears to work better than VWAP on lower timeframes. TWAP is a tool used by algorithm based traders that allows them to distribute their orders throughout the day without disturbing price or having their positions known to rival traders in the market. It's similar to VWAP and serves the same function, except it lacks the volume aspect. This can be an issue when position entry/exit may be affected by slippage. The main benefit of TWAP is deciding how to distribute orders throughout the chosen timeframe. However, just like the VWAP traders will normally use it as a moving average or target for price action to pull into. There is an option to change the timeframe that TWAP is calculated from. Originally by NeoButane: Pine Script®指標由jaggedsoft提供1818976
Trend Balance Point System by Welles WilderThis is the original Trend Balance Point System created by Welles Wilders in 1978, rules can be found in his book New Concepts in Technical Trading Systems.Pine Script®策略由xtradernet提供已更新 33181
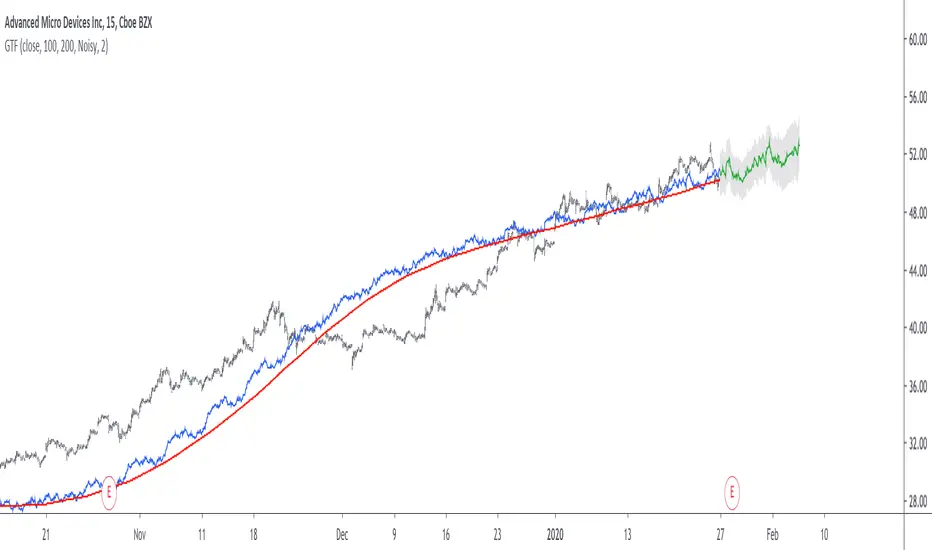
Grand Trend Forecasting - A Simple And Original Approach Today we'll link time series forecasting with signal processing in order to provide an original and funny trend forecasting method, the post share lot of information, if you just want to see how to use the indicator then go to the section "Using The Indicator". Time series forecasting is an area dealing with the prediction of future values of a series by using a specific model, the model is the main tool that is used for forecasting, and is often an expression based on a set of predictor terms and parameters, for example the linear regression (model) is a 1st order polynomial (expression) using 2 parameters and a predictor variable ax + b . Today we won't be using the linear regression nor the LSMA. In time series analysis we can describe the time series with a model, in the case of the closing price a simple model could be as follows : Price = Trend + Cycles + Noise The variables of the model are the components, such model is additive since we add the component with each others, we should be familiar with each components of the model, the trend represent a simple long term variation of high amplitude, the cycles are periodic fluctuations centered around 0 of varying period and amplitude, the noise component represent shorter term irregular variations with mean 0. As a trader we are mostly interested by the cycles and the trend, altho the cycles are relatively more technical to trade and can constitute parasitic fluctuations (think about retracements in a trend affecting your trend indicator, causing potential false signals). If you are curious, in signal processing combining components has a specific name, "synthesis" , here we are dealing with additive synthesis, other type of synthesis are more specific to audio processing and are relatively more complex, but could be used in technical analysis. So what to do with our components ? If we want to trade the trend, we should estimate right ? Estimating the trend component involve removing the cycle and noise component from the price, if you have read stuff about filters you should know where i'am going, yep, we should use filters, in the case of keeping the trend we can use a simple moving average of relatively high period, and here we go. However the lag problem, which is recurrent, come back again, we end up with information easier to interpret (here the trend, which is a simple fluctuation such as a line or other smooth curve) at the cost of decision timing, that is unfortunate but as i said the information, here the moving average output, is relatively simple, and could be easily forecasted right ? If you plot a moving average of high period it would be easier for you to forecast its future values. And thats what we aim to do today, provide an estimate of the trend that should be easy to forecast, and should fit to the price relatively well in order to produce forecast that could determine the position of future closing prices observations. Estimating And Forecasting The Trend The parameter of the indicator dealing with the estimation of the trend is length , with higher values of length attenuating the cycle and noise component in the price, note however that high values of length can return a really long term trend unlike a simple moving average, so a small value of length, 14 for example can still produce relatively correct estimate of trend. here length = 14. The rough estimate of the trend is t in the code, and is an IIR filter, that is, it is based on recursion. Now i'll pass on the filter design explanation but in short, weights are constants, with higher weights allocated to the previous length values of the filter, you can see on the code that the first part of t is similar to an exponential moving average with : t(n) = 0.9t(n-length) + 0.1*Price However while the EMA only use the precedent value for the recursion, here we use the precedent length value, this would just output a noisy and really slow output, therefore in order to create a better fit we add : 0.9*(t(n-length) - t(n-2length)) , and this create the rough trend estimate that you can see in blue. On the parameters, 0.9 is used since it gives the best estimate in my opinion, higher values would create more periodic output and lower values would just create a rougher output. The blue line still contain a residual of the cycle/noise component, this is why it is smoothed with a simple moving average of period length. If you are curious, a filter estimating the trend but still containing noisy fluctuations is called "Notch" filter, such filter would depending on the cutoff remove/attenuate mid term cyclic fluctuations while preserving the trend and the noise, its the opposite of a bandpass filter. In order to forecast values, we simply sum our trend estimate with the trend estimate change with period equal to the forecasting horizon period, this is a really really simple forecasting method, but it can produce decent results, it can also allows the forecast to start from the last point of the trend estimate. Using The Indicator We explained the length parameter in the precedent section, src is the input series which the trend is estimated, forecast determine the forecasting horizon, recommend values for forecast should be equal to length, length/2 or length*2, altho i strongly recommend length. here length and forecast are both equal to 14 . The corrective parameter affect the trend estimate, it reduce the overshoot and can led to a curve that might fit better to the price. The indicator with the non corrective version above, and the corrective one below. The source parameter determine the source of the forecast, when "Noisy" is selected the source is the blue line, and produce a noisy forecast, when "Smooth" is selected the source is the moving average of t , this create a smoother forecast. The width interval control...the width of the intervals, they can be seen above and under the forecast plot, they are constructed by adding/subtracting the forecast with the forecast moving average absolute error with respect to the price. Prediction intervals are often associated with a probability (determining the probability of future values being between the interval) here we can't determine such probability with accuracy, this require (i think) an analysis of the forecasting distribution as well as assumptions on the distribution of the forecasting error. Finally it is possible to see historical forecasts, that is, forecasts previously generated by checking the "Show Historical Forecasts" option. Examples Good forecasts mostly occur when the price is close to the trend estimate, this include the following highlighted periods on AMD 15TF with default settings : We can see the same thing at the end of EURUSD : However we can't always obtain suitable fits, here it is isn't sufficient on BTCUSD : We can see wide intervals, we could change length or use the corrective option to get better results, another option is to use a log scale. We will end the examples with the log SPX, who posses a linear trend, so for example a linear model such as a linear regression would be really adapted, lets see how the indicator perform : Not a great fit, we could try to use an higher length value and use "Smooth" : Most recent fits are quite decent. Conclusions A forecasting indicator has been presented in this post. The indicator use an original approach toward estimating the trend component in the closing price. Of course i should have given statistics related to the forecasting error, however such analysis is worth doing with better methods and in more advanced environment allowing for optimization. But we have learned some stuff related to signal processing as well as time series analysis, seeing a time series as the sum of various components is really helpful when it comes to make sense of chaotic and noisy series and is a basic topic in time series analysis. You can see that in this new year i work harder on the visual of my indicators without trying to fall in the label addict trap, something that i wasn't really doing before, let me know what do you think of it. Thanks for reading ! Pine Script®指標由alexgrover提供2727 2.2 K
Trend WaveHello Traders! You know, I can sill remember the first time I started tinkering with Pinescript. As I had no prior programming experience, I learned by experimenting with other open-source scripts on TradingViews Marketplace. Tearing apart and combining interesting scripts to see what the output would be. @ChrisMoody was a huge source of inspiration for learning, and I wanted to thank him, as well as @TheLark for the concept behind this script. The Trend Wave is based on @ChrisMoody's PPO-PercentileRank-Mkt-Tops-Bottoms , which also happens to be based on @TheLark's TheLark-Laguerre-PPO/ . Within my experimentation, I found that if I isolate the ppoT & ppoB variables and plot them calculated from extremely small decimals, you can get an extremely fast reacting, mirroring trend detector. Within the script, you have the ability to plot the background colors based on trend to make it easier to see where crossovers occured, as well as a Mirror Input to view the mirrored version of the script. -@DayTradingOil Pine Script®指標由DrCatherineHalsey提供已更新 2020164
Donato Trend Stength IndexThis indicator is a basic way to look at longer periods of time and look for exhaustion based on closes above or below RSI50. The first output is RSI14 the second is a rolling 100 day aggregate of closes where 50 acts as 0. As of now it appears totals of 1200+ /-1200- could be considered overbought / oversold, respectively. Totals near or above / below 2000 / -2000 (respectively) could be great indicators of extreme trend exhaustion and impending reversal. Pine Script®指標由SeanBronato提供61
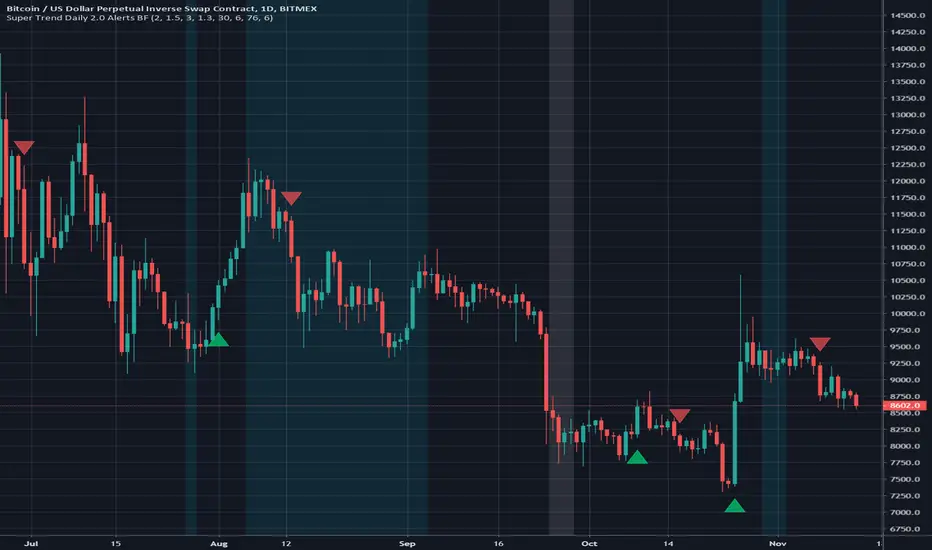
Super Trend Daily 2.0 Alerts BFThis is an alerts script for my Super Trend 2.0 indicator . It is intended as a companion script so you can backtest using the Strategy script and generate alerts using this Study script. This Study script has the same default settings as the Strategy script and its only purpose is to provide alerts for the long and short signals the Strategy generates. Obviously, if you want to generate alerts based on a Strategy backtest, please ensure the settings are the same in the Study as in the Strategy. For illustration, I have plotted arrows on the chart for long and short signals, and also colored the background to show when the rate of change function determines a choppy/sideways market. ALERTS There are 2 alerts set up: Long Entry Short Entry ILLUSTRATION Green arrow = Long Entry Red arrow = Short Entry White background = No short trades Aqua background = No long trades EXAMPLE USE CASE 1. Open a Bitcoin/USD chart on 1D timeframe. 2. Open this script and the Super Trend 2.0 indicator script. 3. Backtest with the Strategy Backtester and change the settings if you like until you get a desirable outcome for your own purposes. 4. Once you are happy with the backtest, change the settings in the Alerts script (this one) so they match the Strategy settings. 5. Set up the alerts according to your preferences.Pine Script®指標由bennef提供77 1 K
Trend Tracker By Prem This Script tracks change of trend and Works as a leading indicator. If anyone interested in further modifying its script please do so and share with everyone with the same name as Trend Tracker By Prem Pine Script®指標由Prem_Agrawal提供25
Super Trend Daily 2.0 BFThis is my Super Trend Daily strategy but with one important difference. You can now adjust settings for long or short signals individually and separately. For example, the condition for a long signal may require a different parameter setting than the condition for a short signal. Each parameter in the signal generation can be tuned. You can also decide what kind of stop loss you want for each side - you could have a fixed stop loss for longs and an ATR derived stop loss for shorts, or whatever. We also have the option to choose if we want longs, shorts or both. INISTRUCTIONS Look at the background colors: Green line = long signal Red line = short signal Aqua = No long trades White = No short trades Yellow dotted line = stop loss for long Orange dotted line = stop loss for short The aqua and white backgrounds mean the conditions are choppy/sideways according to our settings we applied to the rate of change function for a long/short signal respectively. It is possible to get a long signal in a white background, but not a short signal. Similarly, it is possible to get a short signal in an aqua background, but not a long signal. This is a work in progress so any suggestions for improvements are welcome.Pine Script®策略由bennef提供已更新 3939 4.5 K
Super Trend Daily BF 🚀Super Trend is based on volatility and attempts to show the overall greater trend of a market. Thanks to everget for the idea of improving the Super Trend code. Thanks to kiasaki for ROC code. The idea here is to enter a trade upon trend reversal (unless we have a white background - this indicates choppy/sideways market). INSTRUCTIONS Follow the background color for signals of a trend reversal. Bright green = long Bright red = short White = no trade We use a fixed stop loss here of 6% but I have included the option to apply an ATR based stop loss in Settings. No take profit. No re-entering until we get an opposing signal. I use a Rate of Change function to detect when we should stay out due to choppy sideways price action. This strategy was optimised for XBT/USD on Bitmex 1 day chart, ideal settings for other pairs will differ. Pine Script®策略由bennef提供已更新 1313618
Trend swingTrying to code divergences of price and Volume with direction ocs. It only highlights filtered divergence signals overlayed pointing at trend swing. Colors: red- doom green - moon Pine Script®指標由pmk07提供4480
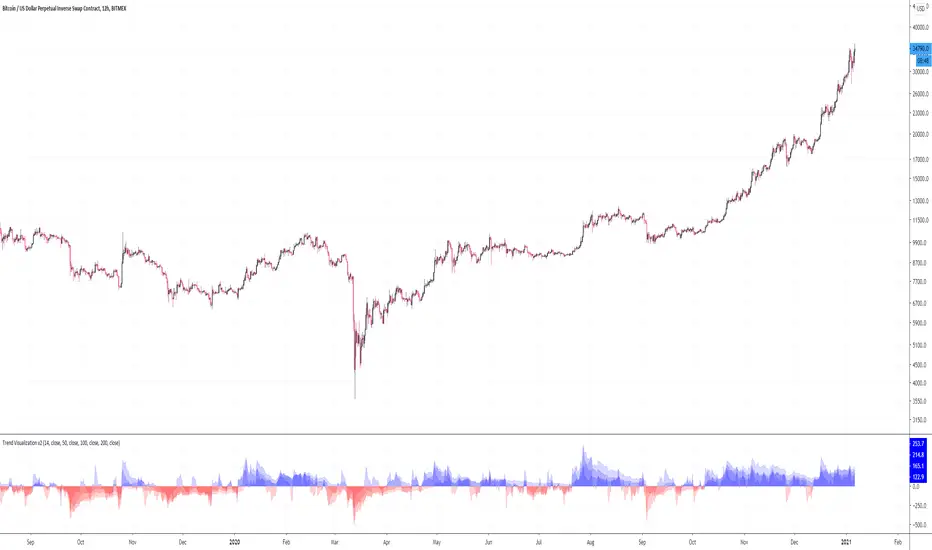
CL Trend VisualizationA trend strength indicator for visualizing momentum. Built from 5 different CCI periods and their averages. Experimental.Pine Script®指標由cl20提供已更新 4470
Efficient Trend Step ModThis is my mod of a wonderful script by alexgrover. See his comprehensive description of the logic behind the script at his page at Added are labels, alerts and selection of periods among (mainly;)) fibo numbers. Pine Script®指標由capissimo提供1818869
[PX] Level & TrendlinesThe indicator identifies the intermediate fractal pattern, where neighboring fractals are either higher or lower. It plots horizontal level and trendlines based on those fractals and comes with a variety of settings. If you are looking for someone to develop your on indicator or trading strategy, don't hesitate to get in touch with me here on TradingView or below. Contact: www.pascal-simon.de info@pascal-simon.dePine Script®指標由paaax提供44378
Customizable Trend Direction (Open-Source)Hello everyone I received a ton of requests for this script so I decided to share it I did it for a client who didn't want to pay (you can all blame... or even thank him for this script) in the end and I don't want to sell it on my website. Not because it's not interesting but because my website will be a place to showcase and rent the Algorithm Builders mostly What is it about? Basically, it shows how you could convert a plotshape into a label.new object. Very interesting if you want someday to convert your V3 script into V4 With this script, it shows that you can in V4 ( but couldn't do in V3 ) do the followings : - change dynamically the size (from tiny to huge) of any object - change dynamically the text (from whatever to whatever) of any object Screenshot of the user interface imgur.com Other use cases I did it with the Trend Direction but could work with anything really. - Any indicator with a visual signal. You can know personalized from a user interface the text, size and also the vertical shift. I didn't do it for that one but label.new takes a (x,y) coordinates so playing with y is fairly easy to achieve a dynamic vertical shift - Even with this script Plotchar-How-to-draw-external-symbols-on-a-chart/ but would require to be updated with a label.new object and with a shape.none parameter so that we'll only see the icon/symbol displayed - The colors also can be change dynamically using presets Presets-Selector-FRIDAY-NIGHT-CHALLENGE/ . If you have an indicator showing a BULLISH and a BEARISH signal, then you could, for instance, configure colors presets according to the timeframe of the chart or the indicator input, etc (sky is the limit ^^) Be sure to hit the thumbs up at it motivates me to research what Pinescript can offer and share with the community Dave ____________________________________________________________ - I'm an officially approved PineEditor/LUA/MT4 approved mentor on codementor. You can request a coaching with me if you want and I'll teach you how to build kick-ass indicators and strategies Jump on a 1 to 1 coaching with me - You can also hire for a custom dev of your indicator/strategy/bot/chrome extension/python Pine Script®指標由Daveatt提供已更新 1212636
Hull Trend with Kahlman Strategy BacktestA simple backtest version of a Hull Trend with Kahlman strategyPine Script®策略由capissimo提供22243
Alma Trends IndicatorIt helps you identify trends in a more convenient way.Pine Script®指標由trading_rub提供44
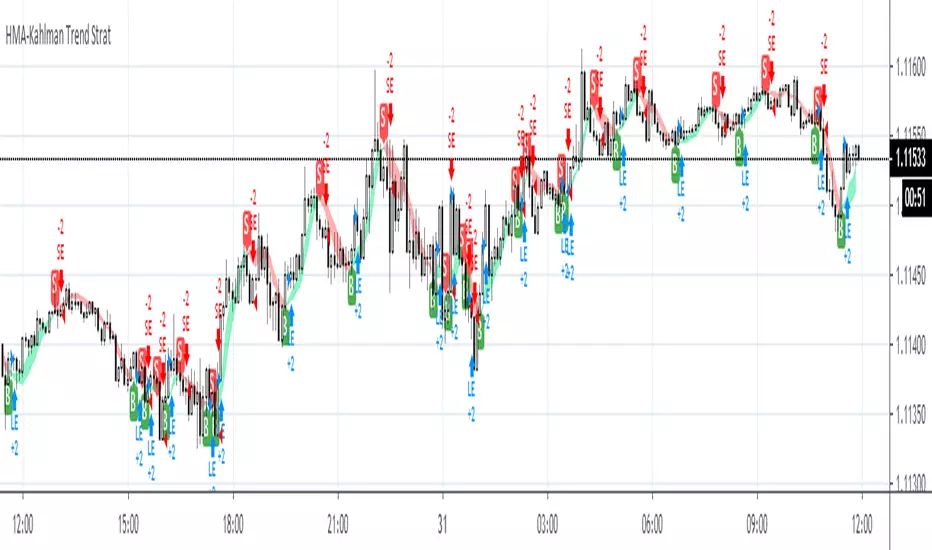
Hull Trend with KahlmanThis is an update to the idea of The Kahlman smoother makes the signal more precise (by one candle).Pine Script®指標由capissimo提供1616908
[RS]Auto Trend ChannelAuto trend channel based on donchian or standard deviation.Pine Script®指標由RicardoSantos提供77 1.9 K
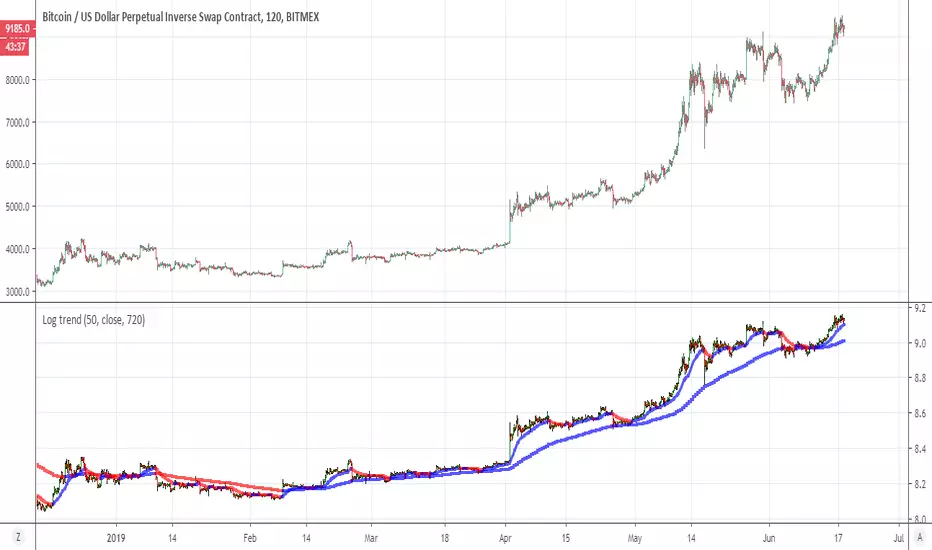
Log trendThis indicator give you the trend by log scale of the candels and the MA blue line =bullish red line =bearish Pine Script®指標由RafaelZioni提供已更新 33144
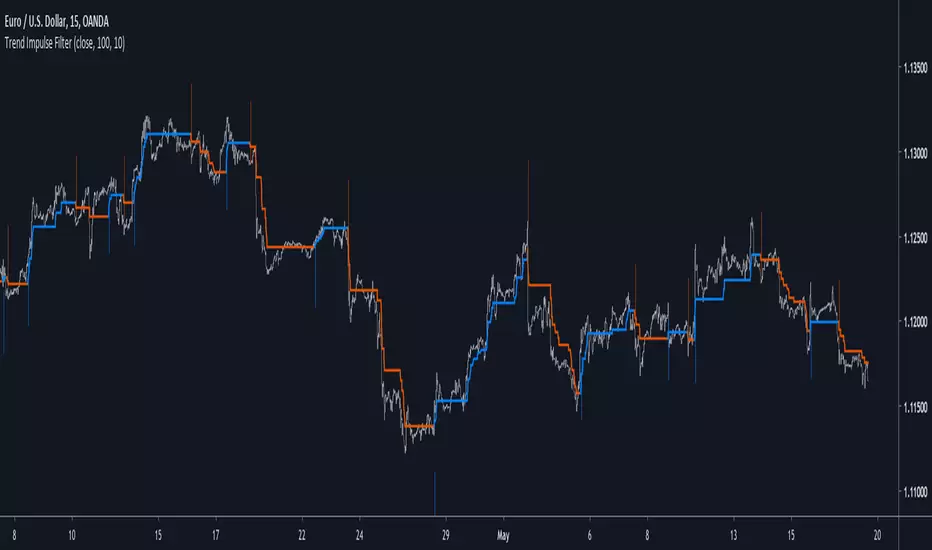
Trend Impulse FilterIntroduction There is a lot of indicators similar to this one, however i think this one don't share the same calculation method and this is why i share it. This indicator aim to forecast price direction using an exponential filter architecture using highest and lowest information for the estimation of a smoothing variable. This filter is similar to the average Max-Min filter. The Indicator In the code a is equal to 1 when the price is greater or lower than any past price over length period, else a is equal to 0. The center parameter control the filtering degree of the output, when center is equal to 1 and a = 1 the indicator return the highest or lowest depending on market current trend, when center is superior to 1 the output will be smoother, however the reactivity of the indicator will still depend on the length parameter. A color option show you the trend of the market, however the generated signals are the same that can be generated from a Donchian channel. When highest is greater than previous highest the indicator direction will move upward, else if lowest is lower than previous lowest the indicator direction will move downward. Therefore the indicator can give information on the Donchian channels direction and provide a nice filter. Conclusions Adapting to highest and lowest can make an indicator adapt to the essence of trend trading, the indicator i showed can be used as source for others indicator or in MA crossover strategies. If you have a strategy using Donchian channels you may be interested in using this indicator and se how it fit in your strategy. Hope you like it. Thanks for reading !Pine Script®指標由alexgrover提供已更新 1313638
CryptoSimmons SMA and TrendThis was made trying to match the indicator Kazonomics uses on his charts. I think it comes pretty close. I made it by combining AK Trend indicator and Madrid Moving Average indicator. Pine Script®指標由CryptoSimmons提供已更新 64
Monotonic Trend Analysisby using Monotonic Trend Analysis script you can see if there is uptrend or downtrend. if there is no trend it goes to zero line. You can change period and threshold values as you wish. Lower period faster response, vice versa. If you find my works useful, please consider a donation BTC: 16XRqyS3Vgh1knAU1tCcruqhUrVm4QWWmR by LonesomeTheBlue Pine Script®指標由LonesomeTheBlue提供已更新 33486