sDEFI Synthetix ExchangeTradingView allows combining/summing up to a maximum of only 10 tickers in its search field. Their support staff suggested I could combine up to 40 by using Pine Script, so here it is, for a specific 'basket' of crypto tokens.
This study displays the combination of price history for Synthetix Exchange’s sDEFI index.
Tokens included in the index are COMP, MKR, KNC, SNX, ZRX, REP, LEND, REN, LRC, BNT, BAL and UMA. You will see the prices only go back as far as July 31st 2020, which is when the most recent of the compilation (UMA) started its trading history on TradingView. (The study can only display prices for days that *all* the tickers were trading.)
The price history will display as a study, below an existing chart. You will need to resize the windows, to see this study at a larger size. (Grab the window border and move it up, once you have added this study to a chart)
Unfortunately you will not be able to interact with it like a normal chart, i.e. drawing trendlines, adding moving averages, notes or annotations, etc.
May I suggest you send a support request to TradingView, asking for them to allow us to enter more than 10 (perhaps up to 40) tickers with + symbol between them, in the search field, which gives a ‘proper’ chart to analyse?
Please note that when publishing this script, I was required to choose a category from a list that does not contain a relevant category. Given that I had to choose something from the list to proceed, I used 'Support and Resistance', since chartists can see S and R levels by looking at this study.
I trust this study is useful for you sDEFI traders.
在腳本中搜尋"trendline"

Two Fractals TrendlinesThis study draws a trend line for the last two Bill Williams up-fractals and down-fractals.
Trend line break signals and alerts can optionally be added.

[KY]McClellan Summation Index RSIThis script contains McClellan Summation Index(MSI) and McClellan Oscillator(MO)
(1) What is McClellan Summation Index(MSI)
McClellan Summation Index(MSI) is a breadth indicator derived the McClellan Oscillator(MO),
which is a breadth indicator based on Net Advances (advancing issues less declining issues).
The Summation Index is simply a running total of the McClellan Oscillator values.
To identify the market direction, I prefer to use the relative strength(RSI) of MSI rather than MSI itself
because MSI is a summation so it's difficult to compare with previous market patterns. So I use RSI applied MSI.
Reference: Stockcharts.com has a nice set of detailed explanation about MSI.
school.stockcharts.com
(2) How to use this script
- Add this script to your chart.
- You can choose one of two options ("MSI RSI" or "MO").
- You can also choose the market from three options ("Nasdaq", "NYSE", "Nasdaq+NYSE")
(3) "MSI RSI" or "MO"
a) "MSI RSI"
For swing trade(sevelal weeks), MSI RSI is much better to identify the broad market direction.
I backtested last several years of S&P500. The result was not symmetrical between MT bear/bull market.
For bull side, when MSI RSI curls up from the bottom(e.g. RSI 30 level), 90% of times out of them the market rallied.
For bear side, when MSI RSI rolles over to downside from the top(e.g. RSI 70 level), only 60% of times out of them the market declined.
So the market tends to hit negatively diverrgent high from advancing/declining issues perspective. Be careful to use MSI oscilator.
b) "MO"
For short term trade(intraday, 2-3 days of holding), MO is better because MSI is a summation so lags several days. MO is quick.
MO is sometimes very noisy, so you need to draw trendlines or horizontal levels to compare with the previous cases.
For beginners, I recommend to use "MSI RSI".

Fractal Series History SummaryThis script presents a summarized view of a series by drawing lines between series samples taken at power-of-two intervals from the current value.
The intent is to provide a visualization of trendlines at multiple scales, without having to untangle those that my overlap each other.
It doesn't overlay a price-chart as written; it could, but IMHO that would be redundant. It's intended to augment oscillators and other kinds of indicators that don't necessarily scale with a price chart.
The script does not attempt to provide buy or sell triggers, but rather, to provide a visualization tool and a line-drawing tech-demo.

Fibonacci EMA TrendlinesSimple EMAs based on the Fibs plus the 200 EMA - Default inputs are 8,13, 21, 55, 200. Inspired by Philakones EMAs.

Consolidation Zones - LiveHello Traders!
This is the script that finds Consolidation Zones in Realtime.
How it works?
- The script finds highest/lowest bars by using "Loopback Period"
- Then it calculates direction
- By using the direction and highest/lowest bar info it calculates consolidation zones in realtime
- If the length of consolidation area is equal/greater than user-defined min length then this area is shown as consolidation zone
- Then Consolidation Zone extends automatically if there is no breakout
if you increase the Loopback Length then you get bigger consolidation zones:
You have option to "Paint Consolidation Area" or not:
Enjoy!

Ehlers Decycler [CC]The Decycler was created by John Ehlers (Cycle Analytics For Traders pgs 40-41) and this is a moving average that has an extremely low lag even though it uses a fairly high length to calculate everything. This can also work well as a trendline. Buy when the indicator line is green and sell when it is red.
Let me know if there are other scripts you would like to see me publish or if you want something custom done!

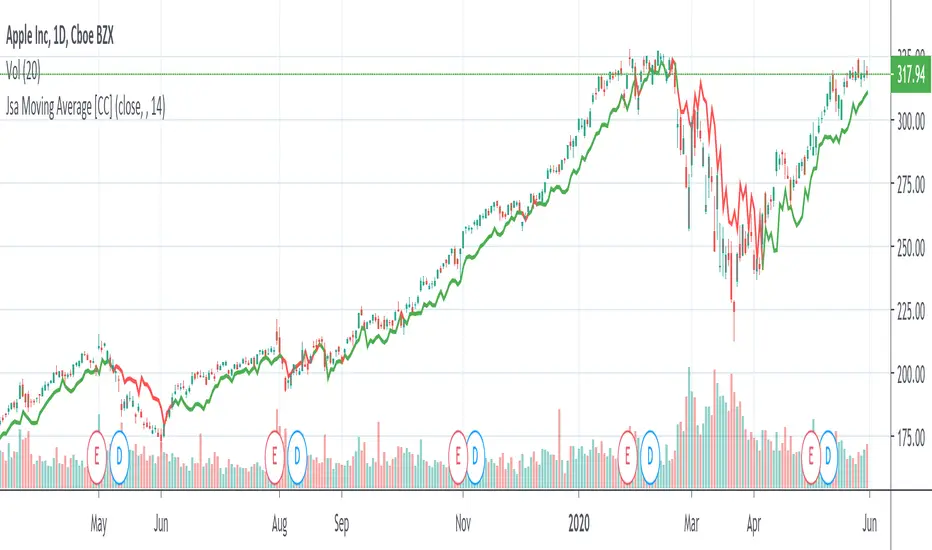
Jsa Moving Average [CC]The Jsa Moving Average was created by George R. Arrington, Ph .D. (Stocks & Commodities V. 11:10 (427-431)) and it is an extremely simple formula but has very many great uses. For one thing it acts as support and resistance levels and it also acts like a trailing stop. It gives a wide enough berth during extended up or down trends to let you ride the wave up or down and when it gets close to the price it means that it is a choppy market. Buy when the indicator line is green and sell when it turns red.
Let me know if you would like to see me publish other indicators or if you want something custom done!
Note: I'm republishing this because the original script couldn't be found in searches so this will fix that.
VLM SpikeFeeling tired and just took a week break away from the busy and tough life. 🎊
Nothing special to mention today, just post a script I coded long time ago when I studied volume.
People always underestimate the importance of volume while drawing tons of trendlines on their charts .
A volume spike is a key to trading because it can tell us three messages, including the top, the bottom and the breakout.
Using Bollinger Band as a proxy, we can always spot two scenarios.
One ,when volume is declining below 1/2 SD of its average, price tends to move in one direction. But unusual volume above 1/2 SD of its average can reverse the original trend.
Hope u find it helpful and don't forget to follow my little account!!😄

BTC Fibonacci DMA350 TrendlinesAdapted from Tim Graham's Code.
See Original Inspiring Article from Phillip Swift at: @positivecrypto
When looking into BITSTAMP:BTCUSD 1D data in spreadsheet. Historically, BTC Highs Hit (Simple Daily Moving Average 350 Days) DMA350 in reverse Fibonacci Sequence Order
2013 Hit DMA350*8 before All Time High (ATH)
2017 Hit DMA350*5 before ATH
I expect 2021 to hit DMA350*3 ATH. When BTC hits DMA350*3 ATH, I suggest selling!

Trend Trade ( in W, D, H, 15M )Condition:
Uptrend, EMA5 > EMA8 > EMA13
Downtrend, EMA5 < EMA8 < EMA13
EMA# input can be changed by user.
Trading Plan:
1. Long in Uptrend when Price croseover EMA5;
Buy EMA5 + 0.03 (Do not wait for close), initial stop EMA13-0.03
If it is a big Gap up, do not chase. Let it go;
2. Short in Downtrend when Price croseunder EMA5;
Short EMA5 - 0.03 (Do not wait for close), initial stop EMA13+0.03
If it is a big Gap Down, do not chase. Let it go;
3. No target strategy in this study;
Back test Weekly, daily, hourly, 15M chart for ES1!, CL1!, GC1!, SPY, QQQ, TLT, IWM, XLF, XLK, XOP, GS, IBM, APPL, AMD, MMM, WBA
When side way move, Entry could be stopped quickly with small loss;
When entry in trending move, the position could be hold for a good range, and keep adding to winner.
Using this study, Futures and ETFs are better than single stock. Big Gap can break the trend, and trigger big stop loss;
This study is designed to join an existing trend. Try not use this in the time frame below 15 min.
To catch the turning point of a swing, Price action (Demand/Supply Confirmation) and trendlineBreak could be more accurate than EMA/SMA lines.

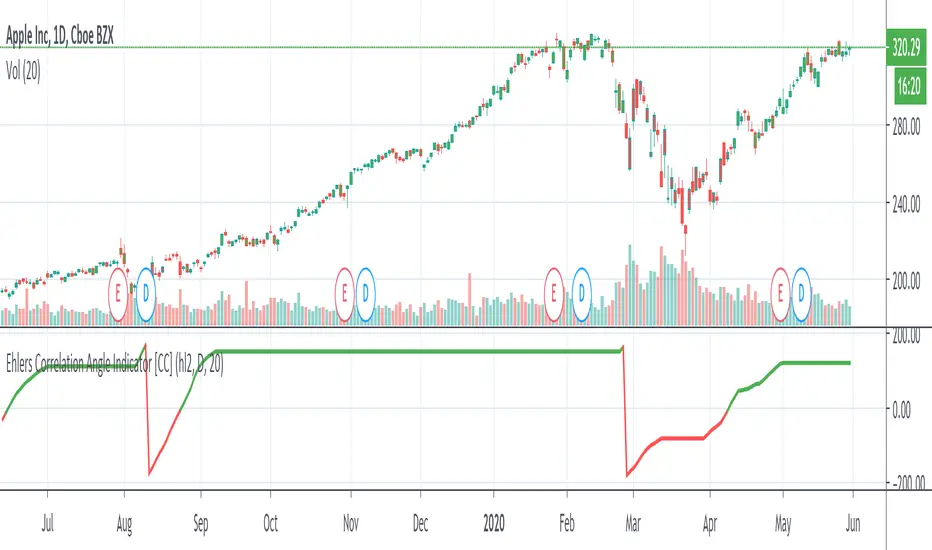
Ehlers Correlation Angle IndicatorThe Correlation Angle Indicator was created by John Ehlers (Stocks & Commodities V. 38:06 (8–15)) and this is technically three indicators in one so I'm splitting each one to a separate script. This particular indicator was designed for trend termination and simply buy when it is green and sell when it turns red.
Let me know if you would like to see me publish other scripts or if you want something custom done!
Relative StrengthThis indicator is called Relative Strength and is no way related to RSI ( Relative strength indicator).
It is simply a ratio of asset A to asset B plotted. Usually it is used to look for strength vs a particular index. Since it is a ratio, all the trendlines work on it. The default index is NIFTY. You can change it any index/script you want to compare:
1. Script vs Index
2. Index vs Index

Trend Exhaustion IndicatorThe Trend Exhaustion Indicator is a custom indicator of mine that is loosely based on the Trend Exhaustion Index created by Clifford L. Creel Ph.D. (Stocks & Commodities V. 9:1 (9-11))
This indicator will let you know the trend reversal points and when it falls below the signal line then the trend is ending vice versa. Buy when the indicator crosses above the signal line and sell when it falls below the signal line.
Let me know if you would like to see me write any other scripts!

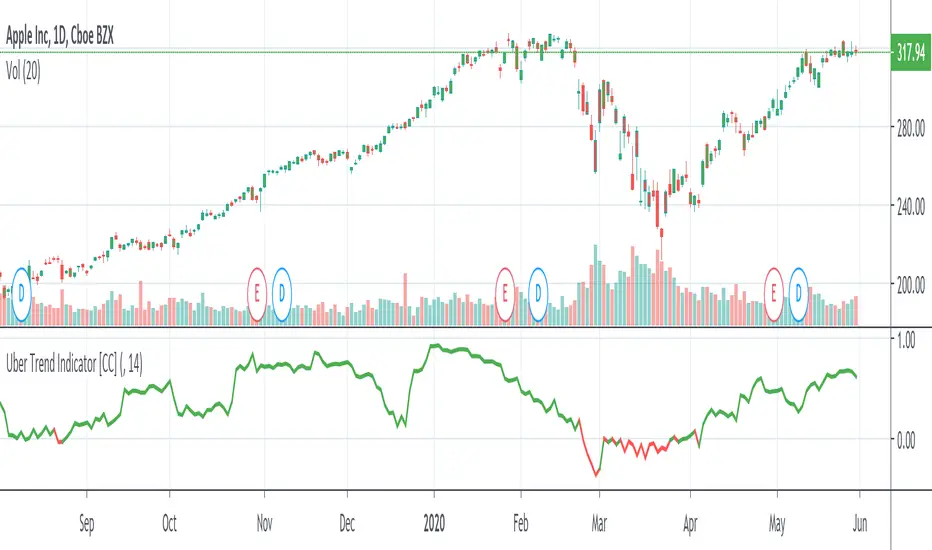
Uber Trend IndicatorThis is my first custom indicator that I created as a medium to long term trend indicator. Buy if it is above 0 and sell if it is below 0.
Since this is my first unique indicator, I would love to hear your feedback! Please let me know if you would like to see any other scripts!
Validated PSARPSAR works well as trailing stop loss (or WinStop), but is often whipsaw'd as it detect trend changes over enthusiastically.
So, a filter to validate trend changes was added. It basically requires 3 straight bars completely breaking the prior saved PSAR level.
Enjoy!

Trend Following MAs 3DHello All,
This is Moving Averages Trend Following 3D indicator. The idea is based on direction of MAs and relation between 20 moving averages (5 to 100 period).
Option to show different type of MAs: EMA, SMA, RMA, WMA, VWMA.
As I haved tested it looks succesful at calculating trend direction and trend strength.
For a better look I tried to make it 3D, it looks good I think, waiting comments ;)
Some screenshots:
By using RMA type:
When it gets tiny it means there is no trend:
An example for down trend:
ENJOY!

Automatic TrendlinesIntroduction
For a full free tutorial explaining this code in more detail, visit the backtest-rookies (.com) website.
This indicator will plot two trend lines at any given time. A resistance trend line and a support trend line. The resistance trend is shown with red circles and is created by joining swing highs together. The second is a support trend which is created by joining swing lows.
Since we need swings to make the trend, the trend line code contains code for the swing detection. You can play around with the swing detection to alter how frequently new trend lines are detected. Relying on swings also means that there will be some delay in trend detection depending on how you configure the swing detection. The higher you set rightbars, the more lag you will have before a trend is detected. However, at the same time the quality of the pivots found will increase. So it is a trade-off you need to come to terms with and decide what the best settings are for you.
Lines
A single trend line is made up of several components.
Pivot Points: Marked as blue or orange circles. There will be two pivots per trend.
Orange/Purple Lines: Connecting all pivot points. You will see these lines change direction slightly each time a new pivot is detected (new circles appear).
Green/Red Circle lines: Showing the trend line from the earliest moment a new trend is detected.
Blue Dashed lines: Joining the purple and green/red circle lines so the full trend line can be seen.
Note: The blue dashed lines use pine-scripts drawing functions. As such, there is a limit to how many of these can be placed on a chart. When the limit is reached, the oldest line will be removed so the newest can be drawn. This means that if you detect enough trends and scroll back in time, the blue dashed lines will disappear at some point!

Trend LinesHello Everyone! This is my new trend lines script (after beta version that was published almost one year ago)
The idea is to find Pivot Highs (PH) and Pivot Lows(PL) first.
Then, If current PH is smaller then previous PH (means no new higher high and possible downtrend) then draw trend line using them. and also it checks previous trend line (if exits) and if current angle is smaller then don't extend previous one.
Same idea when using Pivot Lows, If current PL is higher then previous PL (means no new lower low and possible uptrend) then draw trend line using them. and also it checks previous trend line (if exits) and if current angle is smaller then don't extend previous one.
Optionally style of old trend lines drawn as dashed.
Hope you enjoy it!

Reflex & Trendflex█ OVERVIEW
Reflex and Trendflex are zero-lag oscillators that decompose price into independent cycle and trend components using SuperSmoother filtering. These indicators isolate each component separately, providing clearer identification of cyclical reversals (Reflex) versus trending movements (Trendflex).
Based on Dr. John F. Ehlers' "Reflex: A New Zero-Lag Indicator" article (February 2020, TASC), both oscillators use normalized slope deviation analysis to minimize lag while maintaining signal clarity. The SuperSmoother filter removes high-frequency noise, then deviations from linear regression (Reflex) or current value (Trendflex) are measured and normalized by RMS for consistent amplitude across instruments and timeframes.
█ CONCEPTS
SuperSmoother Filter
Both oscillators begin with a two-pole Butterworth low-pass filter that smooths price data without the excessive lag of simple moving averages. The filter uses exponential decay coefficients and cosine modulation based on the cutoff period, providing aggressive smoothing while preserving signal timing.
Reflex: Cycle Component
Reflex isolates cyclical price behavior by measuring deviation from a linear regression line fitted through the SuperSmoother output. For each bar, the filter calculates a linear slope over the lookback period, then sums how much the smoothed price deviates from this trendline. These deviations represent pure cyclical movement - price oscillations around the dominant trend. The result is normalized by RMS (root mean square) to produce consistent amplitude regardless of volatility or timeframe.
Trendflex: Trend Component
Trendflex extracts trending behavior by measuring cumulative deviation from the current SuperSmoother value. Instead of comparing to a regression line, it simply sums the differences between the current smoothed value and all past values in the period. This captures sustained directional movement rather than oscillations. Like Reflex, normalization by RMS ensures comparable readings across different instruments.
RMS Normalization
Both oscillators normalize their raw deviation measurements using an exponentially weighted RMS calculation: `rms = 0.04 * deviation² + 0.96 * rms `. This adaptive normalization ensures the oscillator amplitude remains stable as volatility changes, making threshold levels meaningful across different market conditions.
█ INTERPRETATION
Reflex (Cycle Component)
Oscillates around zero representing cyclical price behavior isolated from trend:
• Above zero : Price is in upward phase of cycle
• Below zero : Price is in downward phase of cycle
• Zero crossings : Potential cycle reversal points
• Extremes : Indicate stretched cyclical condition, often precede mean reversion
Best used for identifying cyclical turning points in ranging or oscillating markets. More sensitive to reversals than Trendflex.
Trendflex (Trend Component)
Oscillates around zero representing trending behavior isolated from cycles:
• Above zero : Sustained upward trend
• Below zero : Sustained downward trend
• Zero crossings : Trend direction changes
• Magnitude : Strength of trend (larger absolute values = stronger trend)
Best used for confirming trend direction and identifying trend exhaustion. Less noisy than Reflex due to focus on directional movement rather than oscillations.
Combined Analysis
Using both oscillators together provides powerful signal confirmation:
• Both positive: Strong uptrend with positive cycle phase (high probability long setup)
• Both negative: Strong downtrend with negative cycle phase (high probability short setup)
• Divergent signals: Conflicting cycle and trend (choppy conditions, reduce position size)
• Reflex reversal with Trendflex agreement: Cyclical turn within established trend (entry/exit timing)
Dynamic Thresholds
Threshold bands identify statistically significant oscillator readings that warrant attention:
• Breach above +threshold : Strong bullish cycle (Reflex) or trend (Trendflex) behavior - potential overbought condition
• Breach below -threshold : Strong bearish cycle or trend behavior - potential oversold condition
• Return inside thresholds : Signal strength normalizing, potential reversal or consolidation ahead
• Threshold compression : During low volatility, thresholds narrow (especially with StdDev mode), making breaches more frequent
• Threshold expansion : During high volatility, thresholds widen, filtering out minor oscillations
Combine threshold breaches with zero-line position for stronger signals:
• Threshold breach + zero-line cross = high-conviction signal
• Threshold breach without zero-line support = monitor for confirmation
Alert Conditions
Six built-in alerts trigger on bar close (no repainting):
• Above +Threshold : Oscillator crossed above positive threshold (strong bullish behavior)
• Below -Threshold : Oscillator crossed below negative threshold (strong bearish behavior)
• Reflex Above Zero : Reflex crossed above zero (bullish cycle phase)
• Reflex Below Zero : Reflex crossed below zero (bearish cycle phase)
• Trendflex Above Zero : Trendflex crossed above zero (bullish trend shift)
• Trendflex Below Zero : Trendflex crossed below zero (bearish trend shift)
█ SETTINGS & PARAMETER TUNING
Oscillator Settings
• Source : Price series to decompose
• Reflex Period (5-50): SuperSmoother period for cycle component. Lower values increase responsiveness to cyclical turns but add noise. Default 20.
• Trendflex Period (5-50): SuperSmoother period for trend component. Lower values respond faster to trend changes. Default 20.
Display Settings
• Reflex/Trendflex Display : Toggle visibility and customize colors for each oscillator independently
• Zero Line : Reference line showing neutral oscillator position
Dynamic Thresholds
Optional significance bands that identify when oscillator readings indicate strong cyclical or trending behavior:
• Threshold Mode : Choose calculation method based on market characteristics
- MAD (Median Absolute Deviation) : Outlier-resistant, best for markets with occasional spikes (default)
- Standard Deviation : Volatility-sensitive, adapts quickly to regime changes
- Percentile Rank : Fixed probability bands (e.g., 90% = only 10% of values exceed threshold)
• Apply To : Select which oscillator (Reflex or Trendflex) to calculate thresholds for
• Period (2-200): Lookback window for threshold calculation. Default 50.
• Multiplier (k) : Scaling factor for MAD/StdDev modes. Higher values = fewer threshold breaches (default 1.5)
• Percentile (%) : For Percentile mode only. Higher percentile = more selective threshold (default 90%)
Parameter Interactions
• Shorter periods make both oscillators more sensitive but noisier
• Reflex typically more volatile than Trendflex at same period settings
• For ranging markets: shorter Reflex period (10-15) captures swings better
• For trending markets: shorter Trendflex period (10-15) follows trend shifts faster
█ LIMITATIONS
Inherent Characteristics
• Near-zero lag, not zero-lag : Despite the name, some lag remains from SuperSmoother filtering
• Normalization artifacts : RMS normalization can produce unusual readings during volatility regime changes
• Period dependency : Oscillator characteristics change significantly with different period settings - no "correct" universal parameter
Market Conditions to Avoid
• Very low volatility : Normalization amplifies noise in quiet markets, producing false signals
• Sudden gaps : SuperSmoother assumes continuous data; large gaps disrupt filter continuity requiring bars to stabilize
• Micro timeframes : Sub-minute charts contain microstructure noise that overwhelms signal quality
Parameter Selection Pitfalls
• Matching periods to dominant cycle : If period doesn't align with actual market cycle period, signals degrade
• Threshold over-tuning : Optimizing threshold parameters for past data often fails forward - use conservative defaults
• Ignoring component differences : Reflex and Trendflex measure different aspects - don't expect identical behavior
█ NOTES
Credits
These indicators are based on Dr. John F. Ehlers' "Reflex: A New Zero-Lag Indicator" published in the February 2020 issue of Technical Analysis of Stocks & Commodities (TASC) magazine. The article introduces a novel approach to isolating cycle and trend components using SuperSmoother filtering combined with normalized deviation analysis.
For those interested in the underlying mathematics and DSP concepts:
• Ehlers, J.F. (February 2020). "Reflex: A New Zero-Lag Indicator" - Technical Analysis of Stocks & Commodities magazine
• Ehlers, J.F. (2001). Rocket Science for Traders: Digital Signal Processing Applications . John Wiley & Sons
• Various TASC articles by John Ehlers on SuperSmoother filters and oscillator design
by ♚@e2e4

BEST Supertrend StrategyHello traders
Sharing a sample Supertrend strategy to illustrate how to calculate a convergence and using it in a strategy
I based the setup as follow:
- Entries on Supertrend MTF breakout + moving average cross. Entering whenever there is a convergence
- exit whenever a Simple Moving Averages cross in the opposite direction happen
- possibility to filter only Longs/Shorts or both
All the best
Dave

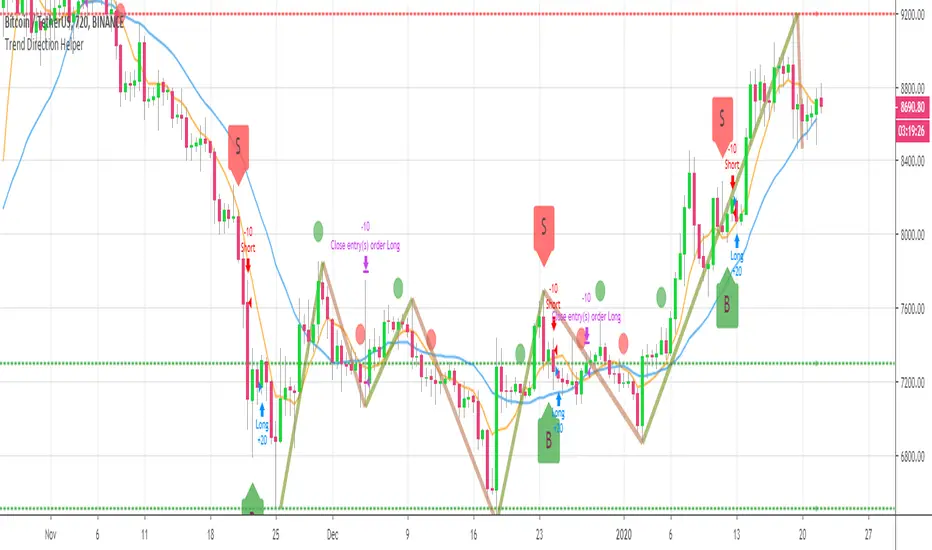
BEST Trend Direction Helper (Strategy Edition)Hello traders
A follower asked me to convert my Trend Direction Helper into a strategy
So blessed this indicator reached the 1400+ likes milestone - I can't believe how many people are trading with it
I based the setup as follow:
- Entries on those green/red labels
- exit whenever a Simple Moving Averages cross in the opposite direction happen
- possibility to filter only Longs/Shorts or both
Also...
The strategy includes the Zig Zag/Pivots high/low and other options from the indicator version. I only added a quick strategy component with a hard exit concept based on SMA cross
All the best fam and... HAPPY NEW YEAR !!!!!!!!!!!
Dave
Pivot Reversal Strategy - FIGS & DATES 2.0Simple Pivot Reversal Strategy with some adding settings.
Date Range: To test over specific market conditions.
Initial Capitol: $10K - This is a more realistic representation of funds used this strategy (for me anyway). The default of $100K can give different results (usually better) than when using a smaller balance.
Order Size: 100% Equity - These trend following strategies typically used this way, going all in each direction.
Commission: .075% - It's always disheartening to think you've found a ridiculously good setting, and then realize you forgot to add the commission.
All of these settings can be changed, but it's easier for me (and more fool proof) to have them set as default.
