Kitchen [ilovealgotrading]
OVERVIEW:
Kitchen is a strategy that aims to trade in the direction of the trend by using supertrend and stochRsi data by calculating at different time values.
IMPLEMENTATION DETAILS – SETTINGS:
First of all, let's understand the supertrend and stocrsi indicators.
How do you read and use Super Trend for trading ?
The price is often going upwards when it breaks the super trend line while keeping its position above the indication level.
When the market is in a bullish trend, the indicator becomes green. The indicator level will act as trendline support in such a scenario. The color of the indicator changes to red to indicate a negative trend once the price crosses the support line. The price uses the super trend level as a trendline resistance during a bearish move.
In our strategy, if our 1-hour and 4-hour supertrend lines show the up or down train in the same direction at the same time, we can assume that a train is forming here.
Why do I use the time of 1 hour and 4 hours ?
When I did a backtest from the past to the present, I discovered that the most accurate and consistent time zones are the 1 hour and 4 hour time zones.
By the way we can change our short term timeframe(1H) and long term timeframe(4H) from settings panel.
How do you read and use the Stoch-RSI Indicator?
This indicator analyzes price dynamics automatically to detect overbought and oversold locations.
The indicator includes:
- The primary line, which typically has values between 0 and 100;
- Two dynamic levels for overbought and oversold conditions.
IF our stoch-rsi indicator value has fallen below our lower boundary line, the oversold event has been observed in the price, if our stoch-rsi value breaks up our bottom line after becoming oversold, we think that the price will start the recovery phase.(The case is also true for the opposite.)
However, this does not always apply and we need additional approvals, Therefore, our 1H and 4H supertrrend indicator provides us with additional confirmation.
Buy Condition:
Our 1H(short term) and 4H(long term) supertrrend indicator, has given the buy signal(green line and yellow line), and if our stochrsi indicator has broken our oversold line up on the past 15 bars, the buy signal is formed here.
Sell Condition:
Our 1H(short term) and 4H(long term) supertrrend indicator, has given the sell signal(red line and orange line), and if our stochrsi indicator has broken our overbuy line down on the past 15 bars, the sell signal is formed here.
Stop Loss or Take Profit Conditions:
Exit Long Senerio:
All conditions are completed, the buy signal has arrived and we have entered a LONG trade, the 1-hour supertrend line follows the price rise(yellow line), if the price breaks below the 1-hour super trend line and a sell condition occurs for 1H timeframe for supertrend indcator, LONG trade will exit here.
Exit Short Senerio:
All conditions are completed, the Sell signal has arrived and we have entered a SHORT trade, the 1-hour supertrend line follows the price down(orange line), if the price breaks up the 1-hour super trend line and a buy condition occurs for 1H timeframe for supertrend indcator, SHORT trade will exit here.
What can you change in the settings panel?
1-We can set Start and End date for backtest and future alarms
2-We can set ATR length and Factor for supertrend indicator
3-We can set our short term and long term timeframe value
4-We can set StochRsi Up and Low limit to confirm buy and sell conditions
5-We can set stochrsi retroactive approval length
6-We can set stochrsi values or the length
7-We can set Dollar cost for per position
8- We can choose the direction of our positions, we can set only LONG, only SHORT or both directions.
9-IF you want to place automatic buy and sell orders with this strategy, you can paste your codes into the Long open-close or Short open-close message sections.
For example
IF you write your alert window this code {{strategy.order.alert_message}}.
When trigger Long signal you will get dynamically what you pasted here for Long Open Message
ALSO:
Please do not open trades without properly managing your risk and psychology!!!
If you have any ideas what to add to my work to add more sources or make calculations cooler, suggest in DM .
在腳本中搜尋"trendline"

Average Trend with Deviation BandsTL,DR: A trend indicator with deviation bands using a modified Donchian calculation
This indicator plots a trend using the average of the lowest and highest closing price and the lowest low and highest high of a given period. This is similar to Donchian channels which use an average of the lowest and highest value (of a given period). This might sound like a small change but imho it provides a better "average" when lows/highs and lowest/highest closing prices are considered in the average calculation as well.
I also added the option to show 2 deviation bands (one is deactivated by default but can be activated in the options menu). The deviation band uses the standard deviation (of the average trend) and can be used to determine if a price movement is still in a "normal" range or not. Based on my testing it is fine to use one band with a standard deviation of 1 but it is also possible to show a second band with a different deviation value if needed. The bands (and trendline) can also be used as dynamic support/resistance zones.
Trendline without deviation bands

Trop BandsTrop Bands is a tool that uses an exponential moving average (EMA) as its central trendline and upper and lower bands to identify potential buying and selling opportunities in the market. The bands are calculated based on recent moves away from the EMA, and they are plotted around the central trendline to provide a visual representation of market trends and conditions. When the price moves outside of these bands, it can be seen as a signal that the security is overbought or oversold and may be ready for a reversal, just like Bollinger Bands.
In addition to providing signals when the price moves outside of the bands, the indicator can also show triangles outside/inside the bands. These triangles are based on the Demand Index developed by James Sibbet and are intended to provide additional confirmation of potential trading opportunities. They can be used in conjunction with other technical analysis tools to help identifying potential trading opportunities in the market.

TALibrary "TA"
General technical analysis functions
div_bull(pS, iS, cp_length_after, cp_length_before, pivot_length, lookback, no_broken, pW, iW, hidW, regW)
Test for bullish divergence
Parameters:
pS : Price series (float)
iS : Indicator series (float)
cp_length_after : Bars after current (divergent) pivot low to be considered a valid pivot (optional int)
cp_length_before : Bars before current (divergent) pivot low to be considered a valid pivot (optional int)
pivot_length : Bars before and after prior pivot low to be considered valid pivot (optional int)
lookback : Bars back to search for prior pivot low (optional int)
no_broken : Flag to only consider divergence valid if the pivot-to-pivot trendline is unbroken (optional bool)
pW : Weight of change in price, used in degree of divergence calculation (optional float)
iW : Weight of change in indicator, used in degree of divergence calculation (optional float)
hidW : Weight of hidden divergence, used in degree of divergence calculation (optional float)
regW : Weight of regular divergence, used in degree of divergence calculation (optional float)
Returns:
flag = true if divergence exists (bool)
degree = degree (strength) of divergence (float)
type = 1 = regular, 2 = hidden (int)
lx1 = x coordinate 1 (int)
ly1 = y coordinate 1 (float)
lx2 = x coordinate 2 (int)
ly2 = y coordinate 2 (float)
div_bear(pS, iS, cp_length_after, cp_length_before, pivot_length, lookback, no_broken, pW, iW, hidW, regW)
Test for bearish divergence
Parameters:
pS : Price series (float)
iS : Indicator series (float)
cp_length_after : Bars after current (divergent) pivot high to be considered a valid pivot (optional int)
cp_length_before : Bars before current (divergent) pivot highto be considered a valid pivot (optional int)
pivot_length : Bars before and after prior pivot high to be considered valid pivot (optional int)
lookback : Bars back to search for prior pivot high (optional int)
no_broken : Flag to only consider divergence valid if the pivot-to-pivot trendline is unbroken (optional bool)
pW : Weight of change in price, used in degree of divergence calculation (optional float)
iW : Weight of change in indicator, used in degree of divergence calculation (optional float)
hidW : Weight of hidden divergence, used in degree of divergence calculation (optional float)
regW : Weight of regular divergence, used in degree of divergence calculation (optional float)
Returns:
flag = true if divergence exists (bool)
degree = degree (strength) of divergence (float)
type = 1 = regular, 2 = hidden (int)
lx1 = x coordinate 1 (int)
ly1 = y coordinate 1 (float)
lx2 = x coordinate 2 (int)
ly2 = y coordinate 2 (float)

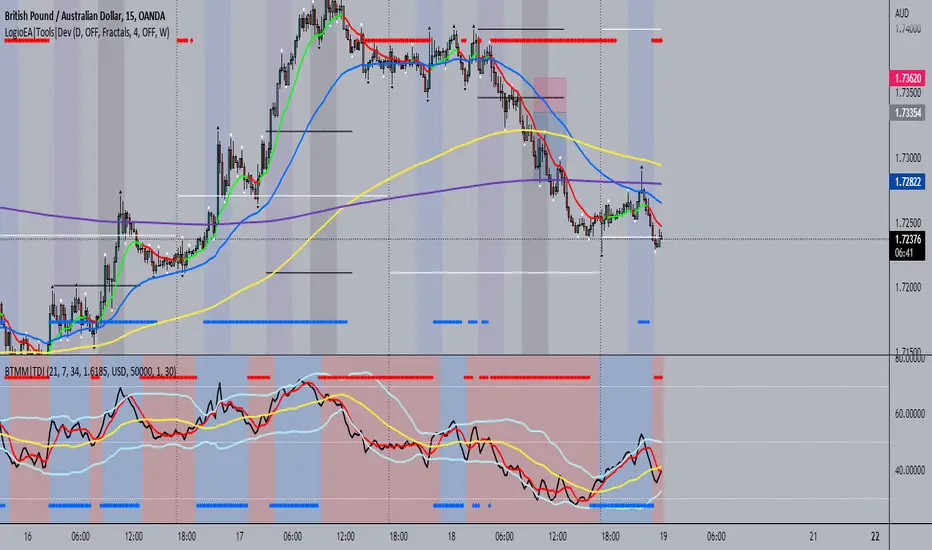
BTMM|TDIThis is the trader's dynamic index inspired by Steve Mauro's BTMM strategy.
In addition to the RSI, Trendline, Baseline, Volatility Bands I have also included additional trend biases that are painted in the background to provide more confluence when the markets break out in either direction.
For convenience, a position size calculator is included for all users to quickly calculate lot sizes on forex pairs with difference account balance currencies. The calculator works accurately on forex pairs. DO NOT USE for crypto or indices as some brokers have unique contract sizes that could not be fully incorporated into the tool.
There is also data table that displays historical values of the RSI, Trendline, Baseline, and an EMA vs Price scoring procedure that covers the current candle (t0) and up to 3 candles back. The table is meant to provide a snapshot view of either bullish or bearish dominance that can be deciphered with a quick glance.
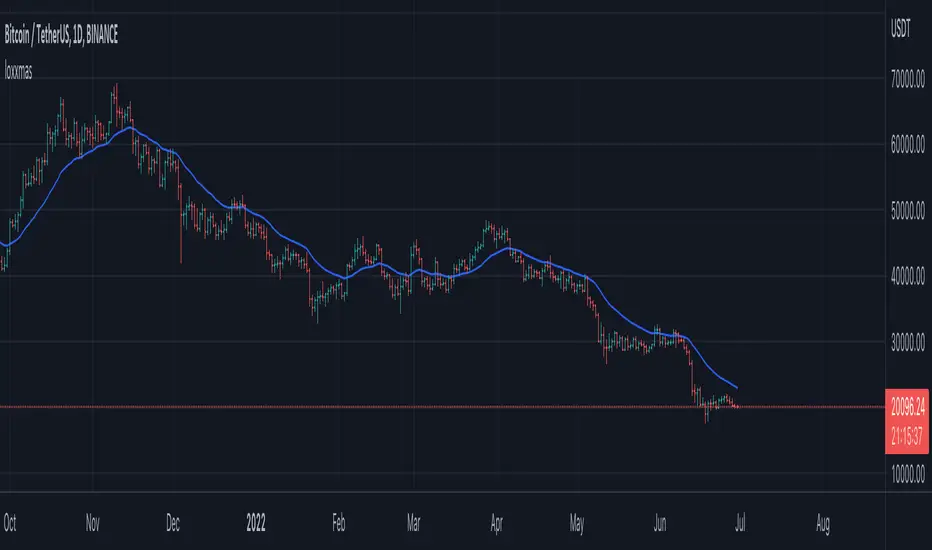
loxxmas - moving averages used in Loxx's indis & stratsLibrary "loxxmas"
TODO:loxx moving averages used in indicators
kama(src, len, kamafastend, kamaslowend)
KAMA Kaufman adaptive moving average
Parameters:
src : float
len : int
kamafastend : int
kamaslowend : int
Returns: array
ama(src, len, fl, sl)
AMA, adaptive moving average
Parameters:
src : float
len : int
fl : int
sl : int
Returns: array
t3(src, len)
T3 moving average, adaptive moving average
Parameters:
src : float
len : int
Returns: array
adxvma(src, len)
ADXvma - Average Directional Volatility Moving Average
Parameters:
src : float
len : int
Returns: array
ahrma(src, len)
Ahrens Moving Average
Parameters:
src : float
len : int
Returns: array
alxma(src, len)
Alexander Moving Average - ALXMA
Parameters:
src : float
len : int
Returns: array
dema(src, len)
Double Exponential Moving Average - DEMA
Parameters:
src : float
len : int
Returns: array
dsema(src, len)
Double Smoothed Exponential Moving Average - DSEMA
Parameters:
src : float
len : int
Returns: array
ema(src, len)
Exponential Moving Average - EMA
Parameters:
src : float
len : int
Returns: array
fema(src, len)
Fast Exponential Moving Average - FEMA
Parameters:
src : float
len : int
Returns: array
hma(src, len)
Hull moving averge
Parameters:
src : float
len : int
Returns: array
ie2(src, len)
Early T3 by Tim Tilson
Parameters:
src : float
len : int
Returns: array
frama(src, len, FC, SC)
Fractal Adaptive Moving Average - FRAMA
Parameters:
src : float
len : int
FC : int
SC : int
Returns: array
instant(src, float)
Instantaneous Trendline
Parameters:
src : float
float : alpha
Returns: array
ilrs(src, int)
Integral of Linear Regression Slope - ILRS
Parameters:
src : float
int : len
Returns: array
laguerre(src, float)
Laguerre Filter
Parameters:
src : float
float : alpha
Returns: array
leader(src, int)
Leader Exponential Moving Average
Parameters:
src : float
int : len
Returns: array
lsma(src, int, int)
Linear Regression Value - LSMA (Least Squares Moving Average)
Parameters:
src : float
int : len
int : offset
Returns: array
lwma(src, int)
Linear Weighted Moving Average - LWMA
Parameters:
src : float
int : len
Returns: array
mcginley(src, int)
McGinley Dynamic
Parameters:
src : float
int : len
Returns: array
mcNicholl(src, int)
McNicholl EMA
Parameters:
src : float
int : len
Returns: array
nonlagma(src, int)
Non-lag moving average
Parameters:
src : float
int : len
Returns: array
pwma(src, int, float)
Parabolic Weighted Moving Average
Parameters:
src : float
int : len
float : pwr
Returns: array
rmta(src, int)
Recursive Moving Trendline
Parameters:
src : float
int : len
Returns: array
decycler(src, int)
Simple decycler - SDEC
Parameters:
src : float
int : len
Returns: array
sma(src, int)
Simple Moving Average
Parameters:
src : float
int : len
Returns: array
swma(src, int)
Sine Weighted Moving Average
Parameters:
src : float
int : len
Returns: array
slwma(src, int)
linear weighted moving average
Parameters:
src : float
int : len
Returns: array
smma(src, int)
Smoothed Moving Average - SMMA
Parameters:
src : float
int : len
Returns: array
super(src, int)
Ehlers super smoother
Parameters:
src : float
int : len
Returns: array
smoother(src, int)
Smoother filter
Parameters:
src : float
int : len
Returns: array
tma(src, int)
Triangular moving average - TMA
Parameters:
src : float
int : len
Returns: array
tema(src, int)
Tripple exponential moving average - TEMA
Parameters:
src : float
int : len
Returns: array
vwema(src, int)
Volume weighted ema - VEMA
Parameters:
src : float
int : len
Returns: array
vwma(src, int)
Volume weighted moving average - VWMA
Parameters:
src : float
int : len
Returns: array
zlagdema(src, int)
Zero-lag dema
Parameters:
src : float
int : len
Returns: array
zlagma(src, int)
Zero-lag moving average
Parameters:
src : float
int : len
Returns: array
zlagtema(src, int)
Zero-lag tema
Parameters:
src : float
int : len
Returns: array
threepolebuttfilt(src, int)
Three-pole Ehlers Butterworth
Parameters:
src : float
int : len
Returns: array
threepolesss(src, int)
Three-pole Ehlers smoother
Parameters:
src : float
int : len
Returns: array
twopolebutter(src, int)
Two-pole Ehlers Butterworth
Parameters:
src : float
int : len
Returns: array
twopoless(src, int)
Two-pole Ehlers smoother
Parameters:
src : float
int : len
Returns: array
Moving Average Filters Add-on w/ Expanded Source Types [Loxx]Moving Average Filters Add-on w/ Expanded Source Types is a conglomeration of specialized and traditional moving averages that will be used in most of indicators that I publish moving forward. There are 39 moving averages included in this indicator as well as expanded source types including traditional Heiken Ashi and Better Heiken Ashi candles. You can read about the expanded source types clicking here . About half of these moving averages are closed source on other trading platforms. This indicator serves as a reference point for future public/private, open/closed source indicators that I publish to TradingView. Information about these moving averages was gleaned from various forex and trading forums and platforms as well as TASC publications and other assorted research publications.
________________________________________________________________
Included moving averages
ADXvma - Average Directional Volatility Moving Average
Linnsoft's ADXvma formula is a volatility-based moving average, with the volatility being determined by the value of the ADX indicator.
The ADXvma has the SMA in Chande's CMO replaced with an EMA, it then uses a few more layers of EMA smoothing before the "Volatility Index" is calculated.
A side effect is, those additional layers slow down the ADXvma when you compare it to Chande's Variable Index Dynamic Average VIDYA.
The ADXVMA provides support during uptrends and resistance during downtrends and will stay flat for longer, but will create some of the most accurate market signals when it decides to move.
Ahrens Moving Average
Richard D. Ahrens's Moving Average promises "Smoother Data" that isn't influenced by the occasional price spike. It works by using the Open and the Close in his formula so that the only time the Ahrens Moving Average will change is when the candlestick is either making new highs or new lows.
Alexander Moving Average - ALXMA
This Moving Average uses an elaborate smoothing formula and utilizes a 7 period Moving Average. It corresponds to fitting a second-order polynomial to seven consecutive observations. This moving average is rarely used in trading but is interesting as this Moving Average has been applied to diffusion indexes that tend to be very volatile.
Double Exponential Moving Average - DEMA
The Double Exponential Moving Average (DEMA) combines a smoothed EMA and a single EMA to provide a low-lag indicator. It's primary purpose is to reduce the amount of "lagging entry" opportunities, and like all Moving Averages, the DEMA confirms uptrends whenever price crosses on top of it and closes above it, and confirms downtrends when the price crosses under it and closes below it - but with significantly less lag.
Double Smoothed Exponential Moving Average - DSEMA
The Double Smoothed Exponential Moving Average is a lot less laggy compared to a traditional EMA. It's also considered a leading indicator compared to the EMA, and is best utilized whenever smoothness and speed of reaction to market changes are required.
Exponential Moving Average - EMA
The EMA places more significance on recent data points and moves closer to price than the SMA (Simple Moving Average). It reacts faster to volatility due to its emphasis on recent data and is known for its ability to give greater weight to recent and more relevant data. The EMA is therefore seen as an enhancement over the SMA.
Fast Exponential Moving Average - FEMA
An Exponential Moving Average with a short look-back period.
Fractal Adaptive Moving Average - FRAMA
The Fractal Adaptive Moving Average by John Ehlers is an intelligent adaptive Moving Average which takes the importance of price changes into account and follows price closely enough to display significant moves whilst remaining flat if price ranges. The FRAMA does this by dynamically adjusting the look-back period based on the market's fractal geometry.
Hull Moving Average - HMA
Alan Hull's HMA makes use of weighted moving averages to prioritize recent values and greatly reduce lag whilst maintaining the smoothness of a traditional Moving Average. For this reason, it's seen as a well-suited Moving Average for identifying entry points.
IE/2 - Early T3 by Tim Tilson
The IE/2 is a Moving Average that uses Linear Regression slope in its calculation to help with smoothing. It's a worthy Moving Average on it's own, even though it is the precursor and very early version of the famous "T3 Indicator".
Integral of Linear Regression Slope - ILRS
A Moving Average where the slope of a linear regression line is simply integrated as it is fitted in a moving window of length N (natural numbers in maths) across the data. The derivative of ILRS is the linear regression slope. ILRS is not the same as a SMA (Simple Moving Average) of length N, which is actually the midpoint of the linear regression line as it moves across the data.
Instantaneous Trendline
The Instantaneous Trendline is created by removing the dominant cycle component from the price information which makes this Moving Average suitable for medium to long-term trading.
Laguerre Filter
The Laguerre Filter is a smoothing filter which is based on Laguerre polynomials. The filter requires the current price, three prior prices, a user defined factor called Alpha to fill its calculation.
Adjusting the Alpha coefficient is used to increase or decrease its lag and it's smoothness.
Leader Exponential Moving Average
The Leader EMA was created by Giorgos E. Siligardos who created a Moving Average which was able to eliminate lag altogether whilst maintaining some smoothness. It was first described during his research paper "MACD Leader" where he applied this to the MACD to improve its signals and remove its lagging issue. This filter uses his leading MACD's "modified EMA" and can be used as a zero lag filter.
Linear Regression Value - LSMA (Least Squares Moving Average)
LSMA as a Moving Average is based on plotting the end point of the linear regression line. It compares the current value to the prior value and a determination is made of a possible trend, eg. the linear regression line is pointing up or down.
Linear Weighted Moving Average - LWMA
LWMA reacts to price quicker than the SMA and EMA. Although it's similar to the Simple Moving Average, the difference is that a weight coefficient is multiplied to the price which means the most recent price has the highest weighting, and each prior price has progressively less weight. The weights drop in a linear fashion.
McGinley Dynamic
John McGinley created this Moving Average to track price better than traditional Moving Averages. It does this by incorporating an automatic adjustment factor into its formula, which speeds (or slows) the indicator in trending, or ranging, markets.
McNicholl EMA
Dennis McNicholl developed this Moving Average to use as his center line for his "Better Bollinger Bands" indicator and was successful because it responded better to volatility changes over the standard SMA and managed to avoid common whipsaws.
Non lag moving average
The Non Lag Moving average follows price closely and gives very quick signals as well as early signals of price change. As a standalone Moving Average, it should not be used on its own, but as an additional confluence tool for early signals.
Parabolic Weighted Moving Average
The Parabolic Weighted Moving Average is a variation of the Linear Weighted Moving Average. The Linear Weighted Moving Average calculates the average by assigning different weight to each element in its calculation. The Parabolic Weighted Moving Average is a variation that allows weights to be changed to form a parabolic curve. It is done simply by using the Power parameter of this indicator.
Recursive Moving Trendline
Dennis Meyers's Recursive Moving Trendline uses a recursive (repeated application of a rule) polynomial fit, a technique that uses a small number of past values estimations of price and today's price to predict tomorrows price.
Simple Moving Average - SMA
The SMA calculates the average of a range of prices by adding recent prices and then dividing that figure by the number of time periods in the calculation average. It is the most basic Moving Average which is seen as a reliable tool for starting off with Moving Average studies. As reliable as it may be, the basic moving average will work better when it's enhanced into an EMA.
Sine Weighted Moving Average
The Sine Weighted Moving Average assigns the most weight at the middle of the data set. It does this by weighting from the first half of a Sine Wave Cycle and the most weighting is given to the data in the middle of that data set. The Sine WMA closely resembles the TMA (Triangular Moving Average).
Smoothed Moving Average - SMMA
The Smoothed Moving Average is similar to the Simple Moving Average (SMA), but aims to reduce noise rather than reduce lag. SMMA takes all prices into account and uses a long lookback period. Due to this, it's seen a an accurate yet laggy Moving Average.
Smoother
The Smoother filter is a faster-reacting smoothing technique which generates considerably less lag than the SMMA (Smoothed Moving Average). It gives earlier signals but can also create false signals due to its earlier reactions. This filter is sometimes wrongly mistaken for the superior Jurik Smoothing algorithm.
Super Smoother
The Super Smoother filter uses John Ehlers’s “Super Smoother” which consists of a a Two pole Butterworth filter combined with a 2-bar SMA (Simple Moving Average) that suppresses the 22050 Hz Nyquist frequency: A characteristic of a sampler, which converts a continuous function or signal into a discrete sequence.
Three pole Ehlers Butterworth
The 3 pole Ehlers Butterworth (as well as the Two pole Butterworth) are both superior alternatives to the EMA and SMA. They aim at producing less lag whilst maintaining accuracy. The 2 pole filter will give you a better approximation for price, whereas the 3 pole filter has superior smoothing.
Three pole Ehlers smoother
The 3 pole Ehlers smoother works almost as close to price as the above mentioned 3 Pole Ehlers Butterworth. It acts as a strong baseline for signals but removes some noise. Side by side, it hardly differs from the Three Pole Ehlers Butterworth but when examined closely, it has better overshoot reduction compared to the 3 pole Ehlers Butterworth.
Triangular Moving Average - TMA
The TMA is similar to the EMA but uses a different weighting scheme. Exponential and weighted Moving Averages will assign weight to the most recent price data. Simple moving averages will assign the weight equally across all the price data. With a TMA (Triangular Moving Average), it is double smoother (averaged twice) so the majority of the weight is assigned to the middle portion of the data.
The TMA and Sine Weighted Moving Average Filter are almost identical at times.
Triple Exponential Moving Average - TEMA
The TEMA uses multiple EMA calculations as well as subtracting lag to create a tool which can be used for scalping pullbacks. As it follows price closely, it's signals are considered very noisy and should only be used in extremely fast-paced trading conditions.
Two pole Ehlers Butterworth
The 2 pole Ehlers Butterworth (as well as the three pole Butterworth mentioned above) is another filter that cuts out the noise and follows the price closely. The 2 pole is seen as a faster, leading filter over the 3 pole and follows price a bit more closely. Analysts will utilize both a 2 pole and a 3 pole Butterworth on the same chart using the same period, but having both on chart allows its crosses to be traded.
Two pole Ehlers smoother
A smoother version of the Two pole Ehlers Butterworth. This filter is the faster version out of the 3 pole Ehlers Butterworth. It does a decent job at cutting out market noise whilst emphasizing a closer following to price over the 3 pole Ehlers.
Volume Weighted EMA - VEMA
Utilizing tick volume in MT4 (or real volume in MT5), this EMA will use the Volume reading in its decision to plot its moves. The more Volume it detects on a move, the more authority (confirmation) it has. And this EMA uses those Volume readings to plot its movements.
Studies show that tick volume and real volume have a very strong correlation, so using this filter in MT4 or MT5 produces very similar results and readings.
Zero Lag DEMA - Zero Lag Double Exponential Moving Average
John Ehlers's Zero Lag DEMA's aim is to eliminate the inherent lag associated with all trend following indicators which average a price over time. Because this is a Double Exponential Moving Average with Zero Lag, it has a tendency to overshoot and create a lot of false signals for swing trading. It can however be used for quick scalping or as a secondary indicator for confluence.
Zero Lag Moving Average
The Zero Lag Moving Average is described by its creator, John Ehlers, as a Moving Average with absolutely no delay. And it's for this reason that this filter will cause a lot of abrupt signals which will not be ideal for medium to long-term traders. This filter is designed to follow price as close as possible whilst de-lagging data instead of basing it on regular data. The way this is done is by attempting to remove the cumulative effect of the Moving Average.
Zero Lag TEMA - Zero Lag Triple Exponential Moving Average
Just like the Zero Lag DEMA, this filter will give you the fastest signals out of all the Zero Lag Moving Averages. This is useful for scalping but dangerous for medium to long-term traders, especially during market Volatility and news events. Having no lag, this filter also has no smoothing in its signals and can cause some very bizarre behavior when applied to certain indicators.
________________________________________________________________
What are Heiken Ashi "better" candles?
The "better formula" was proposed in an article/memo by BNP-Paribas (In Warrants & Zertifikate, No. 8, August 2004 (a monthly German magazine published by BNP Paribas, Frankfurt), there is an article by Sebastian Schmidt about further development (smoothing) of Heikin-Ashi chart.)
They proposed to use the following:
(Open+Close)/2+(((Close-Open)/( High-Low ))*ABS((Close-Open)/2))
instead of using :
haClose = (O+H+L+C)/4
According to that document the HA representation using their proposed formula is better than the traditional formula.
What are traditional Heiken-Ashi candles?
The Heikin-Ashi technique averages price data to create a Japanese candlestick chart that filters out market noise.
Heikin-Ashi charts, developed by Munehisa Homma in the 1700s, share some characteristics with standard candlestick charts but differ based on the values used to create each candle. Instead of using the open, high, low, and close like standard candlestick charts, the Heikin-Ashi technique uses a modified formula based on two-period averages. This gives the chart a smoother appearance, making it easier to spots trends and reversals, but also obscures gaps and some price data.
Expanded generic source types:
Close = close
Open = open
High = high
Low = low
Median = hl2
Typical = hlc3
Weighted = hlcc4
Average = ohlc4
Average Median Body = (open+close)/2
Trend Biased = (see code, too complex to explain here)
Trend Biased (extreme) = (see code, too complex to explain here)
Included:
-Toggle bar color on/off
-Toggle signal line on/off

BBPBΔ(OBV-PVT)BB - Time Series Decomposition & Volume WeightedThis is an indicator that shows 5 different points of information:
#1 The Trendline is uses a time-series decomposition to remove noise and seasonality data to provide a trendline without using moving averages. This is then further processed by a custom VWAP block that weights it based on the time frame you're currently using.
#2 BB%B - This is the blue histogram that's partially transparent. This is used to find when a security is overbought or oversold.
#3 BB%B of the Δ(OBV-PVT). This is the green histogram. We took the OBV and subtracted the PVT from it, then we found the delta of that compared to the previous candle. This output a line, which we wrapped in bollinger bands to find the BB%B of this line. This line is represented as a histogram, for visual clarity.
#4 Long and Short Indicators: Long is represented by a green dot, and short is represented by a red dot.
#5 Zones - there are multiple zones, which are used to identify overbought and oversold zones.
How to use the indicator:
Simple way: Long on green dot, Short on red dot. Use stop losses and take profits.
Slightly More Complex: Same as above, but also close out longs, when the green histogram drops but the blue does not. As this means price action hasn't caught up with volume. Use stop losses and take profits.
Full Usage: Long only when both the green, blue and yellow lines are below 0, and sell when the blue or green histogram rises above 1. Perform the opposite for the shorting. Ignore the dots if you use this method, they are for simple reference points til you get used to this indicator. Use stop losses and take profits.

Rate Of Change [SIDD]This Oscillator is helping identify rate of change in Price.
Basic Definition :-
The Rate of Change ( ROC ) is a momentum technical indicator.
It measures the percentage change in price between the current price and the price a certain number of periods ago.
This indicator is plotted against zero, with the indicator moving upwards into positive territory if price changes are to the upside, and moving into negative territory if price changes are to the downside.
Customization of inbuilt ROC:- I have created EMA of ROC with 9 days exponential moving average and Coloring the plot of 9 EMA of ROC Green and RED. Green line indicates that Price change rate is positive in last 9 time period on selected resolution (time frame) and Red line indicated that negative price change rate.
I have identified the zone like +5 and -5 line area in study where some resistance or support is there for 9 EMA ROC line. and if 9 EMA ROC crosses those line then intensity of previous trend get increased.
I have drawn here breakout trendline from lower high candle with hand mark up and same time ROC is above 5 marked with hand up. Similarly I have drawn hand mark down where breakdown trendline is drawn for higher low candle breakdown.
You can see clearly ROC 9 EMA is sync correctly with breakout and breakdown candle when ROC 9 EMA
is above 5 and below 5.
I able to observed that ROC 9 EMA is helping in finding correct breakout and breakdown candles with proper trendline breakout and breakdown.
above all my observation is with daily time frame and 1 Hr time frame candles mostly. If you are changing time frame then see the difference and post same in comment so I can watch those changes as well,
You can modify this study and lets create better than this as well. As I think nothing is perfect in this world always there is scope of improvement.
This study to see how the price are getting changing and what is the rate of change .
This study doesn't give any buy and sell recommendation.
I have other indicator which is given in my signature below that you can check.

Easy TrendThis signal is completely based on analysis and transformation of a single simple moving average. As with all signals and indicators, it should be combined with others.
This is how the signal is built:
1. First it takes the SMA of the closing price.
2. It then takes the ROC of that SMA using a length of 1.
3. It takes an 8-period SMA and also a 64-period SMA of that ROC.
4. These are plotted as follows:
- the ROC is plotted in green when above 0 (trending up) and red when below 0 (trending down).
- the 8-period SMA is plotted as a thin white line within the ROC signal
- the 64-period SMA is plotted as a thick white line within the ROC signal
When the trendline is green, this is a bullish zone. When the trendline is red, this is a bearish zone.
Moving averages (all types of moving averages) are inherently lagging signals. To compensate for that, I am offsetting each SMA series by half of its period. This may be confusing to some, but the end result is a mathematically accurate SMA signal, centered on the signal that it is providing the moving average of. It doesn't stop the lag, but it directly and obviously shows how lagged each signal is, which I personally find better to trade against.
Symbols on the top and bottom of indicator:
Yellow triangle at bottom of indicator shows where a downward trend is starting to bottom out and a buy/long opening may be available soon.
Green triangle at bottom of indicator shows that a downward trend has switched to an upward trend. This indicates a good time to buy.
Yellow triangle at top of indicator shows where an upward trend is starting to plateau and a sell/short opening may be available soon.
Red triangle at top of indicator shows that an upward trend has switched to a downward trend. This indicates a good time to sell.
Note: You may see multiple yellow triangles before seeing a green or red triangle. This can happen when multiple trend accelerations or decelerations occur within an overall green or red zone.
In addition there is a dotted line connecting the end of the 64-period SMA to the end of the 8-period SMA. This indicates the direction the trend is moving towards. When the dotted line crosses the zero line, this portrays a rough estimate of where the trend may switch from a downtrend to an uptrend or vice versa. This is the "best" time to buy or sell, depending on your strategy.
I recommend placing a SMA on your candles set to the same window size as this indicator, and also to offset that SMA to the left by half its window size. For example, a 90-period SMA should be offset by -45 periods. That will cause it to be correctly aligned with this trend signal.

[blackcat] L3 Ehlers ZeroLag Intraday Trading SystemLevel: 3
Background
John F. Ehlers introuced ZeroLag Intraday Trading System in his "Rocket Science for Traders" chapter 16.
Function
blackcat L3 EhlersZeroLag Intraday Trading System is used to find proper long and short entries. Dr. Ehlers developed a completely automatic ZeroLag Intraday Trading System. The concepts of the Instantaneous Trendline and the ZeroLag EMA are very powerful. To demonstrate just how profound these concepts are, Dr. Ehlers designed an intraday trading system. An intraday trade is defined as any active trade that is traded and then closed at the end of the day.
Key Signal
Smooth --> 4 bar WMA w/ 1 bar lag
Detrender --> The amplitude response of a minimum-length HT can be improved by adjusting the filter coefficients by
trial and error. HT does not allow DC component at zero frequency for transformation. So, Detrender is used to remove DC component/ trend component.
Q1 --> Quadrature phase signal
I1 --> In-phase signal
Period --> Dominant Cycle in bars
SmoothPeriod --> Period with complex averaging
DCPeriod ---> Dominant Cycle Period
Trendline ---> IT fast line
ZeroLag ---> Zero Lag Filter
long ---> long entry signal
short ---> short entry signal
Pros and Cons
100% John F. Ehlers definition translation of original work, even variable names are the same. This help readers who would like to use pine to read his book. If you had read his works, then you will be quite familiar with my code style.
NOTE: This version of Trading System has better preformance than "Automatic SineTrend Trading System".
Remarks
The 12th script for Blackcat1402 John F. Ehlers Week publication.
Readme
In real life, I am a prolific inventor. I have successfully applied for more than 60 international and regional patents in the past 12 years. But in the past two years or so, I have tried to transfer my creativity to the development of trading strategies. Tradingview is the ideal platform for me. I am selecting and contributing some of the hundreds of scripts to publish in Tradingview community. Welcome everyone to interact with me to discuss these interesting pine scripts.
The scripts posted are categorized into 5 levels according to my efforts or manhours put into these works.
Level 1 : interesting script snippets or distinctive improvement from classic indicators or strategy. Level 1 scripts can usually appear in more complex indicators as a function module or element.
Level 2 : composite indicator/strategy. By selecting or combining several independent or dependent functions or sub indicators in proper way, the composite script exhibits a resonance phenomenon which can filter out noise or fake trading signal to enhance trading confidence level.
Level 3 : comprehensive indicator/strategy. They are simple trading systems based on my strategies. They are commonly containing several or all of entry signal, close signal, stop loss, take profit, re-entry, risk management, and position sizing techniques. Even some interesting fundamental and mass psychological aspects are incorporated.
Level 4 : script snippets or functions that do not disclose source code. Interesting element that can reveal market laws and work as raw material for indicators and strategies. If you find Level 1~2 scripts are helpful, Level 4 is a private version that took me far more efforts to develop.
Level 5 : indicator/strategy that do not disclose source code. private version of Level 3 script with my accumulated script processing skills or a large number of custom functions. I had a private function library built in past two years. Level 5 scripts use many of them to achieve private trading strategy.

[f(x)] Bollinger Donchian RemixThis is my version of a mixture of Bollinger and Donchian (BB/DC Remix)
It is a modified fork of Dolchian/Bollinger Hybrid by Ricardo Santos ( DBH.V0)
this is the two pictures comparing it.
Made this Fork because Santos' code starts getting chopping with my type of settings.
His time input is 24, but mine varies between 13 and 21.
You really notice in scalping and sometimes intraday timeframes with my settings.
His also differ from mine based on the trendline, where he modifies his Simple Moving Average, which is default color is black, and I use the the default one, which the default color is red.
Also you can change the trendline type input (open,close,hl2,etc...) to tailor your preference.
Note: Default is close, Santos use hl2, I use ohlc4.

SuperTrend Oscillator v3Version 3: Improved aesthetically, complete turnaround for the strategy with which to use this indicator.
Once again, thanks to BlindFreddy and ChrisMoody for the bits of code that were assembled into this indicator.
Make the chart yours using the share button for the indicator with barcolors functionality.
Changes from v2 and looking forward: Indicator now uses a 14 length SuperTrend with no ATR multiplier. This my preferred use and I'd be grateful to hear your case for a different length/multiplier. Removed the Bollinger Bands and retracement dots due to these being gimmicky and marginally useful. There may be a version 4 should a similar concept using a rate of change analysis turn out to be useful. I have also tried -in vain- to plot internal trend peaks as horizontal S/R levels. Please pm if you are willing to help in that respect.
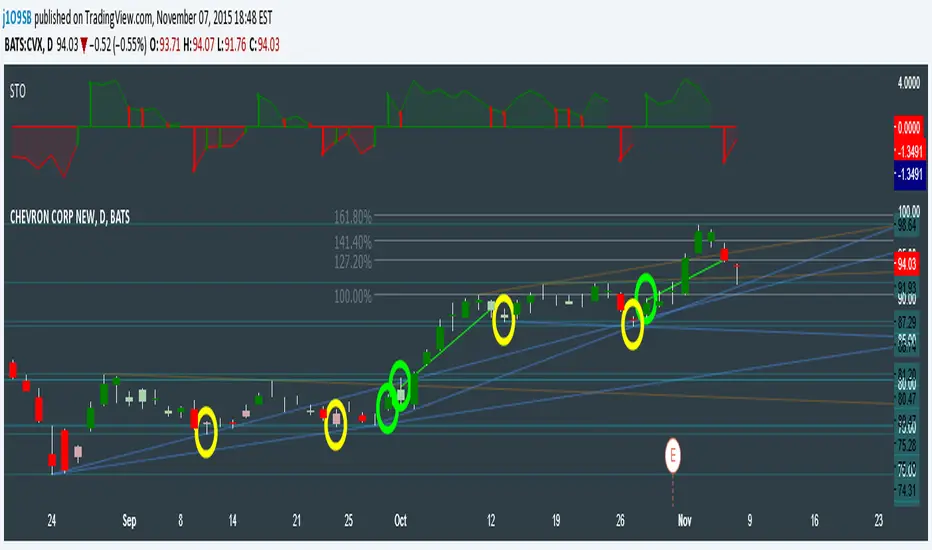
Strategy: The indicator will display the trend as a red/green area. It measures the spread between the closing price and the SuperTrend line, much like a CCI (close and ma). When the area contracts warning bars of the opposite trend color will warn of a reversal. When this happens, these areas will either be defended, reviving the trend, or will break, causing a trend flip. SuperTrend is unique in that breaks are typically large candles, and that its levels, especially on Weekly, Daily, Hourly, Minute timeframes, these levels will be defended (think similar to a 200sma or a 21ema). The STO making new highs within (internal) a trend is an overextension sign.
CVX Example: This is not a full analysis of CVX's stock , just an example potential trades. On the posted chart I used a weekly and a daily STO.
Long 1:The weekly showed warnings and then flipped. The daily made a double bottom, showed warnings and then flipped the daily STO at trendline support.
Long 2:The weekly still shows an uptrend, the daily made a weak break to downtrend and reversed back upwards at trendline support, forming a double bottom. Note the conservative exit when the STO made an internal new high.
Long 3: looking forward on CVX stock , the current downtrend made a weak break and is showing sings of reversal (pin bar) at horizontal support. Go long on flip of the daily (conservative) or flip of the hourly (aggressive).
SuperTrend OscillatorVersion 3: Improved aesthetically, complete turnaround for the strategy with which to use this indicator.
Once again, thanks to BlindFreddy and ChrisMoody for the bits of code that were assembled into this indicator.
Make the chart yours using the share button for the indicator with barcolors functionality.
Changes from v2 and looking forward: Indicator now uses a 14 length SuperTrend with no ATR multiplier. This my preferred use and I'd be grateful to hear your case for a different length/multiplier. Removed the Bollinger Bands and retracement dots due to these being gimmicky and marginally useful. There may be a version 4 should a similar concept using a rate of change analysis turn out to be useful. I have also tried -in vain- to plot internal trend peaks as horizontal S/R levels. Please pm if you are willing to help in that respect.
Strategy: The indicator will display the trend as a red/green area. It measures the spread between the closing price and the SuperTrend line, much like a CCI (close and ma). When the area contracts warning bars of the opposite trend color will warn of a reversal. When this happens, these areas will either be defended, reviving the trend, or will break, causing a trend flip. SuperTrend is unique in that breaks are typically large candles, and that its levels, especially on Weekly, Daily, Hourly, Minute timeframes, these levels will be defended (think similar to a 200sma or a 21ema). The STO making new highs within (internal) a trend is an overextension sign.
CVX Example: This is not a full analysis of CVX's stock, just an example potential trades. On the posted chart I used a weekly and a daily STO.
Long 1:The weekly showed warnings and then flipped. The daily made a double bottom, showed warnings and then flipped the daily STO at trendline support.
Long 2:The weekly still shows an uptrend, the daily made a weak break to downtrend and reversed back upwards at trendline support, forming a double bottom. Note the conservative exit when the STO made an internal new high.
Long 3: looking forward on CVX stock, the current downtrend made a weak break and is showing sings of reversal (pin bar) at horizontal support. Go long on flip of the daily (conservative) or flip of the hourly (aggressive).


VWAP BandsBuy Godrej Properties
Strong Retest Support of 1362-1483.
+
Trendline Support
+
Fibo 78.6 Support.
Stoploss 1158 weekly Closing.
Target should be 1900 and 2500

TEMA_1h_1D_1W_1MTEMA_1h_1D_1W_1M (Multi-Timeframe Triple Exponential Moving Average) indicator on TradingView.
Title: TEMA Multi-Timeframe (1h/1D/1W/1M) - Low Lag Trend
Short Description:
Plots TEMA (Triple Exponential Moving Average) from 1h, Daily, Weekly, and Monthly timeframes onto your current chart for instant, low-lag trend context.
Detailed Description:
Overview
The TEMA_1h_1D_1W_1M indicator is a comprehensive, multi-timeframe (MTF) analysis tool designed to visualize the Triple Exponential Moving Average (TEMA) from higher timeframes (HTF) directly on your current trading chart. By using TEMA instead of a standard EMA, this indicator significantly reduces lag, allowing you to identify trend changes faster without sacrificing trend smoothing.
Key Features
Four Timeframe Integration: Plots TEMA lines for 1-Hour (1h), Daily (1D), Weekly (1W), and Monthly (1M) timeframes.
Multi-Timeframe Compatibility: Displays higher timeframe TEMA lines on lower timeframe charts (e.g., 5m, 15m) without "stair-stepping" artifacts.
Low Lag, High Smoothness: TEMA provides a more responsive trendline than traditional EMAs, aiding in earlier trend detection.
Customizable Lengths: Fully adjustable TEMA lengths for each timeframe (default usually 20, 50, or 200).
Visual Clarity: Each timeframe's TEMA can be colored and styled separately to identify trend alignment at a glance.
Trading Applications
Trend Alignment: Confirm the long-term trend (e.g., Monthly/Weekly TEMA) aligns with the short-term trend (e.g., Hourly TEMA) before entering trades.
Dynamic Support/Resistance: Higher timeframe TEMAs act as robust, dynamic support and resistance levels.
Breakout Confirmation: Use 1h TEMA to confirm trend reversals, while using 1D/1W TEMA to filter out false signals.
Indicator Inputs
TEMA Periods: Separately adjustable lengths for 1h, 1D, 1W, and 1M.
Styling: Toggle visibility, colors, and line thickness for each timeframe.
Disclaimer: Education purpose only. TEMA works best in trending markets and may produce false signals in choppy, ranging markets.

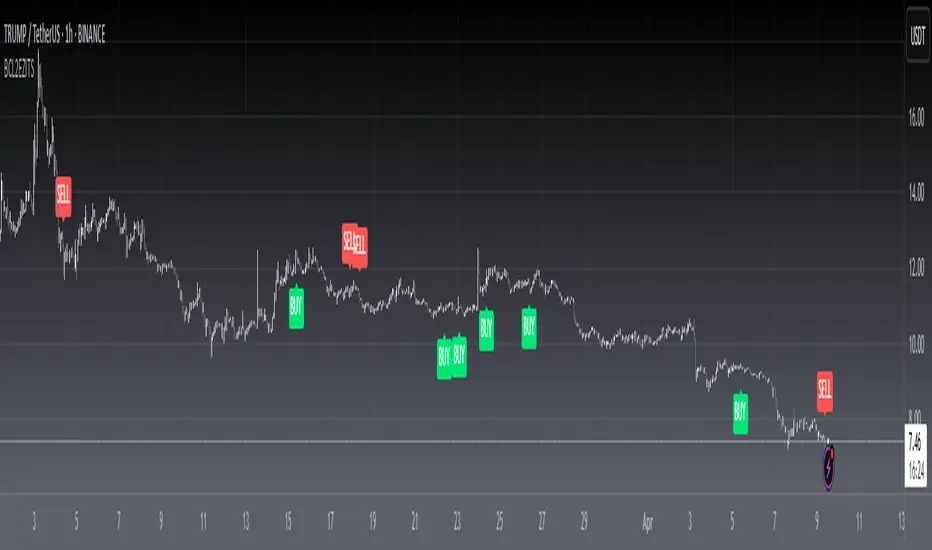
Larry Williams Qualified Trend Break Signals [tradeviZion]Larry Williams Qualified Trend Break Signals - Description
📖 Introduction
Welcome to the Larry Williams Qualified Trend Break Signals indicator. This description explains how the indicator works, its settings, and how to use it.
This indicator demonstrates Larry Williams' Qualified Trend Line Break technique - his preferred method for timing precise entries on daily charts when you already have a confirmed market setup.
---
🎯 About This Script
This indicator implements the Qualified Trend Line Break system - an entry technique that qualifies trend line breaks for better timing.
Important: This is NOT a signal generator. It's an entry timing tool for traders who already have a market setup and confirmation. Use it only after establishing weekly bias and daily confirmation.
Why We Made This Indicator:
This indicator demonstrates Larry Williams' favorite entry technique for daily timeframe trading. It's designed to be used as part of his complete methodology:
How To Use It Properly:
First, establish your setup: Check weekly chart for overall market bias (bullish/bearish)
Then confirm on daily: Look for confirmation signals on daily timeframe
Finally, use trend breaks: Enter trades only when trend breaks align with your setup direction
Important Warning: This is NOT a standalone buy/sell signal indicator. Using trend breaks without proper setup and confirmation will likely produce poor results. It's a timing tool for entries, not a signal generator.
---
About The Qualification Rules
The system improves on qualification methodology with these key changes:
For BUY signals (breaking above downtrend lines):
Break is usually bad if previous bar closed higher
But can still be good if:
Previous bar was inside the prior bar AND that prior bar closed lower
Price gaps above trend line and moves up at least one tick
Previous bar closed below its own opening price
For SELL signals (breaking below uptrend lines):
Break is usually bad if previous bar closed lower
But can still be good if:
Previous bar was inside the prior bar AND that prior bar closed higher
Price gaps below trend line and moves down at least one tick
Previous bar closed above its own opening price
---
📐 How The Qualification System Works
The trend break system is based on qualification methodology as developed by Larry Williams . It solves the problem where trend line breaks often fail and price goes back.
Trend Line Setup:
For BUY signals: Connect the two most recent declining swing highs to make a downtrend line
For SELL signals: Connect the two most recent rising swing lows to make an uptrend line
Inside Bar Rule:
A key principle: Trend breaks that occur on inside bars are completely ignored. The system only evaluates breaks that occur on regular bars, making signals more reliable.
How It Works In The Code
The indicator follows these steps:
Finds swing points: Identifies highs and lows in the price action
Draws trend lines: Connects 2 recent swing points to make trend lines
Checks inside bars: Ignores breaks that happen on inside bars
Qualifies signals: Uses the rules to check if breaks are good or bad
Shows signals: Only displays qualified BUY/SELL signals
Optional feature: Can show disqualified signals
⚙️ Settings
The indicator has 3 groups of settings to customize how it works.
---
📊 Signal Settings
Show Signals
Default: ON
ON: Displays green/red labels when trend breaks qualify for entry
OFF: Hides entry labels (trend lines still show for analysis)
Remember: These are entry TIMING signals, not standalone buy/sell signals
Signal Selection
Default: Both | Options: Buy Only, Sell Only, Both
Buy Only: Shows only BUY signals
Sell Only: Shows only SELL signals
Both: Shows both BUY and SELL signals
Break Validation
Default: Close | Options: Break Level, Close
Break Level: Signal when price touches the trend line (more signals)
Close: Signal when bar closes beyond trend line (fewer signals)
Tip: Try "Close" first for better signals
Show Disqualified
Default: OFF | Options: ON/OFF
What it does: Shows bad breaks
ON: Shows gray ❌ labels with explanations
OFF: Hides bad signals
👁️ Display Settings
Show Trend Lines
Default: ON
What it does: Shows trend lines on the chart
Looks like: Dashed blue lines connecting swing points
Goes to: Extends into future bars
Why: Shows where breakouts are expected
Show Swing Points
Default: ON
What it does: Marks highs/lows used for trend lines
Looks like: Shape markers at swing locations
Shows: How trend lines are constructed
Marker Style
Default: Circle | Options: Circle, Triangle, Square, Diamond, Cross
What it does: Choose shape for swing markers
Options: Circle, Triangle, Square, Diamond, Cross
Best choice: Circle is clear without being busy
Marker Size
Default: 3 | Range: 1-10
What it does: Controls marker size
Range: 1 (tiny) to 10 (large)
Show Inside Bars
Default: ON
What it does: Highlights inside bars
Looks like: Light orange background on inside bars
Note: These bars are ignored for break qualification
Important: Inside bars are ignored for break qualification
🎨 Colors
Signal Colors
Buy Signal (Default: Green) - Color for good BUY signals
Sell Signal (Default: Red) - Color for good SELL signals
Disqualified (Default: Gray) - Color for bad signals
Display Colors
Trend Line (Default: Blue) - Color for trend lines and markers
Inside Bar (Default: Light Orange) - Background for inside bars
💡 How To Use It In Larry Williams Methodology
Step 1 - Weekly Setup: Identify market bias on weekly chart (clear bullish/bearish trend)
Step 2 - Daily Confirmation: Find confirmation signals on daily timeframe
Step 3 - Trend Break Entry: Use qualified trend breaks only in setup direction
Important: Never enter based on trend breaks alone - always require setup + confirmation first
⚠️ Important Notice
This indicator implements Larry Williams' trend break entry technique. It should NOT be used as standalone buy/sell signals. Only use trend breaks for entry timing after you have established a proper market setup and confirmation. Poor results will occur if using signals without the complete Larry Williams methodology.
Credits: Based on Larry Williams' trading approach and qualification methodology. Swing detection logic adapted from "Larry Williams: Market Structure" by Smollet.

Anchored VWAPThe Anchored VWAP Indicator: A Dynamic Reference for Pivotal Market Events
This script implements a specialized and highly customizable trading tool known as an Anchored Volume-Weighted Average Price (VWAP). Its core innovation and primary utility lie not in a novel mathematical formula, but in its temporal flexibility. Unlike the standard VWAP, which resets at the fixed start of each trading day, this indicator allows the trader to manually define the precise moment from which the calculation begins. This transforms it from a generic daily benchmark into a powerful, event-specific dynamic support and resistance level.
What It Does and How It Works
The indicator plots a single, continuous line on the price chart. This line represents the average price paid for an asset over a specified period, weighted by trading volume, but crucially, starting from a user-chosen timestamp. The calculation follows this logic:
Anchor Point Definition: The user specifies a "Start Time" (e.g., "2024-05-22 11:45:00"). This is the anchor—the moment deemed significant for a new market phase.
Initialization: On the very first candle at or immediately after the anchor time, the indicator initializes its calculation. It uses the candle's high price and volume to set an initial value, establishing a starting point for the cumulative calculation.
Cumulative Calculation: For every subsequent candle, the script calculates the Typical Price (High + Low + Close) / 3 for that period. It then:
Adds (Typical Price * Volume) to a running cumulative total.
Adds the Volume to a running cumulative volume total.
VWAP Plotting: The anchored VWAP line for each candle is simply the cumulative total price-value divided by the cumulative total volume up to that point. The line is only plotted for the period on and after the user-defined anchor time.
How to Use It: The Strategic Application
The power of this tool is unlocked through strategic anchor point selection. It is not a standalone signal generator but a dynamic reference framework for price action. It belongs to the family of Price Action-Based, Event-Driven Analysis and Dynamic Support/Resistance methodologies. Traders use it to contextualize price movement relative to a key market "reset" event.
Common anchor points include:
Major Economic News Releases: Anchor at the exact time of a CPI, FOMC, or jobs report to see the fair-value price discovery after the news, filtering out prior, irrelevant noise.
Significant Technical Breaks: Anchor at the moment a price conclusively breaks a major trendline, a multi-month high/low, or a key chart pattern (like the neckline of a head and shoulders). The VWAP then acts as a dynamic gauge of momentum following the breakout.
Session or Shift Changes: For 24-hour markets, anchor at the open of a specific session (e.g., London Open, US Open) to analyze intra-session flow.
Instrument-Specific Events: Anchor at the start of a merger announcement, earnings call, or product launch.
Once anchored, traders interpret price interaction with the line:
Trend Validation: Price sustaining above a rising anchored VWAP (anchored at a breakout point) confirms bullish momentum. Conversely, holding below a falling VWAP confirms bearish momentum.
Dynamic Support/Resistance: In a trending move, pullbacks towards the anchored VWAP often find support (in uptrends) or resistance (in downtrends). This makes it a potential area for trend-continuation entries.
Mean Reversion & Exhaustion Signals: A sharp, high-volume move far away from the anchored VWAP may signal an overextended market, prompting watch for a reversion back to the mean (the VWAP line).
The Core Philosophy and Rationale
The underlying principle is that volume-confirmed price action following a defining event establishes a new, more relevant fair-value equilibrium. The standard daily VWAP includes all overnight or pre-event noise, which can distort the relevant average for the new market regime initiated by the event.
This anchored approach:
Filters Irrelevance: It isolates analysis to the market structure after the catalyst, providing a cleaner analytical canvas.
Respects Market Microstructure: By weighting price by volume, it acknowledges that high-volume price levels are more significant than low-volume spikes, creating a more robust and "traded" average.
Provides a Self-Adjusting Baseline: It creates a moving benchmark that evolves with the new trend, offering a continuous, objective measure of whether prices are becoming relatively "expensive" or "cheap" within the current move, not compared to the entire day.
In essence, this Anchored VWAP shifts the perspective from a fixed, time-based cycle (the trading day) to a flexible, event-based cycle. It empowers traders to draw a dynamic line in the sand at their chosen moment of structural shift, turning a simple average into a sophisticated gauge of post-event market sentiment and momentum.

T-Theory - by: Terry LaundryThis script is brought to you, via inspiration by trader Marty Schwarz. His book titled Pit Bull is widely available - for free on PDF. He credits Terry Laundry with the T-Theory, also available for free on look-up.
Here is a description provided on Gemini AI. T-Theory, developed by Terry Laundry, is a technical analysis methodology based on the principle of Time Symmetry. It posits that the market spends an equal amount of time building up energy (the "Magic T") as it does releasing that energy in a trending move.
Here is an objective summary of its core mechanics:
1. The Principle of Symmetry
The central law of T-Theory is that the duration of a market's "cash buildup" phase (the left side of the T) will be matched by the duration of the "run" phase (the right side of the T).
The Center Post: This represents the peak of a market's internal strength or momentum.
The Left Wing: The time from a previous low to the center post.
The Right Wing: The projected time from the center post to the end of the new trend.
2. Time over Price
Unlike many technical indicators that focus on price targets, T-Theory is almost entirely focused on time targets. It suggests that once a "T" is identified, the trend will persist until the time symmetry is exhausted, regardless of how high or low the price goes during that window.
3. Magic T's and Sub-T's
The theory operates on a hierarchical basis:
Grand Macro T's: These define long-term secular trends and can span years.
Minor T's: These represent shorter-term bursts of momentum within a larger trend.
The Law of Proportion: Larger horizontal wings (more time spent consolidating) necessitate larger vertical posts (more significant momentum shifts), creating a visual hierarchy on the chart.
4. Identification via Oscillators
While you requested the script focus on price action, Laundry originally identified these "buildup" phases using the McClellan Oscillator. He looked for periods where the oscillator showed "strength" (buildup) followed by a "breakout" from a trendline on the oscillator itself, which marked the center post of the T.
Key Visual Characteristics
Non-Intersection: In a clean T-Theory setup, the horizontal "wings" represent time spans and should ideally sit above or below the price action to clearly define the period of the trade without being obscured by daily volatility.
The Center Post Gap: The vertical post should be near the price data to show the point of origin for the momentum, but it requires enough "room" to remain distinct.

Needle Below 20, Sub-chart## 指标名称
**单针下20副图(Needle Below 20, Sub-chart)**
## 一句话概述
在**中周期保持强势**的背景下,用短周期的“快速降温”来定位**强势回撤/错杀**,并额外标记**极端超卖(双线归零)**的情绪极值窗口。
---
## 指标逻辑与构成
本指标包含两条强弱线(随机指标风格的区间归一化):
* **短期线(默认 3)**
反映近短周期内价格在区间的位置,敏感度高,用于捕捉短线回撤与情绪快速降温。
* **长期线(默认 21)**
反映中周期强弱分布,用作“趋势/强势背景”的过滤。
并提供两类柱状提示(STICK):
1. **双线归零(默认:短期≤6 且 长期≤6)**
代表“情绪极端恐慌/极端超卖”的窗口,更多用于观察**反弹可能性**与“风险释放阶段”。
2. **单针下20(默认:短期≤20 且 长期≥80)**
代表“中周期强势未破 + 短线急跌/下探”的典型回撤信号,用于寻找趋势交易中的**回撤介入候选**。
图中绘制 **80/20** 参考线,帮助快速判断分位区域。
---
## 使用方法(推荐工作流)
### 1)先定“背景”:只在你认可的趋势环境使用
本指标本质是“**强势回撤定位器**”,并不负责替你判断大盘/板块/个股是否处于可交易趋势。建议搭配以下任一类过滤器:
* **趋势过滤(强烈推荐)**
* 价格位于中长期均线之上(例:MA50/MA200 上方)
* 或者你自己的趋势线/多空线系统显示多头趋势(如:快线>慢线、结构未破)
* **结构过滤(强烈推荐)**
* 回撤仍然在关键支撑之上(前高、趋势线、箱体上沿回踩等)
* 避免在明显“破位下跌”的结构中把信号当作抄底依据
### 2)信号触发后的处理:不要“看到就买”,而是“进入观察与触发”
* **单针下20(黄柱)**:
作为“候选提示”,下一步关注是否出现:
* 回踩关键位后的止跌K线(锤子线/吞没/放量止跌等)
* 次日/后续重新站回关键位或出现趋势延续确认
* 量价关系转好(缩量回撤、放量反转等)
* **双线归零(红柱)**:
更偏“情绪极值”提示,常见用途是:
* 提醒你风险已经释放到极端区域,观察是否出现反弹结构
* 不建议无过滤硬抄底;更适合与“结构止跌/大盘企稳”一起使用
---
## 风险控制与止损思路(示例,不构成建议)
以下仅提供“如何把信号落到可执行”的框架示例:
* **入场触发(示例)**
* 黄柱出现后:等待价格在关键位止跌,或出现确认K线再介入
* 分批:先小仓试错,确认后再加
* **止损锚点(示例)**
* 关键支撑位下破(趋势线/前低/箱体下沿)
* 或“信号触发后的反弹失败又破前低”
* **仓位建议(原则)**
* 把仓位大小与止损距离联动:止损距离越大,仓位越小
* 避免单次信号重仓;这类信号更适合“低风险试错 + 确认加仓”的趋势回撤逻辑
---
## 参数说明与调参建议
### 1)为什么是 3 / 21?
* **3**:强调“短期情绪/回撤”的敏感度,适合捕捉快速下探
* **21**:近似一个月交易日,刻画中周期强弱背景,适合作为“强势过滤”
如果你交易周期更短(更偏日内/隔日):
* 可考虑 **短期 2–5**、长期 **13–34** 区间做测试。
如果你交易周期更长(偏波段/中线):
* 可考虑 **短期 5–8**、长期 **34–55**。
### 2)为什么阈值是 6 / 20 / 80?
* **6**:更接近“极端”区域,用于标记情绪极值(双线归零)
* **20/80**:经典分位阈值,表示低位/高位区域,用于区分“短弱/长强”的错位状态
### 3)如何调参更贴合你的市场与标的?
建议按“信号密度—胜率—回撤”三者权衡:
* 信号太多:
* 降低“长期≥”阈值的触发频率(如 80→85)
* 或提高“短期≤”门槛的严苛度(20→15)
* 或把长期周期加长(21→34)
* 信号太少:
* 放宽阈值(长期 80→75、短期 20→25)
* 或缩短长期周期(21→13)
调参务必结合你常交易的品种波动特征,建议在同一市场同一类标的上做一致性回测/复盘。
---
## 免责声明
本脚本仅用于教育与研究目的,展示一种技术分析可视化方法,不构成任何形式的投资建议、交易建议或收益承诺。市场有风险,交易需谨慎。使用者应基于自身风险承受能力独立决策,并对交易结果自行负责。作者不对任何因使用本脚本导致的直接或间接损失承担责任。
---
## 致谢与来源
* **策略/思路来源**:B站 UP 主 **z哥** 的相关分享与讲解。
* **实现说明**:本脚本为 TradingView(Pine Script)版本的复现与可视化实现,便于在 TradingView 环境中使用与研究。
* 如原作者对公开引用有额外要求,请以原作者说明为准;若有侵权或需要修改归因方式,请联系我调整/下架相关描述。
下面给你补齐一份**英文版(可直接用于 TradingView 发布页)**,并与中文版结构对齐,符合社区常见写法(Overview / How it works / How to use / Inputs / Risk / Credits)。
---
## Title
**Needle Below 20 (Sub-chart) — TDX Style Recreation**
## Overview
This indicator is an auxiliary tool designed to spot **sharp short-term pullbacks (shakeouts) within a strong mid-term regime**, and to highlight **extreme oversold “panic” zones**. It is best used as a **candidate filter and timing aid** inside a broader trend-following framework, rather than as a standalone buy/sell signal.
## How it works
The script plots two normalized strength lines (stochastic-style normalization over a lookback window):
* **Short-term line (default: 3 bars)**
Captures fast sentiment cooling and short-term compression (high sensitivity).
* **Long-term line (default: 21 bars)**
Represents the mid-cycle regime strength, used as a context filter.
It also provides two stick/column signals:
1. **Double-Line Near-Zero (Red stick)**
Triggered when **Short-term ≤ 6 AND Long-term ≤ 6** (defaults).
This typically represents an **extreme oversold / capitulation-like** window, often used to monitor potential technical rebounds (confirmation recommended).
2. **Needle Below 20 (Yellow stick)**
Triggered when **Short-term ≤ 20 AND Long-term ≥ 80** (defaults).
This is commonly interpreted as a **strong regime intact + sudden short-term dump/pullback**, useful for spotting potential **trend pullback re-entry candidates**.
Reference levels **80/20** are drawn for quick zone reading.
### How to use (recommended workflow)
1. **Define the regime first (strongly recommended)**
This indicator does not decide whether a market is tradable. Use a trend/structure filter, for example:
* Price above a medium/long MA (e.g., MA50/MA200), or your own trend model
* Structure not broken (support holds, pullback into a valid support zone)
2. **Treat signals as “watchlist triggers,” not instant entries**
* **Yellow stick (Needle Below 20):**
After it prints, look for confirmation such as:
* A hold/reclaim of a key level (prior high, trendline, range top retest, etc.)
* A reversal candle or continuation confirmation
* Constructive volume/price behavior (e.g., pullback on lighter volume, rebound with demand)
* **Red stick (Double-Line Near-Zero):**
Best viewed as an **extreme sentiment/oversold marker**. Avoid blind bottom-fishing; combine with structure stabilization and broader market context.
## Risk management (examples, not financial advice)
* **Entry trigger (example):** scale in after confirmation rather than buying the first signal
* **Stop reference (example):** below the key support / prior swing low / structural invalidation level
* **Position sizing principle:** size positions based on stop distance; larger stop = smaller size
## Inputs / Parameters
* **Lookbacks (3 / 21):**
* 3 bars: short-term sensitivity for fast pullback detection
* 21 bars: mid-cycle regime context (roughly one trading month)
Suggested adjustments:
* Shorter-term trading: try **2–5** (short) and **13–34** (long)
* Longer swing trading: try **5–8** (short) and **34–55** (long)
* **Thresholds (6 / 20 / 80):**
* 6: “extreme” zone for near-zero panic marker
* 20/80: classic zone thresholds for low/high regime separation
If signals are too frequent:
* tighten thresholds (e.g., long ≥ 80 → 85, short ≤ 20 → 15), or lengthen long lookback (21 → 34)
If signals are too rare:
* loosen thresholds (e.g., long ≥ 80 → 75, short ≤ 20 → 25), or shorten long lookback (21 → 13)
## Disclaimer
This script is provided for **educational and research purposes only**. It does **not** constitute financial advice, investment recommendations, or any guarantee of performance. Trading involves risk. You are solely responsible for your decisions and outcomes.
## Credits / Attribution
* **Concept origin:** Inspired by the Bilibili creator **“z哥”**.
* **Implementation:** This is a TradingView (Pine Script) recreation for visualization and study.
If the original creator has specific attribution requirements, please follow the creator’s instructions. If any changes are needed, attribution text can be updated accordingly.
## Citation snippet
> Concept inspired by Bilibili creator “z哥”. Pine Script recreation for educational/research use.

Pi Cycle Top RatioPast cycles show a top prediction within a few days of the top when 111DMA crosses the 350DMA*2 (Pi Cycle top indicator).
Each cycle the 2 ratios have crossed less and for shorter periods of time. In 2021 the 2 averages hardly even crossed each other. It is likely the moving averages will not cross this cycle.
This can be seen more clearly if the two moving averages are divided by each other to give a visual ratio, when this is done you can clearly see the diminishing peaks. A trendline can then be applied across these peaks to account for the decaying signal. When the upper trend is hit this would be indicative of a potential peak. Interestingly, this ratio also represents bottoms consistently across each cycle, when the ratio has gone below 0.35 these matches with BTC lows.
