Fibonacci TrendlinesCOINBASE:ETHUSD
This indicator is bested with the 4 hour time frame.
This indicator shows 4 EMA trendlines based on the Fibonacci Sequence (8, 13, 21, 55). If the 8, 13, 21 trendlines crosses above the 55 and the volume is high, this is an indication for a long position. If the 8, 13, 21 crosses below the 55 (volume doesn't matter), this is an indication to exit the long position or an indication for a short position.
在腳本中搜尋"trendline"

Tori TrendlinesBasic script to plot trendlines according to the basic rules following Tori Trades strategy. This is a work in progress so please let me know if you find any issues with this.

Tori's Trendline Strategy with sugested stop loss and tp levels this will draw its own trendlines looks for consolidation and determines which pressure is building up inside the consolidation to minimize fake outs. also suggests long and short entries along with sl and tp levels. if you want to see the chart more clear shut off the long and short entry suggestions in the settings .

Click Draw TrendLine [UhoKang] v2
This is an indicator that directly draws a trend line by clicking on the candle.
Click to Create Trend lines !!
Create a trend line by connecting A, B, and C with three vertices.
1. Draw Bear Trend line
Click pivot high : First pivothigh of the downtrend line
Click pivot low : pivotlow of the downtrend line
Click pivot high : Second pivothigh of the downtrend line
2. Draw Bull Trend line
Click pivot low : First pivotlow of the uptrend line
Click pivot high : pivothigh of the uptrend line
Click pivot low : Second pivotlow of the uptrend line
Modefiy Trendlines
1. Edit Bear Trend line
Drag Red , ,
2. Edit Bull Trend line
Drag Green , ,

Support & Resistance Trendlines with PP + Fib. Channel█ Support & Resistance Trendlines with Pivot Points + Fibonacci Channel
This script automatically draw support and resistance trend lines based on pivot points and add a fibonacci channel.
It will show potential patterns with the help of support and resistance lines as well as breakout target and pullback entry with the fibonacci extension and retracement levels.
It is based on atolelole's script, I only made it more configurable so please check out his script.
I added the possibility to change values and add additional retracement and extension levels.
I also made it customizable with the possibility to change lines color, width and style.

[PX] Level & TrendlinesThe indicator identifies the intermediate fractal pattern, where neighboring fractals are either higher or lower. It plots horizontal level and trendlines based on those fractals and comes with a variety of settings.
If you are looking for someone to develop your on indicator or trading strategy, don't hesitate to get in touch with me here on TradingView or below.
Contact:
www.pascal-simon.de
info@pascal-simon.de

Fibonacci Trendlines 8-200In my opinion best EMA Trendlines there is, simple yet very reliable on any time frame, i found the version that had 8-13-21-55, so i decided to add 100 and 200 for higher time frames enjoy please share and like

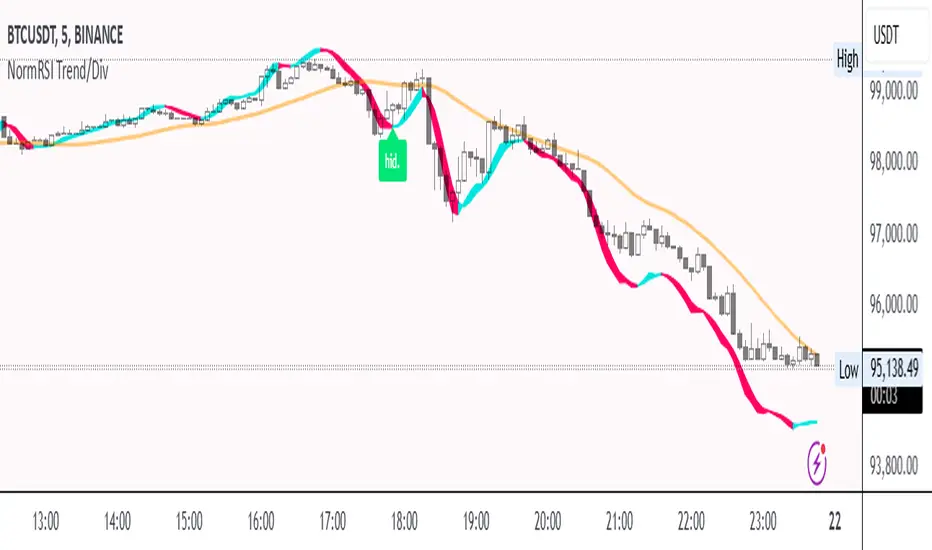
Normalized RSI Trendline with DivergencesNormalized RSI Trendline with Divergences
🔹 Overview
The Normalized RSI Trendline with Divergences indicator enhances traditional RSI analysis by normalizing RSI values within a defined range and applying a trend-following approach. It also detects bullish and bearish divergences to highlight potential trend reversals.
🔹 Features
✔ Normalized RSI Calculation – The RSI values are normalized between -1 and 1 to provide a clearer representation of market momentum.
✔ Trend & Center Lines – A trendline based on linear regression and an adaptive moving average (ALMA) for smoother trend visualization.
✔ Divergence Detection – Identifies regular and hidden divergences, displaying signals directly on the chart.
✔ Customizable Parameters – Users can adjust the signal period, lookback range, trend length, and divergence sensitivity to fit different trading strategies.
🔹 How to Use
Trend Following: The trendline helps identify the overall market direction.
Divergence Signals:
🟢 Bullish Divergence (Potential upward reversal)
🔴 Bearish Divergence (Potential downward reversal)
🟩 Hidden Bullish Divergence (Trend continuation signal)
🟧 Hidden Bearish Divergence (Trend continuation signal)
This script is suitable for trend traders, swing traders, and divergence-based strategies. Customize the settings to match your preferred trading style. 🚀
📌 Disclaimer: This script is for educational purposes only and does not constitute financial advice. Always conduct your own analysis before making trading decisions.
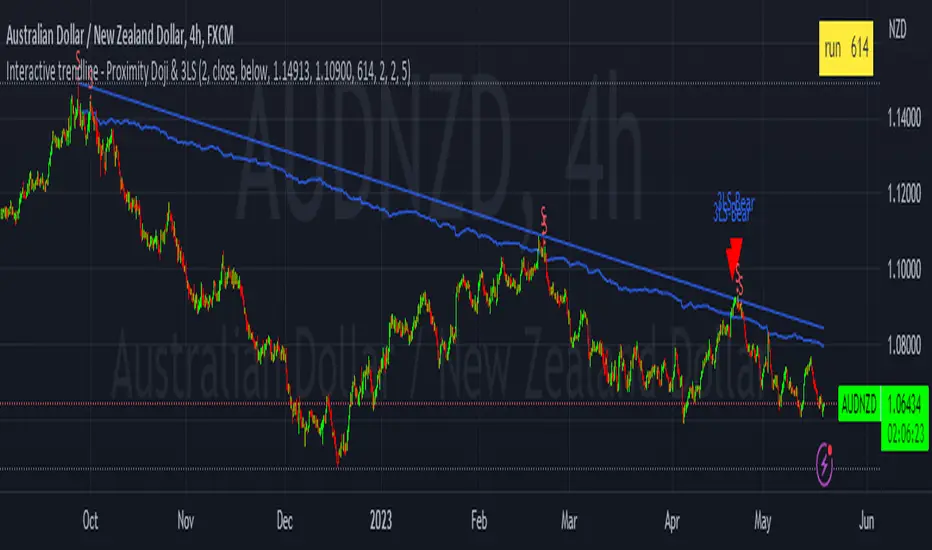
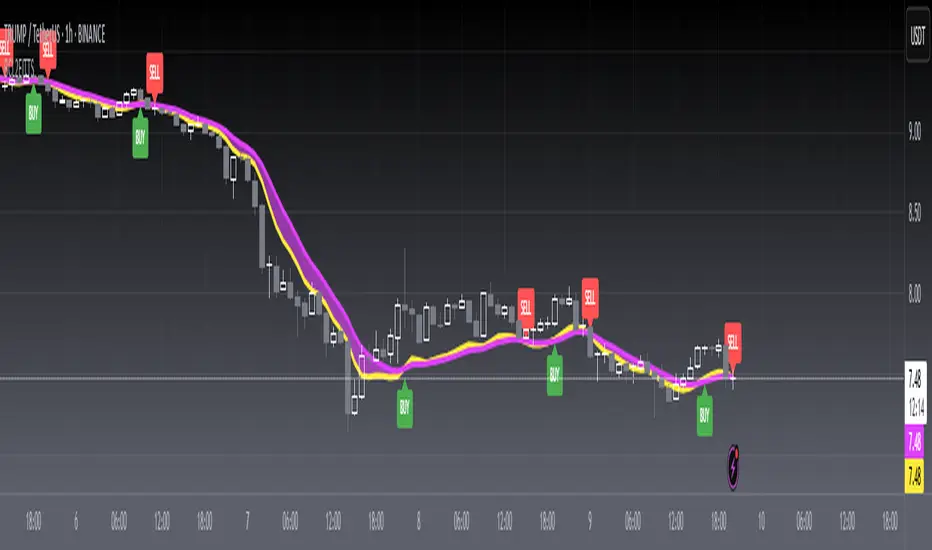
Interactive trendline - Proximity Doji & 3LSThis script was developed with Blockhead305 (seriously talented) and uses 1) the Three Line Strike from The Moving Average as well as 2) an original doji script written for me and 3) the Interactive Trendline as developed by Blockhead305. The basic premise is that should a doji or Three Line Strike occur within a customizable ATR distance from your trendline, an on-chart notification will appear or you could set an alarm to warn you if this has happened.
How to set this up:
Step 1 - Find a a trend
Step 2 - Identify the candles that touches the trendline
Step 3 - Click on the indicator
Step 4 - Set the X1 and Y1 coordinates for the start of the trend
Step 5 - Set the X2 and Y2 coordinates for the last relevant candle of the trend
Step 6 - Write the number in the yellow box down (in this case 880)
Step 7 - Open the settings of the indicator
Enter the number from the yellow box into the box titled "Run" - Press "OK"
Step 8 - Chart should/could now show Buy/Sell Signals for the Dojis and/or Bullish or Bearish Three Line Strikes
Notes
1. If your trendline is bearish (X1/Y1 is higher than X2/Y2) only bearish signals will appear and vice versa
2. You can change the ATR multiples from trendline in the settings - I prefer 2 (which is also the default)
3. You can toggle Big Engulfing and/or Three Line Strike on or off (exact functionality as per The Moving Average functionality)
4. You can construct the type of doji you would like to see at the bottom of the settings screen - I prefer the following settings:
Dominant Wick Multiple - 2
Recessive Wick Multiple - 2
Body Multiple - 5
5. I place my SL above last high (shorts) or last low (longs) but could also use the trendline for this
6. I use TP with RRR off 1:2 but much more is obviously possible.
7. ONLY ONE INTERACTIVE TRENDLINE CAN BE USED ON THE SAME CHART
8. THE NUMBER IN THE YELLOW BOX IS RELEVANT TO THE TIMEFRAME THAT THE TRENDLINE WAS CREATED ON. IF YOU CHANGE
TIMEFRAMES IT WILL NOT WORK
Happy to receive constructive criticism and/or suggestions for improvements on the settings.
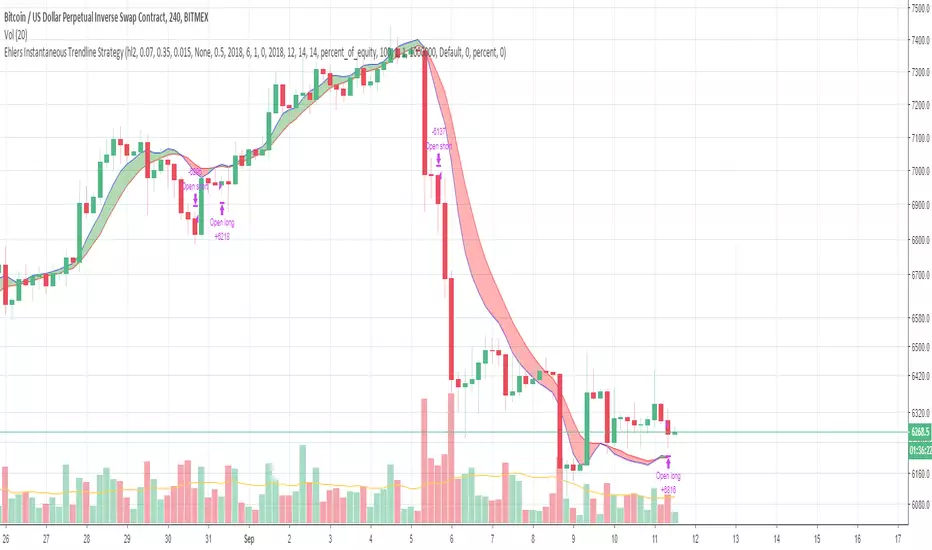
[blackcat] L2 Ehlers Instantaneous TrendlineLevel: 2
Background
John F. Ehlers introuced Instantaneous Trendline (IT) in his "Rocket Science for Traders" chapter 10. Dr. Ehlers hope IT can enable us to compute a continuous trendline from which we can rapidly assess market action.
Function
blackcat L2 Ehlers Instantaneous Trendline (IT) is used to follow trend. IT is important because the dominant cycle component is always notched out. It follows that if the composite analytic waveform consists of only a trend component and a cycle component, and if we remove the cycle component, the residual must be the trend. Of course, this is not precisely true in reality, because there will always be components other than the dominant cycle present. However, this is a workable solution for trading purposes because the secondary cycles usually have a small amplitude.
Key Signal
Smooth --> 4 bar WMA w/ 1 bar lag
Detrender --> The amplitude response of a minimum-length HT can be improved by adjusting the filter coefficients by
trial and error. HT does not allow DC component at zero frequency for transformation. So, Detrender is used to remove DC component/ trend component.
Q1 --> Quadrature phase signal
I1 --> In-phase signal
Period --> Dominant Cycle in bars
SmoothPeriod --> Period with complex averaging
DCPeriod ---> Dominant Cycle Period
Trendline ---> IT fast line
SmoothPrice ---> IT slow line
Pros and Cons
100% John F. Ehlers definition translation of original work, even variable names are the same. This help readers who would like to use pine to read his book. If you had read his works, then you will be quite familiar with my code style.
Remarks
The 9th script for Blackcat1402 John F. Ehlers Week publication.
Readme
In real life, I am a prolific inventor. I have successfully applied for more than 60 international and regional patents in the past 12 years. But in the past two years or so, I have tried to transfer my creativity to the development of trading strategies. Tradingview is the ideal platform for me. I am selecting and contributing some of the hundreds of scripts to publish in Tradingview community. Welcome everyone to interact with me to discuss these interesting pine scripts.
The scripts posted are categorized into 5 levels according to my efforts or manhours put into these works.
Level 1 : interesting script snippets or distinctive improvement from classic indicators or strategy. Level 1 scripts can usually appear in more complex indicators as a function module or element.
Level 2 : composite indicator/strategy. By selecting or combining several independent or dependent functions or sub indicators in proper way, the composite script exhibits a resonance phenomenon which can filter out noise or fake trading signal to enhance trading confidence level.
Level 3 : comprehensive indicator/strategy. They are simple trading systems based on my strategies. They are commonly containing several or all of entry signal, close signal, stop loss, take profit, re-entry, risk management, and position sizing techniques. Even some interesting fundamental and mass psychological aspects are incorporated.
Level 4 : script snippets or functions that do not disclose source code. Interesting element that can reveal market laws and work as raw material for indicators and strategies. If you find Level 1~2 scripts are helpful, Level 4 is a private version that took me far more efforts to develop.
Level 5 : indicator/strategy that do not disclose source code. private version of Level 3 script with my accumulated script processing skills or a large number of custom functions. I had a private function library built in past two years. Level 5 scripts use many of them to achieve private trading strategy.

High-Probability Trendline (Breakout & Retest)High-Probability Trendline (Breakout & Retest) trend breakout and retest

Mirror Trendline ToolThis indicator is an interactive mirror‑trendline drawing tool that uses three draggable points to build two related lines. Point One and Point Two define the primary (blue) trendline; Point Three defines the starting anchor for the mirrored line, which always has the opposite slope to the blue line and updates live as you move the anchor, giving continuous visual feedback while you drag it .
A color‑invert option automatically generates the mirrored line’s color by mathematically inverting the chosen base color while preserving its opacity, with a checkbox to disable inversion so both lines can share the same appearance . When “Stop at Intersection” is checked, both lines terminate exactly at their intersection, creating a clean V‑shaped construction that highlights the symmetry point between the reference move and its mirror . When the box is unchecked, both lines extend beyond that intersection, but their total duration is capped at no more than twice the original blue segment’s length, keeping projections proportionate and preventing excessively long rays from cluttering the chart .


Auto-Fit Growth Trendline# **Theoretical Algorithmic Principles of the Auto-Fit Growth Trendline (AFGT)**
## **🎯 What Does This Algorithm Do?**
The Auto-Fit Growth Trendline is an advanced technical analysis system that **automates the identification of long-term growth trends** and **projects future price levels** based on historical cyclical patterns.
### **Primary Functionality:**
- **Automatically detects** the most significant lows in regular periods (monthly, quarterly, semi-annually, annually)
- **Constructs a dynamic trendline** that connects these historical lows
- **Projects the trend into the future** with high mathematical precision
- **Generates Fibonacci bands** that act as dynamic support and resistance levels
- **Automatically adapts** to different timeframes and market conditions
### **Strategic Purpose:**
The algorithm is designed to identify **fundamental value zones** where price has historically found support, enabling traders to:
- Identify optimal entry points for long positions
- Establish realistic price targets based on mathematical projections
- Recognize dynamic support and resistance levels
- Anticipate long-term price movements
---
## **🧮 Core Mathematical Foundations**
### **Adaptive Temporal Segmentation Theory**
The algorithm is based on **dynamic temporal partition theory**, where time is divided into mathematically coherent uniform intervals. It uses modular transformations to create bijective mappings between continuous timestamps and discrete periods, ensuring each temporal point belongs uniquely to a specific period.
**What does this achieve?** It allows the algorithm to automatically identify natural market cycles (annual, quarterly, etc.) without manual intervention, adapting to the inherent periodicity of each asset.
The temporal mapping function implements a **discrete affine transformation** that normalizes different frequencies (monthly, quarterly, semi-annual, annual) to a space of unique identifiers, enabling consistent cross-temporal comparative analysis.
---
## **📊 Local Extrema Detection Theory**
### **Multi-Point Retrospective Validation Principle**
Local minima detection is founded on **relative extrema theory with sliding window**. Instead of using a simple minimum finder, it implements a cross-validation system that examines the persistence of the extremum across multiple historical periods.
**What problem does this solve?** It eliminates false minima caused by temporal volatility, identifying only those points that represent true historical support levels with statistical significance.
This approach is based on the **statistical confirmation principle**, where a minimum is only considered valid if it maintains its extremum condition during a defined observation period, significantly reducing false positives caused by transitory volatility.
---
## **🔬 Robust Interpolation Theory with Outlier Control**
### **Contextual Adaptive Interpolation Model**
The mathematical core uses **piecewise linear interpolation with adaptive outlier correction**. The key innovation lies in implementing a **contextual anomaly detector** that identifies not only absolute extreme values, but relative deviations to the local context.
**Why is this important?** Financial markets contain extreme events (crashes, bubbles) that can distort projections. This system identifies and appropriately weights them without completely eliminating them, preserving directional information while attenuating distortions.
### **Implicit Bayesian Smoothing Algorithm**
When an outlier is detected (deviation >300% of local average), the system applies a **simplified Kalman filter** that combines the current observation with a local trend estimation, using a weight factor that preserves directional information while attenuating extreme fluctuations.
---
## **📈 Stabilized Extrapolation Theory**
### **Exponential Growth Model with Dampening**
Extrapolation is based on a **modified exponential growth model with progressive dampening**. It uses multiple historical points to calculate local growth ratios, implements statistical filtering to eliminate outliers, and applies a dampening factor that increases with extrapolation distance.
**What advantage does this offer?** Long-term projections in finance tend to be exponentially unrealistic. This system maintains short-to-medium term accuracy while converging toward realistic long-term projections, avoiding the typical "exponential explosions" of other methods.
### **Asymptotic Convergence Principle**
For long-term projections, the algorithm implements **controlled asymptotic convergence**, where growth ratios gradually converge toward pre-established limits, avoiding unrealistic exponential projections while preserving short-to-medium term accuracy.
---
## **🌟 Dynamic Fibonacci Projection Theory**
### **Continuous Proportional Scaling Model**
Fibonacci bands are constructed through **uniform proportional scaling** of the base curve, where each level represents a linear transformation of the main curve by a constant factor derived from the Fibonacci sequence.
**What is its practical utility?** It provides dynamic resistance and support levels that move with the trend, offering price targets and profit-taking points that automatically adapt to market evolution.
### **Topological Preservation Principle**
The system maintains the **topological properties** of the base curve in all Fibonacci projections, ensuring that spatial and temporal relationships are consistently preserved across all resistance/support levels.
---
## **⚡ Adaptive Computational Optimization**
### **Multi-Scale Resolution Theory**
It implements **automatic multi-resolution analysis** where data granularity is dynamically adjusted according to the analysis timeframe. It uses the **adaptive Nyquist principle** to optimize the signal-to-noise ratio according to the temporal observation scale.
**Why is this necessary?** Different timeframes require different levels of detail. A 1-minute chart needs more granularity than a monthly one. This system automatically optimizes resolution for each case.
### **Adaptive Density Algorithm**
Calculation point density is optimized through **adaptive sampling theory**, where calculation frequency is adjusted according to local trend curvature and analysis timeframe, balancing visual precision with computational efficiency.
---
## **🛡️ Robustness and Fault Tolerance**
### **Graceful Degradation Theory**
The system implements **multi-level graceful degradation**, where under error conditions or insufficient data, the algorithm progressively falls back to simpler but reliable methods, maintaining basic functionality under any condition.
**What does this guarantee?** That the indicator functions consistently even with incomplete data, new symbols with limited history, or extreme market conditions.
### **State Consistency Principle**
It uses **mathematical invariants** to guarantee that the algorithm's internal state remains consistent between executions, implementing consistency checks that validate data structure integrity in each iteration.
---
## **🔍 Key Theoretical Innovations**
### **A. Contextual vs. Absolute Outlier Detection**
It revolutionizes traditional outlier detection by considering not only the absolute magnitude of deviations, but their relative significance within the local context of the time series.
**Practical impact:** It distinguishes between legitimate market movements and technical anomalies, preserving important events like breakouts while filtering noise.
### **B. Extrapolation with Weighted Historical Memory**
It implements a memory system that weights different historical periods according to their relevance for current prediction, creating projections more adaptable to market regime changes.
**Competitive advantage:** It automatically adapts to fundamental changes in asset dynamics without requiring manual recalibration.
### **C. Automatic Multi-Timeframe Adaptation**
It develops an automatic temporal resolution selection system that optimizes signal extraction according to the intrinsic characteristics of the analysis timeframe.
**Result:** A single indicator that functions optimally from 1-minute to monthly charts without manual adjustments.
### **D. Intelligent Asymptotic Convergence**
It introduces the concept of controlled asymptotic convergence in financial extrapolations, where long-term projections converge toward realistic limits based on historical fundamentals.
**Added value:** Mathematically sound long-term projections that avoid the unrealistic extremes typical of other extrapolation methods.
---
## **📊 Complexity and Scalability Theory**
### **Optimized Linear Complexity Model**
The algorithm maintains **linear computational complexity** O(n) in the number of historical data points, guaranteeing scalability for extensive time series analysis without performance degradation.
### **Temporal Locality Principle**
It implements **temporal locality**, where the most expensive operations are concentrated in the most relevant temporal regions (recent periods and near projections), optimizing computational resource usage.
---
## **🎯 Convergence and Stability**
### **Probabilistic Convergence Theory**
The system guarantees **probabilistic convergence** toward the real underlying trend, where projection accuracy increases with the amount of available historical data, following **law of large numbers** principles.
**Practical implication:** The more history an asset has, the more accurate the algorithm's projections will be.
### **Guaranteed Numerical Stability**
It implements **intrinsic numerical stability** through the use of robust floating-point arithmetic and validations that prevent overflow, underflow, and numerical error propagation.
**Result:** Reliable operation even with extreme-priced assets (from satoshis to thousand-dollar stocks).
---
## **💼 Comprehensive Practical Application**
**The algorithm functions as a "financial GPS"** that:
1. **Identifies where we've been** (significant historical lows)
2. **Determines where we are** (current position relative to the trend)
3. **Projects where we're going** (future trend with specific price levels)
4. **Provides alternative routes** (Fibonacci bands as alternative targets)
This theoretical framework represents an innovative synthesis of time series analysis, approximation theory, and computational optimization, specifically designed for long-term financial trend analysis with robust and mathematically grounded projections.

Reverse Ehler Instantaneous Trendline - TraderHalaiThis script uses a reverse function of the famous Ehler Instantaneous Trendline to calculate the source price required in order to change from Bullish to bearish
From my analysis, the reverse price does appear to be rather choppy, though it is 100% accurate. This is because Ehler's Instantaneous Trendline tends to remain trending for longer periods of time with above average hold periods.
The main suitability for this would be higher level timeframes, such as Weekly, 5 daily, 3 daily. From my findings Smoothed Heikin Ashi Trend, tends to provide better risk-adjusted returns across most timeframes (Higher return to drawdown ratio)
As I have spent a bit of time getting the reverse function mathematics to work, I decided to publish this as open source for the benefit, scrutiny and for further development by the TradingView community anyways.
Enjoy!

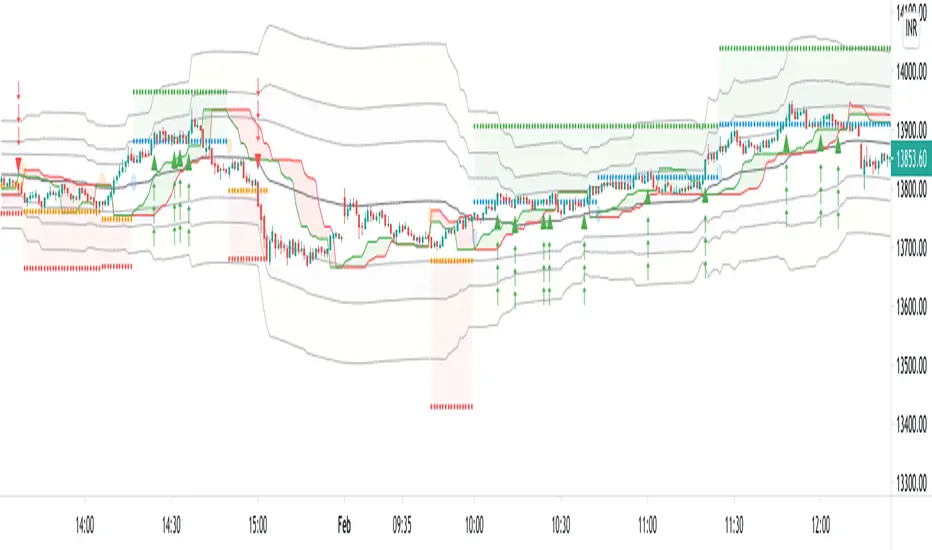
FibBand, Perfect Trendline Trader and Target SystemSo, Dear Friends, I am open-sourcing one of my scripts which I created as a thesis project,
The Auto Trader System is a Scalping Tool , to be used mostly in intraday Setups!!
and is designed using,
1. Fibonacci Bands
Fibo Bands are Calculated by defining dynamic Fibonacci Pivots Lines over a history of Lookup values (Default is 89 periods lookback),
The bands help in identifying the Target Points for the setup
2. Perfect TrendLine Setup
The script uses PTS, as a filter to define the optimum entry and exit points
Which timeframe it works for ?
Works for Any Time Frame, but Intraday setups are good!
Who is this System for ?
Beginner and Intermediate Traders
Provision For Alerts
The Script has provision for both long and short alerts!!
Enjoy!
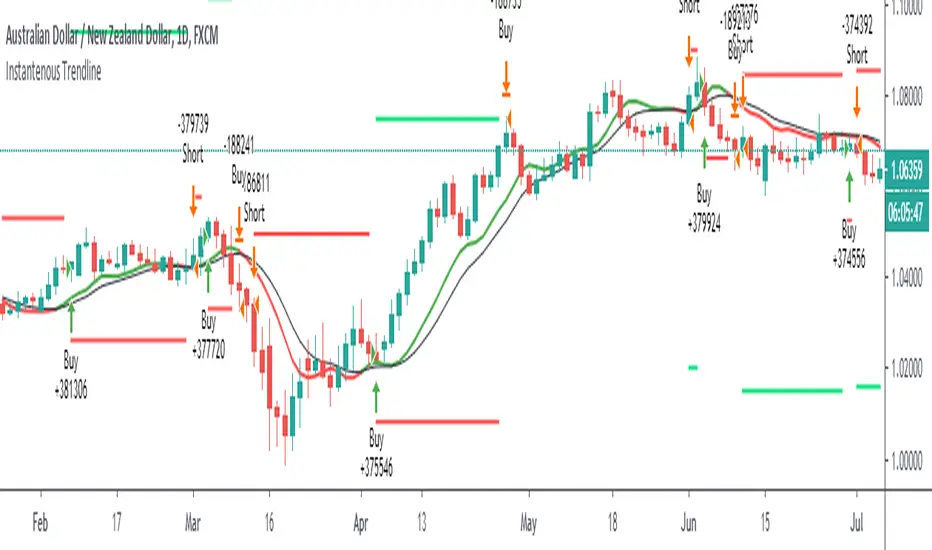
[blackcat] L2 Ehlers Instantaneous Trendline Trading StrategyLevel: 2
Background
John F. Ehlers introuced Instantaneous Trendline Trading Strategy in his "Cybernetic Analysis for Stocks and Futures" chapter 3 on 2004.
Function
With the crossover strategy that Dr. Ehlers has developed it is possible to be on the wrong side of the trade for a substantial period from time to time. For this reason, Dr. Ehlers has added a rule that if the price goes against your position by more than some percentage, the strategy will correct itself and automatically reverse to the opposite position. The percentage is supplied as the input variable RevPct. RevPct is an optimizable parameter, but I find that the default
value of 1.5 percent (RevPct = 1.015) is a relatively robust number.
Key Signal
Trigger ---> Instantaneous Trendline fast line
ITrend ---> Instantaneous Trendline slow line
LimitBuy ---> limit buy price level which is triggered by gold cross
LimitSell ---> limit buy price level wich is triggered by dead cross
Pros and Cons
100% John F. Ehlers definition translation of original work, even variable names are the same. This help readers who would like to use pine to read his book. If you had read his works, then you will be quite familiar with my code style.
Remarks
The 23th script for Blackcat1402 John F. Ehlers Week publication.
Readme
In real life, I am a prolific inventor. I have successfully applied for more than 60 international and regional patents in the past 12 years. But in the past two years or so, I have tried to transfer my creativity to the development of trading strategies. Tradingview is the ideal platform for me. I am selecting and contributing some of the hundreds of scripts to publish in Tradingview community. Welcome everyone to interact with me to discuss these interesting pine scripts.
The scripts posted are categorized into 5 levels according to my efforts or manhours put into these works.
Level 1 : interesting script snippets or distinctive improvement from classic indicators or strategy. Level 1 scripts can usually appear in more complex indicators as a function module or element.
Level 2 : composite indicator/strategy. By selecting or combining several independent or dependent functions or sub indicators in proper way, the composite script exhibits a resonance phenomenon which can filter out noise or fake trading signal to enhance trading confidence level.
Level 3 : comprehensive indicator/strategy. They are simple trading systems based on my strategies. They are commonly containing several or all of entry signal, close signal, stop loss, take profit, re-entry, risk management, and position sizing techniques. Even some interesting fundamental and mass psychological aspects are incorporated.
Level 4 : script snippets or functions that do not disclose source code. Interesting element that can reveal market laws and work as raw material for indicators and strategies. If you find Level 1~2 scripts are helpful, Level 4 is a private version that took me far more efforts to develop.
Level 5 : indicator/strategy that do not disclose source code. private version of Level 3 script with my accumulated script processing skills or a large number of custom functions. I had a private function library built in past two years. Level 5 scripts use many of them to achieve private trading strategy.
Etlers Instantenous TrendlineThis script uses @cheatcountry script to calculate Ehlers Instantenous Trendline .
Backtest offers 3 capital management tools. One that will always calculate order size as initial capital/close, one that uses the same calculation but adds or substracts profit. The last one allows you to enter manually the size you want to trade.
Green and red horizontal lines are profit/stop values.
Ehlers Instantaneous Trendline V2 [CC]The Instantaneous Trendline was created by John Ehlers (Cybernetic Analysis For Stocks And Futures pg 24) and this is an updated version of his original Instantaneous Trendline that works much better in my opinion. Buy when the indicator line turns green and sell when it turns red.
Let me know what other scripts you would like to see me publish or if you want something custom done!

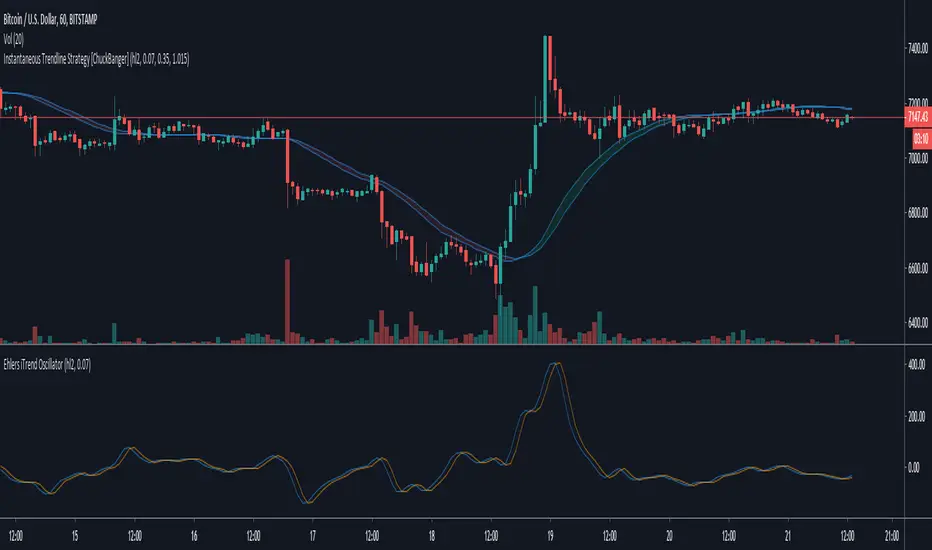
Instantaneous Trendline Strategy [ChuckBanger]Based on Instantaneous Trendline, by John Ehlers , identifies the market trend by doing removing cycle component. I think, this simplicity is what makes it attractive :) To understand Ehlers's thought process behind this, refer to the PDF linked below.
There are atleast 6 variations of this ITrend. This version is from his early presentations. You can find it here: www.mesasoftware.com
This is better then a regular MA cross over strategy
Low Latency Trendline[Geo]Low latency trendline is a better and faster indicator than MAs.
It lowes high frequency wave(noise) and echoes low frequency wave(main move trend).
You can find out trend faster and have more confidence to dicide than MA indicators.
Take your own risk to use this Indicator.
PS:
I found RMTA() to help coding.
Tradingview has a good recursive function method. And RMTA has a good licence:MIT licence. Thanks to you, Alex.

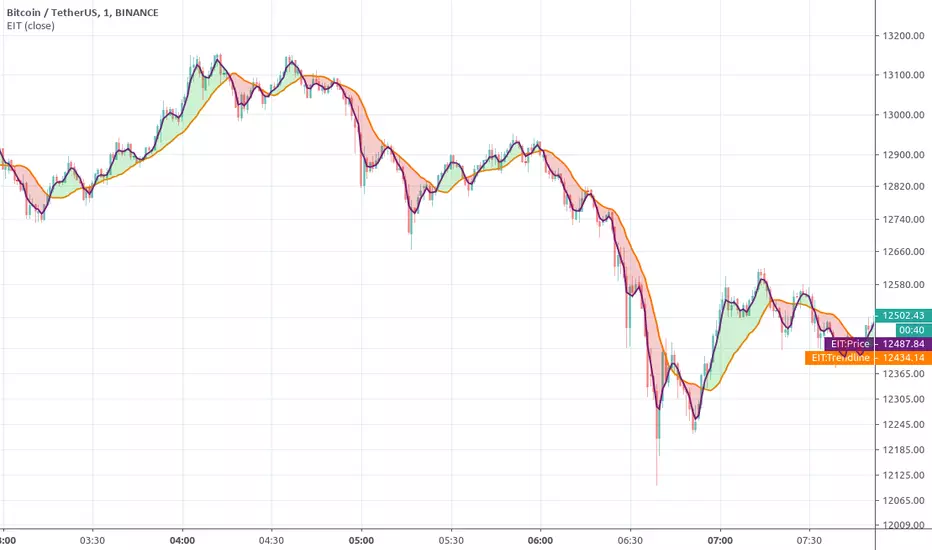
Ehlers Instantaneous TrendlineEhlers Instantaneous Trendline script.
This indicator was described by John F. Ehlers in his book "Rocket Science for Traders" (2001, Chapter 10: The Instantaneous Trendline).
Ehlers Instantaneous Trendline StrategyInstantaneous Trendline Strategy by John Ehlers from his book "Cybernetic Analysis for Stocks and Futures".
You can choose implementation of stop-loss. Don't forget to define correct spread for your instrument.