Cash VIX Term StructureThis script looks the dynamics of Cash VIX Term Structure, i.e. tickers VIX9D, VIX and VIX3M which look at how the markets are pricing volatility (implied) in the short and medium term, at any given point in time. In this script we look at 2 ratios - VIX9D/ VIX , and VIX / VIX3M , when these ratios are rising it indicates market is pricing more volatility in the short term relative to the future aka term structure flattening and subsequently a ratio > 1.0 indicates inversion. We plot EMA of VIX9D/ VIX and a fast + slow EMA for VIX / VIX3M to reduce the noise associated with daily trading ranges.
Interesting observations:
VIX / VIX3M near 1.0 indicates volatility overbought and 0.8 indicates volatility oversold.
VIX9D/ VIX tends to overshoot these ranges (0.8-1.0) due to extreme complacency or panic.
EMA crossovers in the daily chart of VIX / VIX3M might be used as an additional confirmation of volatility moving in a direction.
Feel free to use this indicator and comment, if any observations.
在腳本中搜尋"vix"

ETF→Symbol GEX & IM Mapper (EN)ETF→Symbol GEX & IM Mapper (EN) — Overview
🔎 Purpose
This indicator lets you paste a levels block (compact or long) with GEX walls, IM range, HVL and BS levels, then maps ETF-based prices to the current symbol using a live/fixed ratio (Diff). It draws lines and labels (color-coded), adds an optional HVL fill (green above / red below), and shows an InfoBox with Basis (CT/BW), optional VIX term structure, and an Auto GEX sign.
🧠 Why it’s useful
Quickly project SPY/QQQ/IWM/DIA levels onto futures, single stocks, or other symbols.
Keep levels consistent intraday with 09:30 NY rebase or manual rebase.
Visual context: Call/Put walls, IM range (+optional SDV bands), HVL, and BS levels, all in one view.
Key Features
ETF→Symbol mapping with live or frozen Diff (rebase at 09:30 NY or manual).
Two input formats:
Compact: price,name separated by ;
Long: natural language tokens separated by ,
GEX walls (L1 highlighted; extra GEX above/below price auto-colored).
IM range (Low/High) with optional SDV ±1/2/3σ bands.
HVL line + conditional fill (green/red) anchored to IM or GEX L1 (auto mode included).
BS levels from block (count configurable).
InfoBox: Basis (CT/BW), VIX state (Contango/Backwardation/Flat), GEX sign (Auto/Manual).
Labels: choose position, offsets, and text size.
Inputs You’ll Use Most
Data source
Use COMPACT block instead of LONG (toggle)
Block format: Auto / Long / Compact
Block text: paste your block (long or compact)
Block levels are in ETF (convert with Diff) (toggle)
Prefer 0DTE variants (toggle)
Extra GEX per side (besides L1)
Mapping / Rebase
Anchor: Rebase 09:30 NY / Manual rebase
Rebase now (+1 to execute)
Use ETF open (manual) and ETF open (manual, today)
Drift alert & threshold
Lines / Labels
Line length by: Bars / Days / Full
Label position: Left / Center / Right
Label offsets: bars / days
Label text size: Tiny / Small / Normal / Large / Huge
Styles
Colors, line widths, and styles for GEX / IM / HVL / SDV / BS
Environment
Basis (CT/BW) on/off, VIX on/off (VIX vs. VIX3M), GEX sign (Auto/Manual), InfoBox on/off
How to Use
Select ETF (SPY/QQQ/IWM/DIA) that corresponds to the levels you paste.
Paste your levels block (Compact or Long).
If your block prices are in the ETF, enable “Block levels are in ETF (convert with Diff)”.
Choose Rebase mode:
Rebase 09:30 NY: freezes Diff at RTH open.
Manual rebase: increment “Rebase now” to capture current Diff.
Tweak line span, label size/position, colors, SDV bands, HVL fill, etc.
(Optional) Enable VIX state and GEX sign = Auto to infer regime from VIX term/Basis/HVL.
Compact Block — Format & Example
Format:
Each item: price,name
Separate items with ;
Optional width tag: l1 / l2 / l3 (L1 is thickest)
Names you can use:
Call Wall, Put Wall, HVL, IM, GEX N, BS N
Examples of name variants recognized: Call Wall, Put Wall, HVL, IM, GEX 1, BS 3
Example (Compact):
455.0,Call Wall,l1; 448.0,Put Wall,l1; 451.2,HVL;
450.0,IM; 452.5,IM;
456.5,GEX 2; 447.2,GEX 3;
449.0,BS 1; 453.0,BS 2
Tip: If the Compact block is in ETF prices, toggle Block levels are in ETF (convert with Diff).
Long Block — Tokens & Example
Guidelines:
Separate tokens with ,.
The parser looks for keywords (EN/ES) and grabs the last number in that token.
Recognized tokens (English & Spanish):
Call Wall (L1): "call wall …", "call resistance …", "resistencia call …"
Put Wall (L1): "put wall …", "soporte put …"
0DTE variants: add "0dte" (e.g., "call wall 0dte 456"). If Prefer 0DTE is ON, 0DTE overrides standard.
HVL: "hvl …"
IM range: "1d min …", "1 d min …", "1d max …", "1 d max …"
GEX N: "gex N …"
BS N: "bs N …"
Example (Long):
Call Wall 0DTE 455, Put Wall 0DTE 448, HVL 451.2,
1d min 450, 1d max 452.5,
GEX 2 456.5, GEX 3 447.2,
BS 1 449, BS 2 453
Note: If your Long block is in ETF prices, enable Block levels are in ETF (convert with Diff).
Visual Conventions
Call Wall (L1): green line; Put Wall (L1): red line.
Extra GEX (above/below): auto-colored by side of current price; first extra = L2 (thicker), then L3.
IM Low / High: blue lines (with optional SDV bands).
HVL: blue line + fill (green above / red below) clipped to IM or GEX L1 span (per setting).
BS: gray lines.
Tips & Notes
Use Drift Alert to know when to rebase (e.g., after large intraday divergence).
Auto GEX sign can be based on VIX term (VIX3M vs VIX), Basis (CT/BW), or Price vs HVL.
Label text size controls label readability; adjust offsets to avoid overlaps.
If nothing draws, verify:
You pasted some block.
Block levels are in ETF toggle matches your block.
Token names match the formats above (case-insensitive).
Disclaimer
This is an educational tool for visualization. It does not constitute financial advice. Always do your own research and manage risk.

Triad Macro Gauge__________________________________________________________________________________
Introduction
__________________________________________________________________________________
The Triad Macro Gauge (TMG) is designed to provide traders with a comprehensive view of the macroeconomic environment impacting financial markets. By synthesizing three critical market signals— VIX (volatility) , Credit Spreads (credit risk) , and the Stocks/Bonds Ratio (SPY/TLT) —this indicator offers a probabilistic assessment of market sentiment, helping traders identify bullish or bearish macro conditions.
Holistic Macro Analysis: Combines three distinct macroeconomic indicators for multi-dimensional insights.
Customization & Flexibility: Adjust weights, thresholds, lookback periods, and visualization styles.
Visual Clarity: Dynamic table, color-coded plots, and anomaly markers for quick interpretation.
Fully Consistent Scores: Identical values across all timeframes (4H, daily, weekly).
Actionable Signals: Clear bull/bear thresholds and volatility spike detection.
Optimized for timeframes ranging from 4 hour to 1 week , the TMG equips swing traders and long-term investors with a robust tool to navigate macroeconomic trends.
__________________________________________________________________________________
Key Indicators
__________________________________________________________________________________
VIX (CBOE:VIX): Measures market volatility (negatively weighted for bearish signals).
Credit Spreads (FRED:BAMLH0A0HYM2EY): Tracks high-yield bond spreads (negatively weighted).
Stocks/Bonds Ratio (SPY/TLT): Evaluates equity sentiment relative to treasuries (positively weighted).
__________________________________________________________________________________
Originality and Purpose
__________________________________________________________________________________
The TMG stands out by combining VIX, Credit Spreads, and SPY/TLT into a single, cohesive indicator. Its unique strength lies in its fully consistent scores across all timeframes, a critical feature for multi-timeframe analysis.
Purpose: To empower traders with a clear, actionable tool to:
Assess macro conditions
Spot market extremes
Anticipate reversals
__________________________________________________________________________________
How It Works
__________________________________________________________________________________
VIX Z-Score: Measures volatility deviations (inverted for bearish signals).
Credit Z-Score: Tracks credit spread deviations (inverted for bearish signals).
Ratio Z-Score: Assesses SPY/TLT strength (positively weighted for bullish signals).
TMG Score: Weighted composite of z-scores (bullish > +0.30, bearish < -0.30).
Anomaly Detection: Identifies extreme volatility spikes (z-score > 3.0).
All calculations are performed using daily data, ensuring that scores remain consistent across all chart timeframes.
__________________________________________________________________________________
Visualization & Interpretation
__________________________________________________________________________________
The script visualizes data through:
A dynamic table displaying TMG Score , VIX Z, Credit Z, Ratio Z, and Anomaly status, with color gradients (green for positive, red for negative, gray for neutral/N/A).
A plotted TMG Score in Area, Histogram, or Line mode , with adaptive opacity for clarity.
Bull/Bear thresholds as horizontal lines (+0.30/-0.30) to signal market conditions.
Anomaly markers (orange circles) for volatility spikes.
Crossover signals (triangles) for bull/bear threshold crossings.
The table provides an immediate snapshot of macro conditions, while the plot offers a visual trend analysis. All values are consistent across timeframes, simplifying multi-timeframe analysis.
__________________________________________________________________________________
Script Parameters
__________________________________________________________________________________
Extensive customization options:
Symbol Selection: Customize VIX, Credit Spreads, SPY, TLT symbols
Core Parameters: Adjust lookback periods, weights, smoothing
Anomaly Detection: Enable/disable with custom thresholds
Visual Style: Choose display modes and colors
__________________________________________________________________________________
Conclusion
__________________________________________________________________________________
The Triad Macro Gauge by Ox_kali is a cutting-edge tool for analyzing macroeconomic trends. By integrating VIX, Credit Spreads, and SPY/TLT, TMG provides traders with a clear, consistent, and actionable gauge of market sentiment.
Recommended for: Swing traders and long-term investors seeking to navigate macro-driven markets.
__________________________________________________________________________________
Credit & Inspiration
__________________________________________________________________________________
Special thanks to Caleb Franzen for his pioneering work on macroeconomic indicator blends – his research directly inspired the core framework of this tool.
__________________________________________________________________________________
Notes & Disclaimer
__________________________________________________________________________________
This is the initial public release (v2.5.9). Future updates may include additional features based on user feedback.
Please note that the Triad Macro Gauge is not a guarantee of future market performance and should be used with proper risk management. Past performance is not indicative of future results.

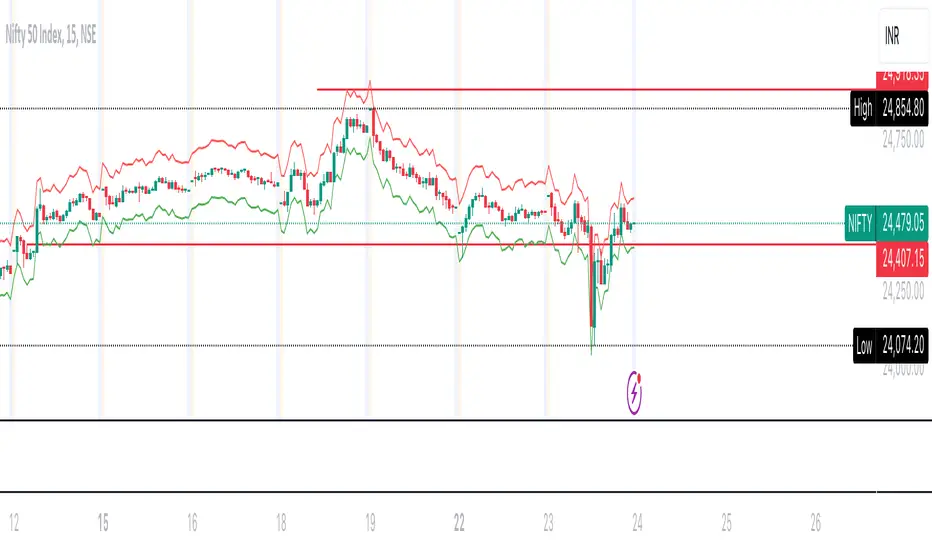
FalconRed VIXThe FalconRed Vix indicator is a trading tool designed to provide insights into the potential price range of the Nifty 50 index in India. It utilizes the IndiaVix value, which represents the annual percentage change of the Nifty 50 price. By analyzing the IndiaVix, the FalconRed Vix indicator helps traders determine the upper and lower price thresholds within which the Nifty 50 could potentially trend over the course of a year.
For example, if the Nifty 50 is currently at 18,500 and the IndiaVix is 10, it suggests that, at the given level of volatility, the Nifty 50 may experience price fluctuations of up to 10% in either direction over the course of a year. Consequently, the price range projected by the FalconRed Vix indicator would be between 16,650 and 20,350.
The indicator further extends its analysis to shorter time frames, including monthly, weekly, daily, hourly, 6-hour, 15-minute, 5-minute, and 1-minute intervals. By considering the Vix level, the FalconRed Vix indicator calculates the respective price ranges for these time frames.
When viewing the indicator on a chart, traders can observe a range band surrounding the current Nifty 50 price. The top line represents the upper threshold of the Nifty 50 price, while the bottom line represents the lower threshold, both based on the Vix level. This range band assists in determining potential selling points for out-of-the-money (OTM) options and aids in identifying entry or exit points for options and futures trading.
Traders can analyze the upper and lower threshold lines by drawing horizontal or trend lines, which can help identify potential breakouts or breakdowns. Furthermore, this analysis can assist in setting target prices and stop losses based on trend analysis.
It is important to note that the FalconRed Vix indicator is not a technical indicator used for determining stock buy or sell signals. Rather, it focuses on defining the potential price range based on the Vix level, which in turn aids in planning trading strategies such as short strangles, iron condors, and others.
Real VIXReal VIX is showing us what we can expect from the volatility index. When Real VIX is falling, that means that market volatility will fall and there will be good uptrend.
When Real VIX is rising, that means that volatility will rise, and you can expect huge market movements
This code calculates the "Real VIX" indicator, which is a measure of market volatility. It uses data from various sources, including the High Yield Corporate Bond Index (HYG), the US Dollar Index (DXY), and various US Treasury bond yields, as well as the USDCAD currency pair.
The formula for Real VIX is complex, but it essentially calculates the difference between the current value of the VIX (a commonly used measure of market volatility) and a smoothed version of the VIX. This difference is then plotted on a chart, with green indicating that the market is less volatile than the smoothed version of the VIX suggests, and red indicating that the market is more volatile than expected.
The code also includes a warning for when the Real VIX falls below zero, which suggests that a recession may be on the horizon.

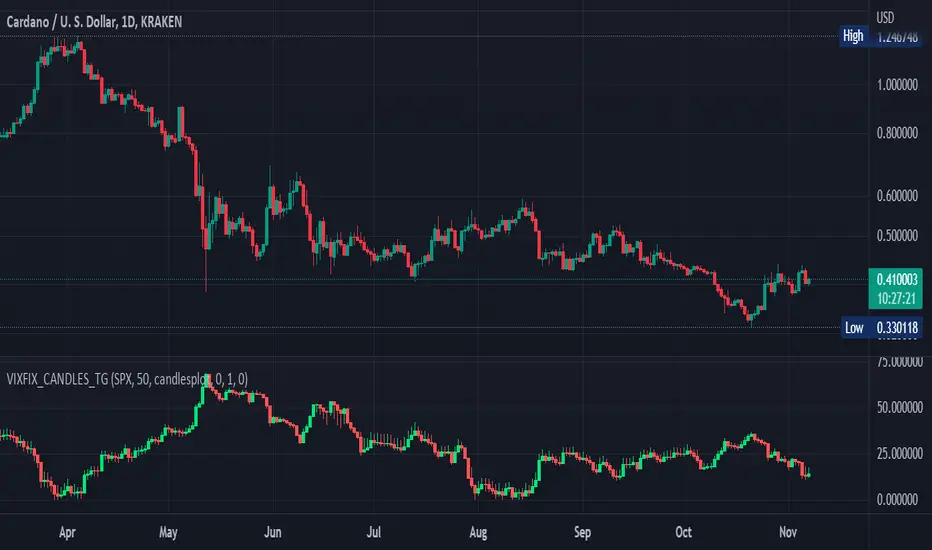
Williams Vix Fix OHLC candles plot indicator (Tartigradia)OHLC candles plot of the Williams VixFix indicator, which allows to draw trend lines.
Williams VixFix is a realized volatility indicator developed by Larry Williams, and can help in finding market bottoms.
Indeed, as Williams describe in his paper, markets tend to find the lowest prices during times of highest volatility, which usually accompany times of highest fear. The VixFix is calculated as how much the current low price statistically deviates from the maximum within a given look-back period.
The Williams VixFix indicator is usually presented as a curve or histogram. The novelty of this indicator is to present the data as a OHLC candles plot: whereas the original Williams VixFix calculation only involves the close value, we here use the open, high and low values as well. This led to some mathematical challenges because some of these calculations led to absurd values, so workarounds had to be found, but in the end I think the result was worth it, it reproduces the VIX chart quite well.
A great additional value of the OHLC chart is that it shows not just the close value, but all the values during the session: open, high and low in addition to close. This allows to draw trend lines and can provide additional information on momentum and sentiment. In addition, other indicators can be used on it, as if it was a price chart, such as RSI indicators (see RSI+ (alt) indicator for example).
For more information on the Vix Fix, which is a strategy published under public domain:
The VIX Fix, Larry Williams, Active Trader magazine, December 2007, web.archive.org
Fixing the VIX: An Indicator to Beat Fear, Amber Hestla-Barnhart, Journal of Technical Analysis, March 13, 2015, ssrn.com
Replicating the CBOE VIX using a synthetic volatility index trading algorithm, Dayne Cary and Gary van Vuuren, Cogent Economics & Finance, Volume 7, 2019, Issue 1, doi.org
This indicator includes only the Williams VixFix as an OHLC candles or bars plot, and price / vixfix candles plot, as well as the typical vixfix histogram. Indeed, it is much more practical for unbounded range indicators to be plotted in their own separate panel, hence why this indicator is released separately, so that it can work and be scaled adequately out of the box.
Note that the there are however no bottom buy signals. For a more complete indicator, which also includes the OHLC candles plots present here, but also bottom signals and Inverse VixFix (top signals), see:
Set Index symbol to SPX, and index_current = false, and timeframe Weekly, to reproduce the original VIX as close as possible by the VIXFIX (use the Add Symbol option, because you want to plot CBOE:VIX on the same timeframe as the current chart, which may include extended session / weekends). With the Weekly timeframe, off days / extended session days should not change much, but with lower timeframes this is important, because nights and weekends can change how the graph appears and seemingly make them different because of timing misalignment when in reality they are not when properly aligned.
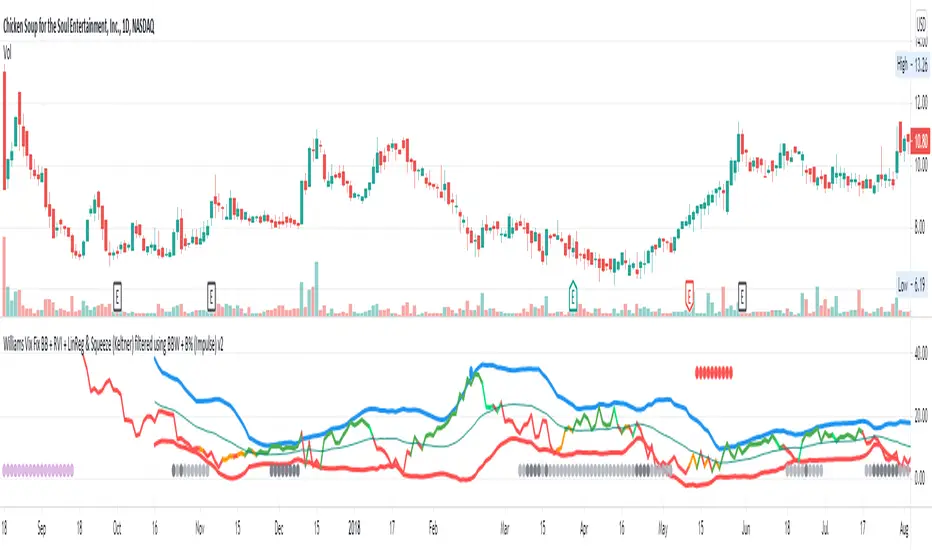
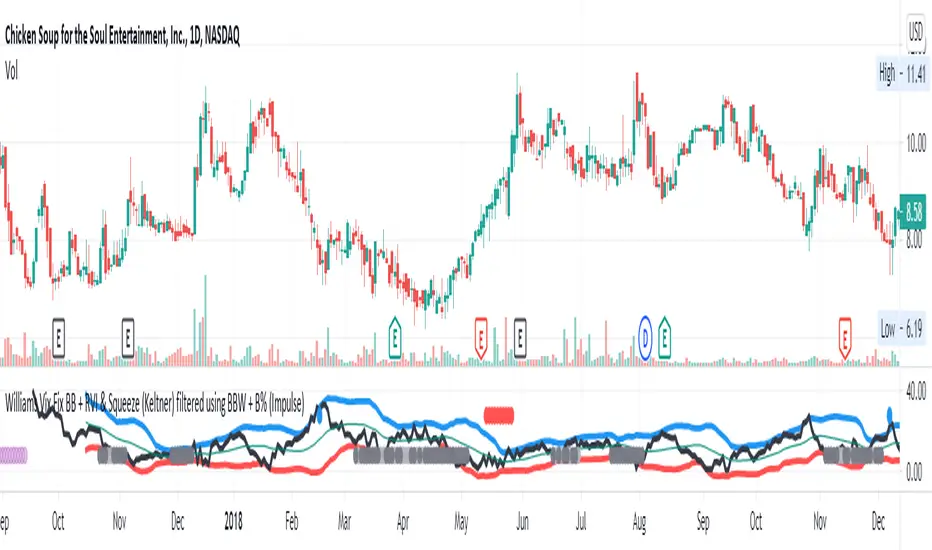
Williams Vix Fix BB + RVI + LinReg & Squeeze (Keltner) BBW + %BLegend:
Entery signal: When line color turns to lime (lighter green) after a blue dot appears
Exit signal: When line color turns to red (darker red) after a red dot appears
Note: it is more affective as an entry signal (Bottom is stronger)
- When line touches or crosses red band it is Top signal (Williams Vix Fix)
- When line touches or crosses blue band it is Bottom signal (Williams Vix Fix)
- Red dot at the top of indicator is a Top signal (Relative Volatility Index)
- Blue dot at the top of indicator is a Bottom signal (Relative Volatility Index)
- Gray dot at the bottom of indicator is a Keltner Squeeze signal (filtered by either BBW or %B)
- Silver dot at the bottom of indicator is a weaker Keltner Squeeze signal (Doesn't meet either BBW or %B filter)
- Purple is a 'Half Squeeze' only 1 Bollinger Band crossed the Keltner Channel
This is an attempt to make use of the main features of all 6 of these Volatility tools:
- Williams Vix Fix + Bollinger Bands
- Relative Volatility Index (RVI)
- Linear Regression (detects Vix Fix starts to rise or fall to a certain degree in order to help validate bottom/top)
Note : There is also added precision on Linear Regression entry by dividing WVF by square roots of basis.
- The crossing of Keltner Channel by the Bollinger Bands (Squeeze)
Conditions to Help Filter Keltner Squeeze:
- When the Bollinger Bands Width (BBW) value is lower than the lowest value within a period plus a margin of error (percentage)
- When the %B value goes up or down by the impulse value (threshold value in setting) detailed in LazyBears indicator. (www.tradingview.com)
If it meets one of these 2 filters and there is a Keltner Channel Squeeze than gray color or else if the squeeze doesn’t meet one of the 2 filters than silver color (weaker Squeeze).
The goal is to find the best tool to find bottoms and top relative to volatility and filter squeeze.
Note: You can also change the threshold for RVI top and bottom.
And this work builds on my last indicators:
- Williams Vix Fix + BB & RVI (Top/Bottom) & Squeeze ()
- Williams Vix Fix BB + RVI & Squeeze (Keltner) filtered BBW + %B ()
If you have ideas on this work or have ideas on potential combinations please message me, I always want to learn or get perspective on how it can be improved.
Sharing is how we get better (Parameter tuning, ideas, discussion)
I don’t reinvent the wheel, just trying to make the wheel better.
Combo Z ScoreObjective:
Can we use both VIX and MOVE relationships to indicate movement in the SPY? VIX (forward contract on SPY options) correlations are quite common as forward indicators however MOVE (forward contract on bonds) also provides a slightly different level of insight
Using the Z-Score of VIX vs VVIX and MOVE vs inverted VIX (there is no M of Move so we use inverted Vix as a proxy) we get some helpful indications of potential future moves. Added %B to give us some exposure to momentum. Toggle VIX or MOVE.
If anyone has a better idea of inverted Vix to proxy forward interest in MOVE let me know.

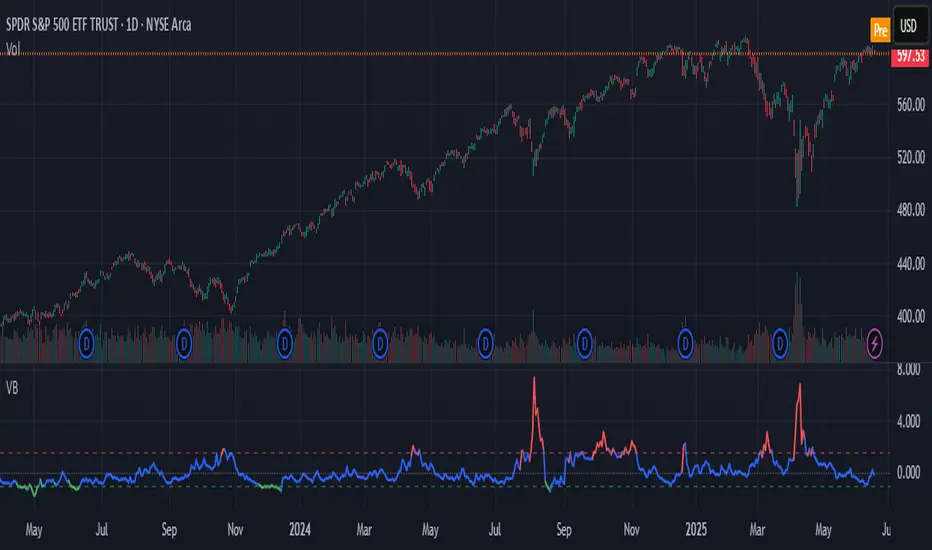
Volatility Barometer (VB)Volatility Barometer (VB)
The Volatility Barometer (VB) is a comprehensive market sentiment indicator designed to measure aggregate stress and fear in the equity market. It consolidates three critical volatility metrics into a single, easy-to-interpret score, providing a broader view of market conditions than any single metric alone.
Core Components
The barometer synthesizes information from:
VIX Index (VIX): The standard measure of implied 30-day stock market volatility.
VVIX Index (VVIX): The volatility of the VIX itself, often seen as the "volatility of volatility." High VVIX readings can signal uncertainty about the VIX's future path.
VIX Futures Term Structure (VX1!−VX2!): The spread between the front-month and second-month VIX futures. A positive spread (contango) is typical, while a negative spread (backwardation) often signals imminent market stress.
How It Works
To create a unified view, the indicator normalizes each of these three components using a Z-score. The Z-score measures how many standard deviations a value is from its historical mean over a user-defined period (defaulting to 252 days, or one trading year).
These three standardized Z-scores are then combined into a final VB Score using a weighted average. Users can customize these weights in the indicator's settings to emphasize the components they find most important.
How to Interpret
The VB Score is plotted as a single line that oscillates around a zero level, with its color changing to reflect the prevailing market regime:
High Stress (Red Line): When the score rises above the "High stress threshold" (default: 1.5), it indicates heightened market fear and risk-off sentiment. This is a period of significant stress, often associated with market downturns.
Low Stress (Green Line): When the score falls below the "Low stress threshold" (default: -1.0), it signals complacency and low perceived risk in the market. Extreme low readings can sometimes precede volatility spikes.
Neutral (Blue Line): Scores between the high and low thresholds represent normal market conditions.
By providing a weighted, multi-faceted view of volatility, the Volatility Barometer helps traders and investors identify market regimes, confirm trading biases, and anticipate potential shifts in market sentiment.
Options Volatility Strategy Analyzer [TradeDots]The Options Volatility Strategy Analyzer is a specialized tool designed to help traders assess market conditions through a detailed examination of historical volatility, market benchmarks, and percentile-based thresholds. By integrating multiple volatility metrics (including VIX and VIX9D) with color-coded regime detection, the script provides users with clear, actionable insights for selecting appropriate options strategies.
📝 HOW IT WORKS
1. Historical Volatility & Percentile Calculations
Annualized Historical Volatility (HV): The script automatically computes the asset’s historical volatility using log returns over a user-defined period. It then annualizes these values based on the chart’s timeframe, helping you understand the asset’s typical volatility profile.
Dynamic Percentile Ranks: To gauge where the current volatility level stands relative to past behavior, historical volatility values are compared against short, medium, and long lookback periods. Tracking these percentile ranks allows you to quickly see if volatility is high or low compared to historical norms.
2. Multi-Market Benchmark Comparison
VIX and VIX9D Integration: The script tracks market volatility through the VIX and VIX9D indices, comparing them to the asset’s historical volatility. This reveals whether the asset’s volatility is outpacing, lagging, or remaining in sync with broader market volatility conditions.
Market Context Analysis: A built-in term-structure check can detect market stress or relative calm by measuring how VIX compares to shorter-dated volatility (VIX9D). This helps you decide if the present environment is risk-prone or relatively stable.
3. Volatility Regime Detection
Color-Coded Background: The analyzer assigns a volatility regime (e.g., “High Asset Vol,” “Low Asset Vol,” “Outpacing Market,” etc.) based on current historical volatility percentile levels and asset vs. market ratios. A color-coded background highlights the regime, enabling traders to quickly interpret the market’s mood.
Alerts on Regime Changes & Spikes: Automated alerts warn you about any significant expansions or contractions in volatility, allowing you to react swiftly in changing conditions.
4. Strategy Forecast Table
Real-Time Strategy Suggestions: At the close of each bar, an on-chart table generates suggested options strategies (e.g., selling premium in high volatility or buying premium in low volatility). These suggestions provide a quick summary of potential tactics suited to the current regime.
Contextual Market Data: The table also displays key statistics, such as VIX levels, asset historical volatility percentile, or ratio comparisons, helping you confirm whether volatility conditions warrant more conservative or more aggressive strategies.
🛠️ HOW TO USE
1. Select Your Timeframe: The script supports multiple timeframes. For short-term trading, intraday charts often reveal faster shifts in volatility. For swing or position trading, daily or weekly charts may be more stable and produce fewer false signals.
2. Check the Volatility Regime: Observe the background color and on-chart labels to identify the current regime (e.g., “HIGH ASSET VOL,” “LOW VOL + LAGGING,” etc.).
3. Review the Forecast Table: The table suggests strategy ideas (e.g., iron condors, long straddles, ratio spreads) depending on whether volatility is elevated, subdued, or spiking. Use these as a starting point for designing trades that match your risk tolerance.
4. Combine with Additional Analysis: For optimal results, confirm signals with your broader trading plan, technical tools (moving averages, price action), and fundamental research. This script is most effective when viewed as one component in a comprehensive decision-making process.
❗️LIMITATIONS
Directional Neutrality: This indicator analyzes volatility environments but does not predict price direction (up/down). Traders must combine with directional analysis for complete strategy selection.
Late or Missed Signals: Since all calculations require a bar to close, sharp intrabar volatility moves may not appear in real-time.
False Positives in Choppy Markets: Rapid changes in percentile ranks or VIX movements can generate conflicting or premature regime shifts.
Data Sensitivity: Accuracy depends on the availability and stability of volatility data. Significant gaps or unusual market conditions may skew results.
Market Correlation Assumptions: The system assumes assets generally correlate with S&P 500 volatility patterns. May be less effective for:
Small-cap stocks with unique volatility drivers
International stocks with different market dynamics
Sector-specific events disconnected from broad market
Cryptocurrency-related assets with independent volatility patterns
RISK DISCLAIMER
Options trading involves substantial risk and is not suitable for all investors. Options strategies can result in significant losses, including the total loss of premium paid. The complexity of options strategies requires thorough understanding of the risks involved.
This indicator provides volatility analysis for educational and informational purposes only and should not be considered as investment advice. Past volatility patterns do not guarantee future performance. Market conditions can change rapidly, and volatility regimes may shift without warning.
No trading system can guarantee profits, and all trading involves the risk of loss. The indicator's regime classifications and strategy suggestions should be used as part of a comprehensive trading plan that includes proper risk management, directional analysis, and consideration of broader market conditions.

Monthly, Quarterly OPEX & Vix expirations
OPEX Indicator:
The OPEX indicator is designed to provide traders with a visual representation of key options expiration dates, particularly for monthly, quarterly, and VIX options expirations. This indicator can be particularly helpful for market participants who focus on options-based strategies or those who track the impact of options expiration on price action.
The indicator overlays vertical lines and labels on the chart to highlight three key types of expiration events:
Monthly Equity and Index Expiration (OPEX): This marks the standard monthly options expiration dates for equity and index options.
Quarterly Index Expiration (Q): This indicates the quarterly expiration dates for index options, which tend to have a larger impact on the market.
Monthly VIX Expiration (VIXEX): This marks the monthly expiration of VIX options and futures, which are important for volatility traders.
How to Use the OPEX Indicator:
Expiration Dates on the Chart: The OPEX indicator marks expiration dates with vertical lines and labels that appear on the chart. These are customizable, allowing you to adjust the line and label colors to suit your preferences. The lines and labels will appear at specific times, such as the closing of the market on expiration days, allowing traders to prepare for potential volatility or other market dynamics associated with these events.
Customizable Colors and Label Positions: The indicator offers flexibility in customizing the appearance of expiration lines and labels. For each expiration type (OPEX, Quarterly, and VIXEX), you can adjust the line color, label color, and label text color. Additionally, the label text size and position can be customized (e.g., above the bar, below the bar, top or bottom of the chart). This allows for a tailored display that suits your trading style and chart layout.
Visualizing Impact of Expiration Events: Traders who track the influence of expiration events can use this indicator to spot potential market moves around expiration dates. For example, significant price swings often occur near expiration days as options traders adjust their positions. With this indicator, you can visualize these dates on your chart and analyze market behavior in the lead-up to, during, and after the expirations.
Input Options:
Expiration Types:
Monthly Equity, Index Expiration (OPEX): Turn on or off the monthly equity expiration markers.
Quarterly Index Expiration (Q): Turn on or off the quarterly expiration markers.
Monthly VIX Expiration (VIXEX): Turn on or off the VIX expiration markers.
Line and Label Customization:
Line Color: Adjust the color of the vertical lines marking the expiration events.
Label Color: Customize the color of the expiration labels.
Label Text Color: Adjust the color of the text inside the labels.
Label Position: Choose the position of the labels (e.g., top, bottom, above bar, below bar).
Use Cases:
Options Traders: Track options expiration dates to assess potential price swings or liquidity changes.
Volatility Traders: Watch for patterns around VIX options expirations.
Index Traders: Monitor quarterly expirations for potential market-moving events.
Example Use:
As a trader, you can apply this indicator to your chart and observe how price action reacts near expiration dates. For instance, on the monthly OPEX expiration day, you might notice increased volatility or an uptick in options-related price moves. By observing this trend over time, you can align your trades to capitalize on predictable movements around key expiration days.
Additionally, you may use the quarterly expiration markers to assess whether there’s typically a market shift during these periods, providing insights for long-term traders.
This indicator can be a helpful tool for preparing and managing trades around critical options expiration dates, helping to forecast potential market behavior based on historical patterns.
TradingView Community Guidelines Compliance: This script complies with TradingView's community guidelines by offering a clear and valuable function for traders, providing customizable inputs for enhanced usability. The script is focused on chart visualizations without manipulating or misrepresenting market data. It serves as an educational tool and a functional indicator, with no claims or misleading functionality. The indicator does not promote financial products or services and focuses solely on charting for better trading decision-making.

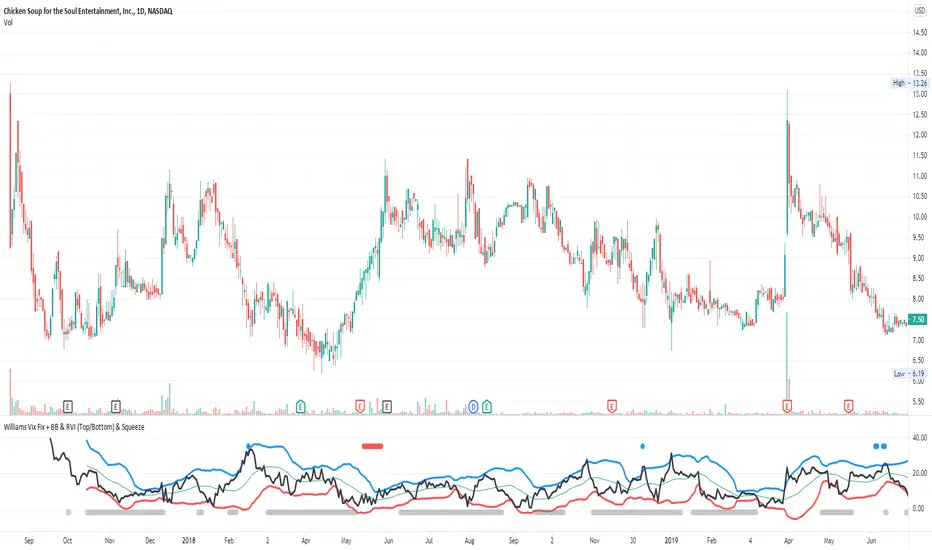
Williams Vix Fix BB + RVI & Squeeze (Keltner) filtered BBW + %BLegend:
- When line touches or crosses red band it is Top signal (Williams Vix Fix)
- When line touches or crosses blue band it is Bottom signal (Williams Vix Fix)
- Red dot at the top of indicator is a Top signal (Relative Volatility Index)
- Blue dot at the top of indicator is a Bottom signal (Relative Volatility Index)
- Gray dot at the bottom of indicator is a Keltner Squeeze signal (filtered by either BBW or %B)
- Silver dot at the bottom of indicator is a weaker Keltner Squeeze signal (Doesn't meet either BBW or %B filter)
- Purple is a 'Half Squeeze' only 1 Bollinger Band crossed the Keltner Channel
This is an attempt to make use of the main features of all 6 of these Volatility tools :
- Williams Vix Fix + Bollinger Bands
- Relative Volatility Index (RVI)
- The crossing of Keltner Channel by the Bollinger Bands (Squeeze)
Conditions to Help Filter Keltner Squeeze:
- When the Bollinger Bands Width (BBW) value is lower than the lowest value within a period plus a margin of error (percentage)
- When the %B value reaches the alert level detailed in LazyBears indicator. ()
If it meets one of these 2 filters and there is a Keltner Channel Squeeze than gray color or else if the squeeze doesn’t meet one of the 2 filters than silver color (weaker Squeeze).
The goal is to find the best tool to find bottoms and top relative to volatility and filter the squeeze.
The idea is that both Williams Vix Fix + Bollinger Bands and Relative Volatility Index both already give the main volatility bottom and top so combining them to compare and validate the signals makes sense. (Note: Bottom signal is more accurate than top). In addition, I added the squeeze to show the potential breakout pressure and to compliment bottom and top signals.
For ideas on how to continue this work :
I encourage ideas to combine the Williams Vix Fix and Relative Volatility Index for volatility top and bottom (with probability would be awesome)
And I encourage ideas to filter Keltner Channel Volatility Squeeze using both the BBW or %B or other volatility squeeze indicators or a combination of all of them.
Also, I encourage people to post their top parameters for the BBW and %B to filter the Keltner Squeeze in the comments or to send me them by chat relative to this indicator.
Half the battle is making the indicator, while the other half is tuning the parameters.
The current parameters are one of the least aggressive, and act as a mild filter.
Note: You can also change the threshold for RVI top and bottom.
And this work builds on my last indicator:
If you have ideas on this work or have ideas on potential combinations please message me, I always want to learn or get perspective on how it can be improved.
Sharing is how we get better (Parameter tuning, ideas, discussion)
I don’t reinvent the wheel, just trying to make the wheel better.
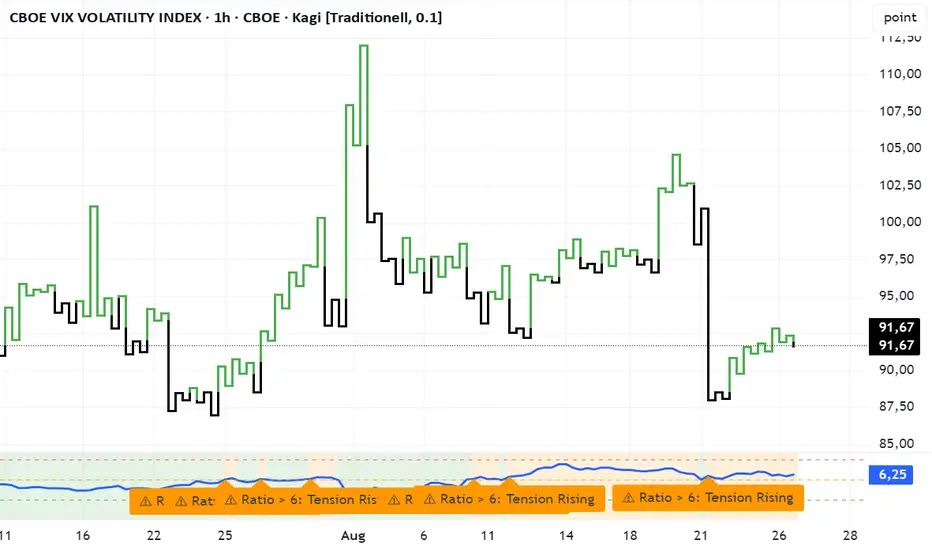
VVIX/VIX Ratio with Interpretation LevelsVVIX/VIX Ratio with Interpretation Levels
This indicator plots the ratio of VVIX (Volatility of Volatility Index) to VIX (CBOE Volatility Index) in a separate panel.
The ratio highlights when the options market is pricing unusually high volatility in volatility (VVIX) relative to the base volatility index (VIX).
Ratio < 5 → Complacency: Markets expect stability; often a pre-shock zone.
5–6 → Tension Building: Traders begin hedging volatility risk while VIX remains low.
6–7 → Elevated Risk: Divergence warns of potential regime change in volatility.
> 7 → High-Risk Zone: Options market pricing aggressive swings; can precede volatility spikes in equities.
The script also includes dashed interpretation lines (5, 6, 7) and automatic labels when key thresholds are crossed.
Background shading helps visualize current regime.
Use cases:
Detect hidden stress when VIX remains calm but VVIX rises.
Anticipate potential volatility regime shifts.
Support risk management and timing of long/short volatility strategies.
Mitsos4 RSI + BB + Dispersion + Trendlines + VIX Fix Mitsos4 RSI + BB + Dispersion + Trendlines + VIX Fix
This powerful custom indicator combines two analytical tools into one view:
RSI-based Bollinger Bands with Dispersion and the Vix Fix volatility spike detector.
It is designed for traders who want early volatility signals and precision RSI insights, all in a single pane.
🧩 What's Included:
✅ 1. RSI + BB (EMA) + Dispersion
RSI-Based Bollinger Bands: Tracks the RSI with Bollinger Bands using an EMA as the basis.
Dispersion Zone: A buffer zone around the moving average band for more sensitive overbought/oversold detection.
Dynamic RSI Coloring:
🟢 Green: RSI breaks above the dispersion zone.
🔴 Red: RSI breaks below the dispersion zone.
🟡 Yellow: RSI inside the zone (neutral).
Trendlines at RSI levels: 40 (green), 50 (yellow), 60 (red).
Alerts when RSI crosses dispersion zones.
✅ 2. CM_Williams_Vix_Fix
Designed to simulate VIX-like volatility spikes on non-VIX instruments.
Detects potential market bottoms by measuring price deviation from recent highs.
Includes:
Bollinger Band range on WVF.
Percentile high/low zones to detect significant volatility moves.
Histogram plot of WVF for quick visual alerts.
Color-coded spikes (green when above upper thresholds).
⚙️ User Controls:
Adjustable RSI, Bollinger Band, and dispersion settings.
Toggle options for:
Viewing high/low VIX percentiles.
Showing standard deviation bands for WVF.
Custom trendline display levels at RSI key areas.
📌 Best Use Cases:
Detect early market reversals and volatility spikes.
Combine RSI strength with volatility-based bottom signals.
Layer dispersion-based logic on top of classic RSI strategies.

Matrix Series and Vix Fix with VWAP CCI and QQE SignalsMatrix Series and Vix Fix with VWAP CCI and QQE Signals
Short Title: Advanced Matrix
Purpose
This Pine Script combines multiple technical analysis tools to create a comprehensive trading indicator. It incorporates elements like support/resistance zones, overbought/oversold conditions, Williams Vix Fix, QQE (Quantitative Qualitative Estimation) signals, VWAP CCI signals, and a 200-period SMA for trend filtering. The goal is to provide actionable buy and sell signals with enhanced visualization.
Key Features and Components
1. Matrix Series
Smoothing Input: Allows customization of EMA smoothing for the indicator (default: 5).
Support/Resistance Zones: Based on CCI (Commodity Channel Index) values.
Dynamic zones calculated with customizable parameters (SupResPeriod, SupResPercentage, PricePeriod).
Candlestick Visualization: Custom candlestick plots with colors indicating trends.
Dynamic levels for overbought/oversold conditions.
2. Overbought/Oversold Signals
Overbought and oversold levels are adjustable (ob and os).
Plots circles on the chart to highlight extreme conditions.
3. Williams Vix Fix
Identifies potential reversal points by analyzing volatility.
Uses Bollinger Bands and percentile thresholds to detect high-probability entries.
Includes two alert levels (alert1 and alert2) with customizable criteria for signal filtering.
4. QQE Signals
Based on the smoothed RSI and QQE methodology.
Detects trend changes using adaptive ATR bands (FastAtrRsiTL).
Plots long and short signals when specific conditions are met.
5. VWAP CCI Signals
Combines VWAP and CCI for additional trade signals.
Detects crossovers and crossunders of CCI levels (-200 and 200) to generate long and short signals.
6. 200 SMA
A 200-period simple moving average is plotted to act as a trend filter.
The script rules recommend buying only when the price is above the SMA200.
Customizable Inputs
General:
Smoothing, support/resistance periods, overbought/oversold levels.
Williams Vix Fix:
Lookback periods, Bollinger Band settings, percentile thresholds.
QQE:
RSI length, smoothing factor, QQE factor, and threshold values.
VWAP CCI:
Length for calculating deviations.
Visual Elements
Dynamic candlestick colors to indicate trend direction.
Overbought/oversold circles for extreme price levels.
Resistance and support lines.
Labels and shapes for buy/sell signals from Vix Fix, QQE, and VWAP CCI.
Alerts
Alerts are configured for the Matrix Series (e.g., "BUY MATRIX") and other components, ensuring traders are notified when significant conditions are met.
Intended Use
This indicator is designed for traders seeking a multi-faceted tool to analyze market trends, identify potential reversal points, and generate actionable trading signals. It combines traditional indicators with advanced techniques for comprehensive market analysis.

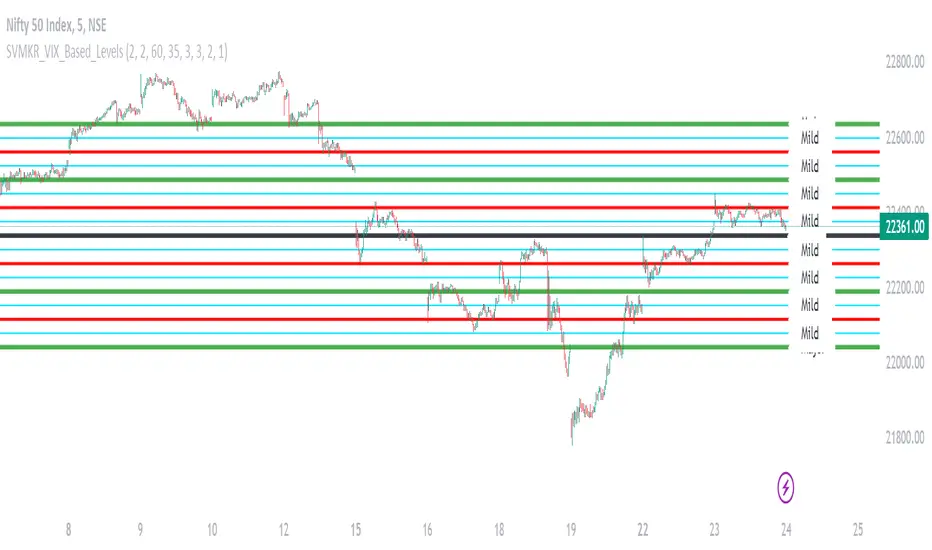
SVMKR_VIX_Based_LevelsThe "SVMKR_VIX_Based_Levels" script is a Pine Script indicator designed to assist intraday traders in identifying dynamic support and resistance levels based on the Volatility Index (VIX). Here's a breakdown of the script and its uses for intraday traders:
### Script Description:
1. **Data Retrieval**:
- The script fetches daily closing prices of the India VIX (volatility index) and a specified security using `request.security()`.
2. **Input Parameters**:
- Intraday traders can customize the indicator using input parameters such as the number of levels above and below the Pivot Day Close (PDC), line offset lengths, line extension options, and color and width settings for plotted lines.
3. **Plotting**:
- The script plots the PDC and VIX as hidden lines (`display=display.none`).
- Support and resistance levels are calculated based on the VIX and PDC, and plotted above and below the PDC with customizable colors and widths.
- Each level can be labeled with its corresponding price.
4. **Customization**:
- Intraday traders can choose to display or hide prices on the plotted lines.
- Colors and widths of plotted lines are customizable.
- Options to show minor and mild support levels provide additional flexibility.
5. **Labels**:
- Labels are added to indicate the PDC and the plotted levels, displaying corresponding prices if enabled.
### Uses for Intraday Traders:
1. **Dynamic Support and Resistance**: Intraday traders can benefit from dynamically adjusted support and resistance levels that respond to changes in market volatility, providing more accurate levels for trade planning.
2. **Market Sentiment Analysis**: By incorporating the VIX, a measure of market volatility and sentiment, the indicator provides insights into market sentiment, helping intraday traders gauge market mood and potential direction.
3. **Confirmation of Price Action**: The plotted support and resistance levels can serve as confirmation signals for intraday traders, helping validate trading decisions and enhance trading confidence.
4. **Adaptability to Changing Market Conditions**: Intraday traders often face rapidly changing market conditions. The indicator's ability to adapt to changes in volatility ensures that plotted levels remain relevant and responsive, aiding traders in adjusting their strategies accordingly.
5. **Trade Planning and Execution**: Intraday traders can use the plotted support and resistance levels to identify potential entry and exit points, set profit targets and stop-loss levels, and plan their trades more effectively.
Overall, the "SVMKR_VIX_Based_Levels" indicator provides intraday traders with a valuable tool for dynamic support and resistance identification, market sentiment analysis, confirmation of price action, and trade planning and execution, ultimately assisting them in making more informed and profitable trading decisions in the intraday timeframe.
Volatility Inverse Correlation CandleThis is an educational tool that can help you find direct or inverse relations between two assets.
In this case I am using VIX and SPX .
The way it works is the next one :
So I am looking at the current open value of VIX in comparison with the previous close ( if it either above or below) and after on the SPX I am looking into the history and see for example which type of candle we had in respect with the opening value from VIX .
So for example, lets imagine that today is monday, and the weekly open value from VIX was higher than previous friday close value. Now I am going to see with the inverse correlation , if based on this idea, the current weekly candle from SPX finished in a bear candle.
The same can be applied for the bearish situation, so if we had an open from VIX lower than previous close, we are looking to check the SPX bull candle accuracy.
At the same time, for a different type of calculation I have added an internal lookup into heikin ashi values.
If you have any questions please let me know !

Stock vs Index vs Vix (Adjusted)
Usually stocks move with Indexes and against Vix, so with this script you can compare and see how strong is the price movement of an asset.
Try to find what Index (e.g. SPY, QQQ, IWM) and Vix (e.g. VIX, VXN, RVX) fits better for selected symbol.
If price moving in the upper channel = price movement is strong.
If price moving in the lower channel = price movement is weak.
If price is stronger than Index and Vix = good sign.
If price is weaker than Index and Vix = bad sign.
Strong support and resistance lines are at 66.6 and 33.3
Disclaimer:
Trading success is all about following your trading strategy and the indicators should fit within your trading strategy, and not to be traded upon solely
The script is for informational and educational purposes only. Use of the script does not constitute professional and/or financial advice. You alone have the sole responsibility of evaluating the script output and risks associated with the use of the script. In exchange for using the script, you agree not to hold dgtrd TradingView user liable for any possible claim for damages arising from any decision you make based on use of the script

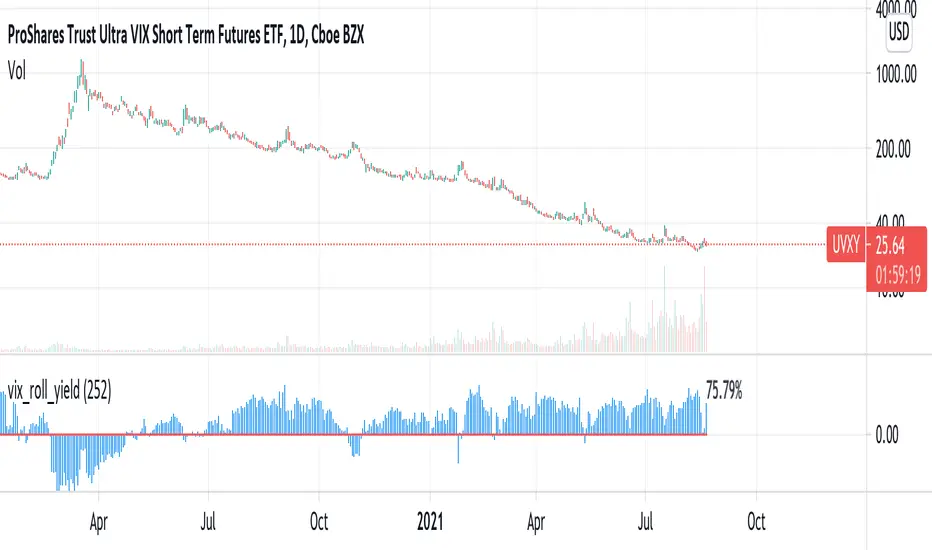
vix_roll_yieldShows the roll yield of the VX futures, which is the ratio of a continuously weighted average of the front two months to the VIX. The VX (VIX futures) contract expires on the third Tuesday of each month. On the next trading day, the front month will have full weighting, and the second month will have no weight. On the expiration day, the back month will have full weighting and the front month will have no weight. In between, the weight gradually shifts.
This weighted average is similar to the SPVIXSTR index that UVXY and several other funds track. When the average is below the VIX, the indicator is negative, and the front month contract will tend to gain value relatively more rapidly than the back month as it converges upward to the VIX spot price. Because funds whose NAV is tied up in VX contracts continuously roll from the (typically cheaper) front month to the back, in situations where the front month is more expensive than usual--or even more expensive than the back month--these products may have a "tailwind". In this case, they are selling expensive front month contracts to purchase cheap back month contracts.
Ordinarily, VIX funds have a "headwind." The roll yield is positive, the front month is cheap, and the back month is expensive. Day by day the funds sell cheap front month contracts and buy expensive back month contracts, which, in turn and over time, become the front month and converge with the VIX, losing value rapidly. This is a brief explanation about the decay of these products.
Williams Vix Fix + BB & RVI (Top/Bottom) & SqueezeLegend :
- When line touches or crosses red band it is Top signal (Williams Vix Fix)
- When line touches or crosses blue band it is Bottom signal (Williams Vix Fix)
- Red dot at the top of indicator is a Top signal (Relative Volatility Index)
- Blue dot at the top of indicator is a Bottom signal (Relative Volatility Index)
- Gray dot at the bottom of indicator is a Squeeze signal
This is an attempt to make use of the main features of all 4 of these very popular Volatility tools :
- Williams Vix Fix + Bollinger Bands (as per Larry Williams idea, link )
- Relative Volatility Index (RVI)
- The crossing of Keltner Channel by the Bollinger Bands (Squeeze)
The goal is to find the best tool to find bottoms and top relative to volatility . This is a simple combination, but I find it very useful personally
(no need to reinvent the wheel, just need to find what works best)
The idea is that Williams Vix Fix + Bollinger Bands already give the main volatility bottom and top (Bottom are more accurate).
So instead of trying to modify it, I chose to compliment it by mapping with points when the Relative Volatility Index (RVI) reached the
top/bottom thresholds (red dot means top and blue dot means bottom). That way we can easily see when both indicators find a top or bottom relative
to volatility (of course this needs to be then confirmed with a momentum indicator rally).
In addition, I added the squeeze because this quickly shows the potential breakouts.
For ideas on how to continue this work, it would be very interesting to be able to create a probability of a bottom and top relative to volatility using the
Williams Vix Fix + Bollinger Bands and "Relative Volatility Index" signals as both work well and give top or bottom the other doesn't see.
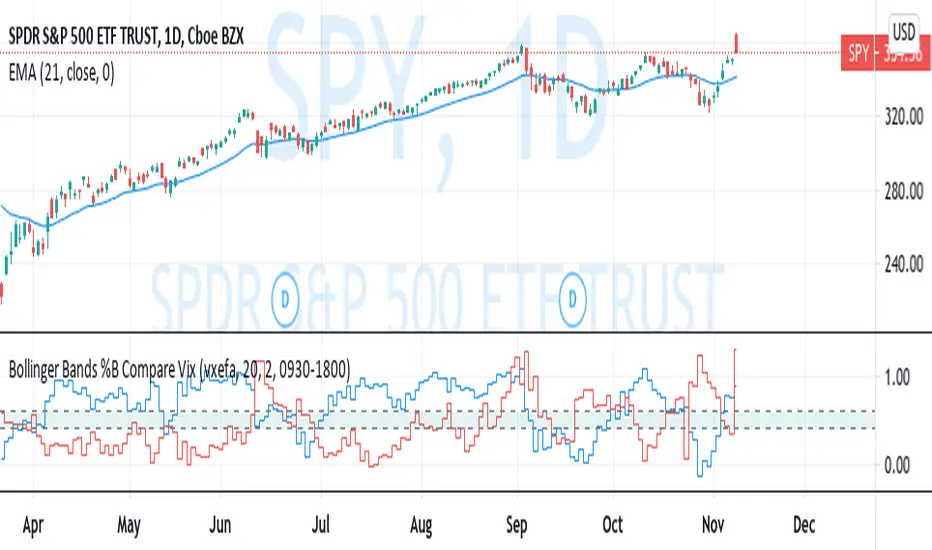
Bollinger Bands %B Compare VixThis imple script converts your chosen chart price and outputs it as a percentage in relation to the Vix percentage.
If price (Blue line) is higher than 0.60 and vix (Red Line) is lower than 0. 40 then there is lower volatility and this is good for buying.
If price (Blue line) is lower than 0. 40 and vix (Red Line) is higher than 0.60 then there is higher volatility and this is good for selling, exiting and cash only.
If you like risk you can enter as soon as the price and vix cross in either direction
This is my first script, please give me a lot of critique, I won't cry hahaha :)
For greater accuracy, you use these Vix products for their specific stocks/Indicies:
Apple - VXAPL
Google - VXGOG
Amazon - CBOE:VXAZN
IBM - CBOE:VXIBM
Goldman Sachs - CBOE:VXGS
NASDAQ 100 = CBOE:VXN
SP100 - CBOE:VXO
SP500 (3months) - VIX3M
XLE(energy sector) - CBOE:VXXLE
EWZ(brazil etf) - VXEWZ
EEM( emerging markets etf) - CBOE:VXEEM
EFA (MSCI ETF) - CBOE:VXEFA
FXI (Cina ETF) - CBOE:VXFXI
(JS)S&P 500 Volatility Oscillator For Options 2.0I am going to start taking requests to open source my indicators and they will also be updated to Version 4 of Pinescript.
I added some features to the original code such the ability to smooth the oscillator and select the look back periods for the historical volatility.
Link to original:
Original post:
"The idea for this started here: www.tradingview.com with the user @dime
This should only be used on SPX or SPY (though you could use it on other things for correlation I suppose) given that the instrument used to create this calculation is derived from the S&P 500 (thank you VIX ). There's a lot of moving parts here though, so allow me to explain...
First: The main signal is when Implied Volatility (from VIX ) drops beneath Historical Volatility - which is what you want to see so you aren't purchasing a ton of premium on long options. Green and above 0 means that IV% has dropped lower than Historical Volatility . (this signal, for example, would suggest using a Long Call or Put depending on your sentiment)
Second: The green line running underneath zero is the bottom portion of the "Average True Range" derived from the values used to create the oscillator. the closer the bottom histogram is to the green line, the more "normal" IV% is. Obviously, if this gets far away from the line then it could be setting up nicely to short options and sell the IV premium to someone else. (this signal, for example, would suggest using something like a Bull Put Spread)
Third: The red background along with the white line that drops down below zero signals when (and how far) the IV% from 3 months out (from VIX3M ) is less than the current IV%. This would signal the current environment has IV way too high, a signal to short options once again (and don't take any long option positions!).
Tried to make this simple, yet effective. If you trade options on SPX , SPY , even ES1! futures - this is a tool tailored specifically for you! As I said before, if you want you can use it for correlation on other securities. Any other ideas or suggestions surrounding this, please let me know! Enjoy!
Feb 17, 2019
Release Notes: Cosmetic update for a much cleaner look:
-Replaced the "HIGH IV" with a simlple "H"
-Now the white line is constantly showing you the relationship between VIX and VIX3M - when VIX is greater than VIX3M the background still goes red
-However, now when VIX drops below Historical Volatility, the background is bright green
-When both above are true - it's dark green
-The Average True Range on the bottom is now a series of crosses"

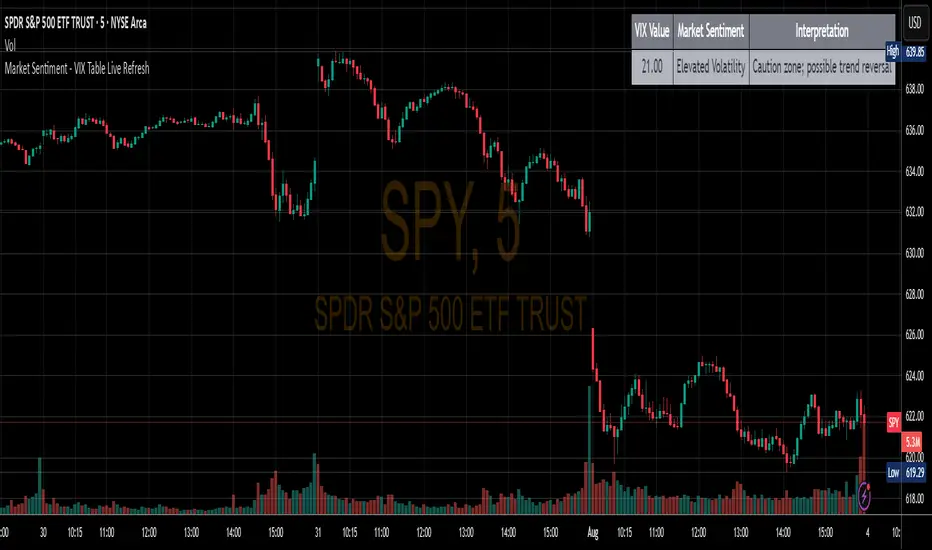
Market Sentiment - VIX Table Live RefreshProvides Market sentiment visual representation for easy understanding - using CBOE:VIX values
The VIX Sentiment Table provides an at-a-glance assessment of market mood by visualizing live data from the CBOE Volatility Index (VIX). Updated in sync with your chart’s resolution, this intuitive tool breaks down the current VIX level into clear sentiment zones—ranging from “Complacency” to “Panic”—paired with concise interpretations to guide your trading decisions.