MOVE/VXTLT CorrelationMany know of the VIX for equity trading. Yet, many are unaware that there is the same kind of volatility measure for trading bonds, called the MOVE Index.
"The Merrill Lynch Option Volatility Estimate (MOVE) Index is a yield curve weighted index of the normalized implied volatility on 1-month Treasury options which are weighted on the 2, 5, 10, and 30 year contracts."
With this script one can see the the correlation and divergences between bonds and its volatility measure to make educated decisions in trading or hedging.
The idea of this script comes from NicTheMajestic.
在腳本中搜尋"vix"

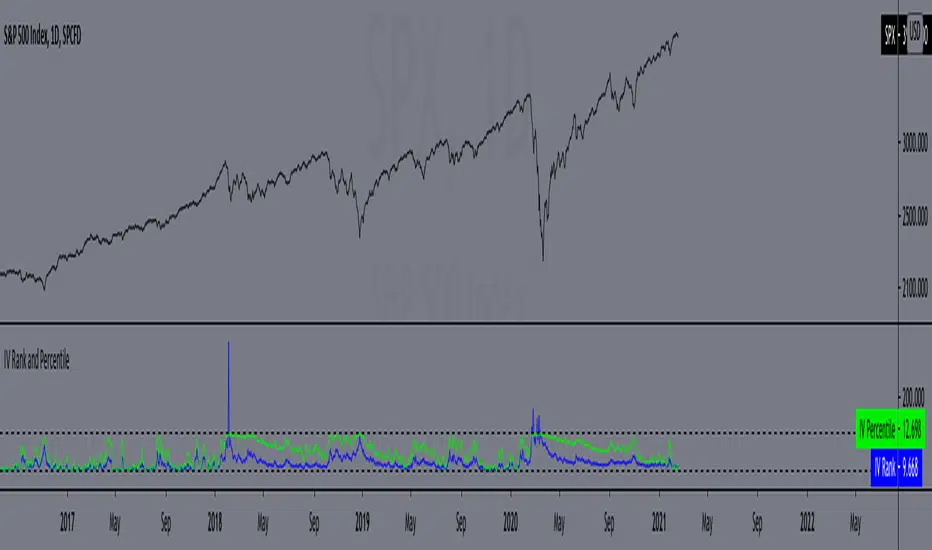
IV Rank and Percentile"All stocks in the market have unique personalities in terms of implied volatility (their option prices). For example, one stock might have an implied volatility of 30%, while another has an implied volatility of 50%. Even more, the 30% IV stock might usually trade with 20% IV, in which case 30% is high. On the other hand, the 50% IV stock might usually trade with 75% IV, in which case 50% is low.
So, how do we determine whether a stock's option prices (IV) are relatively high or low?
The solution is to compare each stock's IV against its historical IV levels. We can accomplish this by converting a stock's current IV into a rank or percentile.
Implied Volatility Rank (IV Rank) Explained
Implied volatility rank (IV rank) compares a stock's current IV to its IV range over a certain time period (typically one year).
Here's the formula for one-year IV rank:
(Current IV - 1 Year Low IV) / (1 Year High IV - 1 Year Low IV) * 100
For example, the IV rank for a 20% IV stock with a one-year IV range between 15% and 35% would be:
(20% - 15%) / (35% - 15%) = 25%
An IV rank of 25% means that the difference between the current IV and the low IV is only 25% of the entire IV range over the past year, which means the current IV is closer to the low end of historical levels of implied volatility.
Furthermore, an IV rank of 0% indicates that the current IV is the very bottom of the one-year range, and an IV rank of 100% indicates that the current IV is at the top of the one-year range.
Implied Volatility Percentile (IV Percentile) Explained
Implied volatility percentile (IV percentile) tells you the percentage of days in the past that a stock's IV was lower than its current IV.
Here's the formula for calculating a one-year IV percentile:
Number of trading days below current IV / 252 * 100
As an example, let's say a stock's current IV is 35%, and in 180 of the past 252 days, the stock's IV has been below 35%. In this case, the stock's 35% implied volatility represents an IV percentile equal to:
180/252 * 100 = 71.42%
An IV percentile of 71.42% tells us that the stock's IV has been below 35% approximately 71% of the time over the past year.
Applications of IV Rank and IV Percentile
Why does it help to know whether a stock's current implied volatility is relatively high or low? Well, many traders use IV rank or IV percentile as a way to determine appropriate strategies for that stock.
For example, if a stock's IV rank is 90%, then a trader might look to implement strategies that profit from a decrease in the stock's implied volatility, as the IV rank of 90% indicates that the stock's current IV is at the top of its range over the past year (for a one-year IV rank).
On the other hand, if a stock's IV rank is 0%, then traders might look to implement strategies that profit from an increase in implied volatility, as the IV rank of 0% indicates the stock's current implied volatility is at the bottom of its range over the past year."
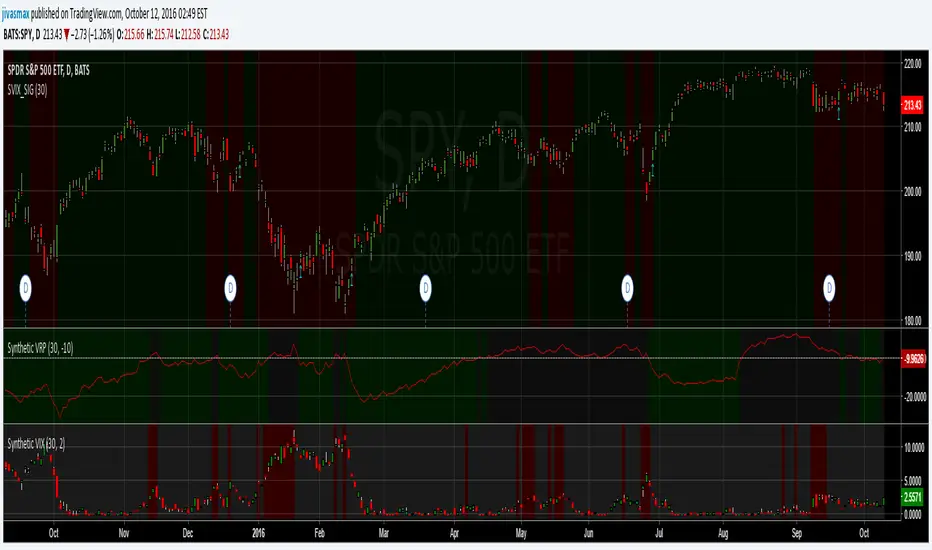
This script approximates IV by using the VIX products, which calculate the 30-day implied volatility of the specified security.
*Includes an option for repainting -- default value is true, meaning the script will repaint the current bar.
False = Not Repainting = Value for the current bar is not repainted, but all past values are offset by 1 bar.
True = Repainting = Value for the current bar is repainted, but all past values are correct and not offset by 1 bar.
In both cases, all of the historical values are correct, it is just a matter of whether you prefer the current bar to be realistically painted and the historical bars offset by 1, or the current bar to be repainted and the historical data to match their respective price bars.
As explained by TradingView,`f_security()` is for coders who want to offer their users a repainting/no-repainting version of the HTF data.
Combo VIX and DXYHello traders
It's been a while :)
I wanted to share a cool script that you can use for any asset class.
The script isn't really special - though what it displays is super helpful
Volatility Index $VIX
(Source: Wikipedia)
VIX is the ticker symbol and the popular name for the Chicago Board Options Exchange's CBOE Volatility Index, a popular measure of the stock market's expectation of volatility based on S&P 500 index options.
It is calculated and disseminated on a real-time basis by the CBOE, and is often referred to as the fear index or fear gauge.
I consider that a $VIX above 30% is a very bearish signal.
Above 30% translating investors selling in masse their assets. #blood #on #the #street
Dollar Index $DXY
(Source: Wikipedia)
The U.S. Dollar Index (USDX, DXY, DX, or, informally, the "Dixie") is an index (or measure) of the value of the United States dollar relative to a basket of foreign currencies, often referred to as a basket of U.S. trade partners' currencies.
The Index goes up when the U.S. dollar gains "strength" (value) when compared to other currencies.
The index is designed, maintained, and published by ICE (Intercontinental Exchange, Inc.), with the name "U.S. Dollar Index" a registered trademark.
It is a weighted geometric mean of the dollar's value relative to following select currencies:
Euro (EUR), 57.6% weight
Japanese yen (JPY) 13.6% weight
Pound sterling (GBP), 11.9% weight
Canadian dollar (CAD), 9.1% weight
Swedish krona (SEK), 4.2% weight
Swiss franc (CHF) 3.6% weight
In "bear markets", the $DXY usually goes up.
People are selling their hard assets to get some $USD in return - pumping the $DXY higher
Corollary
I'm not sure which one happens first between a bearish $DXY or bearish $DXY... though both are usually correlated
If:
- $VIX goes above 30%, usually $DXY increases and assets versus the good old' $USD drop
- $VIX goes below 30%, usually $DXY decreases and assets versus the good old' $USD increases
This is a nice lever effect between both the $VIX, $DXY and the assets versus the $USD
That's being said, I don't only use those 2 information to enter in a trade.
It gives me though a strong confirmation whenever I'm long or short
Imagine I get a LONG signal but the combo $VIX + $DXY is bearish... this tells me to be cautious and to:
- enter at a pullback
- protect my position quickly at breakeven
- take my profit quick
For a mega bull market (some called it hyperinflation), you want your fiat to drop in value for the counter-asset to increase in value.
And before you ask.... yes I look at what $DXY is doing before taking a trade on $BTCUSD :)
In other words, $DXY going down is quite bullish for Bitcoin.
Settings and Alerts
The settings by default are the ones I use for my trading.
The background colors will be colored whenever the COMBO is bullish (green) or bearish (red)
Alerts are enabled using the brand new alert function published last week by @TradingView
That's it for today, I hope you'll like it :)
PS: In this chart above, I'm using the Supertrend indicator from @KivancOzbilgic
Dave

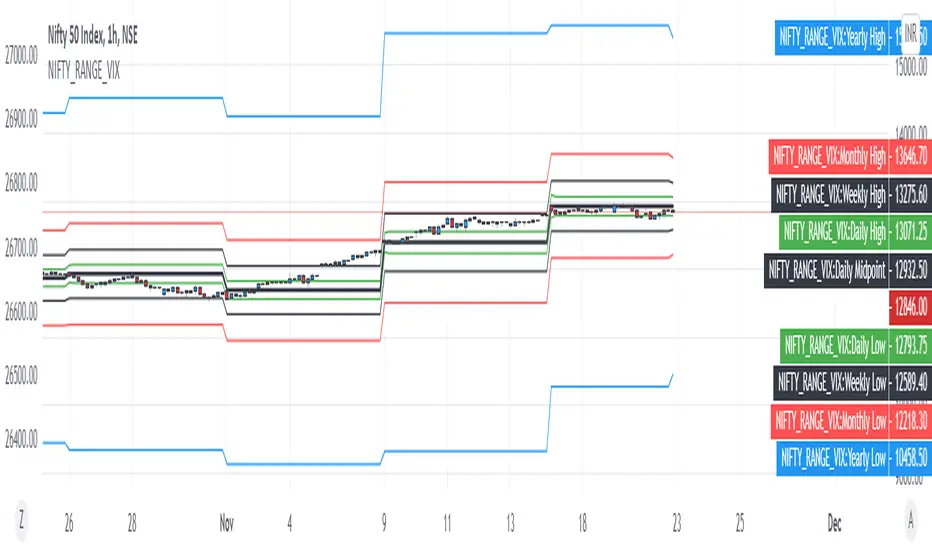
NIFTY VIX BANDSThis script can be used to visually identify the 1 standard deviation range of price movement anticipated by NSE ticker for Volatility Index NSE:INDIAVIX
Ideal to use on NSE:NIFTY ticker only!
The NIFTY range is extended to Yearly, Monthly, Weekly, Daily based on the current value of INDIAVIX.
All options are customizable:
Time frame of the VIX Bands
Select / De-select of Plots for Yearly, Monthly Weekly and Daily
VIX3M/1M ratioThis script simply calculates and plots the VIX 3 month versus 1 month ratio. Values below 1 indicate a strong panic situation in the market (1 month volatility is higher than the 3 month volatiliy). This might be a good opportunity to sell options.

Imminence of volatilityWork in progress.
Simple oscillator that takes in implied volatilities at two different timescales for the same security, to determine whether the market expects the next crash to be imminent or "in a few months from now".
Best combined with other IV/VIX-based indicators and visual inspection of the IV charts, but still gives some decent information at a glance.

Volatility IndexThis is a composite volatility index to show percentile of current volatility compared to that of the last 52 bars. As this is a weekly chart (and this script is intended for usage on weekly charts) we can see the yearly percentile rank of volatility.
As shown when volatility is in the lower 25%tile (viewed on weekly) the market is calm and likes to rise; when the volatility is above the 25%tile you can see that the market tends to have larger and 'choppier' moves.
This is /not/ 'just the vix' this takes into consideration the volatility of all major US indexes including the SPX500, Dow 30, Nasdaq 100, and Russel 2000.
Please remember that this is just plotting:( volatility index - lowest(index,52) )/( highest(index,52)-lowest(index,52) ) so for 'yearly percentile' check the weekly chart (52 weeks = 1yr)

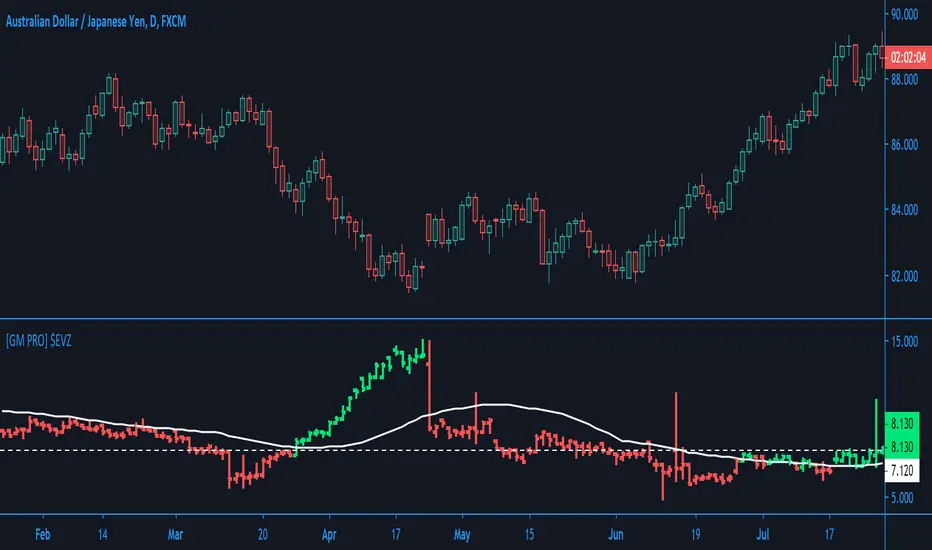
[GM PRO] $EVZCBOE: Euro FX VIX ($EVZ)
A reasonable indicator of overall Forex Market Volume and/or Volatility.
Filters added:
- Filter by Horizontal Level
- Filter by Moving Average
Options to consider the highs or the closing values
This indicator is only for Forex
VIX3M/VIX RatioPlots the ratio between the VIX3m and the VIX to show potential entry points (.8 - .9).

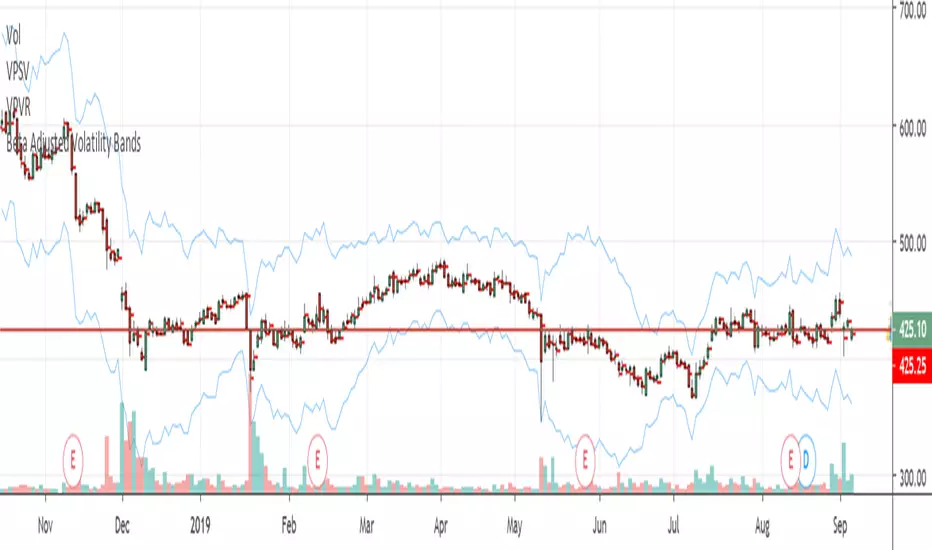
Beta Adjusted Volatility BandsBeat Adjusted Volatility Bands
Input Vix and Beat of the asset Sector.
Example:
Looking to sell options, Sell options beyond the bands.
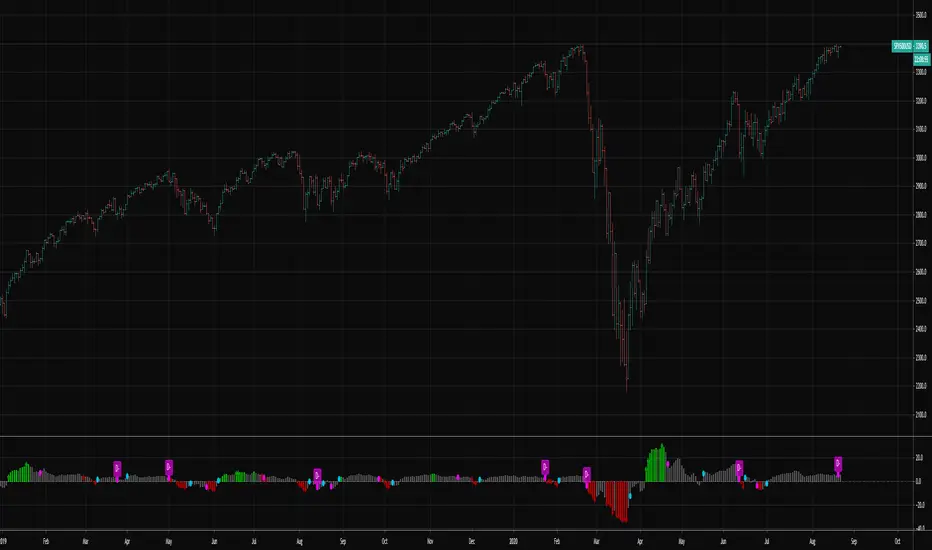
PpSignal EWO BB IndexI have developed an indicator based on the oscillator of that with the escape bands, where we can see the relationship between the Vix. (histogram), Nasdaq color lime and SP500 color green.
it is very important to consider the relationship vix with these indices ...

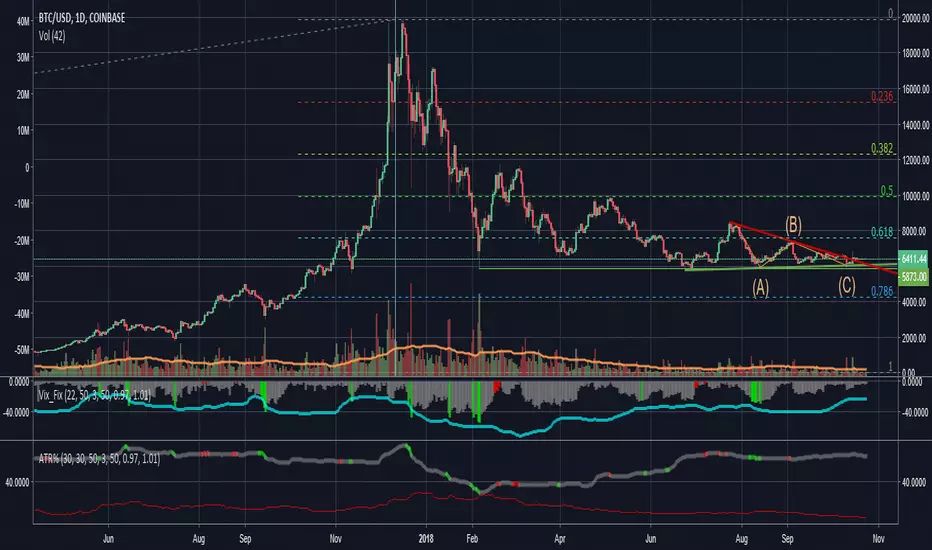
Extreme IndicatorIdentifies price extreme points based on a highest/lowest price lookback. There are many other goodies hidden in this indicator including a built in ATR trailing stop that will flip up and down.
The inspiration of this indicator is based on this idea .
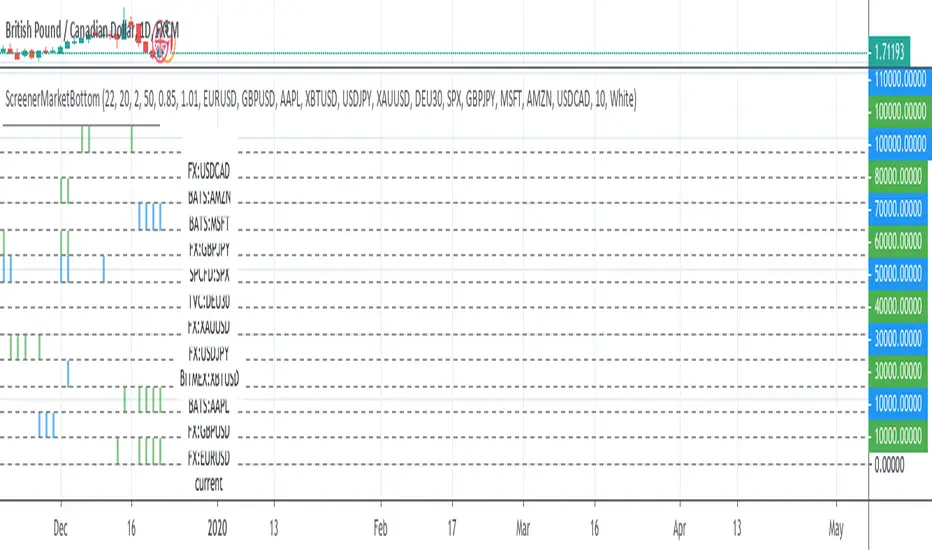
ScreenerMarketBottomThis study works as screener with alerts for ChrisMoody's scritp CM_Williams_Vix_Fix Finds Market Bottoms .
Refers to original study for the code: I converted it in a function and I used my snippets of pine script codes for convert it in a screener.
I'm thinking to transform it in a strategy: if someone has suggestion on startegy logic please let me know. For example enter long after three lime color bars?
Please use comment section for any feedback.
Next improvement (only to whom is interested to this script and follows me): study with alerts on multiple tickers all at one. Leave a comment if you want to have access to study.
ATR and VIX For Profit Target and RSI LimitThe red line, based on ATR, should be used as a percentage gain goal. So I will set my profit targets based on this percentage.
The grey line is based on William's VIX and I use it to judge what RSI I should sell at.
@WACC Volatility Weighted PUT/CALL Positions [SPX]This indicator is based on Volatility and Market Sentiment. When volatility is high, and market sentiment is positive, the indicator is in a low or 'buy state'. When volatility is low and market sentiment is poor, the indicator is high.
The indicator uses the VIX as it's volatility input.
The indicator uses the spread between the Call Volume on SPX/SPY and the Put Volume.
This is pulled from CVSPX and PVSPX.
When volatility and put/call reaches a critical level, such as the levels present in a crisis or a sell off, the line will be green. See Sept 2015, 2008, and Feb 2018.
This level can be edited in the source code.
As the indicator is based on Put/Call, the indicator works best on larger time frames as the put/call ratio becomes a more discernible measure of sentiment over time.

IV/HV ratio 1.0 [dime]This script compares the implied volatility to the historic volatility as a ratio.
The plot indicates how high the current implied volatility for the next 30 days is relative to the actual volatility realized over the set period. This is most useful for options traders as it may show when the premiums paid on options are over valued relative to the historic risk.
The default is set to one year (252 bars) however any number of bars can be set for the lookback period for HV.
The default is set to VIX for the IV on SPX or SPY but other CBOE implied volatility indexes may be used. For /CL you have OVX/HV and for /GC you have GVX/HV.
Note that the CBOE data for these indexes may be delayed and updated EOD
and may not be suitable for intraday information. (Future versions of this script may be developed to provide a realtime intraday study. )
There is a list of many volatility indexes from CBOE listed at:
www.cboe.com
(Some may not yet be available on Tradingview)
RVX Russell 2000
VXN NASDAQ
VXO S&P 100
VXD DJIA
GVX Gold
OVX OIL
VIX3M 3-Month
VIX6M S&P 500 6-Month
VIX1Y 1-Year
VXEFA Cboe EFA ETF
VXEEM Cboe Emerging Markets ETF
VXFXI Cboe China ETF
VXEWZ Cboe Brazil ETF
VXSLV Cboe Silver ETF
VXGDX Cboe Gold Miners ETF
VXXLE Cboe Energy Sector ETF
EUVIX FX Euro
JYVIX FX Yen
BPVIX FX British Pound
EVZ Cboe EuroCurrency ETF Volatility Index
Amazon VXAZN
Apple VXAPL
Goldman Sachs VXGS
Google VXGOG
IBM VXIBM

Combined SPY and VIX TSS from [RS] TSS scriptUsing Richard Santos's TSS I added VIX TSS and combined it with the SPY TSS.

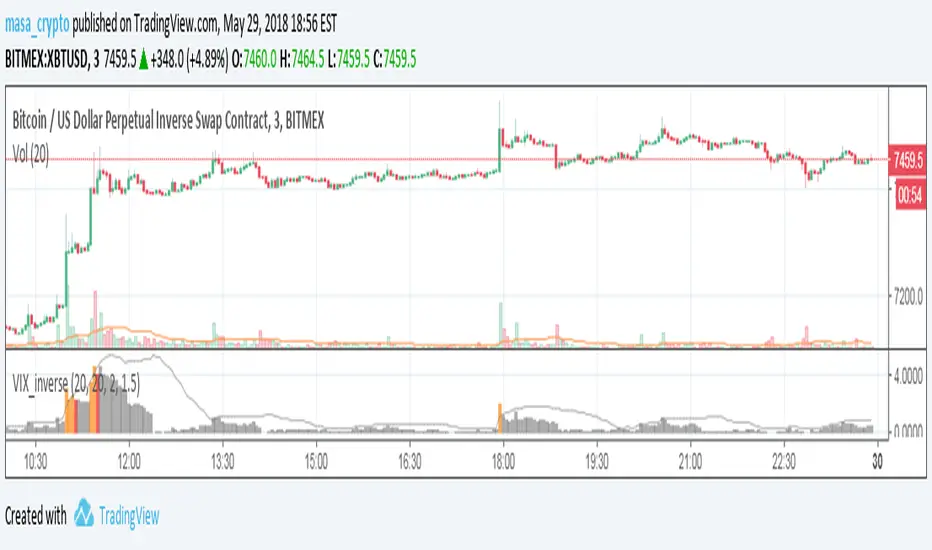
Williams_VIX_fix_inverseThe volatility index, Williams vix fix developed by Larry Williams, is a well-known index for finding market bottoms. It describes how much the current low price statistically deviates from the maximum within a given look-back period.
The inverse can be formulated by considering "how much the current high value statistically deviates from the minimum within a given look-back period." This transformation equates Vix_Fix_inverse. This indicator can be used for finding market tops, and therefore, is a good signal for a timing for taking a short position.
VXV/VIX Contango Indicator [JPStockhouse]This script indicates times to hold ZIV (darker green), XIV (bright green), or go to cash (red), based on VXV/VIX contango levels. The 30 to 90 day contango is represented by the bars on the histogram, and the thresholds for holding each asset are indicated by the colors.

S&P VIX & SKEW IndicatorUse this indicator to compare VIX, SKEW and yearly HIGH and LOW of the S&P 500. If three of those indicators are on a down trend, then the indicator changes to red color.