Premium VWAP Trendfollow Strategy [wbburgin]This is a strongly-revised version of my VWAP Trendfollow Strategy, which follows a substantial reworking to address various structural inefficiencies with the script, such as the narrowing of the standard deviation band upon anchor reset. I will continue updating the original script with planned adjustments, this is a different proof-of-concept that builds off of the original script thesis with a different calculation method and execution.
This strategy is not built for any specific asset or timeframe, and has been backtested on crypto and equities from 1 min-1 day. The previous experimental strategy was heavily-correlated with the actual movement of the asset, which added unpalatable risk to the strategy and increased drawdown. This revised form has a more stable backtesting curve, but I want to heavily emphasize that I cannot guarantee that the strategy will be profitable for your circumstances. Backtesting only goes so far and every exchange has a different fee schedule, which can substantially eat into your profits. At the bottom I will explain the parameters behind the strategy results.
**********
The VWAP Trendfollow Strategy begins with a simple premise: to enter long when the price breaks above the upper standard deviation of a VWAP, and to close the position when the price breaks below the lower standard deviation of the VWAP. This is more effective than initiating the same strategy for a VWMA because the VWAP resets its anchor depending on your chosen anchor period, and the act of resetting its anchor also resets its standard deviation value. As a consequence, in sustained uptrends, the standard deviation is pulled upward to meet the price when the anchor resets, instead of requiring the price to fall all the way back down, as in the lower standard deviation band of the VWMA. This essentially acts as the VWAP itself raising the stop loss at each anchor period, which works well for the overall trend-following strategy.
However, this narrowing can still have consequences for a simple breakout strategy; as the price gradually oscillates towards above or below its standard deviation band, it may cross over the other and produce false signals. This oscillation is worrisome especially when fees are taken into account.
Thus, the premium VWAP Trendfollow strategy has a variable width which detects abnormal narrowing of the band, and adjusts it until it is reasonable to close the variability period. Additionally, a filter is added to the open/close signals to soften the frequency of signals without impacting performance significantly.
This script contains an ATR stop loss and an ATR take profit (which is also a difference between it and the original experimental script), with customizable inputs. The strategy results shown below are with initial capital of $1000, qty entry of 10%, and commissions of 0.06%. It works best on 24/7 instruments, like crypto, but I have found it also works with FAANG stocks or other high volatility / high volume assets. The issue with stocks, however, is that the price can jump/plummet because of abnormal events after-hours, which the strategy cannot pick up on until pre-trading begins the next morning. For that reason I suggest it be used on crypto and, because of its low % profitable (but high average winning trade in relation to its average losing trade), be used on an exchange that has minimal fees or volume-based discounts. In the unfortunate case that you cannot find a minimal fee or volume-discounted fee exchange (such as fellow Americans following the liquidity-retreat on Binance.US), I encourage you to test out the higher anchor periods for the higher timeframes, which will reduce the number of trades and increase the average % per trade.
Additionally, this is a long-term strategy used best for accumulation. It is currently long-only; that may change based off of user input.
**********
Disclaimer
Copyright by wbburgin.
The information contained in my Scripts/Indicators/Algorithms does not constitute financial advice or a solicitation to buy or sell any securities of any type. I will not accept liability for any loss or damage, including without limitation any loss of profit, which may arise directly or indirectly from the use of or reliance on such information.
All investments involve risk, and the past performance of a security, industry, sector, market, financial product, trading strategy, backtest, or individual's trading does not guarantee future results or returns. Investors are fully responsible for any investment decisions they make. Such decisions should be based solely on an evaluation of their financial circumstances, investment objectives, risk tolerance, and liquidity needs.
在腳本中搜尋"vwap"

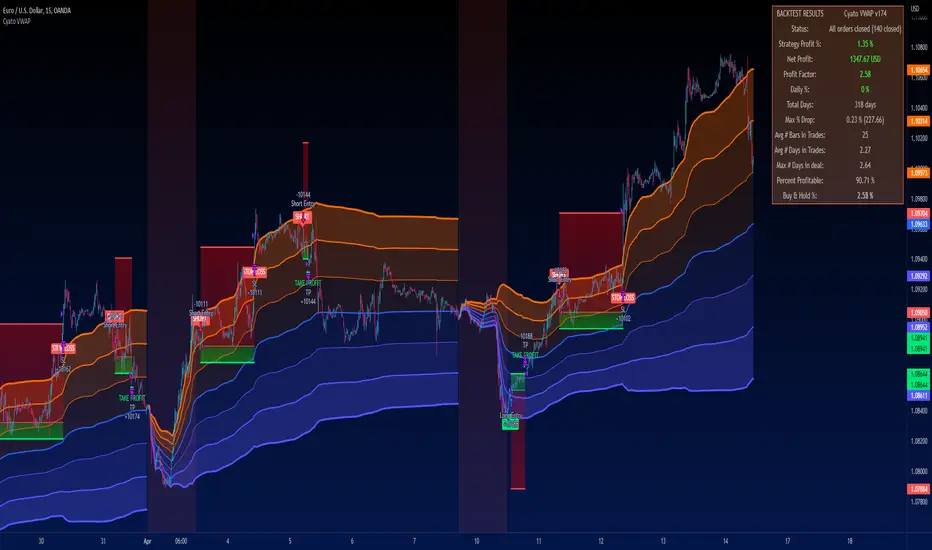
Cyatophilum VWAP StrategyAn indicator to backtest and automate VWAP custom strategies.
Use the Trend Mode to create Swing Trading strategies or Rotation Mode for Intraday Trading.
Configure your strategy using the Entry Condition Builder and Risk Management features, such as Trailing Stop & Take Profits, Safety Orders, and VWAP Exit conditions.
═════════════════════════════════════════════════════════════════════════
█ HOW IT WORKS
VWAP stands for Volume Weighted Average Price.
It is like a simple moving average that takes volume into account.
It is used by a lot of traders since it has everything one needs to know: price and volume.
The cummulated volume calculation resets every session, which interval can be configured.
From that we can calculate the MVWAP and the Standard Deviation Bands and create strategies around that.
█ HOW TO USE
Trend Mode
Trend Mode is the name for strategies built upon VWAP and price/MVWAP cross, most often for Swing Trading on high timeframes trending markets.
The side traded is often long and trying to beat Buy & Hold.
The trade exit can be triggered by a reversal signal (top chart), or a trailing stop (bottom chart) and take profit.
Rotation Mode
This is the mode for Intraday on low timeframes. It will work best on ranging markets.
We use the Standard Deviation Bands to buy/sell the price at overbougth/oversold levels.
The indicator allows to create complex entry conditions such as "Break out of 3rd bands AND break back in 2nd bands" within a certain amount of time.
We will use either the exit options to close the trade when prices reach an opposite band, or the risk management features explained below.
█ FEATURES
• VWAP settings
Configure the VWAP.
• Entry settings
Choose to go long, short, and if the strategy should reverse or not.
• Trend Mode
Choose to create entries from VWAP cross with price or MVWAP.
• Rotation Mode
Configure the 3 bands and build a condition for entry. The multiple inputs allow to add up different events required to trigger an entry, using 3 logical gates that can be linked together using a AND or OR condition. The events being: "break out", "Break back in" or "Just touches" any of the 3 bands. The condition must be met within a certain period of time to be valid.
• Exit settings
Options to exit trades at the end of every session or when the price reaches an opposite band.
• Stop Loss & Take Profit
Configure your stop loss and take profit for long and short trades.
You can also make a trailing stoploss and a trailing take profit.
• Safety Orders (DCA)
Create a strategy with up to 100 safety orders.
Configure their placement and order size using the price deviation, step scale, take profit type (from base order or total volume), and volume scale settings.
Graphics
A Configuration panel with all the indicator settings, useful for sharing a strategy.
A Backtest Results panel with buy & Hold Comparator.
█ ALERTS
Configure your alert messages for all events in the indicator settings.
Then click "Add Alert". In the popup window, select the option "alert() function calls only", give the alert a name and you are good to go!
█ BACKTEST RESULTS
The backtest settings used in this snapshot are the following:
Initial Capital: 10 000€
Order size: 10% equity
Commission: 0.1€ per order
Slippage : 10 ticks
Please read the author instructions below for access.
RSI on VWAP Upgraded strategyFirst of all, the idea of apply RSI to VWAP was inspired by XaviZ; at least, that where I first saw that.
I simply applied the idea and searched for apply this on lower timeframe (M15) to increase the number of positions and improve the profit factor.
The conditions to enter are the same :
long : enter on RSI crossover oversold level
short : enter on RSI crossunder oversell level
To close position, I found a little change to apply :
long : close position when RSI(VWAP) went in overbought zone and crossunder the overbought level OR after being at least x bars in the overbought zone (parameter is 28 by default) => when the first condition happens
short : close position when RSI(VWAP) went in oversold zone and crossover the oversold level OR after being at least x bars in the oversell zone (parameter is 28 by default) => when the first condition happens
With this change, I got better results specially on BTCUSDTPERP (M15) where I reach a 6.8 profit factor with 119 trades closed. Not BAD !
The defaults parameters are the best found for BTCUSDTPERP (M15), but the strategy works fine for other pairs if you take time to find the rights combinations.
In this strategy you can change (with defaults in () ):
RSI length (28)
RSI overbought level (85)
RSI oversell level (30)
Number of bars before leaving as explain above (28)
The choice to take longs only, shorts only or both
The number of coin/token by position
The start date for backtesting
Please note that the script use a pyramiding parameter of 3 (can be changed in the first line of the script); that means that you can take up to 3 positions before closing. It lets you improve average enter price but increase the risk. 3 is the best I found to improve profit factor without expose myself too much.
This script would be better if automated because of the conditions of buy and sell.
It's only for educative purpose, not an advice to invest.
All my free scripts here : fr.tradingview.com
Leave a message and don't forget to follow me ;) !

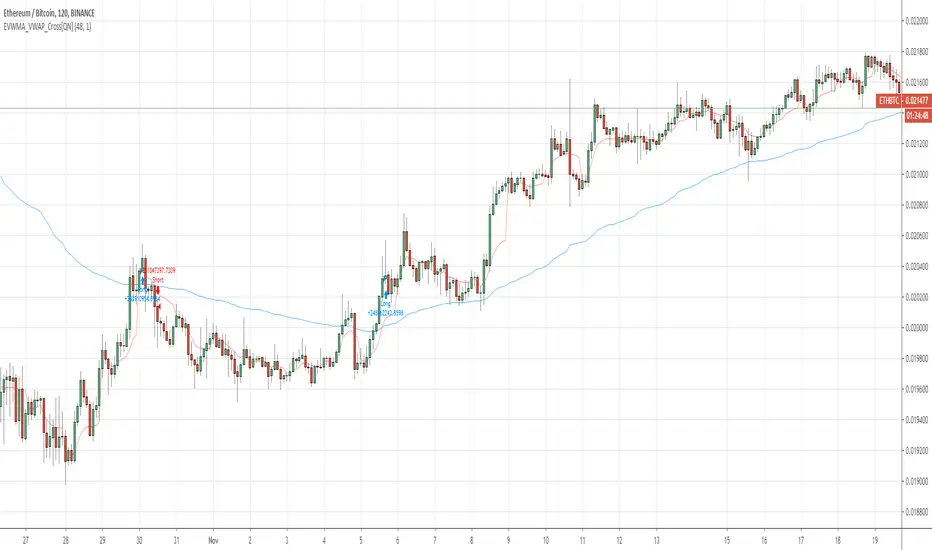
EVWMA VWAP Cross Strategy [QuantNomad]Continue to experiement with VWAP and EVWMA.
It seems that just simple crosses between VWAP and EVWMA can be pretty good signals. VWAP is a bit choppy so you can use VWAP smoothing input to smoth it a bit.
Here are few other strategies based on EVWMA:
EVWMA VWAP MACD Strategy
QuantNomad - EVWMA MACD Strategy
ARSI – (VWAP & ATR) 3QKRAKThe ARSI Long & Short – Dynamic Risk Sizing (VWAP & ATR) indicator combines three core components—an adjusted RSI oscillator (ARSI), Volume‐Weighted Average Price (VWAP), and Average True Range (ATR)—so that entry/exit signals and position sizing are always tailored to current market conditions. ARSI, plotted from 0 to 100 with clearly marked overbought and oversold zones, is the primary signal driver: when ARSI falls below the lower threshold it indicates an excessive sell‐off and flags a long opportunity, whereas a break above the upper threshold signals overextended gains and foreshadows a short. A midpoint line at 50 can serve as an early exit or reduction signal when crossed against your position.
VWAP, showing the volume‐weighted average price over the chosen period, acts as a trend filter—long trades are only taken when price sits above VWAP, and shorts only when it’s below—ensuring each trade aligns with the prevailing market momentum. ATR measures current volatility and is used both to set safe stop‐loss levels and to dynamically size each position. In practice, this means positions automatically shrink in high‐volatility environments and grow in quieter markets, all while risking a fixed percentage of your capital.
Everything appears on a single chart: the ARSI pane below the price window with its reference levels; VWAP overlaid on the price; and the ATR‐based stop‐loss distances graphically displayed. Traders thus get a comprehensive, at-a-glance view of entries, exits, trend confirmation, and exactly how large a position they can safely take. The indicator runs in real time, removing the need for manual parameter calculations and letting you focus on strategic decision-making.

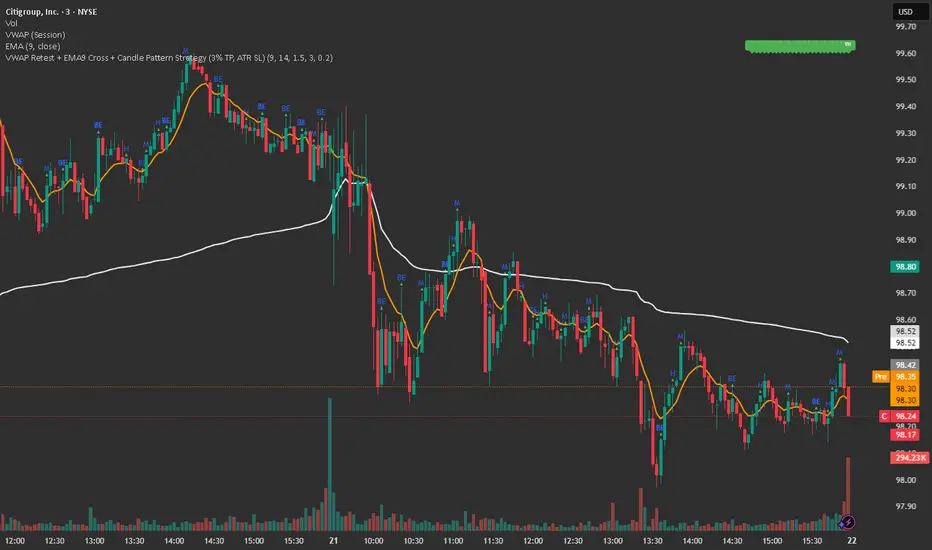
VWAP Retest + EMA9 Cross + Candle Pattern StrategyVWAP Retest + EMA9 Cross Strategy (Intraday, 3% TP, ATR SL)
This is a momentum-based intraday strategy, targets VWAP retest continuation setups in strong trends. Designed for morning US session trades (9:30–12:30 EST). It combines multiple layers of confluence for high-probability long setups:
Entry Conditions:
EMA9 crossover above VWAP (within 1-2 bars)
Price retests VWAP within a buffer ($0.2)
Price is above previous day’s high
One of 3 bullish candle patterns must appear:
Hammer (H)
Bullish Engulfing (BE)
Momentum Candle (M)
Trade Management:
Take Profit: 3%
Stop Loss: ATR-based, 1.5× multiplier
Session Filter: 9:30am to 12:30pm EST
No pyramiding/ one position at a time
Forced exit at 1pm EST
It filters out weak entries by ensuring:
Momentum
Structure break
Candle confirmation
Backtested on 3-min timeframe, period: Jan 01, 2025 - Oct 22, 2025. Best performance seen on CITI, INTC, and WBD (high profit factors and low drawdowns). Not financial advice.
Dillon's Double VWAP StrategyThis is based on Dillon's double VWAP strategy.
I enters when the ADX is low (aka not a trending market) and it's not close to the VWAP reset. Check it out.

Swing VWAP Crypto and Stocks StrategyThis is a strategy designed for swing trading on markets such as crypto and stocks.
Its components are:
VWAP
Time Management
Risk management
Rules for entry:
We entry only on Monday, if our close of the candle crossed above VWAP
Rules for exit
We exit always on Sunday or if we either hit the TP/SL levels.
If you have any questions let me know

EmperorBTC's VWAP StrategyEmperorBTC's VWAP Indicator & Strategy
v2.1
coded by Bogdan Vaida
This indicator was created after EmperorBTC's conditions.
Good timeframes for it: 30', 15', 5'
To convert from strategy to study switch the commented lines in the beginning
and at the end of the script and vice versa.
What this indicator does is to check if:
o Pivot Point was crossed
o Stoch-RSI and VWAP were crossed in current or previous candle
o Candle (or previous candle) close is in the trend direction
If all these are true then it will go long or short based on direction.

dEMA w/ VWAP filterBuy when EMA is below VWAP and starts sloping up
Sell when EMA is above VWAP and starts sloping down

MACD on VWAPA modified version of the traditional MACD
Uses VWAP to calculate MACD instead of the usual closing price.

EVWMA VWAP MACD Strategy [QuantNomad]Based on comment of @coondawg71 I tried to compare VWAP and EVWMA.
Both are sort of moving averages so I decided to create a MACD based on these 2 indicators.
In parameters you can set EVWMA Length and 2 smoothing lengths for "macd" and "signal".
Strategy seems to work pretty good at 2h-8h timeframes for crypto.
What do you thing about it?

[VJ] Mega Supertrend for IntradayThis is a simple intraday strategy for working on Stocks or commodities based out on Super Trend and intraday's best friend - VWAP . You can modify the start time and end time based on your timezones. Session value should be from market start to the time you want to square-off
Important: The end time should be at least 2 minutes before the intraday square-off time set by your broker
Comment below if you get good returns
Strategy: Tweaked Super trend with VWAP
Indicators used :
Super trend is simple and easy to use indicator and gives a precise reading about an on going trend.It is built with two parameters, namely period and multiplier.The Buy and Sell signal modifies once the indicator tosses over the closing price. When the Super trend closes above the Price, a Buy signal is generated, and when the Super trend closes below the Price, a Sell signal is generated. In this case we use it only for direction .
Multiplier is a vital input for Super trend. If the multiplier value is too high, then lesser number of signals is made.
Volume is important as we don’t want to get stuck with a stock which has few takers, even if you think it is priced attractively. Thus, the VWAP was created to take into account both volume as well as Price so that the potential trader would make the trading decision or not.
In simple terms, the Volume Weighted Average price is the cumulative average price with respect to the volume
Buying/Selling
when the closing price starts moving up/down and farther from the VWAP, there is pressure among the traders to sell/buy, a general belief kicks in that it might be that the stock is overvalued/undervalued .This is the time when we couple the Super trend to take our entries
Usage & Best setting :
Choose a good volatile stock and a time frame - 5m.
ST multiplier : 3
There is stop loss and take profit that can be used to optimise your trade
The template also includes daily square off based on your time.

Ultimate Scalping Strategy v2Strategy Overview
This is a versatile scalping strategy designed primarily for low timeframes (like 1-min, 3-min, or 5-min charts). Its core logic is based on a classic EMA (Exponential Moving Average) crossover system, which is then filtered by the VWAP (Volume-Weighted Average Price) to confirm the trade's direction in alignment with the market's current intraday sentiment.
The strategy is highly customizable, allowing traders to add layers of confirmation, control trade direction, and manage exits with precision.
Core Strategy Logic
The strategy's entry signals are generated when two primary conditions are met simultaneously:
Momentum Shift (EMA Crossover): It looks for a crossover between a fast EMA (default length 9) and a slow EMA (default length 21).
Buy Signal: The fast EMA crosses above the slow EMA, indicating a potential shift to bullish momentum.
Sell Signal: The fast EMA crosses below the slow EMA, indicating a potential shift to bearish momentum.
Trend/Sentiment Filter (VWAP): The crossover signal is only considered valid if the price is on the "correct" side of the VWAP.
For a Buy Signal: The price must be trading above the VWAP. This confirms that, on average, buyers are in control for the day.
For a Sell Signal: The price must be trading below the VWAP. This confirms that sellers are generally in control.
Confirmation Filters (Optional)
To increase the reliability of the signals and reduce false entries, the strategy includes two optional confirmation filters:
Price Action Filter (Engulfing Candle): If enabled (Use Price Action), the entry signal is only valid if the crossover candle is also an "engulfing" candle.
A Bullish Engulfing candle is a large green candle that completely "engulfs" the body of the previous smaller red candle, signaling strong buying pressure.
A Bearish Engulfing candle is a large red candle that engulfs the previous smaller green candle, signaling strong selling pressure.
Volume Filter (Volume Spike): If enabled (Use Volume Confirmation), the entry signal must be accompanied by a surge in volume. This is confirmed if the volume of the entry candle is greater than its recent moving average (default 20 periods). This ensures the move has strong participation behind it.
Exit Strategy
A position can be closed in one of three ways, creating a comprehensive exit plan:
Stop Loss (SL): A fixed stop loss is set at a level determined by a multiple of the Average True Range (ATR). For example, a 1.5 multiplier places the stop 1.5 times the current ATR value away from the entry price. This makes the stop dynamic, adapting to market volatility.
Take Profit (TP): A fixed take profit is also set using an ATR multiplier. By setting the TP multiplier higher than the SL multiplier (e.g., 2.0 for TP vs. 1.5 for SL), the strategy aims for a positive risk-to-reward ratio on each trade.
Exit on Opposite Signal (Reversal): If enabled, an open position will be closed automatically if a valid entry signal in the opposite direction appears. For example, if you are in a long trade and a valid short signal occurs, the strategy will exit the long position immediately. This feature turns the strategy into more of a reversal system.
Key Features & Customization
Trade Direction Control: You can enable or disable long and short trades independently using the Allow Longs and Allow Shorts toggles. This is useful for trading in harmony with a higher-timeframe trend (e.g., only allowing longs in a bull market).
Visual Plots: The strategy plots the Fast EMA, Slow EMA, and VWAP on the chart for easy visualization of the setup. It also plots up/down arrows to mark where valid buy and sell signals occurred.
Dynamic SL/TP Line Plotting: A standout feature is that the strategy automatically draws the exact Stop Loss and Take Profit price lines on the chart for every active trade. These lines appear when a trade is entered and disappear as soon as it is closed, providing a clear visual of your risk and reward targets.
Alerts: The script includes built-in alertcondition calls. This allows you to create alerts in TradingView that can notify you on your phone or execute trades automatically via a webhook when a long or short signal is generated.

Volume Weighted Average Price STHello everyone.
I am using vwap standard deviation to find trades.
Above standard deviation 1 is buy
Below standard deviation -1 is sell
Price crossunder of vwap after Buy signal is exit for long trade
Price crossover of vwap after Sell signal is exit for short trade
You can set target points(optional)
You can limit number of trades every day.
Background color changes to gray when today range matches to ATR(14) or you can enable label to see the value at last bar
Contact me for more details if you have any queries.
VWAP Executor — v6 (VWAP fix)tarek helishPractical scalping plan with high-rate (sometimes reaching 70–85% in a quiet market)
Concept: “VWAP bounce with a clear trend.”
Tools: 1–3-minute chart for entry, 5-minute trend filter, VWAP, EMA(50) on 5M, ATR(14) on 1M, volume.
When to trade: London session or early New York session; avoid 10–15 minutes before/after high-impact news.
Entry rules (buy for example):
Trend: Price is above the EMA(50) on 5M and has an upward trend.
Entry zone: First bounce to VWAP (or a ±1 standard deviation channel around it).
Signal: Bullish rejection/engulfing candle on 1M with increasing volume, and RSI(2) has exited oversold territory (optional).
Order: Entry after the confirmation candle closes or a limit close to VWAP.
Trade Management:
Stop: Below the bounce low or 0.6xATR(1M) (strongest).
Target: 0.4–0.7xATR(1M) or the previous micro-high (small return to increase success rate).
Trigger: Move the stop to breakeven after +0.25R; close manually if the 1M candle closes strongly against you.
Filter: Do not trade if the spread widens, or the price "saws" around VWAP without a trend.
Sell against the rules in a downtrend.
Why this plan raises the heat-rate? You buy a "small discount" within an existing trend and near the institutional average price (VWAP), with a small target price.
مواقعي شركة الماسة للخدمات المنزلية
شركة تنظيف بالرياض
نقل عفش بالرياض

SwingTrade ADX Strategy v6This is a swing trading strategy that combines VWAP (Volume Weighted Average Price), ADX (Average Directional Index) for trend strength, and volume ratios to generate long/short entry and exit signals. It's designed for daily charts but can be adapted.
#### Key Features:
- **Entries**: Based on VWAP crossovers, rising/falling delta (price deviation from VWAP), ADX trend confirmation, and volume ratios.
- **Exits**: Dynamic exits when VWAP delta reverses after a peak.
- **Filters**: Optional toggles for VWAP signals, ADX, and volume. Backtest date range for custom periods.
- **Visuals**: VWAP line, signal shapes/labels, and an info panel showing key metrics (VWAP Delta %, ADX, Volume Ratio).
- **Alerts**: Built-in alerts for buy/sell entries and exits.
#### How to Use:
1. Apply to your chart (e.g., stocks, forex, crypto).
2. Adjust parameters in the settings (e.g., ADX threshold, volume period).
3. Enable/disable indicators as needed.
4. Backtest using the date filters and review equity curve.
**Disclaimer**: This is for educational purposes only. Past performance is not indicative of future results. Not financial advice—trade at your own risk. Backtest thoroughly and use with proper risk management.
Feedback welcome! If you find it useful, give it a like.

VWAP Breakout Strategy + EMAs + Clean Cycle/TP/SL PlotsHere’s a quick user-guide to get you up and running with your “VWAP Breakout Strategy + EMAs + Clean Cycle/TP/SL Plots” script in TradingView:
⸻
1. Installing the Script
1. Open TradingView, go to Pine Editor (bottom panel).
2. Paste in your full Pine-v6 code and hit Add to chart.
3. Save it (“Save as…”): give it a memorable name (e.g. “VWAP Breakout+EMAs”).
⸻
2. Configuring Your Inputs
Once it’s on the chart, click the ⚙️ Settings icon to tune:
Setting Default What it does
ATR Length 14 Period for average true range (volatility measure)
ATR Multiplier for Stop 1.5 How many ATRs away your stop-loss sits
TP1 / TP2 Multipliers (ATR) 1.0 / 2.0 Distance of TP1 and TP2 in ATR multiples
Show VWAP / EMAs On Toggles the blue VWAP line & EMAs (100/34/5)
Full Cycle Range Points 200 Height of the shaded “cycle zone”
Pivot Lookback 5 How many bars back to detect a pivot low
Round Number Step 500 Spacing of your dotted horizontal lines
Show TP/SL Labels On Toggles all the “ENTRY”, “TP1”, “TP2”, “STOP” tags
Feel free to adjust ATR multipliers and cycle-zone size based on the instrument’s typical range.
⸻
3. Reading the Signals
• Long Entry:
• Trigger: price crosses above VWAP
• You’ll see a green “Buy” tag at the low of the signal bar, plus an “ENTRY (Long)” label at the close.
• Stop is plotted as a red dashed line below (ATR × 1.5), and TP1/TP2 as teal and purple lines above.
• Short Entry:
• Trigger: price crosses below VWAP
• A red “Sell” tag appears at the high, with “ENTRY (Short)” at the close.
• Stop is the green line above; TP1/TP2 are dashed teal/purple lines below.
⸻
4. Full Cycle Zone
Whenever a new pivot low is detected (using your Pivot Lookback), the script deletes the old box and draws a shaded yellow rectangle from that low up by “Full Cycle Range Points.”
• Use this to visualize the “maximum expected swing” from your pivot.
• You can quickly see whether price is still traveling within a normal cycle or has overstretched.
⸻
5. Round-Number Levels
With Show Round Number Levels enabled, you’ll always get horizontal dotted lines at the nearest multiples of your “Round Number Step” (e.g. every 500 points).
• These often act as psychological support/resistance.
• Handy to see confluence with VWAP or cycle-zone edges.
⸻
6. Tips & Best-Practices
• Timeframes: Apply on any intraday chart (5 min, 15 min, H1…), but match your ATR length & cycle-points to the timeframe’s typical range.
• Backtest first: Use the Strategy Tester tab to review performance, tweak ATR multipliers or cycle size, then optimize.
• Combine with context: Don’t trade VWAP breakouts blindly—look for confluence (e.g. support/resistance zones, higher-timeframe trend).
• Label clutter: If too many labels build up, you can toggle Show TP/SL Labels off and rely just on the lines.
⸻
That’s it! Once you’ve added it to your chart and dialed in the inputs, your entries, exits, cycle ranges, and key levels will all be plotted automatically. Feel free to experiment with the ATR multipliers and cycle-zone size until it fits your instrument’s personality. Happy trading!

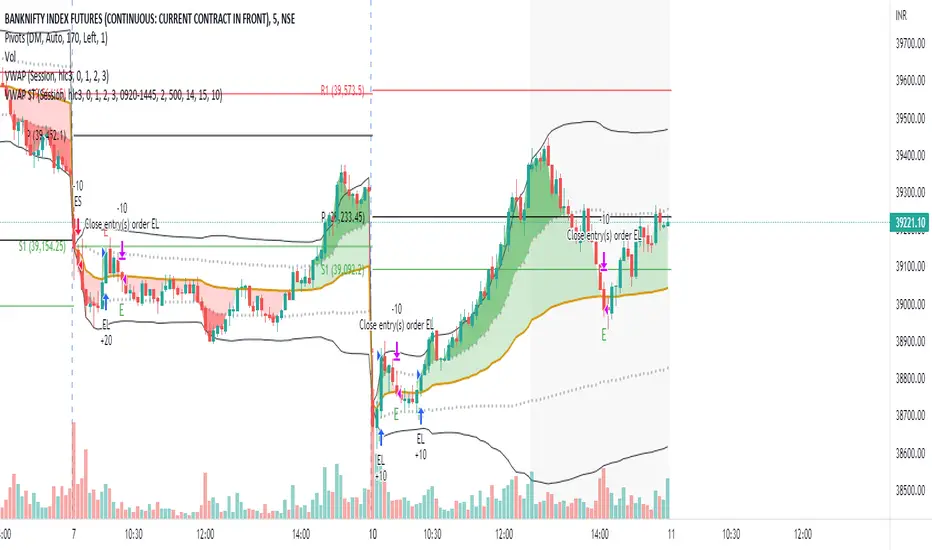
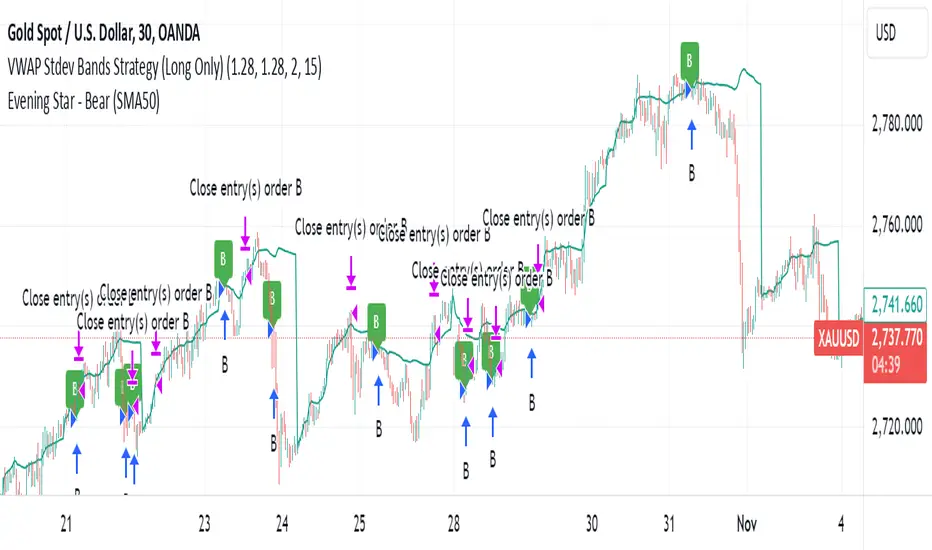
VWAP Stdev Bands Strategy (Long Only)The VWAP Stdev Bands Strategy (Long Only) is designed to identify potential long entry points in trending markets by utilizing the Volume Weighted Average Price (VWAP) and standard deviation bands. This strategy focuses on capturing upward price movements, leveraging statistical measures to determine optimal buy conditions.
Key Features:
VWAP Calculation: The strategy calculates the VWAP, which represents the average price a security has traded at throughout the day, weighted by volume. This is an essential indicator for determining the overall market trend.
Standard Deviation Bands: Two bands are created above and below the VWAP, calculated using specified standard deviations. These bands act as dynamic support and resistance levels, providing insight into price volatility and potential reversal points.
Trading Logic:
Long Entry Condition: A long position is triggered when the price crosses below the lower standard deviation band and then closes above it, signaling a potential price reversal to the upside.
Profit Target: The strategy allows users to set a predefined profit target, closing the long position once the specified target is reached.
Time Gap Between Orders: A customizable time gap can be specified to prevent multiple orders from being placed in quick succession, allowing for a more controlled trading approach.
Visualization: The VWAP and standard deviation bands are plotted on the chart with distinct colors, enabling traders to visually assess market conditions. The strategy also provides optional plotting of the previous day's VWAP for added context.
Use Cases:
Ideal for traders looking to engage in long-only positions within trending markets.
Suitable for intraday trading strategies or longer-term approaches based on market volatility.
Customization Options:
Users can adjust the standard deviation values, profit target, and time gap to tailor the strategy to their specific trading style and market conditions.
Note: As with any trading strategy, it is important to conduct thorough backtesting and analysis before live trading. Market conditions can change, and past performance does not guarantee future results.
VWAP-RSI Scalper FINAL v1Description
This script implements a robust, battle-tested intraday scalping strategy designed for prop firm challenges, funded trader programs, and serious futures scalpers.
It combines VWAP, RSI, EMA trend, and ATR-based risk management to capture high-probability mean reversion and momentum moves during the most liquid hours of the trading day.
Core Logic
RSI (Relative Strength Index):
Trades are triggered when the RSI is either oversold or overbought using a short lookback (default: 3). This ensures only the strongest intraday reversals or exhaustion moves are considered.
VWAP Filter:
Longs are only taken above VWAP, shorts only below VWAP, aligning trades with the session’s dominant bias.
EMA Filter:
Additional trend quality filter—longs require price above EMA, shorts below EMA.
Session Control:
Only trades between user-defined session hours (default: US cash session), eliminating overnight/illiquid action.
ATR-based Dynamic Stops & Targets:
Every trade uses a stop loss at 1x ATR and a take profit at 2x ATR for a positive risk/reward ratio.
Max Trades Per Day:
Prevents overtrading and controls risk exposure (default: 3).
Performance (Sample Backtest)
Profit Factor: 1.37+ (prop-firm quality)
Drawdown: <1% (very conservative risk)
Win Rate: 37–48% (RR > 1, so high edge)
Consistency: Smooth, steady equity curve over hundreds of trades.
Best For:
ES/NQ/CL/GC intraday traders
Prop firm evaluation challenges (Tradeify, Topstep, Apex, etc.)
Anyone needing robust, no-nonsense systematic edge for futures or indices.
How to Use & Tune
Apply to 3min, 5min, or 15min charts of liquid futures or indices.
Change parameters in the settings panel to suit your asset, volatility, or session hours.
Use “Strategy Tester” to validate P&L, win rate, and drawdown.
How to Optimize
Raise/lower RSI length or bands to make signals more/less frequent.
Adjust stop/target multiples for your preferred risk/reward profile.
Change session hours to match your broker or market.
Disclaimer
This is not financial advice. Use on a demo or sim account first. Results will vary by market, slippage, and execution speed. Past performance does not guarantee future results.
If you find this useful, please give it a like, follow for more strategies, and comment your results or questions!
Good luck and safe trading!

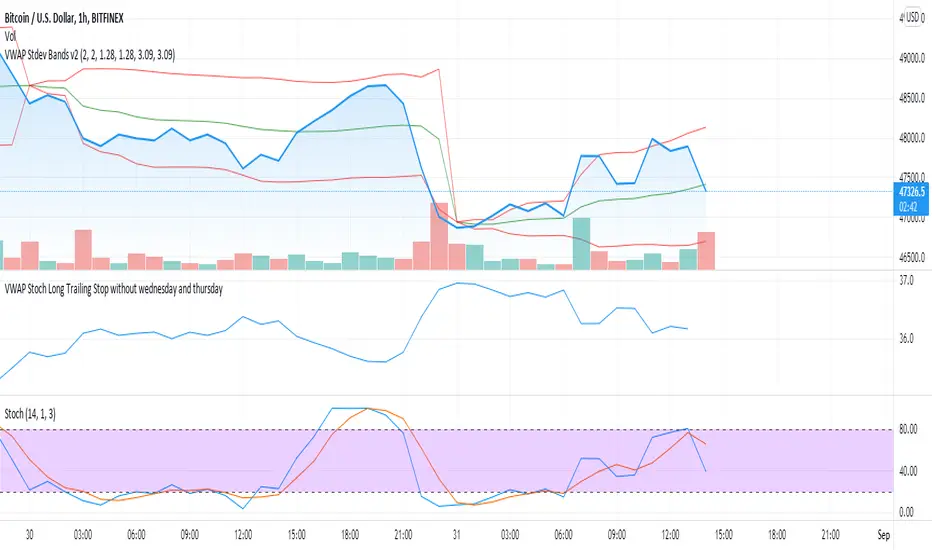
VWAP Stoch Long Trailing Stop without wednesday and thursdaySimple trading strategy based on VWAP and Stochastic indicators and a 3% trailing stop.
After backtesting, wednesdays and thursdays seemed to be bad entry days so they are blacklisted.
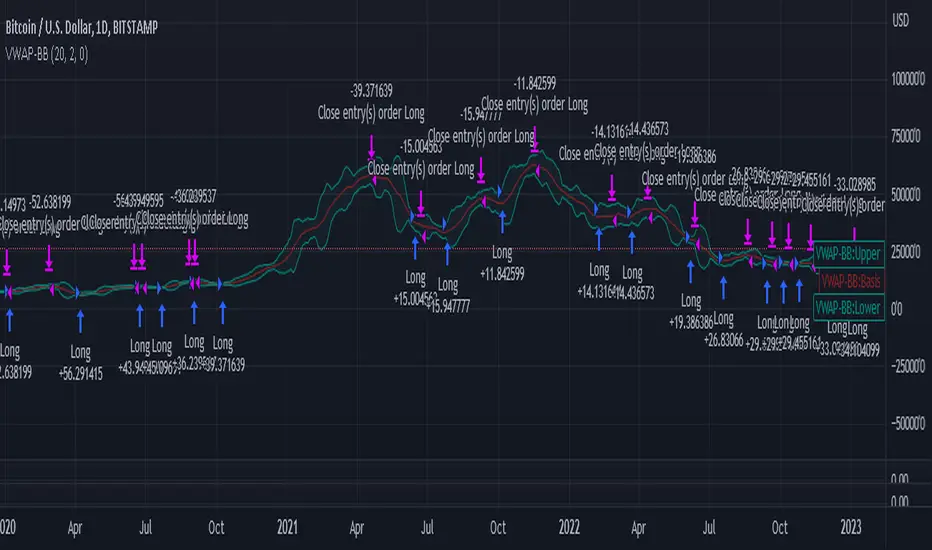
VWAP-Bollinger BandsThis script uses Bollinger bands but with a VWAP as the source, it uses the high crossing the upper band as a buy signal and a low crossing the lower band as a sell signal
Its default settings are for a day chart - Crypto 30 periods, forex 24 periods and stocks 20 periods, which basically line up with a month per asset class
ive seen good results in crypto and stocks, settings used between1% and 10% equity per trade with a 0.1% fee which lines up with Binance fee structure and $25 per trade which lines up with Commsec on the ASX
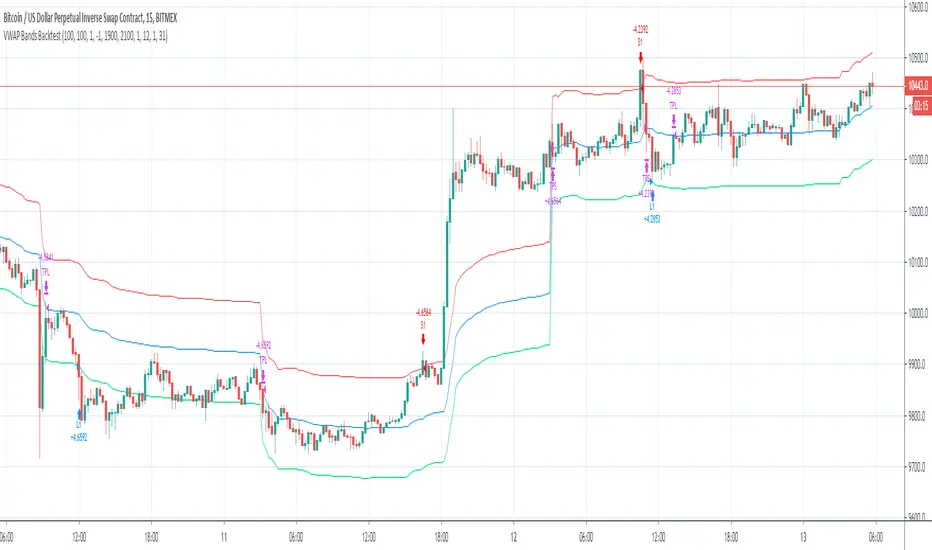
VWAP Bands BacktestThis is a backtest for evaluating the profitability of a vwap offsets strategy over time.
I took part of the code to create the script from Noro
So there is a link for its code