Short in Bollinger Band Down trend (Weekly and Daily) // © PlanTradePlanMM
// 6/14/2020
// ---------------------------------------------------
// Name: Short in Bollinger Band Down trend (Weekly and Daily)
// ---------------------------------------------------
// Key Points in this study:
// 1. Short in BB Lower band, probability of price going down is more than 50%
// 2. Short at the top 1/4 of Lower band (EMA - Lower line), Stop is EMA, tartget is Lower line; it matches risk:/reward=1:3 naturally
//
// Draw Lines:
// BB Lower : is the Target (Black line)
// BB EMA : is the initial Stop (Black line)
// ShortLine : EMA - 1/4 of (Stop-target), which matches risk:/reward=1:3
// Prepare Zone : between EMA and ShortLine
// shortPrice : Blue dot line only showing when has Short position, Which shows entry price.
// StopPrice : Black dot line only showing when has Short position, Which shows updated stop price.
//
// Add SMA50 to filter the trend. Price <= SMA, allow to short
//
// What (Condition): in BB down trend band
// When (Price action): Price cross below ShortLine;
// How (Trading Plan): Short at ShortLine;
// Initial Stop is EMA;
// Initial Target is BB Lower Line;
// FollowUp: if price moves down first, and EMA is below Short Price. Move stop to EMA, At least "make even" in this trade;
// if Price touched Short Line again and goes down, new EMA will be the updated stop
//
// Exit: 1. Initial stop -- "Stop" when down first, Close above stop
// 2. Target reached -- "TR" when down quickly, Target reached
// 3. make even -- "ME" when small down and up, Exit at Entry Price
// 4. Small Winner -- "SM" when EMA below Entry price, Exit when Close above EMA
//
// --------------
// Because there are too many flags in up trend study already, I created this down trend script separately.
// Uptrend study is good for SPY, QQQ, and strong stocks.
// Downtrend Study is good for weak ETF, stock, and (-2x, -3x) ETFs, such as FAZ, UVXY, USO, XOP, AAL, CCL
// -----------------------------------------------------------------------------------------------------------------
// Back test Weekly and daily chart for SPY, QQQ, XOP, AAL, BA, MMM, FAZ, UVXY
// The best sample is FAZ Weekly chart.
// When SPY and QQQ are good in long term up trend, these (-2x, -3x) ETFs are always going down in long term.
// Some of them are not allowed to short. I used option Put/Put spread for the short entry.
//
在腳本中搜尋"weekly"

Buy in Bollinger Band uptrend (Weekly and Daily) // © PlanTradePlanMM 6/14/2020
// ---------------------------------------------------
// Name: Buy in Bollinger Band uptrend (Weekly and Daily)
// ---------------------------------------------------
// Key Points in this study:
// 1. Long in BB Upper band, probability of price going up is more than 50%
// 2. Buy at the bottom 1/4 of upper band (Upper line - EMA), Stop is EMA, tartget is Upper line; it matches risk:reward=1:3;
//
// Draw Lines:
// BB Upper : is the Target (Black line)
// BB EMA : is the initial Stop (Black line)
// BuyLine : EMA20 + 1/4 of (Target-Stop), which matches risk:/reward=1:3 naturally
// Prepare Zone : between EMA and BuyLine
// buyPrice : Blue dot line only showing when has long position, Which shows entry price.
// StopPrice : Black dot line only showing when has long position, Which shows updated stop price.
//
// Add SMA(50) to filter the trend. Price >= SMA, allow to long
//
// What (Condition): in BB uptrend band
// When (Price action): Price cross over BuyLine;
// How (Trading Plan): Buy at BuyLine;
// Initial Stop is EMA;
// Initial Target is BB Upper Line;
//
// FollowUp: if price moves up first, and the EMA is higher than Entry point, Use EMA as new stop. At least "make even" in this trade;
//
// Exit: 1. Initial stop -- "Stop" when down first, close below stop price.
// 2. Target reached -- "TR" when up quickly, Target reached
// 3. make even -- "ME" when small up and down, Exit at entry Price
// 4. Small Winner -- "SM" when EMA above Entry price, Exit when close below EMA, and higher than entry Price
//
// --------------
// Because there are too many flags in up trend study already, I will create a down trend script separately.
// Uptrend study is good for SPY, QQQ, and strong stocks.
// Downtrend Study is good for weak ETF, stock, and (-2x, -3x) ETFs, such as FAZ, UVXY, USO, XOP, AAL, CCL
// -----------------------------------------------------------------------------------------------------------------
// Back test Weekly and daily chart for SPY, QQQ
// If it will be a big Gap down or a big down move, stop at close price could be a big loss; But this way could avoid may noise, to stay in a trending position longer.
// When buy in trending move, the position could be hold for a big range.
// The best samples are SPY and QQQ daily chart.
//
// Better to use another way to verify the long term up trend first.
// For single stock, it is better shows more relative strength than SPY.

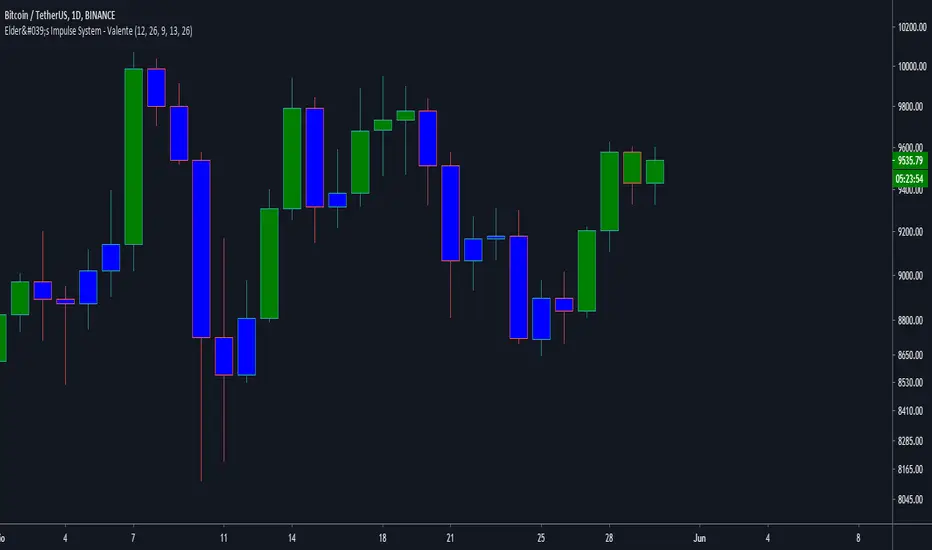
Elder's Impulse System with weekly EMA Filter - ValenteThis indicator was based on the Elders Impulse System by astraloverflow.
The only difference is that I included the weekly EMA26 as a filter and you can plot it on the graph if you want (unchecking the Weekly EMA26 won't turn the filter off, will only stop plotting it).
The indicator works this way:
When the MACD Histogram is growing UP, the EMA13 is pointing UP AND the Weekly EMA26 is pointing UP, the bar is Green
When the opposite is true, the bar is Red.
When any condition from both green and red is not true, the bar is blue.
In my opinion, this particular indicator works better on the D1 time frame. I recommended using the original one, by astraloverflow for other time frames.
I hope it is useful!
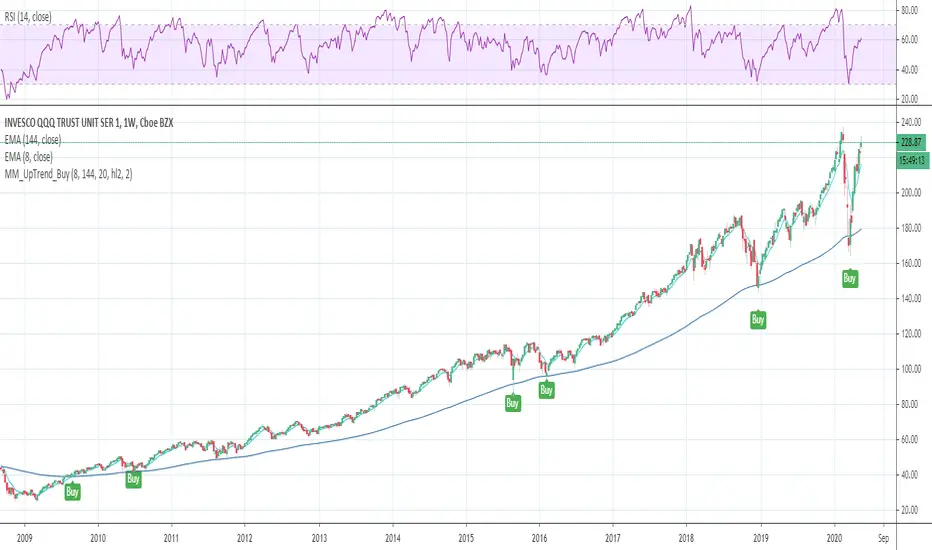
Buy in long term uptrend (Weekly and Daily)Condition: in uptrend, EMA8 > EMA144 (User can change the EMA# from input);
Price Action: (Price crossover EMA144) or (price touched EMA144 and close above it);
Trading Plan: Buy at close or next open; Initial Stop below EMA144;
No Exit strategy in this study, trader needs to move stop by other rules; such as, uptrend line break;
Back test Weekly and daily chart for SPY, QQQ, TLT, GLD, IWM, XLF, XLK, XOP, GS, IBM, APPL, CAT, LVS
1. When side way move or price From uptrend to Down trend, Entry could be stopped quickly with small loss;
2. When buy in trending move, the position could be hold for few years.
The best sample is QQQ weekly chart.
This is my first tradingview script. I created this script file and tested in one week.
Maybe, this script is too simple, other people published similar code already; Sorry, I didn't Check that yet.
Daily Weekly Monthly Yearly OpensThis script plots the current daily, weekly and monthly opens (all enabled by default).
Here are some additional info about the drawing behavior:
Daily open is shown only on intraday timeframes
Weekly open is shown only on timeframes < weekly
Monthly open is shown only on timeframes < monthly
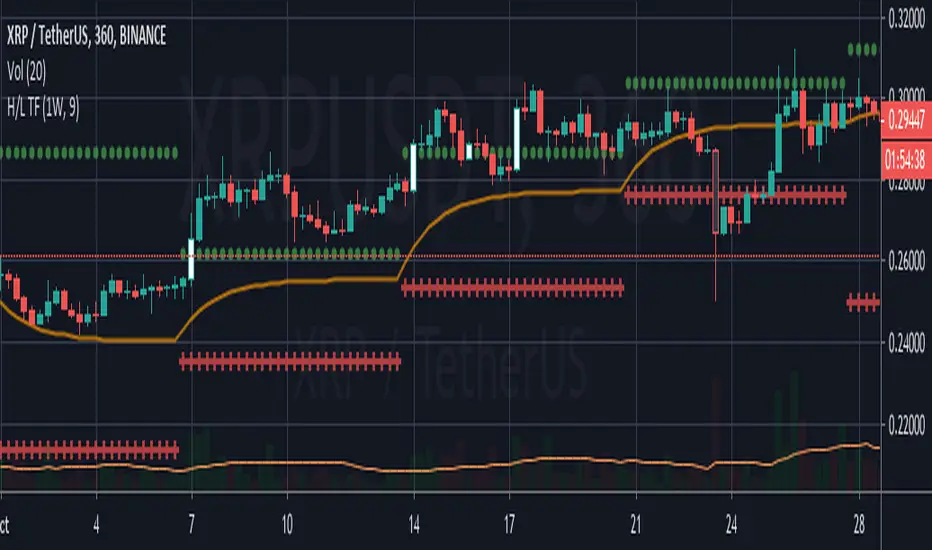
High/Low Weekly TimeframeI'm testing a simple but useful indicator that plots the high and low for the current week. The time-frame can be selected by the user.
It's useful when you're trading in a smaller time-frame (example: 1H or 4H) to know exactly the weekly low and high, and whether the price breaks above or below this price lines.
This indicator allows you:
- To select the desired time-frame to get the Low and High.
- To print an optional EMA for the same time-frame.
- To optionally change the bar-color when the close price crosses above the weekly high or crosses below the weekly low.
Hope this helps you to visually identify price movements.
If you like this script please give me a like and comment below.
Thanks,
Rodrigo
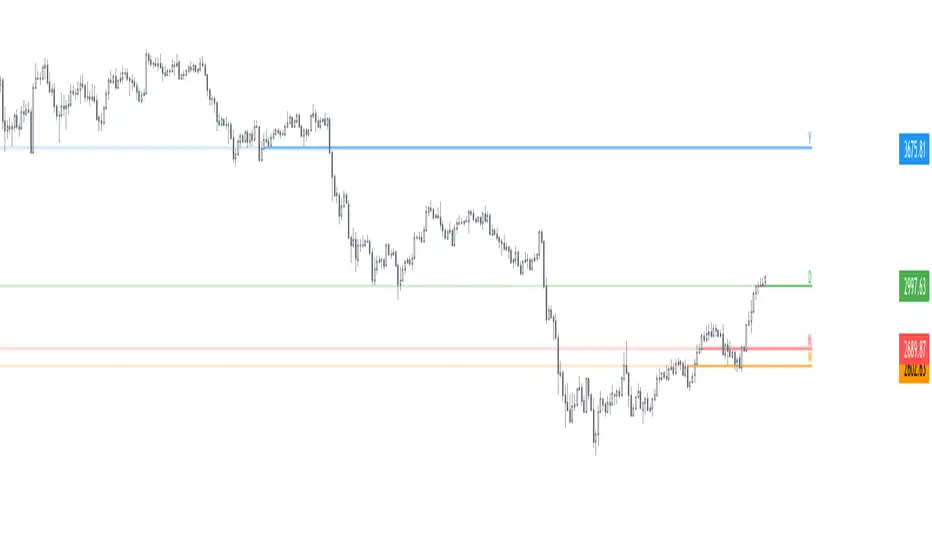
Iconik Trading Suite: Auto Support/Resistance - WeeklyAutogeneration of support and resistance lines. Posts a horizontal line of the open/close for the past 40 weekly candles.
DM for a PowerPoint describing this indicator and the rest of Iconik in detail.
Iconik Trading Suite Indicator List:
ITS-OSC: Oscillators (v2)
ITS-PAA: Price Action Alerts (v2)
ITS-ASR: Auto Support/Resistance
-> Daily (v2)
-> 3 Day (v2)
-> Weekly (v2)
ITS-4TFC: 4 Time Frame Confirmation (v1)
ITS-DIV: Divergence Seeker (v1)

CSA 5-Step Daily & Weekly ATR18-09-2019
The CSA 5-Step Daily & Weekly ATR will plot the Daily and Weekly ATR despite the time frame selected.
Daily = White
Weekly = Yellow

Investing - Weekly EMA's mapped to Daily ChartWhen there isn't enough time in your day to day-trade, yet you want to utilise all the technical analysis skills you have... why not make a long term investing or swing trading indicator set to help you along the way!
So I did....
When it comes to long term investing and swing trading, I often find the weekly 12/26/52 EMA's do a great job in capturing the main market swings from bull to bear.
However, I like to use the Daily chart to see the candle patterns and shapes with more detail and divergences often show up better on the daily chart.
So I have decided to combine the two!
I have basically taken the EMA 12/26/52 from the weekly and transferred them over to the daily (mathematically they are not exact, but for me they are close enough).
I have also developed a simple scale in / scale out strategy for using these exponential moving averages. It isn't as simple as buying in on each signal, however I use my own special strategy to take advantage of the alerts.
Enjoy!

Reset Every (Price)Someone requested a high/low price indicator that would reset the "remembered" prices daily. I started out doing just that, and then decided to make it much more configurable.
Choose the units (minutes, hours, days, weeks, months) and the number of those units, and this will reset the highest/lowest value remembered to the current values on your chosen time interval.
This should work with any time interval you desire, within reason...asking for resets every 4000 hours on a monthly chart will probably not work.
GE, monthly, every 7 months:
Ford, weekly, every 18 months:
Dow Jones Industrial Average, weekly, every 90 days:
LTCBTC, daily, every 10 days:
ETHUSD, 30 minutes, every 10 days:
BTCUSD, 1 minute, every 10 hours:
EURUSD, 1 minute, every 50 minutes:
Also, I am about to publish another version of this with just one source input that can be applied to any indicator...stay tuned!

Code Plots - High, Low, Open, Close—Daily, Weekly, & Monthly!!!Custom Code Plots High, Low, Open, Close
Plots Today And/Or Previous Day
Daily, Weekly, & Monthly TimeFrames
Default Settings:
Green = High
Silver = Open
Fuchsia = Close
Red = Low
Current D-W-M = Circles as Plots
Previous D-W-M = Cross as Plots
By Default The Current Days High, Low, Open, Close Plots. There are Check boxes On The Inputs Tab To Turn All Options On And Off.
***Tip - For Intra-Day Trades…I Find It Useful To Plot Previous Days High, Low, Open, Close For Support/Resistance, & Breakout Levels. Plotting the Current Weekly and Monthly Levels Is Also Very Useful.
***If You Trade Daily Charts The Previous Months Levels Are Very Useful as Support/Resistance, & Breakout Levels….
Code For High, Low, Open, Close
pastebin.com
Video On Importing Custom Indicators from PasteBin:
videos.tradingview.com

Multi-Timeframe RSI (Daily + Weekly)View the Daily and Weekly RSI together so you see how the oscillate on any timeframe

Gann Square (Weekly) + Auto-Fit Helper v6Helps show best fit for the Gann Square on the weekly log scale chart

Current High-Low - daily weekly and monthlythis isdicator marks your daily weekly and monthly high and low

PDH PDL PWH PWL + IMB 15m / 1H / 4H + Weekly LogicPDH PDL PWH PWL indycators
weekly indycators automaticly generated.
for a every week

NeuralFlow Forecast Levels | SPY WeeklyThis is a companion script that plots AI-adaptive market equilibrium & expansion mapping levels for SPY on chart.
NeuralFlow Forecast levels are generated though a Artificial Intelligence framework trained to identify where price is statistically inclined to re-balance and where expansion zones historically exhaust rather than extend.
What the Bands Represent
Band Layer Meaning
AI Equilibrium (white core) Primary weekly balance zone where price is most likely to mean-revert
Predictive Rails (aqua / purple) High-confidence corridor of institutional flow containment
Outer Zones (green / red) Expansion limits where continuation historically decays
Extreme Zones (top/bottom) Rare deviation envelope where auction completion is statistically favored
NeuralFlow operates Artificial Intelligence models trained specifically to map statistical re-balancing behavior, not trader predictions or sentiment. No discretionary drawing. No correlations. No lagging overlays.
This engine updates only when underlying structure changes — not when candles fluctuate intraday.
Risk:
Educational & analytical use only. Not financial advice

NeuralFlow Forecast Levels| NIFTY WeeklyThis is a companion script that plots AI-adaptive market equilibrium & expansion mapping levels on chart.
NeuralFlow Forecast levels are generated though a Artificial Intelligence framework trained to identify where price is statistically inclined to re-balance and where expansion zones historically exhaust rather than extend.
What the Bands Represent
Band Layer Meaning
AI Equilibrium (white core) Primary weekly balance zone where price is most likely to mean-revert
Predictive Rails (aqua / purple) High-confidence corridor of institutional flow containment
Outer Zones (green / red) Expansion limits where continuation historically decays
Extreme Zones (top/bottom) Rare deviation envelope where auction completion is statistically favored
NeuralFlow operates Artificial Intelligence models trained specifically to map statistical re-balancing behavior, not trader predictions or sentiment. No discretionary drawing. No correlations. No lagging overlays.
This engine updates only when underlying structure changes — not when candles fluctuate intraday.
Risk:
Educational & analytical use only. Not financial advice

ATR Daily & Weekly With Stop Buffer this script shows Daily & Weekly ATR and also add 10% Stop buffer calculation so you can add stop loss.

Session Levels (Daily & Weekly Targets)This indicator provides market structure and contextual reference only. It does not generate trade signals, entries, or trading advice.
Plots rolling previous daily and weekly highs/lows as potential target levels. Levels automatically remove once touched (including wicks). Default visibility is NY session with optional toggles for London and Asia. Designed for intraday structure, confluence, and target identification.

3x EMA Strategy (Weekly)Based on certain conditions between multiple Exponential Moving Averages on a weekly timeframe, the chart is highlighted in either red/green.

Key Levels: Monday / Weekly / Monthly + Year/Quarter + LiquidityKey Levels: Monday / Weekly / Monthly / Year / Quarter + Liquidity

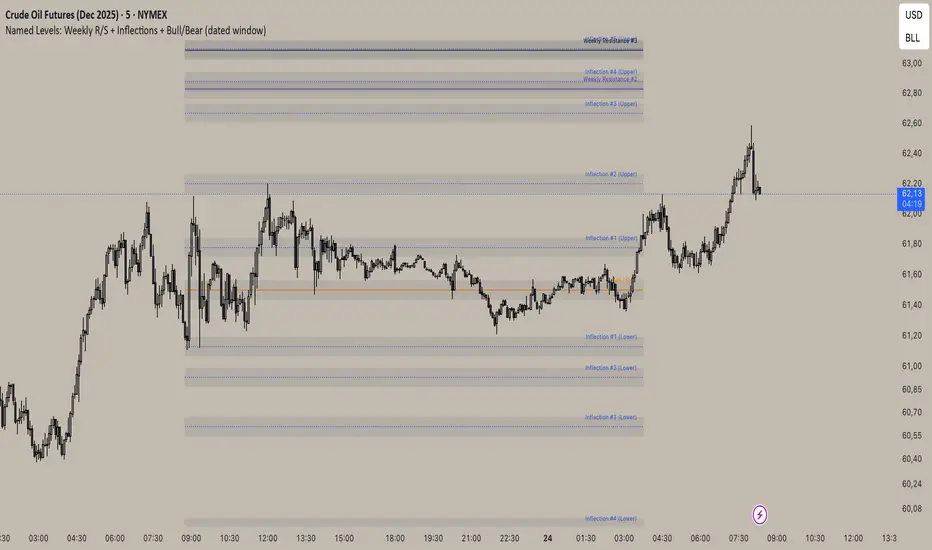
Inflection/ Bull Bear/ Weekly R&S VisualizerDisplay: Weekly Support/ Resistance, Inflection Levels, Bullbear
Adjust: Line Color, strength, style, opacity
Add: Zone around Inflection Level
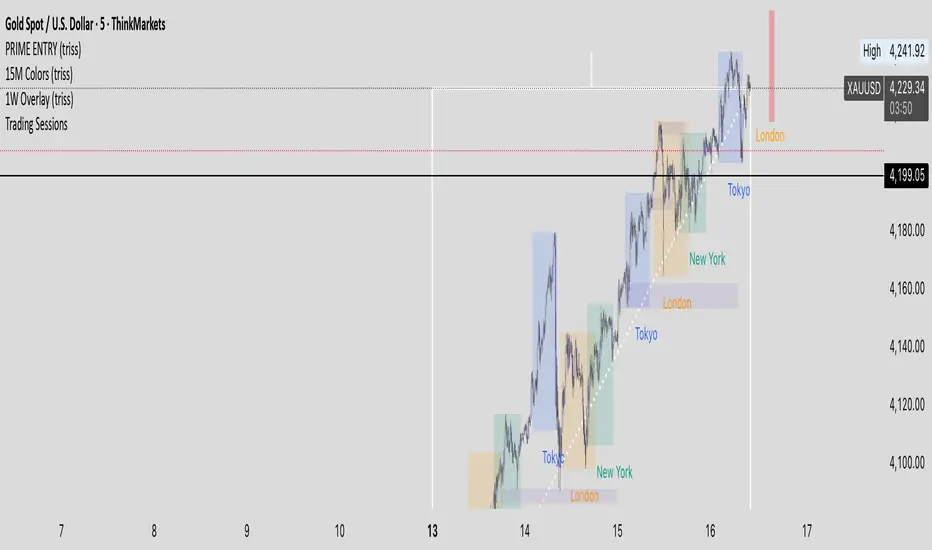
1W Overlay (triss)Overlay of the Weekly candle, simple one color with a line inside the candle to show direction.