Multi Range VWAP PivotsMulti Range VWAP Pivots turned out to be one of my most accurate pivot indicators to date!
Multi Range VWAP Pivots works by recognizing the high and low of the timeframe selected (D, W, M, 6M, and 12M) and plotting range high to VWAP averages and range low to VWAP averages.
After further examination of each completed range, I came to the conclusion that due to the nature of averages, high and low respectively would need to be completed within the current range, for the averages to actually display pivots correctly. This means that if all averages appear to be "pivoting" correctly after or during a break lower of higher, then we can only assume the most recent break higher or lower could be exhaustion and price will be reverted to the mean (VWAP). OR, this could be the most accurate hindsight indicator on the planet.
*DISCLAIMER*: This indicator repaints. DO NOT backtest or set alerts with this indicator.
在腳本中搜尋"weekly"

Privious Day and Week ValuesThis indicator is designed for price action. It divides the price range in to four zones based on last week values. Besides, it shows yesterday highest and lowest values. The price usually shows reactions to the drawn horizontal lines!
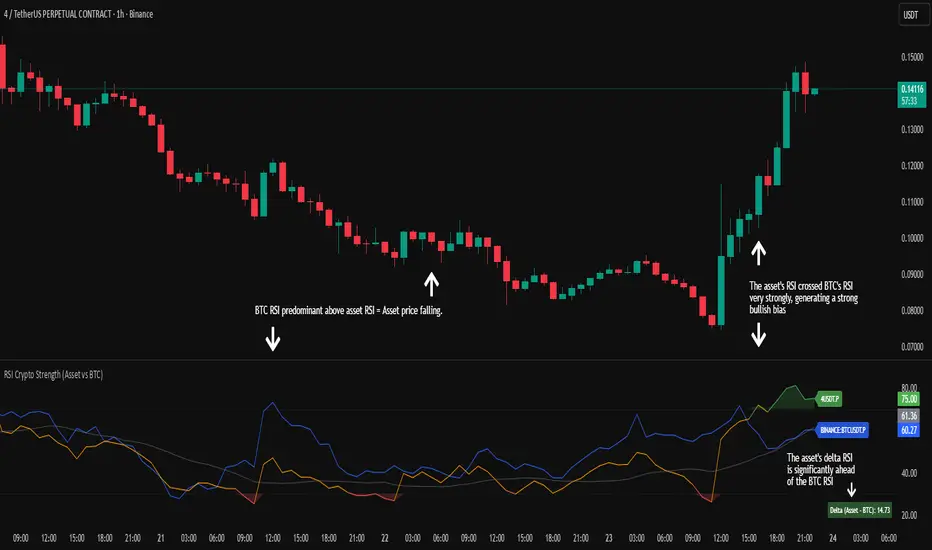
RSI Crypto Strength (Asset vs BTC)The "RSI Crypto Strength" is an advanced analysis tool built on a fundamental pillar of the cryptocurrency market: for an altcoin to achieve exponential bullish performance, it must invariably be and remain stronger than Bitcoin itself.
The primary objective of this indicator is to quantify and reinforce this thesis. It provides a clear and immediate view of the relative strength of any cryptocurrency in direct comparison with the market leader, Bitcoin. This relative strength can be identified on any timeframe. This also reinforces a scenario where a cryptocurrency that is weaker than Bitcoin is prone to sideways movements and downturns.
Key Features
This indicator combines multiple tools into a single solution:
> Dual RSI Plot: Simultaneously visualizes the RSI of the asset on the chart (dynamic) and the RSI of Bitcoin (blue line).
> Strength Delta (Asset vs. BTC): The heart of the indicator. A panel displays the exact difference (Asset RSI - Bitcoin RSI).
- Green: The asset has more RSI strength than Bitcoin.
- Red: The asset has less RSI strength than Bitcoin.
> Dynamic Coloring and Area Fill: The asset's RSI line and the background area automatically change color to highlight critical zones:
- Green (Overbought): RSI above 70.
- Red (Oversold): RSI below 30.
- Orange (Neutral): RSI between 30 and 70.
> Integrated Moving Average: A Moving Average line (gray) is plotted directly on the asset's RSI, serving as a signal line or to smooth momentum. The type (SMA, EMA, WMA, etc.) and period are fully customizable.
> Multi-Timeframe (MTF) Support: You can configure the indicator to display data from a higher timeframe (e.g., "1H") while analyzing a lower timeframe chart (e.g., "5m").
> Customizable Panel and Labels:
- A Delta Panel that can be enabled/disabled and moved to any of the four corners of the indicator.
- Labels at the end of the lines (Asset, BTC, MA) for easy identification, which can also be enabled/disabled.
> Alert-Ready: The indicator exposes the 4 main data sources for creating alerts.
How to Use
> Thesis Validation (Higher Timeframes): This is the primary use. Before looking for entries, use the indicator on timeframes like the H4, Daily, or Weekly. Confirm that the Asset (orange/green line) is consistently above Bitcoin (blue line) and that the Delta is positive. This is your structural strength validation, confirming the asset has potential for an exponential rally.
> Delta Analysis: The "Delta (Asset - BTC)" panel is your immediate strength metric. A positive and rising value indicates the asset is outperforming Bitcoin. A negative and falling value indicates relative weakness.
> Line Crossovers (Timing): On lower timeframes, watch for crossovers between the Asset line and the Bitcoin line. A cross of the Asset line above the Bitcoin line is a clear sign that the asset's momentum is gaining strength.
> Signal Confluence: Look for high-probability scenarios. For example: The Asset's RSI crosses above the Bitcoin RSI while the Delta also crosses above 0.
> Market Extremes: Use the area fill to quickly identify when the asset reaches extreme overbought (>70) or oversold (<30) levels, regardless of what Bitcoin is doing.
Alerts
This indicator is fully prepared for alert creation. When setting up an alert in TradingView, you can select the following data sources from this indicator:
> RSI Asset: Alerts on the RSI value of the asset on the chart.
> RSI Bitcoin: Alerts on the RSI value of Bitcoin.
> Moving Average: Alerts on the value of the Moving Average.
> RSI Delta: Allows creating alerts based on the difference between the two. (e.g., "Alert if RSI Delta crosses above Value 0").
Settings (Inputs)
The indicator offers full customization:
> RSI Length: The calculation period for both RSIs (default 14).
> Indicator Timeframe: Enables Multi-Timeframe functionality.
> Bitcoin Ticker: Allows changing the Bitcoin reference ticker.
> MA Settings: Choose the MA Type (SMA, EMA, WMA, VWMA, etc.) and its period.
> Panels and Labels: Toggles to enable/disable the Delta Panel and Line Labels, plus a selector for the panel's location.
> Colors: All line and highlight colors are fully customizable in the settings.
DISCLAIMER: This script is an analysis tool and does not provide financial advice. All trades carry risk. Use this tool as part of a broader trading strategy and always practice good risk management.
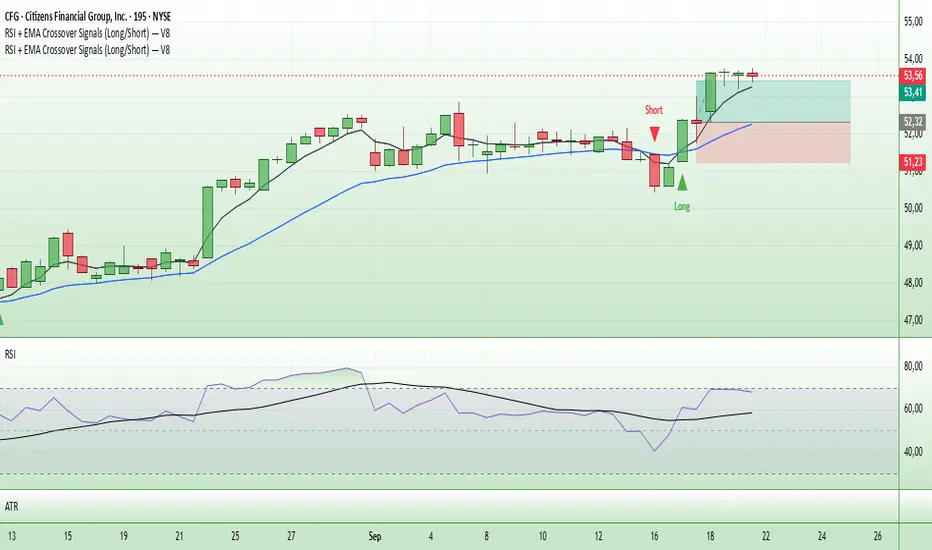
Entry Signals (Long/Short)The indicator visualizes precise entry signals for long and short setups directly on the price chart. Long is marked with a green triangle-up, short with a red triangle-down. To contextualize trend structure, the Fast EMA (5) is plotted in black and the Slow EMA (20) in blue (line width 1). Signals print only at bar close for reproducible execution. Applicable across all timeframes—ideal for top-down analysis from the 195-minute chart through daily to weekly.
Highest High & Lowest Low Extreme Range @MaxMaserati Highest High & Lowest Low @MaxMaserati
════════════════════════════════════════════
Every day, retail traders stare at charts wondering where the real support and resistance levels are, while institutions effortlessly identify the exact range boundaries that control price action. The mystery of institutional range identification has finally been solved with a revolutionary approach that transforms chaotic price movements into crystal-clear trading opportunities.
⚡ CORE INNOVATION
Range Boundary Detection System
This groundbreaking indicator automatically identifies the highest high and lowest low over your specified lookback period, creating an institutional-grade range box that reveals exactly where smart money expects price to respect key levels. No more guessing where the real boundaries are.
Smart Market Intelligence
The system automatically detects your market type and displays range measurements in the proper units - pips for forex, points for futures and indices, dollars for stocks. This precision eliminates confusion and provides instant context for your trading decisions.
Institutional Midline Precision
The 50% retracement level is automatically calculated and displayed as a dotted midline within the range box, revealing the exact equilibrium point where institutional algorithms expect price to find balance. This is where the smart money often makes their move.
Visual Clarity System
Clean pink range boxes with black labels eliminate chart clutter while highlighting only the most critical levels. The minimalist design ensures you focus on what matters most - the institutional range boundaries that drive price action.
Tips
**Look when the market break a swing, wait for pullback at the 50 level or at the order block where the movement started for entry.
**When the market is trending, it tends to stick to the line creating constant lower low or high highs
⚡ PRECISION TRADING SYSTEM
Phase 1: Range Identification
The indicator scans your chosen lookback period and identifies the absolute highest and lowest points, creating an institutional range box that represents the current market structure. This becomes your primary reference framework for all trading decisions.
Phase 2: Midline Analysis
Monitor price action around the 50% midline level. Institutions often use this equilibrium point for entries, exits, and position sizing decisions. When price approaches this level, heightened attention is required.
Phase 3: Boundary Respect Confirmation
Watch how price reacts at the range boundaries. Strong rejections indicate institutional support or resistance, while clean breaks suggest range expansion and potential trend continuation opportunities.
Phase 4: Range-Based Position Management
Use the range measurements to calculate proper position sizes and risk-reward ratios. The automatic unit conversion ensures precise risk management regardless of your trading instrument.
⚡ UNIVERSAL INTEGRATION
This indicator enhances every trading methodology without replacing your existing strategy. ICT traders use it to identify premium and discount ranges. SMC analysts leverage it for market structure confirmation. Supply and demand traders utilize it for zone validation. Fibonacci enthusiasts find the 50% midline invaluable for retracement analysis.
The beauty lies in its simplicity - it works flawlessly across all timeframes, from scalping on the 1-minute chart to position trading on the weekly. Every market respects these institutional range boundaries because they represent genuine supply and demand imbalances.
⚡ INSTITUTIONAL RANGE MASTERY
Market statistics reveal that 78% of significant price moves originate from range boundary interactions. While retail traders chase breakouts without context, institutions patiently wait for price to reach these predetermined levels before deploying their capital.
Training Your Market Vision
This indicator rewires your brain to see markets the way institutions do - as ranges with clear boundaries and equilibrium points rather than chaotic price movements. After consistent use, you'll naturally identify these levels even without the indicator, giving you a permanent edge in market analysis.
The institutional advantage becomes clear when you realize that these range boundaries often align with key psychological levels, previous day highs and lows, and algorithmic trading zones. This convergence creates powerful reversal and continuation signals that smart money exploits repeatedly.
Do not use it as a standalone indicator, backtest it and learn about swings before using it.
Compatible with: Forex | Stocks | Crypto | Futures | Indices
No Repainting | Real-Time Alerts | Multi-Timeframe Analysis

Custom Open Price LinesThis indicator allows you to plot up to 20 fully customizable horizontal lines based on the opening price of any specific time of day.
It's designed to mark key intraday levels like session opens, news event times, or any other important moment in the trading day with precision and clarity.
Key Features
20 Custom Lines: Configure up to 20 independent lines, each triggered at a specific time you define. Complete Visual Control: For each of the 20 lines, you can individually customize:
Start Time: The exact time to capture the opening price (e.g., 09:30).
Label Text: A custom name for the line's label (e.g., "RTH Open").
Color, Style & Width: Full control over the line's appearance (color, solid/dotted/dashed, thickness).
Label Size: Adjust the text size for readability.
Individual Cutoff Times: Each line has its own unique "Cutoff Time," allowing you to define precisely when it should stop extending for the day. For example, a 9:30 AM line can be set to stop drawing at 4:00 PM.
Session Master Toggles: Use the three "Master Toggles" (e.g., London, NY AM, NY PM) to act as a filter. A custom line will only appear on the chart if its start time falls within one of the master sessions that you have enabled. This lets you quickly show or hide groups of lines based on the current trading session.
Lookback Control: Choose how many previous days to display the lines for, or select "Unlimited" to show them on all visible historical data.
Timeframe Filter: Set a maximum chart timeframe (e.g., 45 minutes) on which the lines will be visible, preventing clutter on higher timeframes like Daily or Weekly.

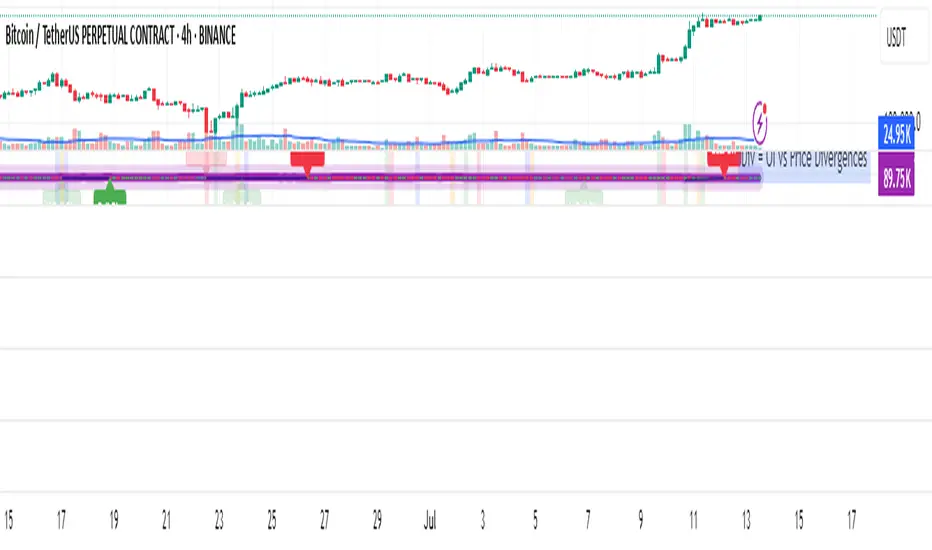
OI Analysis (Smoothed + Pivots + OI Divergence)Description
OI Pivot & Divergence Explorer is a multi-tool indicator for TradingView that blends Open Interest (OI) analysis with price action pivots and OI–price divergences. It helps you:
Visualize OI Trends: A thick, semi-transparent “glow” line shows smoothed OI changes, with a crisp center line for exact values.
Shade Momentum Scenarios: Background highlights flip between four market states—High Conviction, Squeeze, Bear Pressure, Liquidation—based on the confluence of price direction and OI spikes.
Detect Pivot Levels: Internally computes classic pivots on the OI series to mark potential turning points.
Spot OI-Price Divergences: Draws both regular and hidden bullish/bearish divergences between price pivots and corresponding OI pivots, connecting them with colored lines and labeling high-probability reversal setups.
Custom Alerts: Triggers alert conditions for each divergence type, so you can get notified of potentially actionable setups in real time.
Logic & Features
Inputs
Pivot Lookback (default 5): Number of bars on each side to qualify a pivot in both price and OI.
OI Change Smoothing (default 3) & OI Average Length (default 20): Control smoothing of raw OI delta and define the average band for threshold comparisons.
OI Change Threshold (%) (default 0.2%): Minimum relative OI change required to flag a “big” move.
Show OI Divergences (toggle on/off): Enable or disable drawing divergence lines and labels.
Scenario Shading
Computes raw OI delta → smoothed OI delta → compares against average OI.
Combines with price direction (up/down) to classify four states:
↑Price + ↑OI → High Conviction (green)
↑Price + ↓OI → Squeeze (orange)
↓Price + ↑OI → Bear Pressure (red)
↓Price + ↓OI → Liquidation (blue)
Shades the chart background only when the state flips.
Pivot Markers
Finds pivots on the OI series using the same lookback as price pivots.
(Pivot labels are removed from the visible pane; pivots now serve divergence logic.)
OI-Price Divergences
Regular Bullish: Price makes a lower low while OI makes a higher low.
Hidden Bullish: Price makes a higher low while OI makes a lower low.
Regular Bearish: Price makes a higher high while OI makes a lower high.
Hidden Bearish: Price makes a lower high while OI makes a higher high.
Connects each pivot pair with a thin line:
Regular uses dark navy
Hidden uses a lighter blue
Labels each divergence (“Bull Div,” “H Bull Div,” etc.) above or below the OI line for clarity.
How to Use
Add to Chart:
Open Pine Editor → paste the script → Save → “Add to Chart.”
Configure Inputs:
Adjust Pivot Lookback to match your timeframe: shorter (3–5) for intraday, longer (8–12) for daily/weekly.
Tweak OI Change Threshold to filter out noise or capture more subtle OI shifts.
Interpretation:
Background Color: Quick read on whether OI is reinforcing or diverging from price.
Divergence Lines: Look for regular divergences as early reversal signals; hidden divergences often indicate trend continuation or strong pullback entry points.
Alerts: Set up custom alerts on “Regular Bullish OI Divergence,” etc., to get popup/messages/notifications.
Best Practices:
Combine with your favorite price-based indicators (e.g. RSI, VWAP) for confluence.
Validate divergence signals against higher-timeframe pivots to avoid false breakouts.
Use in trending markets for continuation trades (hidden divergences) and in range markets for reversal setups (regular divergences).
Uptrick: Universal Z-Score ValuationOverview
The Uptrick: Universal Z-Score Valuation is a tool designed to help traders spot when the market might be overreacting—whether that’s on the upside or the downside. It does this by combining the Z-scores of multiple key indicators into a single average, letting you see how far the current market conditions have stretched away from “normal.” This average is shown as a smooth line, supported by color-coded visuals, signal markers, optional background highlights, and a live breakdown table that shows the contribution of each indicator in real time. The focus here is on spotting potential reversals, not following trends. The indicator works well across all timeframes and asset classes, from fast intraday charts like the 1-minute and 5-minute, to higher timeframes such as the 4-hour, daily, or even weekly. Its universal design makes it suitable for any market — whether you're trading crypto, stocks, forex, or commodities.
Introduction
To understand what this indicator does, let’s start with the idea of a Z-score. In simple terms, a Z-score tells you how far a number is from the average of its recent history, measured in standard deviations. If the price of an asset is two standard deviations above its mean, that means it’s statistically “rare” or extended. That doesn’t guarantee a reversal—but it suggests the move is unusual enough to pay attention.
This concept isn’t new, but what this indicator does differently is apply the Z-score to a wide set of market signals—not just price. It looks at momentum, volatility, volume, risk-adjusted performance, and even institutional price baselines. Each of those indicators is normalized using Z-scores, and then they’re combined into one average. This gives you a single, easy-to-read line that summarizes whether the entire market is behaving abnormally. Instead of reacting to one indicator, you’re reacting to a statistically balanced blend.
Purpose
The goal of this script is to catch turning points—places where the market may be topping out or bottoming after becoming overstretched. It’s built for traders who want to fade sharp moves rather than follow trends. Think of moments when price explodes upward and starts pulling away from every moving average, volume spikes, volatility rises, and RSI shoots up. This tool is meant to spot those situations—not just when price is stretched, but when multiple different indicators agree that something is overdone.
Originality and Uniqueness
Most indicators that use Z-scores only apply them to one thing—price, RSI, or maybe Bollinger Bands. This one is different because it treats each indicator as a contributor to the full picture. You decide which ones to include, and the script averages them out. This makes the tool flexible but also deeply informative.
It doesn’t rely on complex or hidden math. It uses basic Z-score formulas, applies them to well-known indicators, and shows you the result. What makes it unique is the way it brings those signals together—statistically, visually, and interactively—so you can see what’s happening in the moment with full transparency. It’s not trying to be flashy or predictive. It’s just showing you when things have gone too far, too fast.
Inputs and Parameters
This indicator includes a wide range of configurable inputs, allowing users to customize which components are included in the Z-score average, how each indicator is calculated, and how results are displayed visually. Below is a detailed explanation of each input:
General Settings
Z-Score Lookback (default: 100): Number of bars used to calculate the mean and standard deviation for Z-score normalization. Larger values smooth the Z-scores; smaller values make them more reactive.
Bar Color Mode (default: None): Determines how bars are visually colored. Options include: None: No candle coloring applied. - Heat: Smooth gradient based on the Z-score value. - Latest Signal: Applies a solid color based on the most recent buy or sell signal
Boolean - General
Plot Universal Valuation Line (default: true): If enabled, plots the average Z-score (zAvg) line in the separate pane.
Show Signals (default: true): Displays labels ("𝓤𝓹" for buy, "𝓓𝓸𝔀𝓷" for sell) when zAvg crosses above or below user-defined thresholds.
Show Z-Score Table (default: true): Displays a live table listing each enabled indicator's Z-score and the current average.
Select Indicators
These toggles enable or disable each indicator from contributing to the Z-score average:
Use VWAP Z-Score (default: true)
Use Sortino Z-Score (default: true)
Use ROC Z-Score (default: true)
Use Price Z-Score (default: true)
Use MACD Histogram Z-Score (default: false)
Use Bollinger %B Z-Score (default: false)
Use Stochastic K Z-Score (default: false)
Use Volume Z-Score (default: false)
Use ATR Z-Score (default: false)
Use RSI Z-Score (default: false)
Use Omega Z-Score (default: true)
Use Sharpe Z-Score (default: true)
Only enabled indicators are included in the average. This modular design allows traders to tailor the signal mix to their preferences.
Indicator Lengths
These inputs control how each individual indicator is calculated:
MACD Fast Length (default: 12)
MACD Slow Length (default: 26)
MACD Signal Length (default: 9)
Bollinger Basis Length (default: 20): Used to compute the Bollinger %B.
Bollinger Deviation Multiplier (default: 2.0): Standard deviation multiplier for the Bollinger Band calculation.
Stochastic Length (default: 14)
ATR Length (default: 14)
RSI Length (default: 14)
ROC Length (default: 10)
Zones
These thresholds define key signal levels for the Z-score average:
Neutral Line Level (default: 0): Baseline for the average Z-score.
Bullish Zone Level (default: -1): Optional intermediate zone suggesting early bullish conditions.
Bearish Zone Level (default: 1): Optional intermediate zone suggesting early bearish conditions.
Z = +2 Line Level (default: 2): Primary threshold for bearish signals.
Z = +3 Line Level (default: 3): Extreme bearish warning level.
Z = -2 Line Level (default: -2): Primary threshold for bullish signals.
Z = -3 Line Level (default: -3): Extreme bullish warning level.
These zone levels are used to generate signals, fill background shading, and draw horizontal lines for visual reference.
Why These Indicators Were Merged
Each indicator in this script was chosen for a specific reason. They all measure something different but complementary.
The VWAP Z-score helps you see when price has moved far from the volume-weighted average, often used by institutions.
Sortino Ratio Z-score focuses only on downside risk, which is often more relevant to traders than overall volatility.
ROC Z-score shows how fast price is changing—strong momentum may burn out quickly.
Price Z-score is the raw measure of how far current price has moved from its mean.
RSI Z-score shows whether momentum itself is stretched.
MACD Histogram Z-score captures shifts in trend strength and acceleration.
%B (Bollinger) Z-score indicates how close price is to the upper or lower volatility envelope.
Stochastic K Z-score gives a sense of how high or low price is relative to its recent range.
Volume Z-score shows when trading activity is unusually high or low.
ATR Z-score gives a read on volatility, showing if price movement is expanding or contracting.
Sharpe Z-score measures reward-to-risk performance, useful for evaluating trend quality.
Omega Z-score looks at the ratio of good returns to bad ones, offering a more nuanced view of efficiency.
By normalizing each of these using Z-scores and averaging only the ones you turn on, the script creates a flexible, balanced view of the market’s statistical stretch.
Calculations
The core formula is the standard Z-score:
Z = (current value - average) / standard deviation
Every indicator uses this formula after it’s calculated using your chosen settings. For example, RSI is first calculated as usual, then its Z-score is calculated over your selected lookback period. The script does this for every indicator you enable. Then it averages those Z-scores together to create a single value: zAvg. That value is plotted and used to generate visual cues, signals, table values, background color changes, and candle coloring.
Sequence
Each selected indicator is calculated using your custom input lengths.
The Z-score of each indicator is computed using the shared lookback period.
All active Z-scores are added up and averaged.
The resulting zAvg value is plotted as a line.
Signal conditions check if zAvg crosses user-defined thresholds (default: ±2).
If enabled, the script plots buy/sell signal labels at those crossover points.
The candle color is updated using your selected mode (heatmap or signal-based).
If extreme Z-scores are reached, background highlighting is applied.
A live table updates with each individual Z-score so you know what’s driving the signal.
Features
This script isn’t just about stats—it’s about making them usable in real time. Every feature has a clear reason to exist, and they’re all there to give you a better read on market conditions.
1. Universal Z-Score Line
This is your primary reference. It reflects the average Z-score across all selected indicators. The line updates live and is color-coded to show how far it is from neutral. The further it gets from 0, the brighter the color becomes—cyan for deeply oversold conditions, magenta for overbought. This gives you instant feedback on how statistically “hot” or “cold” the market is, without needing to read any numbers.
2. Signal Labels (“𝓤𝓹” and “𝓓𝓸𝔀𝓷”)
When the average Z-score drops below your lower bound, you’ll see a "𝓤𝓹" label below the bar, suggesting potential bullish reversal conditions. When it rises above the upper bound, a "𝓓𝓸𝔀𝓷" label is shown above the bar—indicating possible bearish exhaustion. These labels are visually clear and minimal so they don’t clutter your chart. They're based on clear crossover logic and do not repaint.
3. Real-Time Z-Score Table
The table shows each indicator's individual Z-score and the final average. It updates every bar, giving you a transparent breakdown of what’s happening under the hood. If the market is showing an extreme average score, this table helps you pinpoint which indicators are contributing the most—so you’re not just guessing where the pressure is coming from.
4. Bar Coloring Modes
You can choose from three modes:
None: Keeps your candles clean and untouched.
Heat: Applies a smooth gradient color based on Z-score intensity. As conditions become more extreme, candle color transitions from neutral to either cyan (bullish pressure) or magenta (bearish pressure).
Latest Signal: Applies hard coloring based on the most recent signal—greenish for a buy, purple for a sell. This mode is great for tracking market state at a glance without relying on a gradient.
Every part of the candle is colored—body, wick, and border—for full visibility.
5. Background Highlighting
When zAvg enters an extreme zone (typically above +2 or below -2), the background shifts color to reflect the market’s intensity. These changes aren’t overwhelming—they’re light fills that act as ambient warnings, helping you stay aware of when price might be reaching a tipping point.
6. Customizable Zone Lines and Fills
You can define what counts as neutral, overbought, and oversold using manual inputs. Horizontal lines show your thresholds, and shaded regions highlight the most extreme zones (+2 to +3 and -2 to -3). These lines give you visual structure to understand where price currently stands in relation to your personal reversal model.
7. Modular Indicator Control
You don’t have to use all the indicators. You can enable or disable any of the 12 with a simple checkbox. This means you can build your own “blend” of market context—maybe you only care about RSI, price, and volume. Or maybe you want everything on. The script adapts accordingly, only averaging what you select.
8. Fully Customizable Sensitivity and Lengths
You can adjust the Z-score lookback length globally (default 100), and tweak individual indicator lengths separately. This lets you tune the indicator’s responsiveness to suit your trading style—slower for longer swings, faster for scalping.
9. Clean Integration with Any Chart Layout
All visual elements are designed to be informative without taking over your chart. The coloring is soft but clear, the labels are readable without being huge, and you can turn off any feature you don’t need. The indicator can work as a full dashboard or as a simple line with a couple of alerts—it’s up to you.
10. Precise, Real-Time Signal Logic
The crossover logic for signals is exact and only fires when the Z-score moves across your defined boundary. No estimation, no delay. Everything is calculated based on current and previous bar data, and nothing repaints or back-adjusts.
Conclusion
The Universal Z-Score Valuation indicator is a tool for traders who want a clear, unbiased way to detect overextension. Instead of relying on a single signal, you get a composite of several market perspectives—momentum, volatility, volume, and more—all standardized into a single view. The script gives you the freedom to control the logic, the visuals, and the components. Whether you use it as a confirmation tool or a primary signal source, it’s designed to give you clarity when markets become chaotic.
Disclaimer
This indicator is for research and educational use only. It does not constitute financial advice or guarantees of performance. All trading involves risk, and users should test any strategy thoroughly before applying it to live markets. Use this tool at your own discretion.

Modern Economic Eras DashboardOverview
This script provides a historical macroeconomic visualization of U.S. markets, highlighting long-term structural "eras" such as the Bretton Woods period, the inflationary 1970s, and the post-2020 "Age of Disorder." It overlays key economic indicators sourced from FRED (Federal Reserve Economic Data) and displays notable market crashes, all in a clean and rescaled format for easy comparison.
Data Sources & Indicators
All data is loaded monthly from official FRED series and rescaled to improve readability:
🔵 Real GDP (FRED:GDP): Total output of the U.S. economy.
🔴 Inflation Index (FRED:CPIAUCSL): Consumer price index as a proxy for inflation.
⚪ Debt to GDP (FRED:GFDGDPA188S): Federal debt as % of GDP.
🟣 Labor Force Participation (FRED:CIVPART): % of population in the labor force.
🟠 Oil Prices (FRED:DCOILWTICO): Monthly WTI crude oil prices.
🟡 10Y Real Yield (FRED:DFII10): Inflation-adjusted yield on 10-year Treasuries.
🔵 Symbol Price: Optionally overlays the charted asset’s price, rescaled.
Historical Crashes
The dashboard highlights 10 major U.S. market crashes, including 1929, 2000, and 2008, with labeled time spans for quick context.
Era Classification
Six macroeconomic eras based on Deutsche Bank’s Long-Term Asset Return Study (2020) are shaded with background color. Each era reflects dominant economic regimes—globalization, wars, monetary systems, inflationary cycles, and current geopolitical disorder.
Best Use Cases
✅ Long-term macro investors studying structural market behavior
✅ Educators and analysts explaining economic transitions
✅ Portfolio managers aligning strategy with macroeconomic phases
✅ Traders using history for cycle timing and risk assessment
Technical Notes
Designed for monthly timeframe, though it works on weekly.
Uses close price and standard request.security calls for consistency.
Max labels/lines configured for broader history (from 1860s to present).
All plotted series are rescaled manually for better visibility.
Originality
This indicator is original and not derived from built-in or boilerplate code. It combines multiple economic dimensions and market history into one interactive chart, helping users frame today's markets in a broader structural context.

Breaking Structures (javieresfeliz)This TradingView script is designed to identify market structure changes, using a break of highs and lows approach, as well as technical indicators such as ATR, RSI, and EMAs (Exponential Moving Averages). It is aimed at detecting bullish and bearish trends, signaling possible entry and exit points based on various factors. It also offers additional confirmations to avoid false signals and provides a clear visualization of buy and sell signals.
Main Features:
Indicators Used:
ATR (Average True Range): Used to calculate a volatility range, which helps set stop-loss levels and price targets based on the current market volatility.
EMAs (50 and 200): Exponential Moving Averages (EMAs) are used to determine the short-term and long-term trends. The 50-period EMA is used to identify the short-term trend, while the 200-period EMA is used to identify the long-term trend.
RSI (Relative Strength Index): Used to identify overbought or oversold conditions in the market, providing additional buy or sell signals.
Volume: Used to confirm the validity of a signal. An increase in volume can confirm a structure break and provide more reliability to the signal.
Break of Structure Detection (BOS):
Bullish Break: Generated when the price surpasses previous highs.
Bearish Break: Generated when the price falls below previous lows.
Change of Character (CHOCH):
Bullish Trend: Defined by a close above the open and above the 50 EMA.
Bearish Trend: Defined by a close below the open and below the 50 EMA.
Buy and Sell Conditions:
Buy (Long): Activated when several conditions are met, including a bullish change of character, a bullish structure break, the price closing above the previous value plus a multiple of the ATR, and additional confirmations from RSI and volume.
Sell (Short): Activated when several conditions are met, including a bearish change of character, a bearish structure break, the price closing below the previous value minus a multiple of the ATR, with additional confirmations from RSI and volume.
Entry and Exit Signals:
Long Entry (Buy): Executed when the buy conditions are met.
Short Entry (Sell): Executed when the sell conditions are met.
Position Close: Positions are closed when the price crosses below (for long positions) or above (for short positions) the 50 EMA.
Historical Highs and Lows Lines:
The script draws lines of historical highs and lows from the last 288 and 60 periods to show key support and resistance levels on the chart.
Signal Table Across Multiple Timeframes:
The script displays a table in the top-right corner of the chart with indicators like the EMA trend, RSI value, and MACD histogram for timeframes of 1 minute, 5 minutes, 30 minutes, 1 hour, 4 hours, daily, and weekly.
Precautions:
Does not guarantee profits: Although the script is designed to detect structure breaks and possible trend changes, it does not guarantee 100% profitable signals. The market is always subject to risk and unpredictable volatility.
Requires adjustments for each asset: Parameters such as ATR length and EMA lengths should be adjusted according to the asset being analyzed and market conditions.
Use of additional confirmations: To reduce false signals, the script uses additional confirmations like RSI and volume, but it is always recommended to perform additional analysis before making trading decisions.
Changing trends: The change of character (CHOCH) can be a useful indicator, but it can give false signals in highly volatile markets or during prolonged consolidations.
Relies on historical data: This script relies on historical data to identify highs and lows. It does not consider fundamental events that may significantly impact the market.
Requires constant monitoring: Although the signals are automated, it is important to monitor open positions and make adjustments if market conditions change.
Risk of false signals: In low liquidity markets or consolidations, structure breaks can be false, so it’s recommended to pay attention to any additional confirmation signals or use a proper risk management strategy.

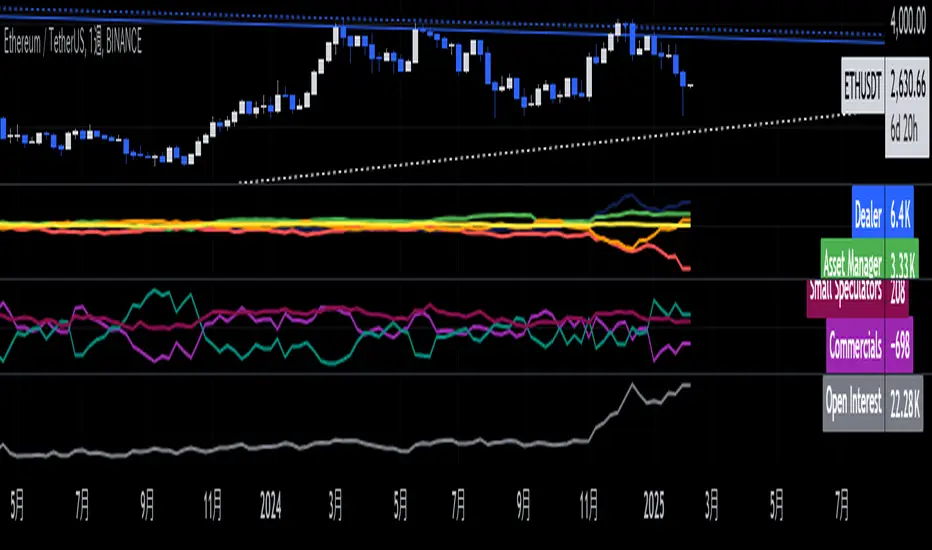
Ethereum COT [SAKANE]#Overview
Ethereum COT is an indicator that visualizes Ethereum futures market positions based on the Commitment of Traders (COT) report provided by the CFTC (Commodity Futures Trading Commission).
This indicator stands out from similar tools with the following features:
- **Flexible Data Switching**: Supports multiple COT report types, including "Financial," "Legacy," "OpenInterest," and "Force All."
- **Position Direction Selection**: Easily switch between long, short, and net positions. Net positions are automatically calculated.
- **Open Interest Integration**: View the overall trading volume in the market at a glance.
- **Comparison and Customization**: Toggle individual trader types (Dealer, Asset Manager, Commercials, etc.) on and off, with visually distinct color-coded graphs.
- **Force All Mode**: Simultaneously display data from different report types, enabling comprehensive market analysis.
These features make it a powerful tool for both beginners and advanced traders to deeply analyze the Ethereum futures market.
#Use Cases
1. **Analyzing Trader Sentiment**
- Compare net positions of various trader types (Dealer, Asset Manager, Commercials, etc.) to understand market sentiment.
2. **Identifying Trend Reversals**
- Detect early signs of trend reversals from sudden increases or decreases in long and short positions.
3. **Utilizing Open Interest**
- Monitor the overall trading volume represented by open interest to evaluate entry points or changes in volatility.
4. **Tracking Position Structures**
- Compare positions of leveraged funds and asset managers to analyze risk-on or risk-off environments.
#Key Features
1. **Report Type Selection**
- Financial (Financial Traders)
- Legacy (Legacy Report)
- Open Interest
- Force All (Display all data)
2. **Position Direction Selection**
- Long
- Short
- Net
3. **Visualization of Major Trader Types**
- Financial Traders: Dealer, Asset Manager, Leveraged Funds, Other Reportable
- Legacy: Commercials, Non-Commercials, Small Speculators
4. **Open Interest Visualization**
- Monitor the total open positions in the market.
5. **Flexible Customization**
- Toggle individual trader types on and off.
- Intuitive settings with tooltips for better usability.
#How to Use
1. Add the indicator to your chart and click the settings icon in the top-right corner.
2. Select the desired report type in the "Report Type" field.
3. Choose the position direction (Long/Short/Net) in the "Direction" field.
4. Toggle the visibility of trader types as needed.
#Notes
- Data is provided by the CFTC and is updated weekly. It is not real-time.
- Changes to the settings may take a few seconds to reflect.
Bitcoin COT [SAKANE]#Overview
Bitcoin COT is an indicator that visualizes Bitcoin futures market positions based on the Commitment of Traders (COT) report provided by the CFTC (Commodity Futures Trading Commission).
This indicator stands out from similar tools with the following features:
- Flexible Data Switching: Supports multiple COT report types, including "Financial," "Legacy," "OpenInterest," and "Force All."
- Position Direction Selection: Easily switch between long, short, and net positions. Net positions are automatically calculated.
- Open Interest Integration: View the overall trading volume in the market at a glance.
- Comparison and Customization: Toggle individual trader types (Dealer, Asset Manager, Commercials, etc.) on and off, with visually distinct color-coded graphs.
- Force All Mode: Simultaneously display data from different report types, enabling comprehensive market analysis.
These features make it a powerful tool for both beginners and advanced traders to deeply analyze the Bitcoin futures market.
#Use Cases
1. Analyzing Trader Sentiment
- Compare net positions of various trader types (Dealer, Asset Manager, Commercials, etc.) to understand market sentiment.
2. Identifying Trend Reversals
- Detect early signs of trend reversals from sudden increases or decreases in long and short positions.
3. Utilizing Open Interest
- Monitor the overall trading volume represented by open interest to evaluate entry points or changes in volatility.
4. Tracking Position Structures
- Compare positions of leveraged funds and asset managers to analyze risk-on or risk-off environments.
#Key Features
1. Report Type Selection
- Financial (Financial Traders)
- Legacy (Legacy Report)
- Open Interest
- Force All (Display all data)
2. Position Direction Selection
- Long
- Short
- Net
3. Visualization of Major Trader Types
- Financial Traders: Dealer, Asset Manager, Leveraged Funds, Other Reportable
- Legacy: Commercials, Non-Commercials, Small Speculators
4. Open Interest Visualization
- Monitor the total open positions in the market.
5. Flexible Customization
- Toggle individual trader types on and off.
- Intuitive settings with tooltips for better usability.
#How to Use
1. Add the indicator to your chart and click the settings icon in the top-right corner.
2. Select the desired report type in the "Report Type" field.
3. Choose the position direction (Long/Short/Net) in the "Direction" field.
4. Toggle the visibility of trader types as needed.
#Notes
- Data is provided by the CFTC and is updated weekly. It is not real-time.
- Changes to the settings may take a few seconds to reflect.

Candle AnalysisImportant Setup Note
Optimize Your Viewing Experience
To ensure the Candle Analysis Indicator displays correctly and to prevent any default chart colors from interfering with the indicator's visuals, please adjust your chart settings:
Right-Click on the Chart and select "Settings".
Navigate to the "Symbol" tab.
Set transparent default candle colors:
- Body
-Borders
- Wick
By customizing these settings, you'll experience the full visual benefits of the indicator without any overlapping colors or distractions.
Elevate your trading strategy with the Candle Analysis Indicator—a powerful tool designed to give you a focused view of the market exactly when you need it. Whether you're honing in on specific historical periods or testing new strategies, this indicator provides the clarity and control you've been looking for.
Key Features:
🔹 Custom Date Range Selection
Tailored Analysis: Choose your own start and end dates to focus on the market periods that matter most to you.
Historical Insights: Dive deep into past market movements to uncover hidden trends and patterns.
🔹 Dynamic Backtesting Simulation
Interactive Playback: Enable backtesting to simulate how the market unfolded over time.
Strategy Testing: Watch candles appear at your chosen interval, allowing you to test and refine your trading strategies in real-time scenarios.
🔹 Enhanced Visual Clarity
Focused Visualization: Only candles within your specified date range are highlighted, eliminating distractions from irrelevant data.
Distinct Candle Styling: Bullish and bearish candles are displayed with unique colors and transparency, making it easy to spot market sentiment at a glance.
🔹 User-Friendly Interface
Easy Setup: Simple input options mean you can configure the indicator quickly without any technical hassle.
Versatile Application: Compatible with various timeframes—whether you're trading intraday, daily, or weekly.
MENTFX AVERAGES MULTI TIMEFRAMEThe MENTFX AVERAGES MULTIME TIMEFRAME indicator is designed to provide traders with the ability to visualize multiple moving averages (MAs) from higher timeframes on their current chart, regardless of the chart's timeframe. It combines the power of exponential moving averages (EMAs) to help traders identify trends, spot potential reversal points, and make more informed trading decisions.
Key Features:
Multi-Timeframe Moving Averages: This indicator plots moving averages from daily timeframes directly on your chart, helping you keep track of higher timeframe trends while trading in any timeframe.
Customizable Moving Averages: You can adjust the length and visibility of up to three EMAs (default settings are 5, 10, and 20-period EMAs) to suit your trading style.
Overlay on Price: The indicator is designed to be overlaid on your price chart, seamlessly integrating with your existing analysis.
Simple but Effective: By offering a clear visual guide to where price is trading relative to important higher timeframe levels, this indicator helps traders avoid trading against major trends.
Why It’s Unique:
Validation Timeframe Flexibility: Unlike traditional moving average indicators that only work within the same chart's timeframe, the MENTFX AVERAGES M indicator allows you to pull moving averages from higher timeframes (default: Daily) and overlay them on any chart you're currently viewing, whether it's intraday (minutes) or even weekly. This cross-timeframe visibility is critical in determining the true market trend, adding context to your trades.
Customizability: Although the default settings focus on daily EMAs (5, 10, and 20 periods), traders can modify the parameters, including the type of moving average (Simple, Weighted, etc.), making it adaptable for any strategy. Whether you want shorter-term or longer-term averages, this indicator covers your needs.
Trend Confirmation Tool: The use of multiple EMAs helps traders confirm trend direction and potential price breakouts or reversals. For example, when the shorter-term 5 EMA crosses above the 20 EMA, it can signal a potential bullish trend, while the opposite could indicate bearish pressure.
How This Indicator Helps:
Identify Key Support and Resistance Levels: Higher timeframe moving averages often act as dynamic support and resistance. This indicator helps you stay aware of those critical levels, even when trading lower timeframes.
Trend Identification: Knowing where the market is relative to the 5, 10, and 20 EMAs from a higher timeframe gives you a clearer picture of whether you're trading with or against the prevailing trend.
Improved Decision Making: By aligning your trades with the direction of higher timeframe trends, you can increase your confidence in trade entries and exits, avoiding low-probability setups.
Multi-Market Use: This indicator works well across various asset classes—stocks, forex, crypto, and commodities—making it versatile for any trader.
How to Use:
Intraday Trading: Use the daily EMAs as a guide to see if intraday price movements align with longer-term trends.
Swing Trading: Plot daily EMAs to track the strength of a larger trend, using pullbacks to the moving averages as potential entry points.
Trend Trading: Monitor crossovers between the moving averages to signal potential changes in trend direction.
Default Settings:
5 EMA (Daily) – Blue Line
10 EMA (Daily) – Black Line
20 EMA (Daily) – Red Line
These lines will plot on your chart with a subtle opacity (33%) to ensure they don’t obstruct price action, while still providing crucial visual guidance on market trends.
This indicator is perfect for traders who want to blend technical analysis with multi-timeframe insights, helping you stay in sync with broader market movements while executing trades on any timeframe.

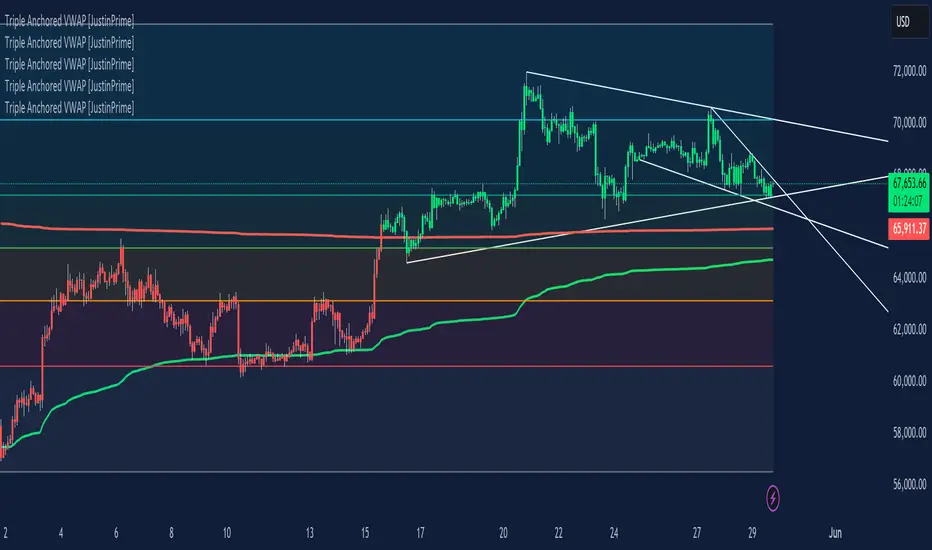
Triple Anchored Volume Weighted Average Price [JustinPrime]This indicator provides three separate Volume Weighted Average Price (VWAP) calculations, each anchored from different key points on the chart:
High Anchored VWAP: Resets from the highest price reached since the start date.
Low Anchored VWAP: Resets from the lowest price since the start date.
Start Date VWAP: Calculated from the trading data beginning at the user-defined start date.
Features:
Selectable Timeframe: Choose from timeframes like 1 minute, 5 minutes, 15 minutes, 1 hour, daily, and weekly.
Custom Start Date: Set a specific start date for the VWAP calculations.
Source Data: Uses high, low, and close prices (HLC3) for calculations.
How to Use:
Adjust the start date to focus on significant market periods or events.
Differentiate each VWAP with unique colors for clarity.
Hodl Calculation v1.0I have developed an indicator that calculates the value of our currency if we had periodically bought any stock or cryptocurrency on any exchange. I believe many individuals would be interested in computing such values.
You can customize the start and end times, choose the amount of currency to be used for each deal, and select from two frequency options.
The first option involves specific intervals, such as hourly, every three days, or bi-weekly.
The second option allows purchases at specific dates or times, like every 15th of the month at 12:00 PM, every Monday at 11:00 AM, or every day at 6:00 AM.
After selecting the frequency, the indicator performs calculations and presents statistical information in a table.
The summarized data includes frequency value, total selected period duration, number of deals, total quantity, total cost, current value, and profit/loss status.

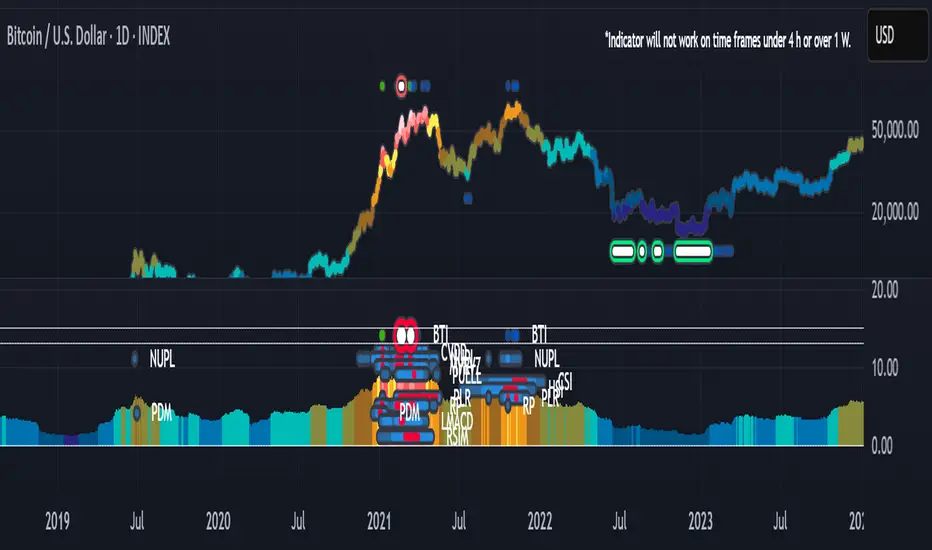
BTI - Bitcoin (BTC) Top Indicator [Logue]Bitcoin top indicator. This indicator is a combination of multiple on-chain and seasonality BTC macro cycle top indicators, plus the Pi-Cycle top moving average. Because there is no magic single indicator to detect macro cycle tops in bitcoin, the BTI detects confluence of multiple indicators to select tops of each BTC macro cycle. The individual indicators used for the BTI are:
1) Cumulative Value Days Destroyed (CVDD) - The CVDD was created by Willy Woo and is the ratio of the cumulative value of Coin Days Destroyed in USD and the market age (in days). While this indicator is used to detect bottoms normally, an extension is used to allow detection of BTC tops. When the BTC price goes above the CVDD extension, BTC is generally considered to be overvalued. Because the "strength" of the BTC tops has decreased over the cycles, a logarithmic function for the extension was created by fitting past cycles as log extension = slope * time + intercept. This indicator is triggered when the BTC price is above the CVDD extension.
2) Net Unrealized Profit Loss (NUPL) - The NUPL measures the profit state of the bitcoin network to determine if past transfers of BTC are currently in an unrealized profit or loss state.
Values above zero indicate that the network is in overall profit, while values below zero indicate the network is in overall loss. Highly positive NUPL values indicate overvaluation of the BTC network. Based on decreasing "strength" of BTC tops, a decreasing linear function (trigger = slope * time + intercept) was fit to past cycle tops. Therefore, future trigger values can be calculated over time. This indicator is triggered when the NUPL is above the trigger value.
3) Market Value-Realized Value Z-score (MVRV-Z) - The MVRV-Z measures the value of the bitcoin network by comparing the market cap to the realized value and dividing by the standard deviation of the market cap (market cap – realized cap) / std(market cap)). When the market value is significantly higher than the realized value, the bitcoin network is "overvalued". Very high values have signaled cycle tops in the past. This indicator is triggered when the MVRVZ value is above 55.
4) Puell multiple (PUELL) - PUELL is the ratio between the daily coin issuance in USD and its 365-day moving average. This multiple helps to measure miner profitability. When the PUELL goes to extremely high values relative to historical values, it indicates the profitability of the miners is very high and a top may be near. This indicator triggers when the PUELL is above 3.33.
5) Calendar Seasonality Index (CSI) - The CSI takes advantage of the consistency of BTC cycles. Past cycles have formed macro tops every four years between October 21st and December 12th. Therefore, this indicator triggers at set times that are marked every four years between these two dates.
6) Halving Seasonality Index (HSI) - The HSI, as with the CSI, takes advantage of the consistency of BTC cycles following the major event that is the halving. Aside from the first halving cycle, cycles have formed macro tops approximately 538 days after each halving. Therefore, this indicator triggers at set times that are marked 528 to 548 days (i.e., 538 +- 10 days) after each halving.
7) Polylog Regression (PLR) - The BTC cycle tops and bottoms were separately fit using a polynomial regression for the PLR. The bottom band was fit on much more data than the top band, so is likely to be more reliable. The shape of the regression into the future was estimated, so may not be accurate into the future, but is the best fit of tops and bottoms to date. This indicator is used to estimate when tops and bottoms are near when the price goes into the top or bottom bands. This triggers when the BTC price is inside or above the upper polylog regression channel.
8) Realized Price (RP) - The RP is summation of the value of each BTC when it last moved divided by the total number of BTC in circulation. This gives an estimation of the average "purchase" price of BTC on the bitcoin network based on when it was last transacted. This indicator tells us if the average network participant is in a state of profit or loss. This indicator is normally used to detect BTC bottoms, but an extension can be used to detect when the bitcoin network is "highly" overvalued. Because the "strength" of the BTC tops has decreased over the cycles, a logarithmic function for the extension was created by fitting past cycles as log extension = slope * time + intercept. This indicator triggers when the BTC price is above the realized price extension.
9) Pi-cycle Top (PCT) - The PCT indicator is simply the cross of the 111-day moving average above a 2x multiple of the 350-day moving average of the BTC price. While there is no fundamental reasoning behind why this works, it has worked to indicate previous bitcoin tops by taking advantage of the cyclicality of the BTC price and measurement overextension of BTC price. This indicator triggers when the fast moving average (111-day) crosses above the 2x multiple of the slow moving average (350-day).
10) Transaction Fee Spike (TFS) - Transaction fees on the bitcoin network can signal a mania phase when they increase well above historical values. This mania phase may indicate we are near a top in the BTC price. The daily transaction fee total in USD is divided by the number of daily transactions to calculate the average transaction fee paid on the bitcoin network. The transaction fees increasing above $40 trigger this indicator.
The on-chain indicators (CVDD, NUPL, MVRV-Z, PUELL, RP, and TFS) work together to give a health check of the BTC price as compared to its network health. The seasonality indicators (CSI, HSI, and PLR) work together to map the macro cycles of BTC. The PCT gives a view of the overvaluation of the BTC price. Each of these indicators is weighted evenly when selected and if over 45% of the indicators are triggering on a candle (i.e., at least 5 of 10), the overall BTI indicator prints a clear signal -- a red dot with a white middle portion between the white horizontal lines at the top of the indicator. This signal is meant to indicate when the macro cycle top is likely already hit or is near. Each of the individual indicators used for the BTI are proven macro top indicators over multiple cycles.
Each of the individual indicators are shown in their own rows to visualize which indicators are triggering. You are able to deselect any indicator you do not wish to have considered and select it back again. To prepare you for indicators triggering, the BTI shows dark blue or dark green when the indicator is close to triggering (i.e., generally around 20% from the trigger value, a less intense background will appear, and 10% from the trigger value, a more intense background will appear). The color of the individual indicators turns pink when they are triggered. The background color of the BTI becomes blue when at least 30% of the indicators considered are triggering and it becomes purple/pink when the BTI fully triggers. See the BTC chart above the indicator showing the performance of the indicator in picking out macro top regions (red dots with white middle portion). Because not all daily data for BTC can be shown on one chart, ensure you also play with the indictor yourself. The BLX is most appropriate, but the indicator works on all BTC/USD charts. Because of the limits imposed by TradingView, the indicator doesn't work on time frames lower than 4 h or higher than the weekly.
You can use this indicator to help you understand when the BTC price is more likely topping based on past performance of these indicators. This indicator pairs with the BBI (Bitcoin (BTC) Bottom Indictor) and the BTB (Bitcoin Top and Bottom indicator).
Use this indicator at your own risk. I make no assertions that this indicator will work to detect any future top since we all know that past performance is no guarantee of future results.
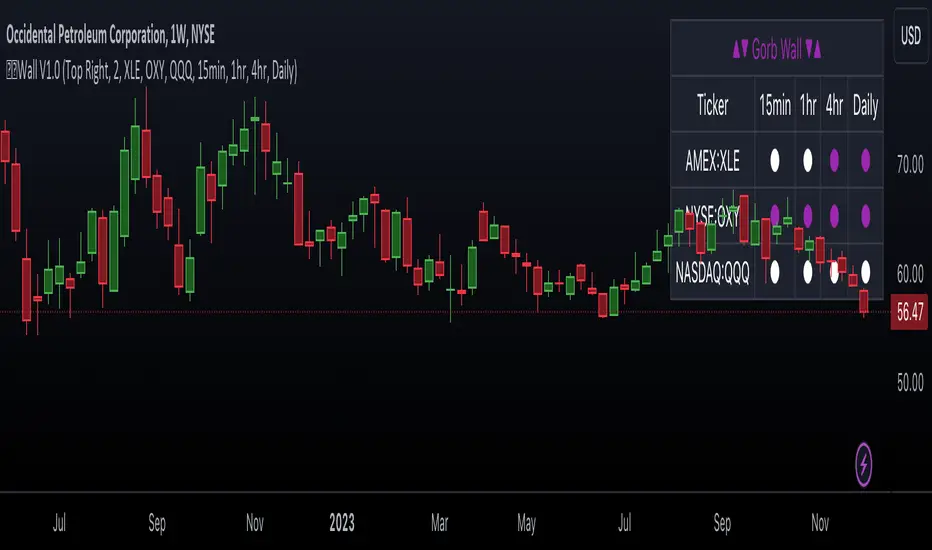
Gorb WallIntroduction:
Gorb Wall is a trading tool that offers a unique approach to market trend analysis. It extends the capabilities of the Gorb Algo indicator by presenting a multi-ticker, multi-timeframe dashboard, enabling traders to capture crucial market movements across various financial instruments without flipping through charts.
Overview:
Multi-Ticker Analysis: Monitor and analyze multiple financial instruments simultaneously.
Customizable Timeframes: Tailor the script to various timeframes to suit your trading strategy.
Gorb Algo Market Trend: An algorithm that adapts to market conditions, providing insights into trend changes.
User-Friendly Dashboard: Easily configure and customize the dashboard placement on your chart.
Color-Coded Trend Indicators: Visual cues to quickly assess bullish or bearish trends.
Optimized for Performance: Efficiently coded to ensure smooth running on TradingView without overloading resources.
How Gorb Wall Works:
The script utilizes Gorb Algo's market trend algorithm to process price and volume data across selected tickers and timeframes.
It applies a complex calculation to identify trends, using a combination of volatility analysis, momentum measurements, and trend strength indicators.
The output is a simplified visual representation on the dashboard, where colored circles indicate the trend direction, providing an at-a-glance market overview.
Unique Features:
Proprietary Algorithm: The heart of Gorb Wall lies in its unique Gorb Algo Market Trend algorithm. Unlike standard trend-following indicators, this proprietary algorithm integrates multiple technical analysis concepts (e.g., moving averages, volume data, price action, and oscillators) to provide a more comprehensive market trend analysis.
Multi-Dimensional Analysis: The script analyzes market trends by simultaneously processing data across multiple tickers and timeframes, offering a broader view of market movements than traditional single-ticker indicators.
We recommend exploring & choosing which tickers/timeframes best suits your needs and style of trading, and use that to combine with our suite of indicators.
Settings:
All skill-level friendly presets, easy to enable features with one-click
Dashboard Placement: Choose from top/bottom left/right for dashboard positioning.
Trend Speed Mode: Select the algorithm speed - Fast, Medium, Slow, Slowest.
Bullish/Bearish Trend Colors: Customize colors for trend indicators.
Additional Tickers: Input options for monitoring multiple financial instruments.
Timeframe Selection: Choose from a range of timeframes for each ticker.
How to Use
In the image below, we can see a basic example of how this indicator functions.
The dashboard displays up to three different tickers per the user's choice, with 4 different timeframes the user can choose. It that runs the algorithm line on the specified ticker & timeframe and plots a colored circle that identifies that tickers trend on the specified timeframes.
There are two colors, white for bullish trend and purple for bearish trend. These are the two consistent colors across our suit of indicators to help simplify trading by using simple color matching for confluence. Below is a continued breakdown on using this indicator:
Dynamic Trend Visualization in Real-Time Updates
The dashboard dynamically updates trend colors (white for bullish, purple for bearish) based on real-time market data, offering immediate insights into market sentiment. The next three images below these the live change in data as price action begins developing over multiple timeframes.
In the image above, we are on the 5min AAPL chart, we have SPY, QQQ, and VIX as our tickers on the dashboard with 1min, 2min, 3min, and 10min timeframes chosen. We begin to see VIX flip bullish, which can usually mean down side for indices.
We then see as AAPL's price begins to slow and reverse, we see SPY's trend following on the smaller timeframes first with VIX still leading the way indicating possible bearish change.
In the image above, we can see that price dips down and SPY & QQQ market trends have flipped bearish on all timeframes, while VIX continues to be bullish(validating the downwards price action)
Customizable Settings
Users can adjust settings such as dashboard placement, trend speed mode, and color themes to suit individual trading styles.
In the image below, we can see the dashboard placement setting offers four different locations the user can move the dashboard. Just like in Gorb Algo , the user can choose which trendline speed they want to use to best fit their trading strategy.
In the image below, we can see the "bullish trend" & "bearish trend" colors setting. These colors by default match the rest of our suite of indicators, white is bullish and purple is bearish. Users can change these color settings to meet their preferences.
In the image below, we can see there are three market ticker options that the user can change. This allows users to monitor their favorite tickers across or easily flip through multiple tickers in order to gauge their current market trends without having to change their chart
In the image below, we can see the 4 timeframes that are on the dashboard. The user has the ability to change each of those four, to whatever timeframe best suits their trading needs. There are 12 different timeframe options to choose from.
Quick Dashboard Review
Using color-coded trend detection, this quickly gauges market trends and provides a visual to easily identify these changes in real-time across multiple timeframes. When a circle changes color, this means that price has flipped that direction, causing a change in the Gorb Algo market trendline. As stated above, white is for bullish trend and purple is for bearish trend, but these colors can be changed to fit the users trading strategy and style. Each timeframe the user chooses will be updated in real-time, including the higher time frames like the daily & weekly. They have been modified to pull data a same speed the lower timeframes are.
This helps provide quick visual identification of real market trend changes as price action develops. It is best used in conjunction with other forms of technical analysis for a holistic trading approach.
Conclusion:
This indicator is designed to streamline market trend analysis, offering traders an innovative, efficient, and easy-to-use tool for making informed trading decisions. This tool complements our suite of indicators, providing unique market insights that are not typically available in traditional open-source scripts.
How to get access:
You can see the Author's instructions to get access to this indicator
RISK DISCLAIMER
All content, tools, scripts & education provided by Gorb Algo are for informational & educational purposes only. Trading is risky and most lose their money, past performance does not guarantee future results.
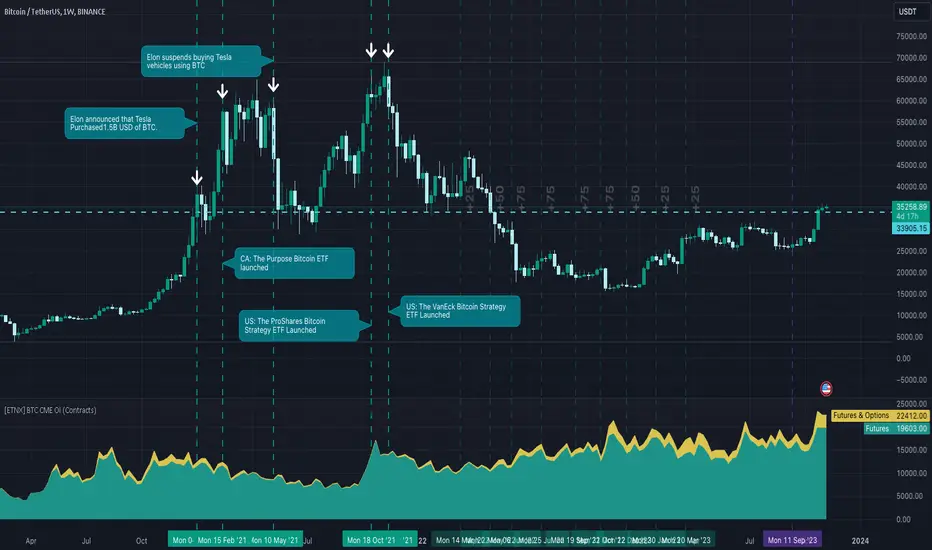
[ETNX] BTC CME OIOVERVIEW
This indicator displays the Open Interest based on CME Bitcoin Futures & Options. The data is provided from the CFTC Commitments of Traders Reports. These reports are given weekly. Therefore, this indicator works better on W timeframes.
INPUTS
The Open Interest can be displayed in three ways:
Contracts - How many contracts are opened on CME
BTC - How many BTC the contracts worth
Billions USD - How much is worth in USD based on the CME BTC Price
Pivot Points [MisterMoTA]The Pivot Points indicator by MisterMoTA allow users to get pivots points calculated from last candle high, low and close on any timeframe from 1 minute to weekly.
This will help users that are trading ins small timeframes to see the pivots that are near their timeframes and not only daily timeframe.
Here is an example on the chart from nex image the timeframe is set to 1 minute and pivot points displayed are at 15 minutes :
The users have control on pivots colors, pivot labels colors, text color from labels, decimal numbers displayed in the labels and style of the pivots lines.
Please follow me for other script like this one.
Kind regards,
MisterMoTA

MTF Evolving Weighted Composite Value Area🧾 Description:
This indicator calculates evolving value areas across 3 different timeframes/periods and combines them into one composite, multi-timeframe evolving value area - with each of the underlying timeframes' VAs assigned their own weighting/importance in the final calculation. Layered with extra smoothing options, this creates an informative and useful 'rolling value area' effect that can give you a better perspective on the value area across multiple periods at once as it develops - without total calculation resets at the onset of every new period.
Let's start with a simplified primer on value areas and then jump in to the new ideas this indicator introduces.
🤔 What is a value area?
Value areas are a tool used in market profile analysis to determine the range of prices that represents where most trading activity occurred during a specific time period, typically within a single 'bar' of a certain higher timeframe, such as the 4-hour, daily, or weekly. It helps traders understand the levels where the market finds value.
To calculate the value area, we look at the distribution of prices and trading volume. We determine a percentage, usually 70% or 80%, that represents the significant portion of trading volume. Then, we identify the price range that contains this percentage of trading volume, which becomes the value area.
Value areas are useful because they provide insights into market dynamics and potential support and resistance levels. They show where traders have been most active and where they find value, and traders can use this information to make better-informed decisions.
For example, if price is trading within the value area, it suggests that it's within a range where traders see value and are actively participating, which could indicate a balanced market. If the price moves above or below the value area, it may signal a potential shift in market sentiment or a breakout/breakdown from the established range.
By understanding the value area, traders can identify potential areas of supply and demand, determine levels of interest for buyers and sellers, and make decisions based on the market's perception of value.
📑 Limitations of traditional value areas
Static representation: Value areas are usually represented as static zones calculated after the fact. For example, after a daily period is completed, a typical 1D VA indicator will display the value area for the past period with static horizontal lines. This approach doesn't give you the power to see how the value area evolved, or developed, during the time period, as it is only displayed retroactively. It also doesn't give you the ability to view it as it evolves in real-time. This is why we chose to use an evolving value area representation, specifically borrowed from @sourcey's Value Area POC/VAH/VAL script function for calculating evolving VAs.
Rollover resets - no memory of past periods!: The traditional value area is calculated over a static period - it is calculated from the beginning of the period, for example a 1 day period, to the end, and that's the end of it. When the next daily period begins, the calculation resets, and has no memory of the preceding period. This limits the usefulness of the value area visual when viewed near the beginning of a new period before price and volume have been given ample time to define an area.
Hard to absorb all of that information: Value areas aren't generally meant to be a hardline representation of something extremely exact - they're based on a percentage of the area where traders appeared to find value over a certain time period. Most traders use them as a guide for support and resistance levels or finding an expected range. Traders typically overlay multiple VAs - sometimes requiring several instances of the same indicator to be applied - to represent the VA across multiple timeframes such as the 4H, 1D, or 1W. The chart quickly gets cluttered and it's not necessarily easy to understand the relationship between these multiple periods' VAs at a glance.
🧪 New concepts introduced in this indicator
With the evolving weighted composite value area we tried to address these limitations, and we think the result can be useful and intuitive for traders who want more dynamic and practical VAs for their everyday technical analysis.
⚖️ 1. A composite, weighted multi-timeframe VA
This indicator's value areas represent a combination or composite of the value areas calculated across multiple timeframes. The VAs calculated across each timeframe are then given a weighting percentage, which determines their contribution to the final 'weighted composite value area'.
Pictured below: a 4H/1D/1W MTF evolving weighted composite VA on the BTCUSDT Perpetual Futures (Binance) 5 minute chart:
Traditionally, when traders wanted to get a view of where the majority of trading activity occurred over the past four hours, day, and week, they would need to apply three value area indicators (or sometimes one if it allows multiple custom timeframes), each set to a different period (4H, 1D, 1W). The chart gets cluttered quickly and the information is hard to absorb in one shot. Addressing this problem was the main impetus for creating this weighted composite process.
〰️ 2. Rolling and smoothed evolving VAs
Because the composite VA is calculated based on multiple period VAs, there is no one single point where the area calculation resets (unless all 3 selected timeframes happen to rollover on the same bar). This creates a 'rolling' effect that gives a sense of the progression of the VA as price transitions through the different underlying time periods, without the traditional 'jump' in calculations between periods.
Pictured below: a 1D/1W/1M MTF evolving weighted composite VA on the NQ futures 1H chart:
To help give even more of a sense of perspective and 'progression' of the VA, there are also smoothing options to even out the 'jumps' at period-rollover points.
✔️ What's it good for?
Smoothed, rolling, and evolving multi-timeframe VAs that give you a better real-time perspective of where traders are finding value across multiple time periods at once.
📎 References
1. @sourcey's Value Area POC/VAH/VAL script by adapting its f_poc(tf) function.
💠 Features:
A MTF evolving weighted composite value area based on 3 underlying VAs calculated across customizable timeframes
Aesthetic and flexible coloring and color theme styling options
Period-roller labels and options for ease-of-use and legibility
⚙️ Settings:
Calculation Decimal Resolution: This setting essentially determines how 'granular' the value area calculating process is. This value should be set to some multiple of the tick size/smallest decimal of the symbol's price chart. Eg. On BTCUSDT, the tick size/decimal is usually 0.1. So, you might use 0.5. On TSLA, the tick size is 0.01. You might use 0.05 or 0.25. Beware: if the resolution is too small, calculation will take too long and the script may timeout.
Show Me Suggested Resolutions: If enabled, a label will display in the bottom right of the chart with some suggested resolutions for the current chart.
Area Percentage: Set the displayed percentage of the calculated composite value area. Igor method = 70%; Daniel method: 68%.
Use a Color Theme: When this setting is enabled, all manual 'Bullish and Bearish Colors' are overridden. All plots will use the colors from your selected Color Theme - excepting those plots set to use the 'Single Color' coloring method.
Color Theme: When 'Use a Color Theme' is enabled, this setting allows you to select the color theme you wish to use.
Resistance Color: When 'Use a Color Theme' is disabled, this will set the 'resistance color' for the composite VA.
Support Color: When 'Use a Color Theme' is disabled, this will set the 'support color' for the composite VA.
Show Period Rollover Labels: When enabled, a label will show above or below the composite VA marking any underlying period rollovers with the label 'New __' (eg. 'New 4H', 'New 1D', 'New 1W').
Size: Sets the font size of the period rollover labels.
Show Period Rollover Lines: When enabled, a translucent vertical dashed line will be drawn across the composite VA when one of the underlying periods rolls over.
Fill Composite Value Area: When enabled, the composite VA will be filled with a gradient coloring from the support line to the resistance line using their respective colors.
Smooth: When enabled, a smoothing moving average will be applied to the composite value area.
Smoothing Period: Set the lookback period for the smoothing average.
Smoothing Type: Set the calculation type for the smoothing average. Options include: Exponential, Simple, Weighted, Volume-Weighted, and Hull.
Enable: Include/exclude a timeframe's VA in the composite VA calculation.
Timeframe: Set the timeframe for this specific underlying VA.
Weighting %: Set the weighting percentage or 'importance' of this timeframe's value area in calculating the composite VA. Beware! The sum of the weighting percentages across all enabled timeframes must ALWAYS add up to 100 in order for this indicator to work as designed.

Open Interest Chart [LuxAlgo]The Open Interest Chart displays Commitments of Traders %change of futures open interest , with a unique circular plotting technique, inspired from this publication Periodic Ellipses .
🔶 USAGE
Open interest represents the total number of contracts that have been entered by market participants but have not yet been offset or delivered. This can be a direct indicator of market activity/liquidity, with higher open interest indicating a more active market.
Increasing open interest is highlighted in green on the circular plot, indicating money coming into the market, while decreasing open interests highlighted in red indicates money coming out of the market.
You can set up to 6 different Futures Open interest tickers for a quick follow up:
🔶 DETAILS
Circles are drawn, using plot() , with the functions createOuterCircle() (for the largest circle) and createInnerCircle() (for inner circles).
Following snippet will reload the chart, so the circles will remain at the right side of the chart:
if ta.change(chart.left_visible_bar_time ) or
ta.change(chart.right_visible_bar_time)
n := bar_index
Here is a snippet which will draw a 39-bars wide circle that will keep updating its position to the right.
//@version=5
indicator("")
n = bar_index
barsTillEnd = last_bar_index - n
if ta.change(chart.left_visible_bar_time ) or
ta.change(chart.right_visible_bar_time)
n := bar_index
createOuterCircle(radius) =>
var int end = na
var int start = na
var basis = 0.
barsFromNearestEdgeCircle = 0.
barsTillEndFromCircleStart = radius
startCylce = barsTillEnd % barsTillEndFromCircleStart == 0 // start circle
bars = ta.barssince(startCylce)
barsFromNearestEdgeCircle := barsTillEndFromCircleStart -1
basis := math.min(startCylce ? -1 : basis + 1 / barsFromNearestEdgeCircle * 2, 1) // 0 -> 1
shape = math.sqrt(1 - basis * basis)
rad = radius / 2
isOK = barsTillEnd <= barsTillEndFromCircleStart and barsTillEnd > 0
hi = isOK ? (rad + shape * radius) - rad : na
lo = isOK ? (rad - shape * radius) - rad : na
start := barsTillEnd == barsTillEndFromCircleStart ? n -1 : start
end := barsTillEnd == 0 ? start + radius : end
= createOuterCircle(40)
plot(h), plot(l)
🔶 LIMITATIONS
Due to the inability to draw between bars, from time to time, drawings can be slightly off.
Bar-replay can be demanding, since it has to reload on every bar progression. We don't recommend using this script on bar-replay. If you do, please choose the lowest speed and from time to time pause bar-replay for a second. You'll see the script gets reloaded.
🔶 SETTINGS
🔹 TICKERS
Toggle :
• Enabled -> uses the first column with a pre-filled list of Futures Open Interest tickers/symbols
• Disabled -> uses the empty field where you can enter your own ticker/symbol
Pre-filled list : the first column is filled with a list, so you can choose your open interest easily, otherwise you would see COT:088691_F_OI aka Gold Futures Open Interest for example.
If applicable, you will see 3 different COT data:
• COT: Legacy Commitments of Traders report data
• COT2: Disaggregated Commitments of Traders report data
• COT3: Traders in Financial Futures report data
Empty field : When needed, you can pick another ticker/symbol in the empty field at the right and disable the toggle.
Timeframe : Commitments of Traders (COT) data is tallied by the Commodity Futures Trading Commission (CFTC) and is published weekly. Therefore data won't change every day.
Default set TF is Daily
🔹 STYLE
From middle:
• Enabled (default): Drawings start from the middle circle -> towards outer circle is + %change , towards middle of the circle is - %change
• Disabled: Drawings start from the middle POINT of the circle, towards outer circle is + OR -
-> in both options, + %change will be coloured green , - %change will be coloured red .
-> 0 %change will be coloured blue , and when no data is available, this will be coloured gray .
Size circle : options tiny, small, normal, large, huge.
Angle : Only applicable if "From middle" is disabled!
-> sets the angle of the spike:
Show Ticker : Name of ticker, as seen in table, will be added to labels.
Text - fill
• Sets colour for +/- %change
Table
• Sets 2 text colours, size and position
Circles
• Sets the colour of circles, style can be changed in the Style section.
You can make it as crazy as you want:

DB Support Resistance Levels + Smart Higher Highs and Lower LowsDB Support Resistance Levels + Smart Higher Highs and Lower Lows
The indicator plots historic lines for high, low and close prices shown in settings as "base levels". Users can control the lookback period that is plotted along with an optional multiplier. Traders will notice that the price bounces off these historic base levels. The base levels are shown as light gray by default (customizable in the settings). Users may choose to display base levels by a combination of historic high, low and close values.
On top of the historic base levels, the indicator display higher high and lower low levels from the current bar high/low. Higher highs are shown by default in pink and lower lows by default in yellow. The user can adjust the lookback period for displaying higher highs and the optional multiplier. Only historic values higher than the current bar high are displayed filtering out (by highlighting) the remaining levels for the current bar. Users may choose to use a combination of historic open, low and close values for displaying higher highs. The user can adjust the lookback period for displaying lower lows and the optional multiplier. Only historic values lower than the current bar low are displayed filtering out (by highlighting) the remaining levels for the current bar. Users may choose to use a combination of historic open, low and close values for displaying lower low.
The indicator includes two optional filters for filtering out higher highs and lower lows to focus (highlight) the most relevant levels. The filters include KC and a simple price multiplier filter. The latter is enabled by default and recommended.
The indicator aims to provide two things; first a simple plot of historic base levels and second as the price moves to highlight the most relevant levels for the current price action. While the indicator works on all timeframes, it was tested with the weekly. Please keep in mind adjusting the timeframe may require the lookback settings to be adjusted to ensure the bars are within range.
How should I use this indicator?
Traders may use this indicator to gain a visual reference of support and resistance levels from higher periods of time with the most likely levels highlighted in pink and yellow. Replaying the indicator gives a visual show of levels in action and just how very often price action bounces from these highlighted levels.
Additional Notes
This indicator does increase the max total lines allowed which may impact performance depending on device specs. No alerts or signals for now. Perhaps coming soon...
