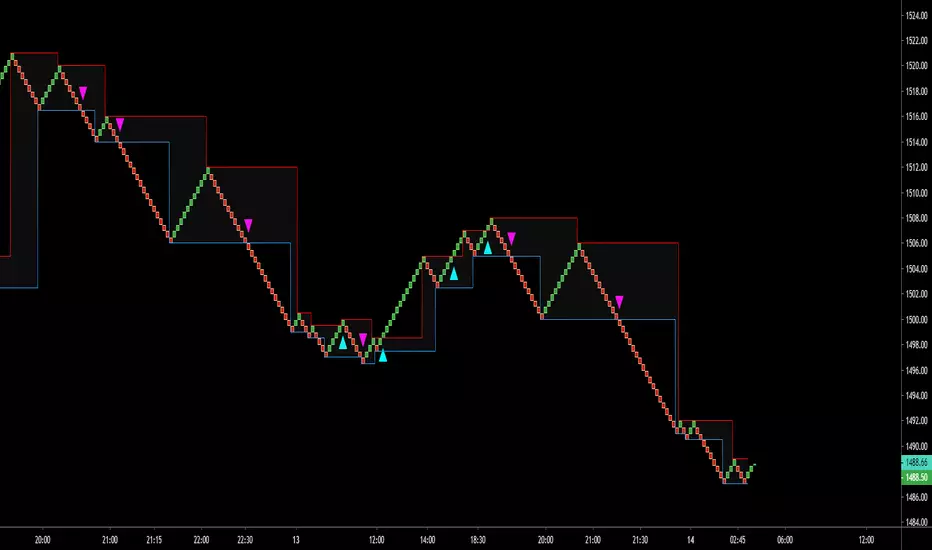
Fractal Framer added buy sellThis script was written by Brobear and published. I only modified by adding buy and sell signal when price crossover fractal channel.
buy_breakout=crossover(close,fracLevelHigh) and OsMA >OsMA and emaRSI >emaRSI
sell_breakout=crossunder(close,fracLevelLow) and OsMA
在腳本中搜尋"williams"
Sinyal GhoibLeading Signal!!!
Long entry while long signal appears.
Short entry while short signal appears.
This signal only effective on BitMex | 5m | XBTUSD.
Take profit: 0,6% from entry price
Stop loss: 0,6% from entry price
Leverage: 10x - 50x
For donation
BTC: 3E7rUPX7upS8iTj42JdLt7keJVbJLfvMoH
ETH: 0x094ed88e4c5a9b225e936586cbc2d61f4a027f68
BitMex Referral: P81ZCO
Thank you & happy trading!


Assassin Zenzen about top fractal and bottom fractal
show top fractal and bottom fractal
---
TODO
Contain Kline , Tradingview pine not support yet.

Fractal Regression Channel V0.1Port of @RicardoSantos' Fractal Regression Channel V0 from pinescript 2 to pinescript 3.
// Source:
// Original Author: @RicardoSantos

STPatterns fractalsModified fractals using 1 candle on both side as mentioned by the strategies from stpatterns.com

Swing PointsThis indicator gives a clear indication of price action swing-points as well as an indication of whether it is a higher, lower, or equal swing point relative to the last high/low.

Keltner Channels+Parabolic Sar+Fractals+MACDA mixture of 4 indicators on the same overlay. Keltner Channels, Parabolic Sar, Fractals. MACD is integrated for yellow candles in order to show huge macd and trigger line gaps. MACD integration focuses on hist line by determining negative upper level and positive bottom level.

Time Pattern IndicatorHigh Priority = Gold Diamonds
Medium Priority = Silver Circles
Leading Priority = Fuchsia Crosses

Brandon: Fractals MKIICustom Indicator development published for customer verification and acceptance.
Features
Generate buy / sell signals if x number of candles following a fractal are up/down.
Generate an early warning (background color change) if x - 1 candles following a fractal are up/down
Generate alerts for buy/sell signals and early warning.


Brandon FractalsCustom Indicator developed for a Backtest-Rookies customer. Published for verification and acceptance
Dual Fractal indicator. Display fractals from an upper timeframe and provide alerts when price breaks above/below the upper timeframe fractal.

Alpha Fractal BandsWilliams fractals are remarkable support and resistance levels used by many traders. However, it can sometimes be challenging to use them frequently and get confirmation from other oscillators and indicators. With the new "Alpha Fractal Bands", a unique blend of Williams Fractals and Bollinger Bands emerges, offering a fresh perspective. Extremes can be utilized as price reversals or for taking profits. I look forward to hearing your thoughts. Best regards... Happy trading!
An easy solution for long positions is to:
Identify a bullish trend or a potential entry point for a long position.
Set a stop-loss order to limit potential losses if the trade goes against you.
Determine a target price or take-profit level to lock in profits.
Consider using technical indicators or analysis tools to confirm the strength of the bullish trend.
Regularly monitor the trade and make necessary adjustments based on market conditions.
An easy solution for short positions could be to follow these steps:
Identify a bearish trend or a potential entry point for a short position.
Set a stop-loss order to limit potential losses if the trade goes against you.
Determine a target price or take-profit level to lock in profits.
Consider using technical indicators or analysis tools to confirm the strength of the bearish trend.
Regularly monitor the trade and make necessary adjustments based on market conditions.
Remember, it's important to conduct thorough research and analysis before entering any trade and to manage your risk effectively.
To stay updated with the content, don't forget to follow and engage with it on TV, my friends. Remember to leave comments as well :)

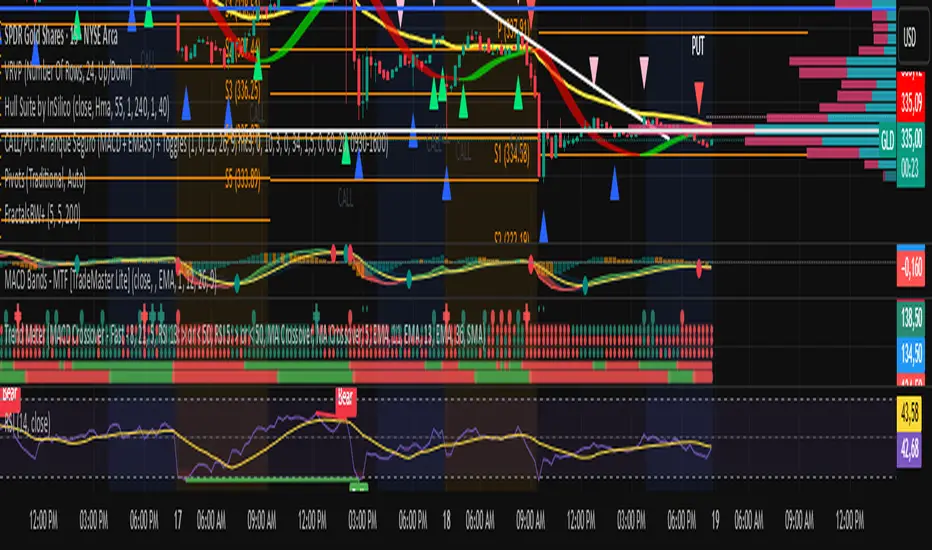
POWER INDICATOR PREMIUM WITH MANY FUNCTIONS BY OeZkAn
👑 POWER INDICATOR PRO PREMIUM V24: Predictive Intelligence Meets Precision ExecutionThe POWER INDICATOR PRO PREMIUM V24 is the pinnacle of algorithmic trading intelligence. This system transcends traditional indicators by utilizing a sophisticated framework of advanced mathematical equations to predict the impending trend direction before the market moves. It combines Smart Money Concepts (SMC), Multi-Timeframe (MTF) convergence, and Dynamic Risk Management to deliver unparalleled clarity and execution confidence.If you seek a trading partner that provides leading, predictive signals and high-probability entries, this system is your definitive solution.
🧠 The Core Element: Predictive Market Context & Directional ForecastThe foundational strength of the POWER INDICATOR is its ability to forecast the market's bias through advanced quantification:
🚀 Directional Pre-Cognition (LRC & Mathematical Models):The system utilizes the Linear Regression Curve (LRC) and proprietary statistical models as its core mathematical engine. This process extrapolates the probable trend path and generates a Directional Forecast for the coming bars, enabling you to anticipate moves rather than react to them. This forecast serves as the ultimate bias filter.
🧠 The Convictional Filter: Quantifying Probability ($60\%$ Confidence):This filter is our proprietary Probability Brain. It eliminates market noise by forcing convergence across multiple high-level factors (MTF agreement, Momentum, SMC levels).High-Conviction Threshold: Independent analysis confirms that the Conviction Filter provides an exceptionally high win rate and signal quality starting at just $60\%$. Setting your threshold at this level ensures you only consider trades where the predictive mathematical components are in strong alignment.
🌊 FVG & GP Predictive Zones:The system automatically identifies and projects critical Fair Value Gaps (FVG/LSOB) and the Golden Pocket (GP) Re-Test Zone. These zones are algorithmically identified as high-probability targets for pullbacks and reversals, providing a clear map of where liquidity will be sought.
💡 The Convictional Trading Workflow: A 3-Step Guide to ExecutionContext Check: Confirm the LRC Directional Forecast aligns with your trade and the Conviction Score Meter is above your desired threshold (minimum $60\%$).Optimal Entry: Wait for the signal to trigger at a high-R:R entry point (GP, FVG, or Aggressive Impulse), guided by your chosen trading mode.Dynamic Management: Let the system handle risk, utilizing Structural SL and automatic Multi-Method Trailing Stops post-TP1.
🎯 Mode Selection: Matching Strategy to MarketThe indicator's power lies in its Modularity. Selecting the correct mode is crucial for optimizing your results.Trading StyleRecommended ModesPrimary Rationale & Entry LogicHigh-Frequency ScalpingCT Scalp-OnlyDesigned for counter-trend entries in a pullback towards the Golden Pocket (GP). Uses tighter SL/TP multipliers for quick profit-taking. (Fast, high-R:R)ATR Channel Scalp (ACS)Utilizes volatility channels (ATR bands) for quick mean-reversion trades when price overextends.Strategic Day Trading / Swing TradingUltimate Fusion Mode (UFM)The highest probability mode. Best for catching major shifts confirmed by SMC (LRC, GP, FVG, MSS). Waits for a deep, high-R:R Re-Test Entry.Haupttrend & Scalp (Kombi)Excellent general-purpose mode. Focuses on trend continuation but allows for high-R:R pullback entries at key levels (GP/FVG). (Balanced)FVG Mitigation Entry (FME)Ideal for SMC traders. Waits for the price to precisely re-test and mitigate an unmitigated Fair Value Gap (FVG) or Liquidity Sweep (LSOB) zone before entry.Breakout & Momentum TradingBand Breakout-OnlyTriggers an entry only when price decisively breaks outside the SMA Volatility Bands (configurable). Filtered by momentum requirements.Dynamic Range Expansion (DRE)Specifically detects low-volatility consolidation before an anticipated high-momentum expansion phase.
🔔 The Master Alert System: Your Execution EdgeThe powerful Alert functionality ensures you can monitor multiple assets and timeframes without being glued to the screen.1.
✅ Dynamic MASTER ALARM (Compact Text)The core alert uses a compact, dynamic JSON/text message that contains all necessary information for quick execution:Action: BUY / SELLMode Used: Conviction Score: Key Level: 2. LRC/GP Combo-Alert (High-R:R)This is the most valuable alert for strategic traders. It triggers only when the LRC direction is confirmed and the price enters the Golden Pocket (GP) Re-Test Zone, indicating an optimal high-R:R pullback opportunity.Final Note: To maximize the predictive power, ensure the useConvictionFilter is set to a minimum of $60\%$ and the useStructureSL is activated to protect your capital with intelligent stop placement.Stop reacting. Start predicting. Activate the POWER INDICATOR PRO PREMIUM V24 and lead the market today!
⚠️ IMPORTANT NOTICE: Full Version vs. Public Release
This current version, the POWER INDICATOR PRO PREMIUM V24 (Full Feature Test Release), is publicly available only for demonstration and testing purposes to showcase the system's full potential (including all 12 Dynamic Modes and the advanced Convictional Filter).
A slightly streamlined Public Version will remain permanently free and accessible to the community. However, the Full Premium Version—featuring the complete 12-Mode selection, all predictive functionalities, and crucial additions such as enhanced, precise Entry/Exit Labels and Dynamic Stop Loss/Take Profit Labels directly calculated by the algorithm—will soon be available exclusively for subscribers.
Test the power now and be ready for the subscription launch!

Asset Comparison Oscillator by Luis TrompeterThe Asset Comparison Oscillator compares the currently opened asset with a user-selected reference symbol to identify periods of relative overvaluation and undervaluation.
The concept is based on the idea that markets constantly seek fair value. When an asset becomes mispriced relative to a meaningful benchmark, it often moves back toward equilibrium.
This indicator measures that relationship and transforms it into an easy-to-read oscillator:
• Green Zone (Undervalued) – The selected asset is undervalued compared to the reference symbol.
This reflects potential upward pressure as markets tend to correct undervaluation over time.
• Red Zone (Overvalued) – The asset is overvalued relative to the reference symbol.
This may indicate a higher likelihood of downward movement as price seeks rebalancing.
Users can set any reference instrument they consider relevant—commodities, indices, currency pairs, or other assets. The oscillator quantifies the valuation difference based on a configurable cycle length.
The recommended setting is Cycle = 10, which provides a balanced and responsive signal structure.
Since this indicator relies on broader valuation dynamics, it is designed to be used exclusively on the daily timeframe. Lower timeframes may not reflect true fundamental value relationships.
The Asset Comparison Oscillator helps traders identify when an asset appears cheap or expensive relative to another, offering an additional layer of fundamental context to support directional trading decisions.

TTMW STR : Extreme %R #a002Authored by Kuntanut (Stamp) - To The Milky Way
Extreme %R :
The Indicator purpose is to indicate the entry signal of my strategy using the combination of the EMA and William %R.
The EMA are used as the filter for the strategy, the EMA parameters determine the bullish or bearish state of the symbol. The entry signal is generated when the condition is perfectly met.


Williams Fractals BW - Flechas + Breakoutsfractal con velas en la direccion hacia donde va para menos conficion

Williams Fractals by Sheridan Sadewa modif untuk menggunakan fractal yang ukurannya lebih kecil dan deket

Williams %R - Multi TimeframeThis indicator implements the William %R multi-timeframe. On the 1H chart, the curves for 1H (with signal), 4H, and 1D are displayed. On the 4H chart, the curves for 4H (with signal) and 1D are shown. On all other timeframes, only the %R and signal are displayed. The indicator is useful to use on 1H and 4H charts to find confluence among the different curves and identify better entries based on their alignment across all timeframes. Signals above 80 often indicate a potential bearish reversal in price, while signals below 20 often suggest a bullish price reversal.

Williams %R SKGThis is William% R indicator alongwith EMA and RSI overbought and oversold background

