在腳本中搜尋"williams"
Trend Direction Helper (ZigZag and S/R and HH/LL labels)Hey everyone
First of all, I'd like to thank Ricardo Santos, Backtest Rookies for the inspiration for this script.
Actually, most of it is coming from them and I only mixed them up (and added my secret sauce ^^). If some of you are not thinking about a trading secret sauce, please get serious for a moment :)
Some of you asked me how I do to set the trend direction. You all understood that if you get an UP label, then the price should go up and vice-versa for down.
But it's not so easy to define the good signals for each asset and each timeframe. I'm going to repeat what I said yesterday because ... well... that's what trading is about
So quoting myself here "The inputs set by default will have to be changed for your asset/timeframe and can't be generic for everything. You have to play with the inputs until the signals will make sense to you
The indicator/strategy with a unique configuration that you'll never check or update according to the market condition DOES NOT exit. "
BUT... a bit of patience and practice and you might do wonders.
The Method
I never realized until now but by connecting the higher highs/lower lows, I was drawing zigzag lines.
The Zig Zag Master is Ricardo Santos . Please give him a follow, he's awesome
For those who don't want to draw on the chart or (my preferred choice) need some inspiration to define your trend directions, this script is for YOU (and your family, your pet, your girlfriend/boyfriend, ...)
I think that each asset/timeframe chart has its own history. What worked in a post could work in the future.
In that regard, if a trend direction worked in the past, that's the parameter that I'll use to trade with it in a demo account and make sure it's relevant. If not then I will adjust
If you're trading with new indicators or a new method right away on your real trading account, you're gonna have a bad time imgflip.com
Lines EVERYWHERE
The script draws the classical horizontal pivots + the zig zag lines + the Higher Highs/Lower Lows label in just 1 script. I'm very excited to share a script (on which I coded 100 lines out of 500) but no one else did it
The horizontal pivots part are coming from Backtest Rookies
For more security, you can add a pullback on a moving average after getting a signal. Pullbacks are necessary to limit any eventual loss or maximize your gains by getting in the trend sooner.
I really give you a solid method and a great script in my opinion. 6 years of experience given away for FREE :p (when Dave will start thinking as a business man instead :O)
Does it repaint ?
Getting this question twice a day. You guys are obsessed with the repainting :)
Short answer, yes because it will calculate the pivots and zig zags whenever new higher highs/lower lows will be formed.
However, the trend direction code is based on the candle close so it shouldn't repaint. If it does, please let me know
See you all on Monday
Love you all
Dave
____________________________________________________________
Be sure to hit the thumbs up. Building those indicators take a lot of time and likes are always rewarding for me :) (tips are accepted too)
- If you want to suggest some indicators that I can develop and share with the community, please use my personal TRELLO board
- I'm an officially approved PineEditor/LUA/MT4 approved mentor on codementor. You can request a coaching with me if you want and I'll teach you how to build kick-ass indicators and strategies
Jump on a 1 to 1 coaching with me
- You can also hire for a custom dev of your indicator/strategy/bot/chrome extension/python
Disclaimer:
Trading involves a high level of financial risk, and may not be appropriate because you may experience losses greater than your deposit. Leverage can be against you.
Do not trade with capital that you can not afford to lose. You must be aware and have a complete understanding of all the risks associated with the market and trading. We can not be held responsible for any loss you incur.
Trading also involves risks of gambling addiction.
Please notice I do not provide financial advice - my indicators, strategies, educational ideas are intended to provide only some source code for anyone interested in improving their trading
The proprietary indicators and strategies developed by Best Trading Indicator, the object of intellectual property rights are and remain the exclusive property of Best Trading Indicator, at the exclusion of images and videos and texts free of rights or provided by the Company or external legal or physical person.
No assignment of intellectual property rights is carried out through these Terms and Conditions.
Any total or partial reproduction, modification or use of these properties for any reason whatsoever is strictly prohibited without the express written authorization of the Company.

Combo Strategy 123 Reversal & Bill Williams. AC with Signal Line This is combo strategies for get a cumulative signal.
First strategy
This System was created from the Book "How I Tripled My Money In The
Futures Market" by Ulf Jensen, Page 183. This is reverse type of strategies.
The strategy buys at market, if close price is higher than the previous close
during 2 days and the meaning of 9-days Stochastic Slow Oscillator is lower than 50.
The strategy sells at market, if close price is lower than the previous close price
during 2 days and the meaning of 9-days Stochastic Fast Oscillator is higher than 50.
Second strategy
This indicator plots the oscillator as a histogram where blue denotes
periods suited for buying and red . for selling. If the current value
of AO (Awesome Oscillator) is above previous, the period is considered
suited for buying and the period is marked blue. If the AO value is not
above previous, the period is considered suited for selling and the
indicator marks it as red.
You can make changes in the property for set calculating strategy MA, EMA, WMA
WARNING:
- For purpose educate only
- This script to change bars colors.

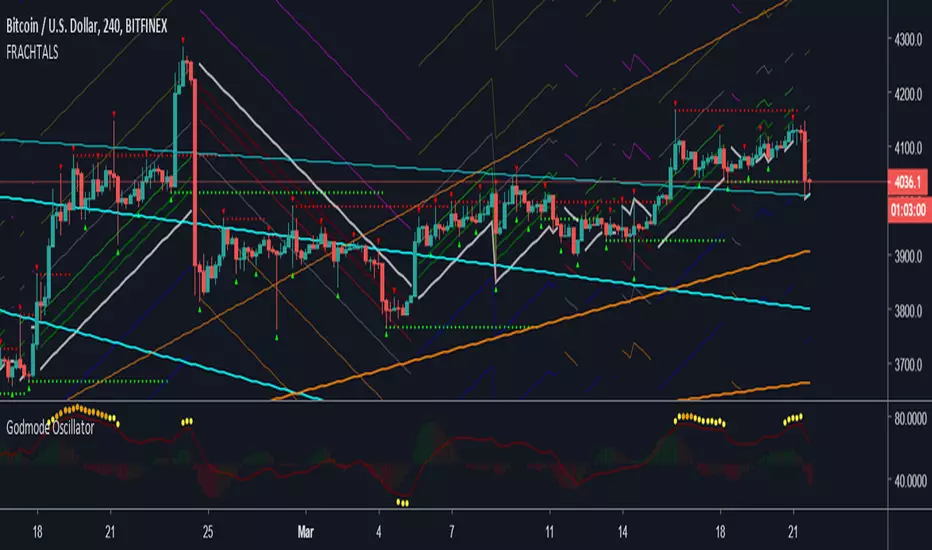
[AU] Fibonacci Fractal Regression ChannelFibonacci Fractal Regression Channel v01
Based upon:
Fractal Regression Channel V0 () by @RicardoSantos
Note: For use on 4H charts and lower intervals/timeframes
FRACHTALS"FRACHTALS" - A practical example of taking a joke entirely way, way too far
Speaking of which - Moon when?
#REKT
Credits/Acknowledgements/References:
Fractal detection + other functions (@RicardoSantos)
Laguerre RSI w/ self-Adjusting Alpha (@everget)
TB!G-Scalp Strategy [Alert]Scalping Crypto Assets Made Easy
TB!G-Scalp is a TradingView based alert and accompanying strategy PineV3 Script.
Backtest vs Realtime
When designing the algorithms for this strategy our focus was primarily on ease of use.This results in a beautiful yet easy to use scalping strategy. As input it takes a chart period and only one extra parameter for fine tuning. The backtest results are an accurate representation of it’s real-time behaviour.
What makes it tick?
Over the last 2 years we collected a lot of market data regarding Bull and Bear behaviours. This previous market behaviour echo’s into the current market trend.
By recognising these echo’s we are able to anticipate an upcoming micro reversal which eventually end up being a scalping strategy.
Interested
Access is provided to a limited amount of people and for the duration that is determined by it’s Alpha Decay Rate.
This ADR is expected to become problematic after 2.3 year of usage on a lot of 150 users.

Vilarso S1This indicator shows fractals. The main levels of support and resistance. Arrows point to buy and sell zones - great for scalping. And the most important thing is the 5 moving averages SMA by which you can determine the direction of the trend, its support and resistance zones. It is very convenient when different averages for junior and senior periods from 9 to 200 are displayed in one indicator. I installed the standard: 9, 21, 55, 100, 200.
Recommendation: You can reconfigure all 5 mediums on your own. And work out the medium crossings according to your trading strategy.
For example, on my daily timeframe, use my template, and on smaller timeframes you can edit by Fibonacci numbers: 5, 8, 13, 21, 34, 55, 89, 144, 233
Vilarso - recommends you to experiment!
Add to your favorite scripts and trade in profit!

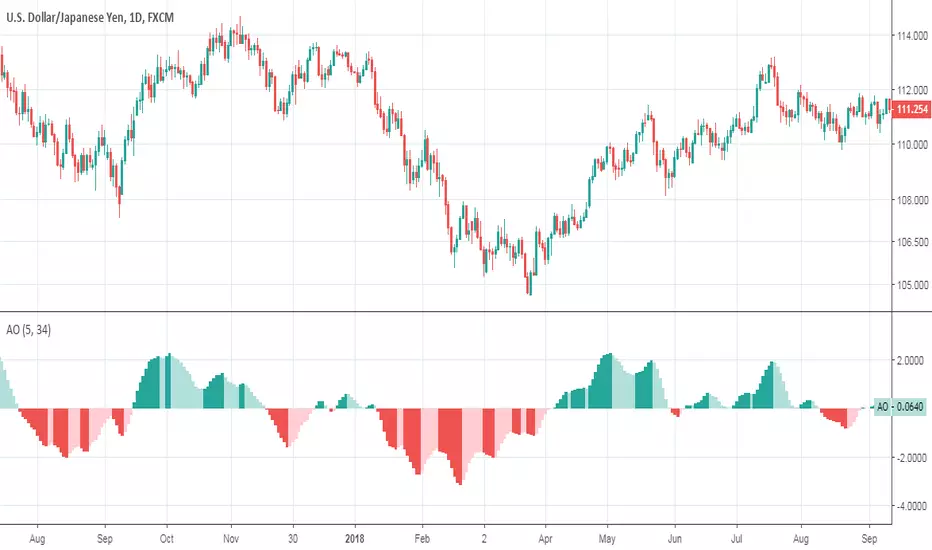
Gator OscillatorThis indicator was originally developed by Bill M. Williams. It shows the degree of convergence / divergence of the Alligator lines.

Accelerator OscillatorThis indicator was originally developed by Bill M. Williams. Also known as Acceleration/Deceleration Oscillator.

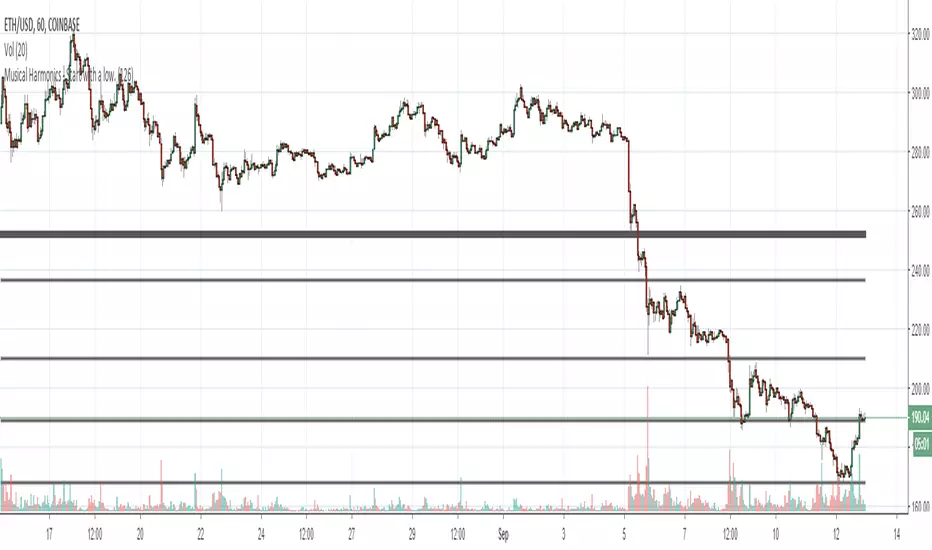
Musical Harmonics - Start with a low.Octaves double from one octave to another, so start with octaves beginning with the number one, for example:
1 doubled is 2, 2 doubled is 4, 4 double is 8 and then we go on to this sequence:
1,2,4,8,16,32,64,126,256,512,1024,2048,etc,etc
Find one of the numbers near a range, so for example on this chart Ethereum was trading at 190.31. That price is in between the octaves of 126 and 256. The number I use as the low for the indicator is 126.
Working on updating with labels and such
BottomFinder Adv. Charts Suite V2.0With the advanced charts suite you get multiple indicators you can overlay on your charts, while only using one indicator slot. We made this after requests from our members, to assist those who use a free TV account. IT can take a minute or more to load... be patient! Its not advised to use them all at once, use them in combinations and see what works for you! I wanted to include more indicators, but hit some of the limits imposed by pine script. All options are off by default.
Included are:
Ichimoku Cloud
Support Resistance Fractal
Trailing Long/Short Stoploss
Bull Bear Squares
Triple Hull Moving Average
Standard Hull Moving Average
Fibonacci Daily
Advance Decline Lines
This indicator is available to all our members at no extra charge. If you would like access join us in the link from my signature. You can get a trial of our paid indicators and access to the free ones as well.
Please also like this indicator, and follow me on TradingView for access! We have many more great free indicators coming in the future!

3 Moving Average ExponentialSince I noticed there was no Script with actually 3 EMA together (all the ones I found said it was Exponential, but actually was Simple), i created this one.
The lengths, 17 72 305, are based on the phi cube theory, introduced by Bo Williams. The slow length (305) indicate a likely strong support/resistance and the region between the fast and medium lengths (17, 72) indicate where the price tends to return after a boost or little diversion from the price average.

Fractal HelperA spinoff from a previous script I published, this configurable indicator also selects highs and lows and then plots a trend line that bounces between them. In addition, it also iterates this up to two more times in a quasi-fractal manner, on larger time scales, and plots them on the same graph.
Of course this will not spit out Elliott waves, but with adjusting, it could aid in discerning one wave from another.
I may experiment with the security function again to get a better, longer L3 plot, although charts are limited in duration anyway.

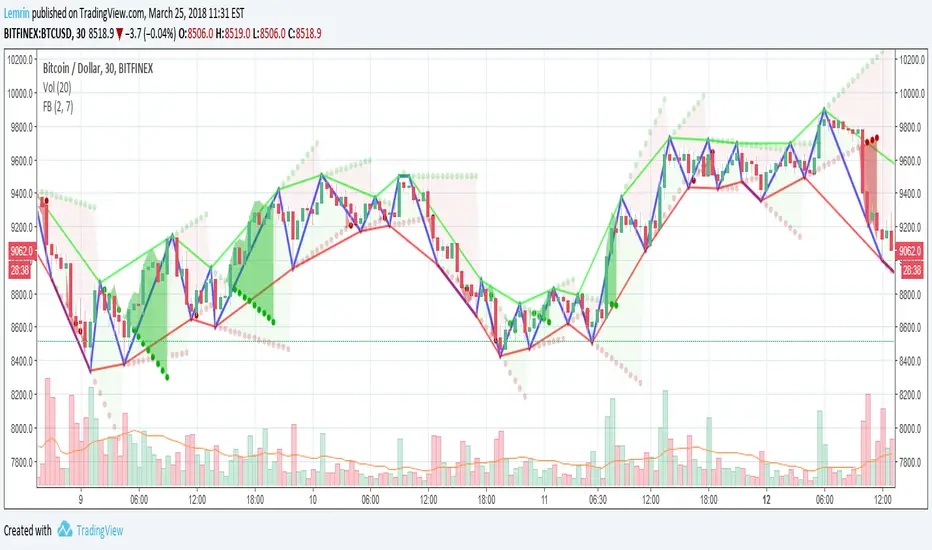
Fractal Breakout V2Version 2 of my fractal pattern aid ( Version 1 ).
I added a bouncing line between the high and low trend lines, connecting consecutive extreme points. I also chased down a pesky bug in the slope calculation...and for now I have disabled the ability to change resolution basis for extreme detection (e.g. 30m on a 1hr chart).
For fun, I added some shading to make it more apparent at a glance what is happening, but if you find it gimmicky, there's an option to turn that off.
I am inexperienced with pattern recognition, so please send feedback if you have any ideas that would make this more useful.
Thanks!
Lemrin
Blast Off Momentum [DW]This study is an alternative experimental interpretation of the Blast Off Indicator by Larry Williams.
This formula takes positive and negative magnitudes rather than the absolute value. The result is then smoothed with an EMA, and twice smoothed to provide a signal line.

DAILY - 3-Condition Arrows - Buy & SellVersion 1.
On the DAILY time frame, this indicator will add a green BUY arrow to a stock price when the following 3 conditions are ALL true:
BUY (all 3 conditions are true)
1. Stock price > 50 EMA
2. MACD line above moving average
3. Williams %R (Best_Solve version) is above moving average
Conversely, a red SELL arrow will point out when the following 3 conditions are ALL true:
SELL (all 3 conditions are true)
1. Stock price < 50 EMA
2. MACD line below moving average
3. Williams %R (Best_Solve version) is below the moving average

WEEKLY - 3-Condition Arrows - Buy & SellVersion 1.
On the WEEKLY time frame, this indicator will add a green BUY arrow to a stock price when the following 3 conditions are ALL true:
BUY (all 3 conditions are true)
1. Stock price > 50 EMA
2. MACD line above moving average
3. Williams %R (Best_Solve version) is above moving average
Conversely, a red SELL arrow will point out when the following 3 conditions are ALL true:
SELL (all 3 conditions are true)
1. Stock price < 50 EMA
2. MACD line below moving average
3. Williams %R (Best_Solve version) is below the moving average

Fat Tony's Composite Momentum Histogram (v01)# Fat Tony's Composite Momentum Histogram
## What It Does
This indicator combines four momentum oscillators into a single composite signal that ranges approximately from -100 to +100. It identifies potential overbought and oversold conditions while weighting signals by volume activity to filter out weak moves.
The histogram shows momentum strength with color-coded bars:
- **Red bars** indicate extreme overbought conditions (above +100)
- **Green bars** indicate extreme oversold conditions (below -100)
- **Blue bars** show positive momentum in normal range
- **Orange bars** show negative momentum in normal range
## Core Components
The indicator blends these four momentum measures:
1. **Williams %R** - Measures where price closed relative to the high-low range
2. **Stochastic %K** - Compares closing price to the recent price range
3. **MACD Histogram** - Shows momentum changes via moving average convergence/divergence
4. **ROC (Rate of Change)** - Measures percentage price change, normalized by volatility
Each component is scaled to a -50 to +50 range, then averaged together. The MACD component uses adaptive scaling based on its historical volatility to remain relevant across different market conditions.
## Volume Weighting
The indicator amplifies signals when volume is elevated and dampens them when volume is low. It uses a logarithmic scaling approach to smooth extreme volume spikes. There's also a minimum volume filter that prevents signals from triggering during very low-volume periods.
## Settings Explained
**Momentum Settings:**
- **Length (14)** - Lookback period for Williams %R and Stochastic calculations
- **MACD Fast/Slow/Signal (12/26/9)** - Standard MACD parameters
- **ROC Length (10)** - Lookback for rate of change calculation
- **MACD StDev Length (200)** - Historical window for normalizing MACD values
**Levels:**
- **Overbought Level (+100)** - Threshold for extreme upside momentum
- **Oversold Level (-100)** - Threshold for extreme downside momentum
**Volume Settings:**
- **Enable Volume Weighting** - Toggle volume amplification on/off
- **Volume Sensitivity (1.5)** - Controls how much volume impacts the signal (higher = stronger impact)
- **Min Avg Volume (50,000)** - Filters out signals when 5-bar average volume is too low
**Components:**
- **Include ROC Component** - Toggle to add/remove ROC from the calculation
- **Enable Trend Filter** - Only allows signals aligned with the 200-period EMA trend
- **Show Component Plots** - Displays individual oscillator values for tuning purposes
## Trading Signals
**Entry Signals:**
- **Long (green triangle)** - Composite crosses above the oversold level with adequate volume
- **Short (red triangle)** - Composite crosses below the overbought level with adequate volume
**Exit Signals (when trend filter enabled):**
- **Long Exit** - Composite crosses below zero from positive territory
- **Short Exit** - Composite crosses above zero from negative territory
The indicator also provides alert conditions for automated notifications on these signal events.

Bifurcation Point Adaptive (Auto Oscillator ML)Bifurcation Point Adaptive - Auto Oscillator ML
Overview
Bifurcation Point Adaptive (🧬 BPA-ML) represents a paradigm shift in divergence-based trading systems. Rather than relying on static oscillator settings that quickly become obsolete as market dynamics shift, BPA-ML employs multi-armed bandit machine learning algorithms to continuously discover and adapt to the optimal oscillator configuration for your specific instrument and timeframe. This self-learning core is enhanced by a Cognitive Analytical Engine (CAE) that provides market-state intelligence, filtering out low-probability setups before they reach your chart.
The result is a system that doesn't just detect divergences - it understands context, learns from outcomes, and evolves with the market.
What Sets This Apart: Technical Comparison
The TradingView community has many excellent divergence indicators and several claiming "machine learning" capabilities. However, a detailed technical analysis reveals that BPA-ML operates at a fundamentally different level of sophistication.
Machine Learning: Real vs Marketing
Most indicators labeled "ML" or "AI" on TradingView use one of three approaches:
K-Nearest Neighbors (KNN): These indicators find similar historical patterns and assume current price will behave similarly. This is pattern matching, not learning. The system doesn't improve over time or adapt based on outcomes - it simply searches historical data for matches.
Clustering (K-Means): These indicators group volatility or market states into categories (high/medium/low). This is statistical classification, not machine learning. The clusters are recalculated but don't learn which classifications produce better results.
Gaussian Process Regression (GPR): These indicators use kernel weighting to create responsive moving averages. This is advanced curve fitting, not learning. The system doesn't evaluate outcomes or adjust strategy.
BPA-ML's Approach: True Reinforcement Learning
BPA-ML implements multi-armed bandit algorithms - a proven reinforcement learning technique used in clinical trials, A/B testing, and recommendation systems. This is fundamentally different:
Exploration vs Exploitation: The system actively balances trying new configurations (exploration) against using proven winners (exploitation). KNN and clustering don't do this - they simply process current data against historical patterns.
Reward-Based Learning: Every configuration is scored based on actual forward returns, normalized by volatility and clipped to prevent outlier dominance. The system receives a bonus when signals prove profitable. This creates a feedback loop where the indicator literally learns what works for your specific instrument and timeframe.
Four Proven Algorithms: UCB1 (Upper Confidence Bound), Thompson Sampling (Bayesian), Epsilon-Greedy, and Gradient-based learning. Each has different exploration characteristics backed by peer-reviewed research. You're not getting marketing buzzwords - you're getting battle-tested algorithms from academic computer science.
Continuous Adaptation: The learning never stops. As market microstructure evolves, the bandit discovers new optimal configurations. Other "adaptive" indicators recalculate but don't improve - they use the same logic on new data. BPA-ML fundamentally changes which logic it uses based on what's working.
The Configuration Grid: 40 Arms vs Fixed Settings
Traditional divergence indicators use a single oscillator with fixed parameters - typically RSI with length 14. More advanced systems might let you choose between RSI, Stochastic, or CCI, but you're still picking one manually.
BPA-ML maintains a grid of 40 candidate configurations:
- 5 oscillator families (RSI, Stochastic, CCI, MFI, Williams %R)
- 4 length parameters (short, medium, medium-long, long)
- 2 smoothing settings (fast, slow)
The bandit evaluates all 40 continuously and automatically selects the optimal one. When market microstructure changes - say, from trending crypto to ranging forex - the system discovers this and switches configurations without your intervention.
Why This Matters: Markets exhibit different characteristics. Bitcoin on 5-minute charts might favor fast Stochastic (high sensitivity to quick moves), while EUR/USD on 4-hour charts might favor smoothed RSI (filtering noise in steady trends). Manual optimization is guesswork. The bandit discovers these nuances mathematically.
Cognitive Analytical Engine: Beyond Simple Filters
Many divergence indicators include basic filters - perhaps checking if RSI is overbought/oversold or if volume increased. These are single-metric gates that treat all market states the same.
BPA-ML's CAE synthesizes five intelligence layers into a comprehensive market-state assessment:
Trend Conviction Score (TCS): Combines ADX normalization, multi-timeframe EMA alignment, and structural persistence. This isn't just "is ADX above 25?" - it's a weighted composite that captures trending vs ranging regimes with nuance. The threshold itself is adaptive via mini-bandit if enabled.
Directional Momentum Alignment (DMA): ATR-normalized EMA spread creates a regime-aware momentum indicator. The same price move reads differently in high vs low volatility environments. Most indicators ignore this context.
Exhaustion Modeling: Aggregates volume spikes, pin bar formations, extended runs without pullback, and extreme oscillator readings into a unified probability of climax. This multi-factor approach catches exhaustion signals that single metrics miss. High exhaustion can override trend filters - allowing reversal trades at genuine turning points that basic filters would block.
Adversarial Validation: Before approving a bullish signal, the engine quantifies both the bull case AND the bear case. If the opposing case dominates by a threshold, the signal is blocked. This is game-theory applied to trading - most indicators don't check if you're fighting obvious strength in the opposite direction.
Confidence Scoring: Every signal receives a 0-1 quality score blending all CAE components plus divergence strength. You can size positions by confidence - a concept absent in most divergence indicators that treat all signals identically.
Adaptive Parameters: Mini-Bandits
Even the filtering thresholds themselves learn. Most indicators have you set pivot lookback periods, minimum divergence strength, and trend filter strictness manually. These are instrument-specific - what works for one asset fails on another.
BPA-ML's mini-bandits optimize:
- Pivot lookback strictness (balance between catching small structures vs requiring major swings)
- Minimum slope change threshold (filter weak divergences vs allow early entries)
- TCS threshold for trend filtering (how strict counter-trend blocking should be)
These learn the same way the oscillator bandit does - via reward scoring and outcome evaluation. The entire system personalizes to your trading context.
Visual Intelligence: Five Presentation Modes
Most indicators offer basic customization - perhaps choosing colors or line thickness. BPA-ML includes five distinct visual modes, each designed for specific use cases:
Quantum Mode: Renders signals as probability clouds where opacity encodes confidence. High-confidence signals are bold and opaque; low-confidence signals are faint and translucent. This visually guides position sizing in a way that static markers cannot. No other divergence indicator I've found uses confidence-based visual encoding.
Holographic Mode: Multi-layer gradient bands create depth perception showing signal quality zones. Excellent for teaching and presentations.
Cyberpunk Mode: Neon centerlines with particle glow trails. High-contrast for immersive dark-theme trading.
Standard Mode: Professional dashed lines and zones. Clean, presentation-ready.
Minimal Mode: Maximum performance for backtesting and low-powered devices.
The visual system isn't cosmetic - it's part of the decision support infrastructure.
Dashboard: Real-Time Intelligence
Many indicators include dashboards showing current indicator values or basic statistics. BPA-ML's dashboard is a comprehensive control center:
Oscillator Section: Shows which configuration is currently selected, why it's selected (pull statistics, reward scores), and learning progression (warmup, learning, active).
CAE Section: Real-time TCS, DMA, Exhaustion, Adversarial cases, and Confidence scores with visual indicators (emoji-coded states, bar graphs, trend arrows).
Bandit Performance: Algorithm selection, mode (Switch vs Blend), arm distribution, differentiation metrics, learning diagnostics.
State Metrics Grid (Large mode): Normalized readings for trend alignment, momentum, volatility, volume flow, Bollinger position, ROC, directional movement, oscillator bias - all synthesized into a composite market state.
This level of transparency is rare. Most "black box" indicators hide their decision logic. BPA-ML shows you exactly why it's making decisions in real-time, enabling informed discretionary overrides.
Repainting: Complete Transparency
Many divergence indicators don't clearly disclose repainting behavior. BPA-ML offers three explicit timing modes:
Realtime: Shows developing signals on current bar. Repaints by design - this is a preview mode for learning, not for trading.
Confirmed: Signals lock at bar close. Zero repainting. Recommended for live trading.
Pivot Validated: Waits for full pivot confirmation (5+ bar delay). Highest purity, zero repainting, ideal for backtesting divergence quality.
You choose the mode based on your priority - speed vs certainty. The transparency empowers rather than obscures.
Educational Value: Learning Platform
Most indicators are tools - you use them, but you don't learn from them. BPA-ML is designed as a learning platform:
Advisory Mode: Signals always appear, but blocked signals receive warning annotations explaining why CAE would have filtered them. You see the decision logic in action without missing learning opportunities.
Dashboard Transparency: Real-time display of all metrics shows exactly how market state influences decisions.
Comprehensive Documentation: In-indicator tooltips, extensive publishing statement, and user guides explain not just what to click, but why the algorithms work and how to apply them strategically.
Algorithm Comparisons: By trying different bandit algorithms (UCB1 vs Thompson vs Epsilon vs Gradient), you learn the differences between exploration strategies - knowledge applicable beyond trading.
This isn't just a signal generator - it's an educational tool that teaches machine learning concepts, market intelligence interpretation, and systematic decision-making.
What This System Is NOT
To be completely transparent about positioning:
Not a Prediction System: BPA-ML doesn't predict future prices. It identifies structural divergences, assesses current market state, and learns which oscillator configurations historically correlated with better forward returns. The learning is retrospective optimization, not fortune telling.
Not Fully Automated: This is a decision support tool, not a push-button profit machine. You still need to execute trades, manage risk, and apply discretionary judgment. The confidence scores guide position sizing, but you determine final risk allocation.
Not Beginner-Friendly: The sophistication comes with complexity. This system requires understanding of divergence trading, basic machine learning concepts, and market state interpretation. It's designed for intermediate to advanced traders willing to invest time in learning the system.
Not Magic: Even with optimal configurations and intelligent filtering, markets are probabilistic. Losing trades are inevitable. The system improves your probability distribution - it doesn't eliminate risk or guarantee profits.
The Fundamental Difference
Here's the core distinction:
Traditional Divergence Indicators: Detect patterns and hope they work.
"ML" Indicators (KNN/Clustering): Detect patterns and compare to historical similarities.
BPA-ML: Detects patterns, evaluates outcomes, learns which detection methods work best for this specific context, understands market state before suggesting trades, and continuously improves without manual intervention.
The difference isn't incremental - it's architectural. This is trading system infrastructure with embedded intelligence, not just a pattern detector with filters.
Who This Is For
BPA-ML is ideal for traders who:
- Value systematic approaches over discretionary guessing
- Appreciate transparency in decision logic
- Are willing to let systems learn over 200+ bars before judging performance
- Trade liquid instruments on 5-minute to daily timeframes
- Want to learn machine learning concepts through practical application
- Seek professional-grade tools without institutional price tags
It's not ideal for:
- Absolute beginners needing simple plug-and-play systems
- 1-minute scalpers (noise dominates at very low timeframes)
- Traders of illiquid instruments (insufficient data for learning)
- Those seeking magic solutions without understanding methodology
- Impatient optimizers wanting instant perfection
What Makes This Original
The innovation in BPA-ML lies in three interconnected breakthroughs that work synergistically:
1. Multi-Armed Bandit Oscillator Selection
Traditional divergence indicators require manual optimization - you choose RSI with a length of 14, or Stochastic with specific settings, and hope they work. BPA-ML eliminates this guesswork through machine learning. The system maintains a grid of 40 candidate oscillator configurations spanning five oscillator families (RSI, Stochastic, CCI, MFI, Williams %R), four length parameters, and two smoothing settings. Using proven bandit algorithms (UCB1, Thompson Sampling, Epsilon-Greedy, or Gradient-based learning), the system continuously evaluates which configuration produces the best forward returns and automatically switches to the winning arm. This isn't random testing - it's intelligent exploration with exploitation, balancing the discovery of new opportunities against leveraging proven configurations.
2. Cognitive Analytical Engine (CAE)
Divergences occur constantly, but most fail. The CAE solves this by computing a comprehensive market intelligence layer:
Trend Conviction Score (TCS): Synthesizes ADX normalization, multi-timeframe EMA alignment, and structural persistence into a single 0-1 metric that quantifies how strongly the market is trending. When TCS exceeds your threshold, the system knows to avoid counter-trend trades unless other factors override.
Directional Momentum Alignment (DMA): Measures the spread between fast and slow EMAs, normalized by ATR. This creates a regime-aware momentum indicator that adjusts its interpretation based on current volatility.
Exhaustion Modeling: Aggregates volume spikes, pin bar formations, extended runs above/below EMAs, and extreme RSI readings into a probability that the current move is reaching climax. High exhaustion can override trend filters, allowing reversal trades at genuine turning points.
Adversarial Validation: Before approving a bullish signal, the engine quantifies both the bull case (proximity to support EMAs, oversold conditions, volume confirmation) and the bear case (distance to resistance, overbought conditions). If the opposing case dominates by your threshold, the signal is blocked or flagged with a warning.
Confidence Scoring: Every signal receives a 0-1 confidence score blending TCS, momentum magnitude, pullback quality, market state metrics, divergence strength, and adversarial advantage. You can gate signals on minimum confidence, ensuring only high-probability setups reach your attention.
3. Adaptive Parameter Mini-Bandits
Beyond the oscillator itself, BPA-ML uses additional bandit systems to optimize:
- Pivot lookback strictness
- Minimum slope change threshold
- TCS threshold for trend filtering
These parameters are often instrument-specific. The adaptive bandits learn these nuances automatically.
Why These Components Work Together
Each layer serves a specific purpose in the signal generation hierarchy:
Layer 1 - Oscillator Selection: The bandit ensures you're always using the oscillator configuration best suited to current market microstructure.
Layer 2 - Divergence Detection: With the optimal oscillator selected, the engine scans for structural divergences using confirmed pivots.
Layer 3 - CAE Filtering: Raw divergences are validated against market intelligence.
Layer 4 - Spacing & Timing: Quality signals need proper spacing to avoid over-trading.
This isn't a random collection of indicators. It's a decision pipeline where each stage refines signal quality, and the machine learning ensures the entire system stays calibrated to your specific trading context.
Core Components - Deep Dive
Divergence Engine
The foundation is a dual-mode divergence detector:
Regular Divergence: Price makes a higher high while oscillator makes a lower high (bearish), or price makes a lower low while oscillator makes a higher low (bullish). These signal potential reversals.
Hidden Divergence: Price makes a lower high while oscillator makes a higher high (bullish continuation), or price makes a higher low while oscillator makes a lower low (bearish continuation). These signal trend strength.
Pivots are confirmed using symmetric lookback periods. Divergence strength is quantified via slope separation between price and oscillator.
Signal Timing Modes
Realtime (live preview): Shows potential signals on current bar. Repaints by design. Use for learning only.
Confirmed (1-bar delay): Signals lock at bar close. No repainting. Recommended for live trading.
Pivot Validated: Waits for full pivot confirmation (5+ bar delay). Highest purity, best for backtesting.
Multi-Armed Bandit Algorithms
UCB1: Optimism under uncertainty. Excellent balance for most use cases.
Thompson Sampling: Bayesian approach with smooth exploration. Great for long-term adaptation.
Epsilon-Greedy: Simple exploitation with random exploration. Easy to understand.
Gradient-based: Lightweight weight adjustment based on rewards. Fast and efficient.
Bandit Operating Modes
Switch Mode: Uses top-ranked arm directly. Maximum amplitude, crisp signals.
Blend Mode: Softmax mixture with dominant-arm preservation. Ensemble stability while maintaining amplitude for overbought/oversold crossings.
How to Use This Indicator
Initial Setup
1. Apply BPA-ML to your chart
2. Select visual mode (Minimal/Standard/Holographic/Cyberpunk/Quantum)
3. Choose signal timing - "Confirmed (1-bar delay)" for live trading
4. Set Oscillator Type to "Auto (ML)" and enable it
5. Select bandit algorithm - UCB1 recommended
6. Choose Blend mode with temperature 0.4-0.5
CAE Configuration
Start with "Advisory" mode to learn the system. Signals appear with warnings if CAE would have blocked them.
Switch to "Filtering" mode when comfortable - CAE actively blocks low-quality signals.
Enable the three primary filters:
- Strong Trend Filter
- Adversarial Validation
- Confidence Gating
Parameter Guidance by Trading Style
Scalping (1-5 minute charts):
- Algorithm: Thompson or UCB1
- Mode: Blend (temp 0.3-0.4)
- Horizon: 8-12 bars
- Min Confidence: 0.30-0.40
- TCS Threshold: 0.70-0.80
- Spacing: 8-12 any, 16-24 same-side
Day Trading (15min-1H charts):
- Algorithm: UCB1
- Mode: Blend (temp 0.4-0.6)
- Horizon: 12-24 bars
- Min Confidence: 0.35-0.45
- TCS Threshold: 0.80-0.85
- Spacing: 12-20 any, 20-30 same-side
Swing Trading (4H-Daily charts):
- Algorithm: UCB1 or Thompson
- Mode: Blend (temp 0.6-1.0) or Switch
- Horizon: 20-40 bars
- Min Confidence: 0.40-0.55
- TCS Threshold: 0.85-0.95
- Spacing: 20-40 any, 30-60 same-side
Signal Interpretation
Bullish Signals: Green markers below price. Enter long when detected.
Bearish Signals: Red markers above price. Enter short when detected.
Blocked Signals: Orange X markers show filtered signals (Advisory mode).
Confidence Rings: Single ring at 50%+ confidence, double at 70%+. Use for position sizing.
Dashboard Metrics
Oscillator Section: Shows active type, value, state, and parameters.
Cognitive Engine:
- TCS: 0.80+ indicates strong trend
- DMA: Momentum direction and strength
- Exhaustion: 0.75+ warns of reversal
- Bull/Bear Case: Adversarial scoring
- Differential: Net directional advantage
Bandit Performance: Shows algorithm, mode, selected configuration, and learning diagnostics.
Visual Zones
- Bullish Zone: Blue/cyan tint - favorable for longs
- Bearish Zone: Red/magenta tint - favorable for shorts
- Exhaustion Zone: Yellow warning - reduce sizing
Visual Mode Selection
Minimal: Clean triangles, maximum performance
Standard: Dashed lines with zones, professional presentation
Holographic: Gradient bands, excellent for teaching
Cyberpunk: Neon glow trails, high contrast
Quantum: Probability cloud with confidence-based opacity
Calculation Methodology
Oscillator Computation
For each bandit arm: calculate base oscillator, apply smoothing, normalize to 0-100.
Switch mode: use top arm directly.
Blend mode: softmax mixture blended with dominant arm (70/30) to preserve amplitude.
Divergence Detection
1. Identify price and oscillator pivots using symmetric periods
2. Store recent pivots with bar indices
3. Scan for slope disagreements within lookback range
4. Require minimum slope separation
5. Classify as regular or hidden divergence
6. Compute strength score
CAE Metrics
TCS: 0.35×ADX + 0.35×structural + 0.30×alignment
DMA: (EMA21 - EMA55) / ATR14
Exhaustion: Aggregates volume, divergence, RSI extremes, pins, extended runs
Confidence: 0.30×TCS + 0.25×|DMA| + 0.20×pullback + 0.15×state + 0.10×divergence + adversarial
Bandit Rewards
Every horizon period: compute log return normalized by ATR, clip to ±0.5, bonus if signal was positive. Update arm statistics per algorithm.
Ideal Market Conditions
Best Performance:
- Liquid instruments with clear structure
- Trending markets with consolidations
- 5-minute to daily timeframes
- Consistent volume and participation
Learning Requirements:
- Minimum 200 bars for warmup
- Ideally 500-1000 bars for full confidence
- Performance improves as bandit accumulates data
Challenging Conditions:
- Extremely low liquidity
- Very low timeframes (1-minute or below)
- Extended sideways consolidation
- Fundamentally-driven gap markets
Dashboard Interpretation Guide
TCS:
- 0.00-0.50: Weak trend, reversals viable
- 0.50-0.75: Moderate trend, mixed approach
- 0.75-0.85: Strong trend, favor continuation
- 0.85-1.00: Very strong trend, counter-trend high risk
DMA:
- -2.0 to -1.0: Strong bearish
- -0.5 to 0.5: Neutral
- 1.0 to 2.0: Strong bullish
Exhaustion:
- 0.00-0.50: Fresh move
- 0.50-0.75: Mature, watch for reversals
- 0.75-0.85: High exhaustion
- 0.85-1.00: Critical, reversal imminent
Confidence:
- 0.00-0.30: Low quality
- 0.30-0.50: Moderate quality
- 0.50-0.70: High quality
- 0.70-1.00: Premium quality
Common Questions
Why no signals?
- Blend mode: lower temperature to 0.3-0.5
- Loosen OB/OS to 65/35
- Lower min confidence to 0.35
- Reduce spacing requirements
- Use Confirmed instead of Pivot Validated
Why frequent oscillator switching?
- Normal during warmup (first 200+ bars)
- After warmup: may indicate regime shifting market
- Lower temperature in Blend mode
- Reduce learning rate or epsilon
Blend vs Switch?
Use Switch for backtesting and maximum exploitation.
Use Blend for live trading with temperature 0.3-0.5 for stability.
Recalibration frequency?
Never needed. System continuously adapts via bandit learning and weight decay.
Risk Management Integration
Position Sizing:
- 0.30-0.50 confidence: 0.5-1.0% risk
- 0.50-0.70 confidence: 1.0-1.5% risk
- 0.70+ confidence: 1.5-2.0% risk (maximum)
Stop Placement:
- Reversals: beyond divergence pivot plus 1.0-1.5×ATR
- Continuations: beyond recent swing opposite direction
Targets:
- Primary: 2-3×ATR from entry
- Scale at interim levels
- Trail after 1.5×ATR in profit
Important Disclaimers
BPA-ML is an advanced technical analysis tool for identifying high-probability divergence patterns and assessing market state. It is not a complete trading system. Machine learning components adapt to historical patterns, which does not guarantee future performance. Proper risk management, position sizing, and additional confirmation methods are essential. No indicator eliminates losing trades.
Backtesting results may differ from live performance due to execution factors and dynamic bandit learning. Always validate on demo before committing real capital. CAE filtering reduces but does not eliminate false signals. Market conditions change rapidly. Use appropriate stops and never risk excessive capital on any single trade.
— Dskyz, Trade with insight. Trade with anticipation.

Composite Buy/Sell Score [-100 to +100] by LMComposite Buy/Sell Score (Stabilized + Sensitivity) by LM
Description:
This indicator calculates a composite trend strength score ranging from -100 to +100 by combining multiple popular technical indicators into a single, smoothed metric. It is designed to give traders a clear view of bullish and bearish trends, while filtering out short-term noise.
The score incorporates signals from:
PPO (Percentage Price Oscillator) – measures momentum via the difference between fast and slow EMAs.
ADX (Average Directional Index) – detects trend strength.
RSI (Relative Strength Index) – identifies short-term momentum swings.
Stochastic RSI – measures RSI momentum and speed of change.
MACD (Moving Average Convergence Divergence) – detects momentum shifts using EMA crossovers.
Williams %R – highlights overbought/oversold conditions.
Each component is weighted, smoothed, and optionally confirmed across a configurable number of bars, producing a stabilized composite score that reacts more reliably to significant trend changes.
Key Features:
Smoothed Composite Score
The final score is smoothed using an EMA to reduce volatility and emphasize meaningful trends.
A Sensitivity Multiplier allows traders to exaggerate the score for stronger trend signals or dampen it for quieter markets.
Customizable Inputs
You can adjust each indicator’s parameters, smoothing lengths, and confirm bars to suit your preferred timeframe and trading style.
The sensitivity multiplier allows fine-tuning the responsiveness of the trend line without changing underlying indicator calculations.
Visual Representation
Score Line: Green for positive (bullish) trends, red for negative (bearish) trends, gray near neutral.
Reference Lines:
0 = neutral
+100 = maximum bullish
-100 = maximum bearish
Adaptive Background: Optionally highlights the background intensity proportional to trend strength. Strong green for bullish trends, strong red for bearish trends.
Multi-Indicator Integration
Combines momentum, trend, and overbought/oversold signals into a single metric.
Helps identify clear entry/exit trends while avoiding whipsaw noise common in individual indicators.
Recommended Use:
Trend Identification: Look for sustained movement above 0 for bullish trends and below 0 for bearish trends.
Exaggerated Trends: Use the Sensitivity Multiplier to emphasize strong trends.
Filtering Noise: The smoothed score and confirmBars settings help reduce false signals from minor price fluctuations.
Inputs Overview:
Input Purpose
PPO Fast EMA / Slow EMA / Signal Controls PPO momentum sensitivity
ADX Length / Threshold Detects trend strength
RSI Length / Overbought / Oversold Measures short-term momentum
Stoch RSI Length / %K / %D Measures speed of RSI changes
MACD Fast / Slow / Signal Measures momentum crossover
Williams %R Length Detects overbought/oversold conditions
Final Score Smoothing Length EMA smoothing for final composite score
Confirm Bars for Each Signal Number of bars used to confirm individual indicator signals
Sensitivity Multiplier Scales the final composite score for exaggerated trend response
Highlight Background by Trend Strength Enables adaptive background coloring
This indicator is suitable for traders looking for a single, clear trend metric derived from multiple indicators. It can be applied to any timeframe and can help identify both strong and emerging trends in the market.
