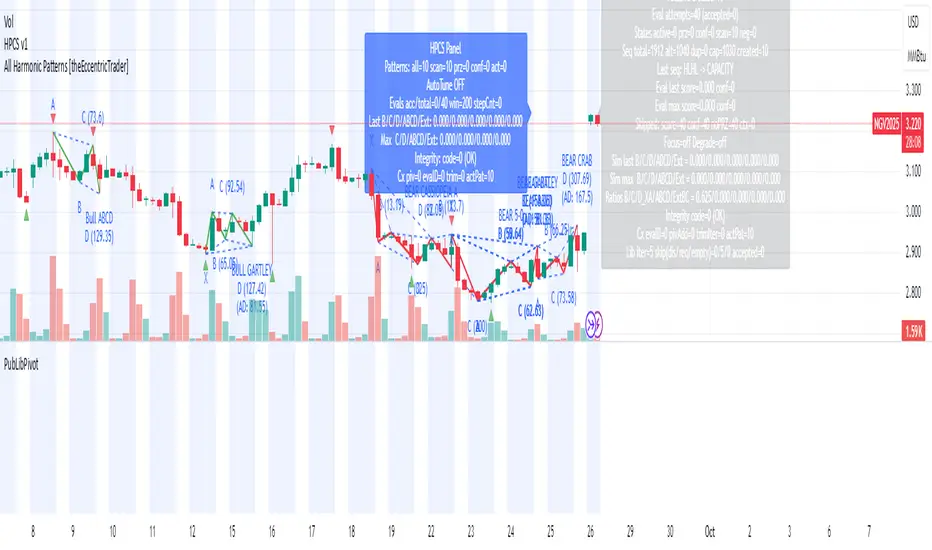
Divergence BacktesterThere is n number of possible ways in which we can backtest divergence and this is just a start :)
In this script, we are trying to count how many times the pivots made HH, HL, LH, LL after a particular divergence state.
An example of using data is as below:
The script keeps track of each pivot sentiment and resulting next pivot state. As mentioned in the chart snapshot, we can look at two of the previous pivot states and collect stats on how each of these state impacted price action.
As mentioned before, this is just tip of iceberg. Further combinations for which we can do backtest are:
1. m X n combinations of last pivot and last to last pivot divergence state
2. divergence combined with double divergence state.
Only issue to explore further is lack of space on the chart as tables can take up huge space.
PS: As you can see based on historical stats, probability of divergence impacting the change of trend is very low in most cases.
在腳本中搜尋"zigzag"

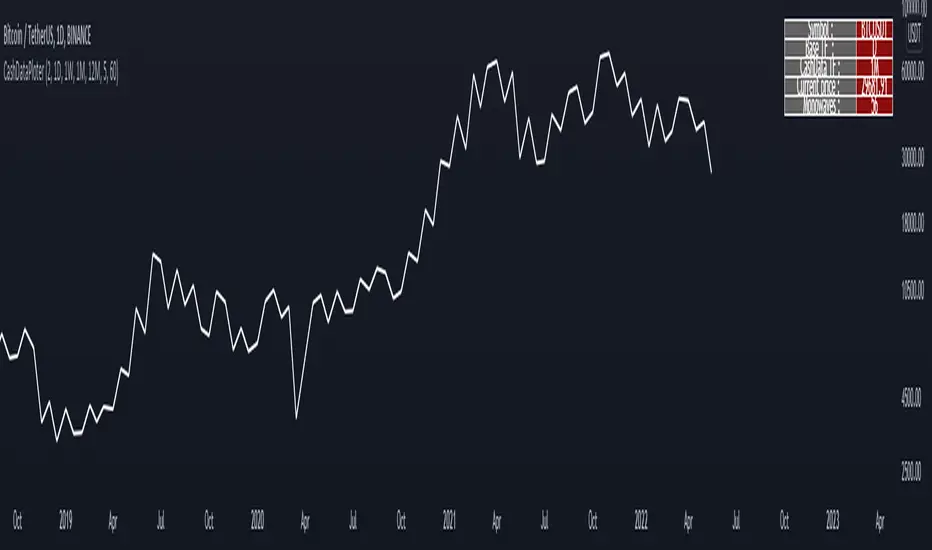
CashDataPloter Tihs indicator is able to draw cash data for :
• Annual timeframe
• Monthly, 3month, 6 month timeframe
• weekly, 2 week timeframe
• daily, 2 day, 3 day timeframe
• 6 hour, 12 hour timeframe
• 4 hour, 8 hour timeframe
• 1 hour, 2 hour, 3 hour timeframe
• 5 minute, 10 minute, 15 minute, 30 minute timeframe
other options :
• displaying information table of cash data
• choosing of cash data thickness
• choosing of bulish Monowaves color
• choosing of bearish Monowaves color
• choosing of connecting Monowaves color
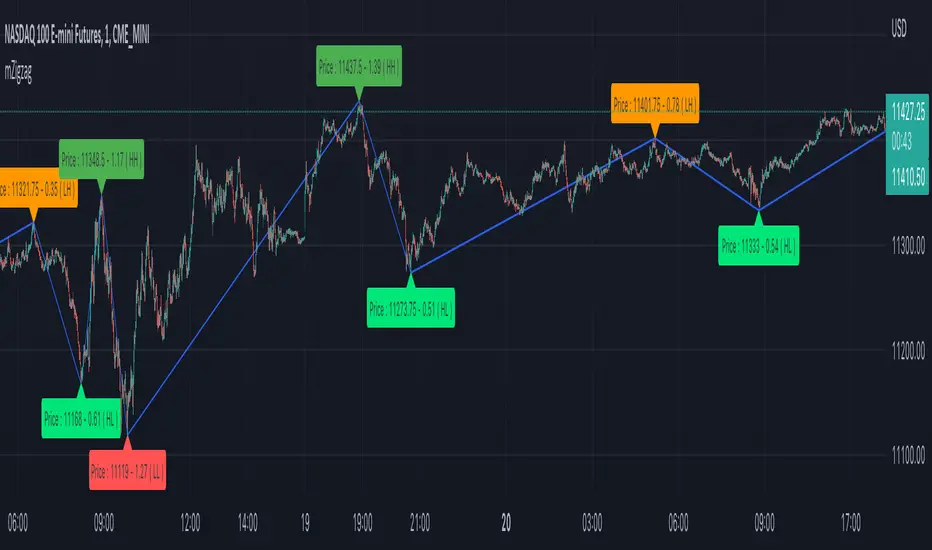
RSI Swing Indicator v2The 2nd version of this indicator came quick :)
As the previous one, it draws swings on the candlesticks, based on price action and RSI.
Also in the labels you can see if the current swing is higher or lower to the previous one.
HH stands for Higher High
LL stands for Lower Low
LH means Lower High
HL means Higher low
THIS IS NOT A STRATEGY, this is for TREND analysis.
Please stop asking if it "redraws", because it doesn't matter.
The labels are not SELL or BUY signals

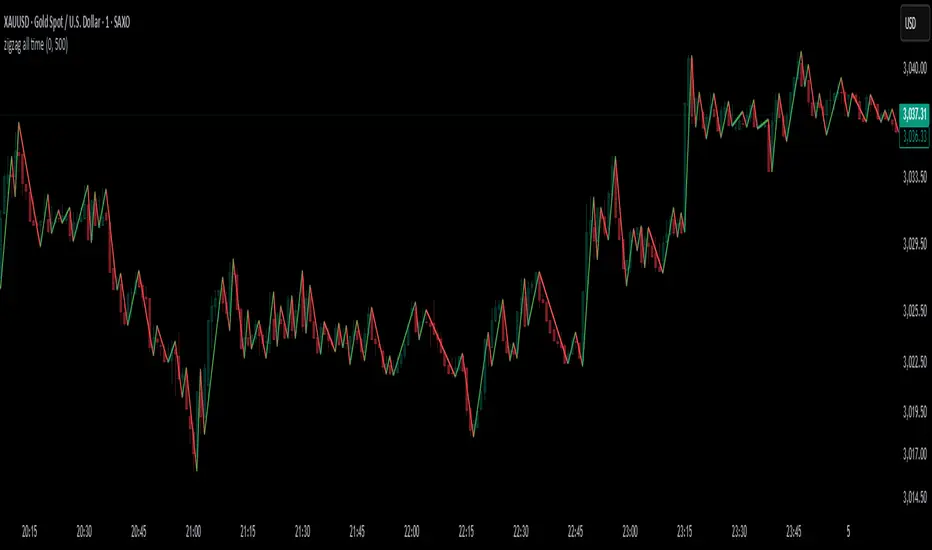
zigzag all timeThe indicator is applicable across all timeframes, meaning it can be used for short-term (e.g., minutes, hours) or long-term (e.g., days, weeks, months) trading strategies. This ensures that the analysis is versatile and adaptable to different trading styles.
rzigzagLibrary "rzigzag"
Recursive Zigzag Using Matrix allows to create zigzags recursively on multiple levels. This is an old library converted to V6
zigzag(length, ohlc, numberOfPivots, offset)
calculates plain zigzag based on input
Parameters:
length (int) : Zigzag Length
ohlc (array) : Array containing ohlc values. Can also contain custom series
numberOfPivots (simple int) : Number of max pivots to be returned
offset (simple int) : Offset from current bar. Can be used for calculations based on confirmed bars
Returns: [matrix zigzagmatrix, bool flags]
iZigzag(length, h, l, numberOfPivots)
calculates plain zigzag based on input array
Parameters:
length (int) : Zigzag Length
h (array) : array containing high values of a series
l (array) : array containing low values of a series
numberOfPivots (simple int) : Number of max pivots to be returned
Returns: matrix zigzagmatrix
nextlevel(zigzagmatrix, numberOfPivots)
calculates next level zigzag based on present zigzag coordinates
Parameters:
zigzagmatrix (matrix) : Matrix containing zigzag pivots, bars, bar time, direction and level
numberOfPivots (simple int) : Number of max pivots to be returned
Returns: matrix zigzagmatrix
draw(zigzagmatrix, flags, lineColor, lineWidth, lineStyle, showLabel, xloc)
draws zigzag based on the zigzagmatrix input
Parameters:
zigzagmatrix (matrix) : Matrix containing zigzag pivots, bars, bar time, direction and level
flags (array) : Zigzag pivot flags
lineColor (color) : Zigzag line color
lineWidth (int) : Zigzag line width
lineStyle (string) : Zigzag line style
showLabel (bool) : Flag to indicate display pivot labels
xloc (string) : xloc preference for drawing lines/labels
Returns:
draw(length, ohlc, numberOfPivots, offset, lineColor, lineWidth, lineStyle, showLabel, xloc)
calculates and draws zigzag based on zigzag length and source input
Parameters:
length (int) : Zigzag Length
ohlc (array) : Array containing ohlc values. Can also contain custom series
numberOfPivots (simple int) : Number of max pivots to be returned
offset (simple int) : Offset from current bar. Can be used for calculations based on confirmed bars
lineColor (color) : Zigzag line color
lineWidth (int) : Zigzag line width
lineStyle (string) : Zigzag line style
showLabel (bool) : Flag to indicate display pivot labels
xloc (string) : xloc preference for drawing lines/labels
Returns: [matrix zigzagmatrix, array zigzaglines, array zigzaglabels, bool flags]
drawfresh(zigzagmatrix, zigzaglines, zigzaglabels, lineColor, lineWidth, lineStyle, showLabel, xloc)
draws fresh zigzag for all pivots in the input matrix.
Parameters:
zigzagmatrix (matrix) : Matrix containing zigzag pivots, bars, bar time, direction and level
zigzaglines (array) : array to which all newly created lines will be added
zigzaglabels (array) : array to which all newly created lables will be added
lineColor (color) : Zigzag line color
lineWidth (int) : Zigzag line width
lineStyle (string) : Zigzag line style
showLabel (bool) : Flag to indicate display pivot labels
xloc (string) : xloc preference for drawing lines/labels
Returns:

ReversalChartPatternLibraryLibrary "ReversalChartPatternLibrary"
User Defined Types and Methods for reversal chart patterns - Double Top, Double Bottom, Triple Top, Triple Bottom, Cup and Handle, Inverted Cup and Handle, Head and Shoulders, Inverse Head and Shoulders
method delete(this)
Deletes the drawing components of ReversalChartPatternDrawing object
Namespace types: ReversalChartPatternDrawing
Parameters:
this (ReversalChartPatternDrawing) : ReversalChartPatternDrawing object
Returns: current ReversalChartPatternDrawing object
method delete(this)
Deletes the drawing components of ReversalChartPattern object. In turn calls the delete of ReversalChartPatternDrawing
Namespace types: ReversalChartPattern
Parameters:
this (ReversalChartPattern) : ReversalChartPattern object
Returns: current ReversalChartPattern object
method lpush(this, obj, limit, deleteOld)
Array push with limited number of items in the array. Old items are deleted when new one comes and exceeds the limit
Namespace types: ReversalChartPattern
Parameters:
this (ReversalChartPattern ) : array object
obj (ReversalChartPattern) : ReversalChartPattern object which need to be pushed to the array
limit (int) : max items on the array. Default is 10
deleteOld (bool) : If set to true, also deletes the drawing objects. If not, the drawing objects are kept but the pattern object is removed from array. Default is false.
Returns: current ReversalChartPattern object
method draw(this)
Draws the components of ReversalChartPatternDrawing
Namespace types: ReversalChartPatternDrawing
Parameters:
this (ReversalChartPatternDrawing) : ReversalChartPatternDrawing object
Returns: current ReversalChartPatternDrawing object
method draw(this)
Draws the components of ReversalChartPatternDrawing within the ReversalChartPattern object.
Namespace types: ReversalChartPattern
Parameters:
this (ReversalChartPattern) : ReversalChartPattern object
Returns: current ReversalChartPattern object
method scan(zigzag, patterns, errorPercent, shoulderStart, shoulderEnd)
Scans zigzag for ReversalChartPattern occurences
Namespace types: zg.Zigzag
Parameters:
zigzag (Zigzag type from HeWhoMustNotBeNamed/ZigzagTypes/2) : ZigzagTypes.Zigzag object having array of zigzag pivots and other information on each pivots
patterns (ReversalChartPattern ) : Existing patterns array. Used for validating duplicates
errorPercent (float) : Error threshold for considering ratios. Default is 13
shoulderStart (float) : Starting range of shoulder ratio. Used for identifying shoulders, handles and necklines
shoulderEnd (float) : Ending range of shoulder ratio. Used for identifying shoulders, handles and necklines
Returns: int pattern type
method createPattern(zigzag, patternType, patternColor, riskAdjustment)
Create Pattern from ZigzagTypes.Zigzag object
Namespace types: zg.Zigzag
Parameters:
zigzag (Zigzag type from HeWhoMustNotBeNamed/ZigzagTypes/2) : ZigzagTypes.Zigzag object having array of zigzag pivots and other information on each pivots
patternType (int) : Type of pattern being created. 1 - Double Tap, 2 - Triple Tap, 3 - Cup and Handle, 4 - Head and Shoulders
patternColor (color) : Color in which the patterns are drawn
riskAdjustment (float) : Used for calculating stops
Returns: ReversalChartPattern object created
method getName(this)
get pattern name of ReversalChartPattern object
Namespace types: ReversalChartPattern
Parameters:
this (ReversalChartPattern) : ReversalChartPattern object
Returns: string name of the pattern
method getDescription(this)
get consolidated description of ReversalChartPattern object
Namespace types: ReversalChartPattern
Parameters:
this (ReversalChartPattern) : ReversalChartPattern object
Returns: string consolidated description
method init(this)
initializes the ReversalChartPattern object and creates sub object types
Namespace types: ReversalChartPattern
Parameters:
this (ReversalChartPattern) : ReversalChartPattern object
Returns: ReversalChartPattern current object
ReversalChartPatternDrawing
Type which holds the drawing objects for Reversal Chart Pattern Types
Fields:
patternLines (Line type from HeWhoMustNotBeNamed/DrawingTypes/1) : array of Line objects representing pattern
entry (Line type from HeWhoMustNotBeNamed/DrawingTypes/1) : Entry price Line
target (Line type from HeWhoMustNotBeNamed/DrawingTypes/1) : Target price Line
patternLabel (Label type from HeWhoMustNotBeNamed/DrawingTypes/1)
ReversalChartPattern
Reversal Chart Pattern master type which holds the pattern components, drawings and trade details
Fields:
pivots (Pivot type from HeWhoMustNotBeNamed/ZigzagTypes/2) : Array of Zigzag Pivots forming the pattern
patternType (series int) : Defines the main type of pattern 1 - Double Tap, 1 - Triple Tap, 3 - Cup and Handle, 4 - Head and Shoulders
patternColor (series color) : Color in which the pattern will be drawn on chart
riskAdjustment (series float) : Percentage adjustment of risk. Used for setting stops
drawing (ReversalChartPatternDrawing) : ReversalChartPatternDrawing object which holds the drawing components
trade (Trade type from HeWhoMustNotBeNamed/TradeTracker/1) : TradeTracker.Trade object holding trade components
PubLibPivotLibrary "PubLibPivot"
Pivot detection library for harmonic pattern analysis - Fractal and ZigZag methods with validation and utility functions
fractalPivotHigh(depth)
Fractal pivot high condition
Parameters:
depth (int)
Returns: bool
fractalPivotLow(depth)
Fractal pivot low condition
Parameters:
depth (int)
Returns: bool
fractalPivotHighPrice(depth, occurrence)
Get fractal pivot high price
Parameters:
depth (int)
occurrence (simple int)
Returns: float
fractalPivotLowPrice(depth, occurrence)
Get fractal pivot low price
Parameters:
depth (int)
occurrence (simple int)
Returns: float
fractalPivotHighBarIndex(depth, occurrence)
Get fractal pivot high bar index
Parameters:
depth (int)
occurrence (simple int)
Returns: int
fractalPivotLowBarIndex(depth, occurrence)
Get fractal pivot low bar index
Parameters:
depth (int)
occurrence (simple int)
Returns: int
zigzagPivotHigh(deviation, backstep, useATR, atrLength)
ZigZag pivot high condition
Parameters:
deviation (float)
backstep (int)
useATR (bool)
atrLength (simple int)
Returns: bool
zigzagPivotLow(deviation, backstep, useATR, atrLength)
ZigZag pivot low condition
Parameters:
deviation (float)
backstep (int)
useATR (bool)
atrLength (simple int)
Returns: bool
zigzagPivotHighPrice(deviation, backstep, useATR, atrLength, occurrence)
Get ZigZag pivot high price
Parameters:
deviation (float)
backstep (int)
useATR (bool)
atrLength (simple int)
occurrence (simple int)
Returns: float
zigzagPivotLowPrice(deviation, backstep, useATR, atrLength, occurrence)
Get ZigZag pivot low price
Parameters:
deviation (float)
backstep (int)
useATR (bool)
atrLength (simple int)
occurrence (simple int)
Returns: float
zigzagPivotHighBarIndex(deviation, backstep, useATR, atrLength, occurrence)
Get ZigZag pivot high bar index
Parameters:
deviation (float)
backstep (int)
useATR (bool)
atrLength (simple int)
occurrence (simple int)
Returns: int
zigzagPivotLowBarIndex(deviation, backstep, useATR, atrLength, occurrence)
Get ZigZag pivot low bar index
Parameters:
deviation (float)
backstep (int)
useATR (bool)
atrLength (simple int)
occurrence (simple int)
Returns: int
isValidPivotVolume(pivotPrice, pivotBarIndex, minVolumeRatio, volumeLength)
Validate pivot quality based on volume
Parameters:
pivotPrice (float)
pivotBarIndex (int)
minVolumeRatio (float)
volumeLength (int)
Returns: bool
isValidPivotATR(pivotPrice, lastPivotPrice, minATRMultiplier, atrLength)
Validate pivot based on minimum ATR movement
Parameters:
pivotPrice (float)
lastPivotPrice (float)
minATRMultiplier (float)
atrLength (simple int)
Returns: bool
isValidPivotTime(pivotBarIndex, lastPivotBarIndex, minBars)
Validate pivot based on minimum time between pivots
Parameters:
pivotBarIndex (int)
lastPivotBarIndex (int)
minBars (int)
Returns: bool
isPivotConfirmed(pivotBarIndex, depth)
Check if pivot is not repainting (confirmed)
Parameters:
pivotBarIndex (int)
depth (int)
Returns: bool
addPivotToArray(pivotArray, barArray, pivotPrice, pivotBarIndex, maxSize)
Add pivot to array with validation
Parameters:
pivotArray (array)
barArray (array)
pivotPrice (float)
pivotBarIndex (int)
maxSize (int)
Returns: array - updated pivot array
getPivotFromArray(pivotArray, barArray, index)
Get pivot from array by index
Parameters:
pivotArray (array)
barArray (array)
index (int)
Returns: tuple - (price, bar_index)
getPivotsInRange(pivotArray, barArray, startIndex, count)
Get all pivots in range
Parameters:
pivotArray (array)
barArray (array)
startIndex (int)
count (int)
Returns: tuple, array> - (prices, bar_indices)
pivotDistance(barIndex1, barIndex2)
Calculate distance between two pivots in bars
Parameters:
barIndex1 (int)
barIndex2 (int)
Returns: int - distance in bars
pivotPriceRatio(price1, price2)
Calculate price ratio between two pivots
Parameters:
price1 (float)
price2 (float)
Returns: float - price ratio
pivotRetracementRatio(startPrice, endPrice, currentPrice)
Calculate retracement ratio
Parameters:
startPrice (float)
endPrice (float)
currentPrice (float)
Returns: float - retracement ratio (0-1)
pivotExtensionRatio(startPrice, endPrice, currentPrice)
Calculate extension ratio
Parameters:
startPrice (float)
endPrice (float)
currentPrice (float)
Returns: float - extension ratio (>1 for extension)
isInFibZone(startPrice, endPrice, currentPrice, fibLevel, tolerance)
Check if price is in Fibonacci retracement zone
Parameters:
startPrice (float)
endPrice (float)
currentPrice (float)
fibLevel (float)
tolerance (float)
Returns: bool - true if in zone
getPivotType(pivotPrice, pivotBarIndex, lookback)
Get pivot type (high/low) based on surrounding prices
Parameters:
pivotPrice (float)
pivotBarIndex (int)
lookback (int)
Returns: string - "high", "low", or "unknown"
calculatePivotStrength(pivotPrice, pivotBarIndex, lookback)
Calculate pivot strength based on volume and price action
Parameters:
pivotPrice (float)
pivotBarIndex (int)
lookback (int)
Returns: float - strength score (0-100)
chartpatternsLibrary "chartpatterns"
Library having complete chart pattern implementation
method draw(this)
draws pattern on the chart
Namespace types: Pattern
Parameters:
this (Pattern) : Pattern object that needs to be drawn
Returns: Current Pattern object
method erase(this)
erase the given pattern on the chart
Namespace types: Pattern
Parameters:
this (Pattern) : Pattern object that needs to be erased
Returns: Current Pattern object
method findPattern(this, properties, patterns)
Find patterns based on the currect zigzag object and store them in the patterns array
Namespace types: zg.Zigzag
Parameters:
this (Zigzag type from Trendoscope/ZigzagLite/2) : Zigzag object containing pivots
properties (PatternProperties) : PatternProperties object
patterns (Pattern ) : Array of Pattern objects
Returns: Current Pattern object
PatternProperties
Object containing properties for pattern scanning
Fields:
offset (series int) : Zigzag pivot offset. Set it to 1 for non repainting scan.
numberOfPivots (series int) : Number of pivots to be used in pattern search. Can be either 5 or 6
errorRatio (series float) : Error Threshold to be considered for comparing the slope of lines
flatRatio (series float) : Retracement ratio threshold used to determine if the lines are flat
checkBarRatio (series bool) : Also check bar ratio are within the limits while scanning the patterns
barRatioLimit (series float) : Bar ratio limit used for checking the bars. Used only when checkBarRatio is set to true
avoidOverlap (series bool)
patternLineWidth (series int) : Line width of the pattern trend lines
showZigzag (series bool) : show zigzag associated with pattern
zigzagLineWidth (series int) : line width of the zigzag lines. Used only when showZigzag is set to true
zigzagLineColor (series color) : color of the zigzag lines. Used only when showZigzag is set to true
showPatternLabel (series bool) : display pattern label containing the name
patternLabelSize (series string) : size of the pattern label. Used only when showPatternLabel is set to true
showPivotLabels (series bool) : Display pivot labels of the patterns marking 1-6
pivotLabelSize (series string) : size of the pivot label. Used only when showPivotLabels is set to true
pivotLabelColor (series color) : color of the pivot label outline. chart.bg_color or chart.fg_color are the appropriate values.
allowedPatterns (bool ) : array of bool encoding the allowed pattern types.
themeColors (color ) : color array of themes to be used.
Pattern
Object containing Individual Pattern data
Fields:
pivots (Pivot type from Trendoscope/ZigzagLite/2) : array of Zigzag Pivot points
trendLine1 (Line type from Trendoscope/LineWrapper/1) : First trend line joining pivots 1, 3, 5
trendLine2 (Line type from Trendoscope/LineWrapper/1) : Second trend line joining pivots 2, 4 (, 6)
properties (PatternProperties) : PatternProperties Object carrying common properties
patternColor (series color) : Individual pattern color. Lines and labels will be using this color.
ratioDiff (series float) : Difference between trendLine1 and trendLine2 ratios
zigzagLine (series polyline) : Internal zigzag line drawing Object
pivotLabels (label ) : array containning Pivot labels
patternLabel (series label) : pattern label Object
patternType (series int) : integer representing the pattern type
patternName (series string) : Type of pattern in string

reversalchartpatternsLibrary "reversalchartpatterns"
User Defined Types and Methods for reversal chart patterns - Double Top, Double Bottom, Triple Top, Triple Bottom, Cup and Handle, Inverted Cup and Handle, Head and Shoulders, Inverse Head and Shoulders
method delete(this)
Deletes the drawing components of ReversalChartPatternDrawing object
Namespace types: ReversalChartPatternDrawing
Parameters:
this (ReversalChartPatternDrawing) : ReversalChartPatternDrawing object
Returns: current ReversalChartPatternDrawing object
method delete(this)
Deletes the drawing components of ReversalChartPattern object. In turn calls the delete of ReversalChartPatternDrawing
Namespace types: ReversalChartPattern
Parameters:
this (ReversalChartPattern) : ReversalChartPattern object
Returns: current ReversalChartPattern object
method lpush(this, obj, limit, deleteOld)
Array push with limited number of items in the array. Old items are deleted when new one comes and exceeds the limit
Namespace types: array
Parameters:
this (array) : array object
obj (ReversalChartPattern) : ReversalChartPattern object which need to be pushed to the array
limit (int) : max items on the array. Default is 10
deleteOld (bool) : If set to true, also deletes the drawing objects. If not, the drawing objects are kept but the pattern object is removed from array. Default is false.
Returns: current ReversalChartPattern object
method draw(this)
Draws the components of ReversalChartPatternDrawing
Namespace types: ReversalChartPatternDrawing
Parameters:
this (ReversalChartPatternDrawing) : ReversalChartPatternDrawing object
Returns: current ReversalChartPatternDrawing object
method draw(this)
Draws the components of ReversalChartPatternDrawing within the ReversalChartPattern object.
Namespace types: ReversalChartPattern
Parameters:
this (ReversalChartPattern) : ReversalChartPattern object
Returns: current ReversalChartPattern object
method scan(zigzag, patterns, errorPercent, shoulderStart, shoulderEnd, allowedPatterns, offset)
Scans zigzag for ReversalChartPattern occurences
Namespace types: zg.Zigzag
Parameters:
zigzag (Zigzag type from Trendoscope/Zigzag/11) : ZigzagTypes.Zigzag object having array of zigzag pivots and other information on each pivots
patterns (array) : Existing patterns array. Used for validating duplicates
errorPercent (float) : Error threshold for considering ratios. Default is 13
shoulderStart (float) : Starting range of shoulder ratio. Used for identifying shoulders, handles and necklines
shoulderEnd (float) : Ending range of shoulder ratio. Used for identifying shoulders, handles and necklines
allowedPatterns (array) : array of int containing allowed pattern types
offset (int) : Offset of zigzag to consider only confirmed pivots
Returns: int pattern type
method createPattern(zigzag, patternType, patternColor, properties, offset)
Create Pattern from ZigzagTypes.Zigzag object
Namespace types: zg.Zigzag
Parameters:
zigzag (Zigzag type from Trendoscope/Zigzag/11) : ZigzagTypes.Zigzag object having array of zigzag pivots and other information on each pivots
patternType (int) : Type of pattern being created. 1 - Double Tap, 2 - Triple Tap, 3 - Cup and Handle, 4 - Head and Shoulders
patternColor (color) : Color in which the patterns are drawn
properties (ReversalChartTradeProperties)
offset (int)
Returns: ReversalChartPattern object created
method getName(this)
get pattern name of ReversalChartPattern object
Namespace types: ReversalChartPattern
Parameters:
this (ReversalChartPattern) : ReversalChartPattern object
Returns: string name of the pattern
method getDescription(this)
get consolidated description of ReversalChartPattern object
Namespace types: ReversalChartPattern
Parameters:
this (ReversalChartPattern) : ReversalChartPattern object
Returns: string consolidated description
method init(this)
initializes the ReversalChartPattern object and creates sub object types
Namespace types: ReversalChartPattern
Parameters:
this (ReversalChartPattern) : ReversalChartPattern object
Returns: ReversalChartPattern current object
ReversalChartPatternDrawing
Type which holds the drawing objects for Reversal Chart Pattern Types
Fields:
patternLines (array type from Trendoscope/Drawing/2) : array of Line objects representing pattern
entry (Line type from Trendoscope/Drawing/2) : Entry price Line
targets (array type from Trendoscope/Drawing/2)
stop (Line type from Trendoscope/Drawing/2) : Stop price Line
patternLabel (Label type from Trendoscope/Drawing/2)
ReversalChartTradeProperties
Trade properties of ReversalChartPattern
Fields:
riskAdjustment (series float) : Risk Adjustment for calculation of stop
useFixedTarget (series bool) : Boolean flag saying use fixed target type wherever possible. If fixed target type is not possible, then risk reward/fib ratios are used for calculation of targets
variableTargetType (series int) : Integer value which defines whether to use fib based targets or risk reward based targets. 1 - Risk Reward, 2 - Fib Ratios
variableTargetRatios (array) : Risk reward or Fib Ratios to be used for calculation of targets when fixed target is not possible or not enabled
entryPivotForWm (series int) : which Pivot should be considered as entry point for WM patterns. 0 refers to the latest breakout pivot where as 5 refers to initial pivot of the pattern
ReversalChartPattern
Reversal Chart Pattern master type which holds the pattern components, drawings and trade details
Fields:
pivots (array type from Trendoscope/Zigzag/11) : Array of Zigzag Pivots forming the pattern
patternType (series int) : Defines the main type of pattern 1 - Double Tap, 1 - Triple Tap, 3 - Cup and Handle, 4 - Head and Shoulders, 5- W/M Patterns, 6 - Full Trend, 7 - Half Trend
patternColor (series color) : Color in which the pattern will be drawn on chart
properties (ReversalChartTradeProperties)
drawing (ReversalChartPatternDrawing) : ReversalChartPatternDrawing object which holds the drawing components
trade (Trade type from Trendoscope/TradeTracker/1) : TradeTracker.Trade object holding trade components

Recursive Reversal Chart Patterns [Trendoscope]Caution: This algorithm is very heavy and bound to cause timeouts. If that happens, there are few settings you can change to reduce the load. (Will explain them in the description below)
🎲 Recursive Reversal Chart Patterns Indicator
Welcome to another exploration of Zigzag and Pattern ecosystem components. Previously we derived Pitchfork and Recursive Zigzag indicators. This indicator is designed to scan and highlight few popular "Reversal Chart Patterns". Similar to other indicators in the ecosystem, this too is built on recursive zigzags.
Double Taps
Triple Taps
Cup and Handles
Head and Shoulders
Indicator however names the patterns separately for bullish and bearish formations. So, the actual names you see on the screen are
Double Top
Double Bottom
Triple Top
Triple Bottom
Cup and Handle
Inverted Cup and Handle
Head and Shoulders
Inverse Head and Shoulders
Here is a snapshot on how each category of patterns look on the chart.
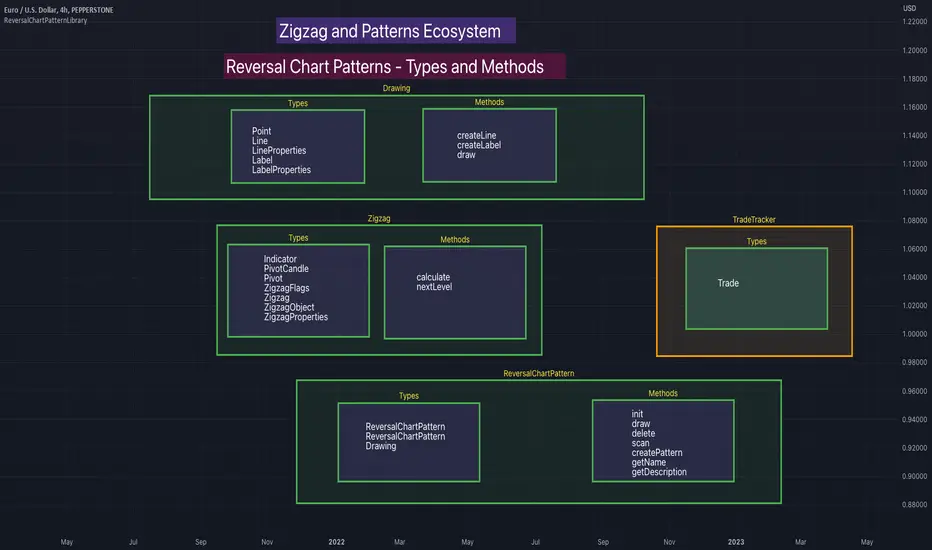
🎲 Architecture
Many of you may be cursing me for publishing too many libraries. But, these are all preparations for something big. Like other indicators in the Zigzag and Patterns Ecosystem, this too uses a bunch of libraries.
🎯Major direct dependencies
ZigzagTypes
ZigzagMethods
ReversalChartPatternLibrary
🎯Indirect dependencies
DrawingTypes
DrawingMethods
🎯Minor dependencies
Utils
TradeTracker
🎲 Indicator Settings
🎯Generic and Zigzag Settings.
Note: In case of timeout, please decrease the value of depth parameter
🎯Pattern Selection
Having all the patterns selected on chart may also cause timeouts and will make the chart look messy. It is better to limit one or two patterns on the chart to have clear picture.
🎯Scanner Settings
🎯Indicators.
These are options to use indicators as secondary confirmation to calculate divergence. If selected, the patterns are shown only if the divergence data is inline. Option also available to plugin external indicator. These calculations are not straightforward and not easy to measure by manual inspection. This feature at present is purely experimental.
Have a go and let me know how you feel :)

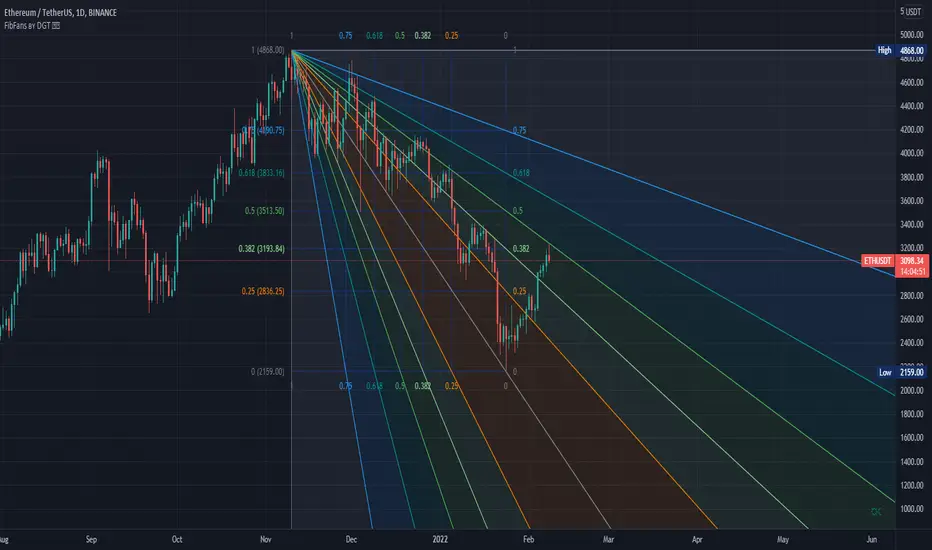
Auto Fib Speed Resistance Fans by DGTFibonacci Speed and Resistance Fan is an analytical drawing tool used to indicate the support and resistance levels of an existing trend and the price level at which possible changes in the trend may occur.
A Fibonacci Speed Resistance Fan consists of a trend line drawn between two extreme points - a trough and opposing peak or a peak and opposing trough - on which a set of sequential speed resistance lines are drawn above (which represents time) and below (which represents price). These lines are drawn based on time/price percentages of the distance between the beginning and the end of the trend line.
Speed resistance lines not only help to measure trend corrections but also measure the speed of a trend (the rate at which a trendline ascends or descends)
Traders can use the lines of the Fibonacci Speed and Resistance Fan to predict key points of resistance or support, at which they might expect price trends to reverse. Once a trader identifies patterns within a chart, they can use those patterns to predict future price movements and future levels of support and resistance. Traders use the predictions to time their trades. Key support and resistance levels tend to occur frequently at the 61.8-percent level on both uptrends and downtrends.
Please check for further details in the education post that I will share shortly after this publication :
Nobody appears to know whether Fibonacci tools work because markets exhibit some form of natural pattern or because many investors use Fibonacci ratios to predict price movements, making them a self-fulfilling prophecy.
█ Study OPTIONS
Auto Fibonacci Speed and Resistance Fan , the main aim of the study
- Pivot threshold can be adjusted via “Deviation” and “Depth” input options
- Historical Fans option will allow plotting of Speed and Resistance Fans on previous pivot high/lows
- Ability to set ALERTs for the Speed and Resistance Levels
- Price Grid Lines if extended it will result with Fib Retracement levels
- All lines, line levels are customizable, default values are set exactly to the same with the available Fib Speed and Resistance Fan drawing tool
Zig Zag – Derived from build-in Auto Fib Retracement with some customization options.
Example Usages :
Disclaimer :
Trading success is all about following your trading strategy and the indicators should fit within your trading strategy, and not to be traded upon solely
The script is for informational and educational purposes only. Use of the script does not constitute professional and/or financial advice. You alone have the sole responsibility of evaluating the script output and risks associated with the use of the script. In exchange for using the script, you agree not to hold dgtrd TradingView user liable for any possible claim for damages arising from any decision you make based on use of the script
abstractchartpatternsLibrary "abstractchartpatterns"
Library having abstract types and methods for chart pattern implementations
checkBarRatio(p1, p2, p3, properties)
checks if three zigzag pivot points are having uniform bar ratios
Parameters:
p1 (chart.point) : First pivot point
p2 (chart.point) : Second pivot point
p3 (chart.point) : Third pivot point
properties (ScanProperties)
Returns: true if points are having uniform bar ratio
getRatioDiff(p1, p2, p3)
gets ratio difference between 3 pivot combinations
Parameters:
p1 (chart.point)
p2 (chart.point)
p3 (chart.point)
Returns: returns the ratio difference between pivot2/pivot1 ratio and pivot3/pivot2 ratio
method inspect(points, stratingBar, endingBar, direction, ohlcArray)
Creates a trend line between 2 or 3 points and validates and selects best combination
Namespace types: chart.point
Parameters:
points (chart.point ) : Array of chart.point objects used for drawing trend line
stratingBar (int) : starting bar of the trend line
endingBar (int) : ending bar of the trend line
direction (float) : direction of the last pivot. Tells whether the line is joining upper pivots or the lower pivots
ohlcArray (OHLC type from Trendoscope/ohlc/1) : Array of OHLC values
Returns: boolean flag indicating if the trend line is valid and the trend line object as tuple
method draw(this)
draws pattern on the chart
Namespace types: Pattern
Parameters:
this (Pattern) : Pattern object that needs to be drawn
Returns: Current Pattern object
method erase(this)
erase the given pattern on the chart
Namespace types: Pattern
Parameters:
this (Pattern) : Pattern object that needs to be erased
Returns: Current Pattern object
method push(this, p, maxItems)
push Pattern object to the array by keeping maxItems limit
Namespace types: Pattern
Parameters:
this (Pattern ) : array of Pattern objects
p (Pattern) : Pattern object to be added to array
@oaram maxItems Max number of items the array can hold
maxItems (int)
Returns: Current Pattern array
method deepcopy(this)
Perform deep copy of a chart point array
Namespace types: chart.point
Parameters:
this (chart.point ) : array of chart.point objects
Returns: deep copy array
DrawingProperties
Object containing properties for pattern drawing
Fields:
patternLineWidth (series int) : Line width of the pattern trend lines
showZigzag (series bool) : show zigzag associated with pattern
zigzagLineWidth (series int) : line width of the zigzag lines. Used only when showZigzag is set to true
zigzagLineColor (series color) : color of the zigzag lines. Used only when showZigzag is set to true
showPatternLabel (series bool) : display pattern label containing the name
patternLabelSize (series string) : size of the pattern label. Used only when showPatternLabel is set to true
showPivotLabels (series bool) : Display pivot labels of the patterns marking 1-6
pivotLabelSize (series string) : size of the pivot label. Used only when showPivotLabels is set to true
pivotLabelColor (series color) : color of the pivot label outline. chart.bg_color or chart.fg_color are the appropriate values.
deleteOnPop (series bool) : delete the pattern when popping out from the array of Patterns.
Pattern
Object containing Individual Pattern data
Fields:
points (chart.point )
originalPoints (chart.point )
trendLine1 (Line type from Trendoscope/LineWrapper/1) : First trend line joining pivots 1, 3, 5
trendLine2 (Line type from Trendoscope/LineWrapper/1) : Second trend line joining pivots 2, 4 (, 6)
properties (DrawingProperties) : DrawingProperties Object carrying common properties
patternColor (series color) : Individual pattern color. Lines and labels will be using this color.
ratioDiff (series float) : Difference between trendLine1 and trendLine2 ratios
zigzagLine (series polyline) : Internal zigzag line drawing Object
pivotLabels (label ) : array containning Pivot labels
patternLabel (series label) : pattern label Object
patternType (series int) : integer representing the pattern type
patternName (series string) : Type of pattern in string
ScanProperties
Object containing properties for pattern scanning
Fields:
offset (series int) : Zigzag pivot offset. Set it to 1 for non repainting scan.
numberOfPivots (series int) : Number of pivots to be used in pattern search. Can be either 5 or 6
errorRatio (series float) : Error Threshold to be considered for comparing the slope of lines
flatRatio (series float) : Retracement ratio threshold used to determine if the lines are flat
checkBarRatio (series bool) : Also check bar ratio are within the limits while scanning the patterns
barRatioLimit (series float) : Bar ratio limit used for checking the bars. Used only when checkBarRatio is set to true
avoidOverlap (series bool) : avoid overlapping patterns.
allowedPatterns (bool ) : array of bool encoding the allowed pattern types.
allowedLastPivotDirections (int ) : array of int representing allowed last pivot direction for each pattern types
themeColors (color ) : color array of themes to be used.

mZigzagLibrary "mZigzag"
Matrix implementation of zigzag to allow further possibilities.
Main advantage of this library over previous zigzag methods is that you can attach any number of indicator/oscillator information to zigzag
calculate(length, ohlc, indicatorHigh, indicatorLow, numberOfPivots) calculates zigzag and related information
Parameters:
length : is zigzag length
ohlc : array of OHLC values to be used for zigzag calculation
indicatorHigh : Array of indicator values calculated based on high price of OHLC
indicatorLow : Array of indicators values calculated based on low price of OHLC
numberOfPivots : Number of pivots to be returned
Returns: pivotMatrix Matrix containing zigzag pivots, pivot bars, direction, ratio, and indicators added via indicatorHigh/indicatorLow
newZG is true if a new pivot is added to array
doubleZG is true if last calculation returned two new pivots (Happens on extreme price change)
draw(length, ohlc, indicatorLabels, indicatorHigh, indicatorLow, numberOfPivots, lineColor, lineWidth, lineStyle, showHighLow, showRatios, showIndicators) draws zigzag and related information
Parameters:
length : is zigzag length
ohlc : array of OHLC values to be used for zigzag calculation
indicatorLabels : Array of name of indicators passed
indicatorHigh : Array of indicator values calculated based on high price of OHLC
indicatorLow : Array of indicators values calculated based on low price of OHLC
numberOfPivots : Number of pivots to be returned
lineColor : zigzag line color. set to blue by default
lineWidth : zigzag line width. set to 1 by default
lineStyle : zigzag line style. set to line.style_solid by default
showHighLow : show HH, HL, LH, LL labels
showRatios : show pivot retracement ratios from previous zigzag
showIndicators : show indicator values
Returns: pivotMatrix Matrix containing zigzag pivots, pivot bars, direction, ratio, and indicators added via indicatorHigh/indicatorLow
zigzaglines array of zigzag lines
zigzaglabels array of zigzag labels
TR_HighLow_LibLibrary "TR_HighLow_Lib"
TODO: add library description here
ShowLabel(_Text, _X, _Y, _Style, _Size, _Yloc, _Color)
TODO: Function to display labels
Parameters:
_Text : TODO: text (series string) Label text.
_X : TODO: x (series int) Bar index.
_Y : TODO: y (series int/float) Price of the label position.
_Style : TODO: style (series string) Label style.
_Size : TODO: size (series string) Label size.
_Yloc : TODO: yloc (series string) Possible values are yloc.price, yloc.abovebar, yloc.belowbar.
_Color : TODO: color (series color) Color of the label border and arrow
Returns: TODO: No return values
GetColor(_Index)
TODO: Function to take out 12 colors in order
Parameters:
_Index : TODO: color number.
Returns: TODO: color code
Tbl_position(_Pos)
TODO: Table display position function
Parameters:
_Pos : TODO: position.
Returns: TODO: Table position
DeleteLine()
TODO: Delete Line
Parameters:
: TODO: No parameter
Returns: TODO: No return value
DeleteLabel()
TODO: Delete Label
Parameters:
: TODO: No parameter
Returns: TODO: No return value
ZigZag(_a_PHiLo, _a_IHiLo, _a_FHiLo, _a_DHiLo, _Histories, _Provisional_PHiLo, _Provisional_IHiLo, _Color1, _Width1, _Color2, _Width2, _ShowLabel, _ShowHighLowBar, _HighLowBarWidth, _HighLow_LabelSize)
TODO: Draw a zig-zag line.
Parameters:
_a_PHiLo : TODO: High-Low price array
_a_IHiLo : TODO: High-Low INDEX array
_a_FHiLo : TODO: High-Low flag array sequence 1:High 2:Low
_a_DHiLo : TODO: High-Low Price Differential Array
_Histories : TODO: Array size (High-Low length)
_Provisional_PHiLo : TODO: Provisional High-Low Price
_Provisional_IHiLo : TODO: Provisional High-Low INDEX
_Color1 : TODO: Normal High-Low color
_Width1 : TODO: Normal High-Low width
_Color2 : TODO: Provisional High-Low color
_Width2 : TODO: Provisional High-Low width
_ShowLabel : TODO: Label display flag True: Displayed False: Not displayed
_ShowHighLowBar : TODO: High-Low bar display flag True:Show False:Hide
_HighLowBarWidth : TODO: High-Low bar width
_HighLow_LabelSize : TODO: Label Size
Returns: TODO: No return value
TrendLine(_a_PHiLo, _a_IHiLo, _Histories, _MultiLine, _StartWidth, _EndWidth, _IncreWidth, _StartTrans, _EndTrans, _IncreTrans, _ColorMode, _Color1_1, _Color1_2, _Color2_1, _Color2_2, _Top_High, _Top_Low, _Bottom_High, _Bottom_Low)
TODO: Draw a Trend Line
Parameters:
_a_PHiLo : TODO: High-Low price array
_a_IHiLo : TODO: High-Low INDEX array
_Histories : TODO: Array size (High-Low length)
_MultiLine : TODO: Draw a multiple Line.
_StartWidth : TODO: Line width start value
_EndWidth : TODO: Line width end value
_IncreWidth : TODO: Line width increment value
_StartTrans : TODO: Transparent rate start value
_EndTrans : TODO: Transparent rate finally
_IncreTrans : TODO: Transparent rate increase value
_ColorMode : TODO: 0:Nomal 1:Gradation
_Color1_1 : TODO: Gradation Color 1_1
_Color1_2 : TODO: Gradation Color 1_2
_Color2_1 : TODO: Gradation Color 2_1
_Color2_2 : TODO: Gradation Color 2_2
_Top_High : TODO: _Top_High Value for Gradation
_Top_Low : TODO: _Top_Low Value for Gradation
_Bottom_High : TODO: _Bottom_High Value for Gradation
_Bottom_Low : TODO: _Bottom_Low Value for Gradation
Returns: TODO: No return value
Fibonacci(_a_Fibonacci, _a_PHiLo, _Provisional_PHiLo, _Index, _FrontMargin, _BackMargin)
TODO: Draw a Fibonacci line
Parameters:
_a_Fibonacci : TODO: Fibonacci Percentage Array
_a_PHiLo : TODO: High-Low price array
_Provisional_PHiLo : TODO: Provisional High-Low price (when _Index is 0)
_Index : TODO: Where to draw the Fibonacci line
_FrontMargin : TODO: Fibonacci line front-margin
_BackMargin : TODO: Fibonacci line back-margin
Returns: TODO: No return value
Fibonacci(_a_Fibonacci, _a_PHiLo, _Provisional_PHiLo, _Index1, _FrontMargin1, _BackMargin1, _Transparent1, _Index2, _FrontMargin2, _BackMargin2, _Transparent2)
TODO: Draw a Fibonacci line
Parameters:
_a_Fibonacci : TODO: Fibonacci Percentage Array
_a_PHiLo : TODO: High-Low price array
_Provisional_PHiLo : TODO: Provisional High-Low price (when _Index is 0)
_Index1 : TODO: Where to draw the Fibonacci line 1
_FrontMargin1 : TODO: Fibonacci line front-margin 1
_BackMargin1 : TODO: Fibonacci line back-margin 1
_Transparent1 : TODO: Transparent rate 1
_Index2 : TODO: Where to draw the Fibonacci line 2
_FrontMargin2 : TODO: Fibonacci line front-margin 2
_BackMargin2 : TODO: Fibonacci line back-margin 2
_Transparent2 : TODO: Transparent rate 2
Returns: TODO: No return value
High_Low_Judgment(_Length, _Extension, _Difference)
TODO: Judges High-Low
Parameters:
_Length : TODO: High-Low Confirmation Length
_Extension : TODO: Length of extension when the difference did not open
_Difference : TODO: Difference size
Returns: TODO: _HiLo=High-Low flag 0:Neither high nor low、1:High、2:Low、3:High-Low
_PHi=high price、_PLo=low price、_IHi=High Price Index、_ILo=Low Price Index、
_Cnt=count、_ECnt=Extension count、
_DiffHi=Difference from Start(High)、_DiffLo=Difference from Start(Low)、
_StartHi=Start value(High)、_StartLo=Start value(Low)
High_Low_Data_AddedAndUpdated(_HiLo, _Histories, _PHi, _PLo, _IHi, _ILo, _DiffHi, _DiffLo, _a_PHiLo, _a_IHiLo, _a_FHiLo, _a_DHiLo)
TODO: Adds and updates High-Low related arrays from given parameters
Parameters:
_HiLo : TODO: High-Low flag
_Histories : TODO: Array size (High-Low length)
_PHi : TODO: Price Hi
_PLo : TODO: Price Lo
_IHi : TODO: Index Hi
_ILo : TODO: Index Lo
_DiffHi : TODO: Difference in High
_DiffLo : TODO: Difference in Low
_a_PHiLo : TODO: High-Low price array
_a_IHiLo : TODO: High-Low INDEX array
_a_FHiLo : TODO: High-Low flag array 1:High 2:Low
_a_DHiLo : TODO: High-Low Price Differential Array
Returns: TODO: _PHiLo price array、_IHiLo indexed array、_FHiLo flag array、_DHiLo price-matching array、
Provisional_PHiLo Provisional price、Provisional_IHiLo 暫定インデックス
High_Low(_a_PHiLo, _a_IHiLo, _a_FHiLo, _a_DHiLo, _a_Fibonacci, _Length, _Extension, _Difference, _Histories, _ShowZigZag, _ZigZagColor1, _ZigZagWidth1, _ZigZagColor2, _ZigZagWidth2, _ShowZigZagLabel, _ShowHighLowBar, _ShowTrendLine, _TrendMultiLine, _TrendStartWidth, _TrendEndWidth, _TrendIncreWidth, _TrendStartTrans, _TrendEndTrans, _TrendIncreTrans, _TrendColorMode, _TrendColor1_1, _TrendColor1_2, _TrendColor2_1, _TrendColor2_2, _ShowFibonacci1, _FibIndex1, _FibFrontMargin1, _FibBackMargin1, _FibTransparent1, _ShowFibonacci2, _FibIndex2, _FibFrontMargin2, _FibBackMargin2, _FibTransparent2, _ShowInfoTable1, _TablePosition1, _ShowInfoTable2, _TablePosition2)
TODO: Draw the contents of the High-Low array.
Parameters:
_a_PHiLo : TODO: High-Low price array
_a_IHiLo : TODO: High-Low INDEX array
_a_FHiLo : TODO: High-Low flag sequence 1:High 2:Low
_a_DHiLo : TODO: High-Low Price Differential Array
_a_Fibonacci : TODO: Fibonacci Gnar Matching
_Length : TODO: Length of confirmation
_Extension : TODO: Extension Length of extension when the difference did not open
_Difference : TODO: Difference size
_Histories : TODO: High-Low Length
_ShowZigZag : TODO: ZigZag Display
_ZigZagColor1 : TODO: Colors of ZigZag1
_ZigZagWidth1 : TODO: Width of ZigZag1
_ZigZagColor2 : TODO: Colors of ZigZag2
_ZigZagWidth2 : TODO: Width of ZigZag2
_ShowZigZagLabel : TODO: ZigZagLabel Display
_ShowHighLowBar : TODO: High-Low Bar Display
_ShowTrendLine : TODO: Trend Line Display
_TrendMultiLine : TODO: Trend Multi Line Display
_TrendStartWidth : TODO: Line width start value
_TrendEndWidth : TODO: Line width end value
_TrendIncreWidth : TODO: Line width increment value
_TrendStartTrans : TODO: Starting transmittance value
_TrendEndTrans : TODO: Transmittance End Value
_TrendIncreTrans : TODO: Increased transmittance value
_TrendColorMode : TODO: color mode
_TrendColor1_1 : TODO: Trend Color 1_1
_TrendColor1_2 : TODO: Trend Color 1_2
_TrendColor2_1 : TODO: Trend Color 2_1
_TrendColor2_2 : TODO: Trend Color 2_2
_ShowFibonacci1 : TODO: Fibonacci1 Display
_FibIndex1 : TODO: Fibonacci1 Index No.
_FibFrontMargin1 : TODO: Fibonacci1 Front margin
_FibBackMargin1 : TODO: Fibonacci1 Back Margin
_FibTransparent1 : TODO: Fibonacci1 Transmittance
_ShowFibonacci2 : TODO: Fibonacci2 Display
_FibIndex2 : TODO: Fibonacci2 Index No.
_FibFrontMargin2 : TODO: Fibonacci2 Front margin
_FibBackMargin2 : TODO: Fibonacci2 Back Margin
_FibTransparent2 : TODO: Fibonacci2 Transmittance
_ShowInfoTable1 : TODO: InfoTable1 Display
_TablePosition1 : TODO: InfoTable1 position
_ShowInfoTable2 : TODO: InfoTable2 Display
_TablePosition2 : TODO: InfoTable2 position
Returns: TODO: 無し

TR_HighLowLibrary "TR_HighLow"
TODO: add library description here
ShowLabel(_Text, _X, _Y, _Style, _Size, _Yloc, _Color)
TODO: Function to display labels
Parameters:
_Text : TODO: text (series string) Label text.
_X : TODO: x (series int) Bar index.
_Y : TODO: y (series int/float) Price of the label position.
_Style : TODO: style (series string) Label style.
_Size : TODO: size (series string) Label size.
_Yloc : TODO: yloc (series string) Possible values are yloc.price, yloc.abovebar, yloc.belowbar.
_Color : TODO: color (series color) Color of the label border and arrow
Returns: TODO: No return values
GetColor(_Index)
TODO: Function to take out 12 colors in order
Parameters:
_Index : TODO: color number.
Returns: TODO: color code
Tbl_position(_Pos)
TODO: Table display position function
Parameters:
_Pos : TODO: position.
Returns: TODO: Table position
DeleteLine()
TODO: Delete Line
Parameters:
: TODO: No parameter
Returns: TODO: No return value
DeleteLabel()
TODO: Delete Label
Parameters:
: TODO: No parameter
Returns: TODO: No return value
ZigZag(_a_PHiLo, _a_IHiLo, _a_FHiLo, _a_DHiLo, _Histories, _Provisional_PHiLo, _Provisional_IHiLo, _Color1, _Width1, _Color2, _Width2, _ShowLabel, _ShowHighLowBar, _HighLowBarWidth, _HighLow_LabelSize)
TODO: Draw a zig-zag line.
Parameters:
_a_PHiLo : TODO: High-Low price array
_a_IHiLo : TODO: High-Low INDEX array
_a_FHiLo : TODO: High-Low flag array sequence 1:High 2:Low
_a_DHiLo : TODO: High-Low Price Differential Array
_Histories : TODO: Array size (High-Low length)
_Provisional_PHiLo : TODO: Provisional High-Low Price
_Provisional_IHiLo : TODO: Provisional High-Low INDEX
_Color1 : TODO: Normal High-Low color
_Width1 : TODO: Normal High-Low width
_Color2 : TODO: Provisional High-Low color
_Width2 : TODO: Provisional High-Low width
_ShowLabel : TODO: Label display flag True: Displayed False: Not displayed
_ShowHighLowBar : TODO: High-Low bar display flag True:Show False:Hide
_HighLowBarWidth : TODO: High-Low bar width
_HighLow_LabelSize : TODO: Label Size
Returns: TODO: No return value
TrendLine(_a_PHiLo, _a_IHiLo, _Histories, _MultiLine, _StartWidth, _EndWidth, _IncreWidth, _StartTrans, _EndTrans, _IncreTrans, _ColorMode, _Color1_1, _Color1_2, _Color2_1, _Color2_2, _Top_High, _Top_Low, _Bottom_High, _Bottom_Low)
TODO: Draw a Trend Line
Parameters:
_a_PHiLo : TODO: High-Low price array
_a_IHiLo : TODO: High-Low INDEX array
_Histories : TODO: Array size (High-Low length)
_MultiLine : TODO: Draw a multiple Line.
_StartWidth : TODO: Line width start value
_EndWidth : TODO: Line width end value
_IncreWidth : TODO: Line width increment value
_StartTrans : TODO: Transparent rate start value
_EndTrans : TODO: Transparent rate finally
_IncreTrans : TODO: Transparent rate increase value
_ColorMode : TODO: 0:Nomal 1:Gradation
_Color1_1 : TODO: Gradation Color 1_1
_Color1_2 : TODO: Gradation Color 1_2
_Color2_1 : TODO: Gradation Color 2_1
_Color2_2 : TODO: Gradation Color 2_2
_Top_High : TODO: _Top_High Value for Gradation
_Top_Low : TODO: _Top_Low Value for Gradation
_Bottom_High : TODO: _Bottom_High Value for Gradation
_Bottom_Low : TODO: _Bottom_Low Value for Gradation
Returns: TODO: No return value
Fibonacci(_a_Fibonacci, _a_PHiLo, _Provisional_PHiLo, _Index, _FrontMargin, _BackMargin)
TODO: Draw a Fibonacci line
Parameters:
_a_Fibonacci : TODO: Fibonacci Percentage Array
_a_PHiLo : TODO: High-Low price array
_Provisional_PHiLo : TODO: Provisional High-Low price (when _Index is 0)
_Index : TODO: Where to draw the Fibonacci line
_FrontMargin : TODO: Fibonacci line front-margin
_BackMargin : TODO: Fibonacci line back-margin
Returns: TODO: No return value
Fibonacci(_a_Fibonacci, _a_PHiLo, _Provisional_PHiLo, _Index1, _FrontMargin1, _BackMargin1, _Transparent1, _Index2, _FrontMargin2, _BackMargin2, _Transparent2)
TODO: Draw a Fibonacci line
Parameters:
_a_Fibonacci : TODO: Fibonacci Percentage Array
_a_PHiLo : TODO: High-Low price array
_Provisional_PHiLo : TODO: Provisional High-Low price (when _Index is 0)
_Index1 : TODO: Where to draw the Fibonacci line 1
_FrontMargin1 : TODO: Fibonacci line front-margin 1
_BackMargin1 : TODO: Fibonacci line back-margin 1
_Transparent1 : TODO: Transparent rate 1
_Index2 : TODO: Where to draw the Fibonacci line 2
_FrontMargin2 : TODO: Fibonacci line front-margin 2
_BackMargin2 : TODO: Fibonacci line back-margin 2
_Transparent2 : TODO: Transparent rate 2
Returns: TODO: No return value
High_Low_Judgment(_Length, _Extension, _Difference)
TODO: Judges High-Low
Parameters:
_Length : TODO: High-Low Confirmation Length
_Extension : TODO: Length of extension when the difference did not open
_Difference : TODO: Difference size
Returns: TODO: _HiLo=High-Low flag 0:Neither high nor low、1:High、2:Low、3:High-Low
_PHi=high price、_PLo=low price、_IHi=High Price Index、_ILo=Low Price Index、
_Cnt=count、_ECnt=Extension count、
_DiffHi=Difference from Start(High)、_DiffLo=Difference from Start(Low)、
_StartHi=Start value(High)、_StartLo=Start value(Low)
High_Low_Data_AddedAndUpdated(_HiLo, _Histories, _PHi, _PLo, _IHi, _ILo, _DiffHi, _DiffLo, _a_PHiLo, _a_IHiLo, _a_FHiLo, _a_DHiLo)
TODO: Adds and updates High-Low related arrays from given parameters
Parameters:
_HiLo : TODO: High-Low flag
_Histories : TODO: Array size (High-Low length)
_PHi : TODO: Price Hi
_PLo : TODO: Price Lo
_IHi : TODO: Index Hi
_ILo : TODO: Index Lo
_DiffHi : TODO: Difference in High
_DiffLo : TODO: Difference in Low
_a_PHiLo : TODO: High-Low price array
_a_IHiLo : TODO: High-Low INDEX array
_a_FHiLo : TODO: High-Low flag array 1:High 2:Low
_a_DHiLo : TODO: High-Low Price Differential Array
Returns: TODO: _PHiLo price array、_IHiLo indexed array、_FHiLo flag array、_DHiLo price-matching array、
Provisional_PHiLo Provisional price、Provisional_IHiLo 暫定インデックス
High_Low(_a_PHiLo, _a_IHiLo, _a_FHiLo, _a_DHiLo, _a_Fibonacci, _Length, _Extension, _Difference, _Histories, _ShowZigZag, _ZigZagColor1, _ZigZagWidth1, _ZigZagColor2, _ZigZagWidth2, _ShowZigZagLabel, _ShowHighLowBar, _ShowTrendLine, _TrendMultiLine, _TrendStartWidth, _TrendEndWidth, _TrendIncreWidth, _TrendStartTrans, _TrendEndTrans, _TrendIncreTrans, _TrendColorMode, _TrendColor1_1, _TrendColor1_2, _TrendColor2_1, _TrendColor2_2, _ShowFibonacci1, _FibIndex1, _FibFrontMargin1, _FibBackMargin1, _FibTransparent1, _ShowFibonacci2, _FibIndex2, _FibFrontMargin2, _FibBackMargin2, _FibTransparent2, _ShowInfoTable1, _TablePosition1, _ShowInfoTable2, _TablePosition2)
TODO: Draw the contents of the High-Low array.
Parameters:
_a_PHiLo : TODO: High-Low price array
_a_IHiLo : TODO: High-Low INDEX array
_a_FHiLo : TODO: High-Low flag sequence 1:High 2:Low
_a_DHiLo : TODO: High-Low Price Differential Array
_a_Fibonacci : TODO: Fibonacci Gnar Matching
_Length : TODO: Length of confirmation
_Extension : TODO: Extension Length of extension when the difference did not open
_Difference : TODO: Difference size
_Histories : TODO: High-Low Length
_ShowZigZag : TODO: ZigZag Display
_ZigZagColor1 : TODO: Colors of ZigZag1
_ZigZagWidth1 : TODO: Width of ZigZag1
_ZigZagColor2 : TODO: Colors of ZigZag2
_ZigZagWidth2 : TODO: Width of ZigZag2
_ShowZigZagLabel : TODO: ZigZagLabel Display
_ShowHighLowBar : TODO: High-Low Bar Display
_ShowTrendLine : TODO: Trend Line Display
_TrendMultiLine : TODO: Trend Multi Line Display
_TrendStartWidth : TODO: Line width start value
_TrendEndWidth : TODO: Line width end value
_TrendIncreWidth : TODO: Line width increment value
_TrendStartTrans : TODO: Starting transmittance value
_TrendEndTrans : TODO: Transmittance End Value
_TrendIncreTrans : TODO: Increased transmittance value
_TrendColorMode : TODO: color mode
_TrendColor1_1 : TODO: Trend Color 1_1
_TrendColor1_2 : TODO: Trend Color 1_2
_TrendColor2_1 : TODO: Trend Color 2_1
_TrendColor2_2 : TODO: Trend Color 2_2
_ShowFibonacci1 : TODO: Fibonacci1 Display
_FibIndex1 : TODO: Fibonacci1 Index No.
_FibFrontMargin1 : TODO: Fibonacci1 Front margin
_FibBackMargin1 : TODO: Fibonacci1 Back Margin
_FibTransparent1 : TODO: Fibonacci1 Transmittance
_ShowFibonacci2 : TODO: Fibonacci2 Display
_FibIndex2 : TODO: Fibonacci2 Index No.
_FibFrontMargin2 : TODO: Fibonacci2 Front margin
_FibBackMargin2 : TODO: Fibonacci2 Back Margin
_FibTransparent2 : TODO: Fibonacci2 Transmittance
_ShowInfoTable1 : TODO: InfoTable1 Display
_TablePosition1 : TODO: InfoTable1 position
_ShowInfoTable2 : TODO: InfoTable2 Display
_TablePosition2 : TODO: InfoTable2 position
Returns: TODO: 無し

Buy Sell Magic Rework📌 Purpose
This script is a reworked version of the Parabolic SAR strategy, with an optional ZigZag filter to confirm reversal points.
It helps traders identify potential trend reversals with reduced noise compared to the standard SAR.
🧠 How It Works
1. Parabolic SAR Flip Signals
Buy Signal: Triggered when SAR flips from above price to below price.
Sell Signal: Triggered when SAR flips from below price to above price.
(Default SAR parameters: Start = 0.02, Increment = 0.02, Max = 0.2)
2. ZigZag Filter (Optional)
When Use ZigZag Filter = true:
The script confirms reversals only at significant pivots (swing highs/lows) detected by the ZigZag algorithm over the selected ZigZag Period (default = 14 bars).
Buy Signal: Appears only when a new pivot low is detected.
Sell Signal: Appears only when a new pivot high is detected.
3. Trade-Off
Without ZigZag: More signals, more noise.
With ZigZag: Fewer signals, but stronger confirmation and reduced false entries.
📈 How to Use
Signals appear as green arrows for buy and red arrows for sell.
Works well for:
Trend reversal detection.
Swing trading confirmation.
Filtering entries for other systems.
Recommended Timeframes: 15m, 1h, 4h.
Markets: Forex, Crypto, Stocks.
⚙️ Inputs
ZigZag Period (bars for pivot detection)
SAR Start / Increment / Max (SAR parameters)
Use ZigZag Filter (toggle for confirmation)
⚠️ Disclaimer
This script is for educational purposes only. It does not constitute financial advice.
Always test thoroughly before live trading.

supertrendLibrary "supertrend"
supertrend : Library dedicated to different variations of supertrend
supertrend_atr(length, multiplier, atrMaType, source, highSource, lowSource, waitForClose, delayed)
supertrend_atr: Simple supertrend based on atr but also takes into consideration of custom MA Type, sources
Parameters:
length (simple int) : : ATR Length
multiplier (simple float) : : ATR Multiplier
atrMaType (simple string) : : Moving Average type for ATR calculation. This can be sma, ema, hma, rma, wma, vwma, swma
source (float) : : Default is close. Can Chose custom source
highSource (float) : : Default is high. Can also use close price for both high and low source
lowSource (float) : : Default is low. Can also use close price for both high and low source
waitForClose (simple bool) : : Considers source for direction change crossover if checked. Else, uses highSource and lowSource.
delayed (simple bool) : : if set to true lags supertrend atr stop based on target levels.
Returns: dir : Supertrend direction
supertrend : BuyStop if direction is 1 else SellStop
supertrend_bands(bandType, maType, length, multiplier, source, highSource, lowSource, waitForClose, useTrueRange, useAlternateSource, alternateSource, sticky)
supertrend_bands: Simple supertrend based on atr but also takes into consideration of custom MA Type, sources
Parameters:
bandType (simple string) : : Type of band used - can be bb, kc or dc
maType (simple string) : : Moving Average type for Bands. This can be sma, ema, hma, rma, wma, vwma, swma
length (simple int) : : Band Length
multiplier (float) : : Std deviation or ATR multiplier for Bollinger Bands and Keltner Channel
source (float) : : Default is close. Can Chose custom source
highSource (float) : : Default is high. Can also use close price for both high and low source
lowSource (float) : : Default is low. Can also use close price for both high and low source
waitForClose (simple bool) : : Considers source for direction change crossover if checked. Else, uses highSource and lowSource.
useTrueRange (simple bool) : : Used for Keltner channel. If set to false, then high-low is used as range instead of true range
useAlternateSource (simple bool) : - Custom source is used for Donchian Chanbel only if useAlternateSource is set to true
alternateSource (float) : - Custom source for Donchian channel
sticky (simple bool) : : if set to true borders change only when price is beyond borders.
Returns: dir : Supertrend direction
supertrend : BuyStop if direction is 1 else SellStop
supertrend_zigzag(length, history, useAlternativeSource, alternativeSource, source, highSource, lowSource, waitForClose, atrlength, multiplier, atrMaType)
supertrend_zigzag: Zigzag pivot based supertrend
Parameters:
length (simple int) : : Zigzag Length
history (simple int) : : number of historical pivots to consider
useAlternativeSource (simple bool)
alternativeSource (float)
source (float) : : Default is close. Can Chose custom source
highSource (float) : : Default is high. Can also use close price for both high and low source
lowSource (float) : : Default is low. Can also use close price for both high and low source
waitForClose (simple bool) : : Considers source for direction change crossover if checked. Else, uses highSource and lowSource.
atrlength (simple int) : : ATR Length
multiplier (simple float) : : ATR Multiplier
atrMaType (simple string) : : Moving Average type for ATR calculation. This can be sma, ema, hma, rma, wma, vwma, swma
Returns: dir : Supertrend direction
supertrend : BuyStop if direction is 1 else SellStop
zupertrend(length, history, useAlternativeSource, alternativeSource, source, highSource, lowSource, waitForClose, atrlength, multiplier, atrMaType)
zupertrend: Zigzag pivot based supertrend
Parameters:
length (simple int) : : Zigzag Length
history (simple int) : : number of historical pivots to consider
useAlternativeSource (simple bool)
alternativeSource (float)
source (float) : : Default is close. Can Chose custom source
highSource (float) : : Default is high. Can also use close price for both high and low source
lowSource (float) : : Default is low. Can also use close price for both high and low source
waitForClose (simple bool) : : Considers source for direction change crossover if checked. Else, uses highSource and lowSource.
atrlength (simple int) : : ATR Length
multiplier (simple float) : : ATR Multiplier
atrMaType (simple string) : : Moving Average type for ATR calculation. This can be sma, ema, hma, rma, wma, vwma, swma
Returns: dir : Supertrend direction
supertrend : BuyStop if direction is 1 else SellStop
zsupertrend(zigzagpivots, history, source, highSource, lowSource, waitForClose, atrMaType, atrlength, multiplier)
zsupertrend: Same as zigzag supertrend. But, works on already calculated array rather than Calculating fresh zigzag
Parameters:
zigzagpivots (array) : : Precalculated zigzag pivots
history (simple int) : : number of historical pivots to consider
source (float) : : Default is close. Can Chose custom source
highSource (float) : : Default is high. Can also use close price for both high and low source
lowSource (float) : : Default is low. Can also use close price for both high and low source
waitForClose (simple bool) : : Considers source for direction change crossover if checked. Else, uses highSource and lowSource.
atrMaType (simple string) : : Moving Average type for ATR calculation. This can be sma, ema, hma, rma, wma, vwma, swma
atrlength (simple int) : : ATR Length
multiplier (simple float) : : ATR Multiplier
Returns: dir : Supertrend direction
supertrend : BuyStop if direction is 1 else SellStop

HSupertrendLibrary "HSupertrend"
Supertrend implementation based on harmonic patterns
hsupertrend(zProperties, pProperties, errorPercent, showPatterns, patternColor)
derives supertrend based on harmonic patterns
Parameters:
zProperties : ZigzagProperties containing Zigzag length and source array
pProperties : PatternProperties used for calculation
errorPercent : Error threshold for scanning patterns
showPatterns : Draw identified patterns structure on chart
patternColor : Color of the pattern lines to be drawn
Returns:
ZigzagProperties
ZigzagProperties contains values required for zigzag calculation
Fields:
length : Zigzag length
source : Array containing custom OHLC. If not set, array.from(high, low) is used
PatternProperties
PatternProperties are essential pattern parameters used for calculation of bullish and bearish zones
Fields:
base : Base for calculating entry and stop of pattern. Can be CD, minmax or correction. Default is CD
entryPercent : Distance from D in terms of percent of Base in the direction of pattern
stopPercent : Distance from D in terms of percent of Base in the opposite direction of pattern
useClosePrices : When set uses close price for calculation of supertrend breakout

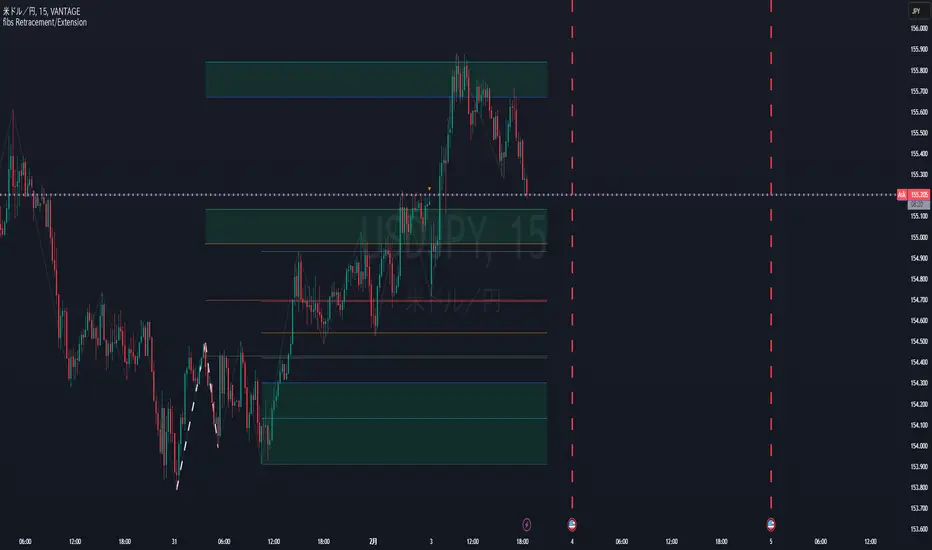
Fibonacci Retracement/ExtensionThis Pine Script code implements Fibonacci retracement and extension levels based on a ZigZag pattern. Below is a breakdown of its functionality:
Overview
The script calculates Fibonacci retracement and extension levels by identifying swing highs and swing lows using the ZigZag algorithm. It then plots these levels on the chart for trend analysis.
1. ZigZag Length Input
Defines the ZigZag length, which determines the sensitivity of peak and trough identification.
2. Fibonacci Retracement Calculation
Computes Fibonacci retracement levels using swing highs and lows.
Uses pre-defined Fibonacci ratios (0.236, 0.382, 0.5, 0.618, 0.786, 1.0).
Adjusts line positions dynamically as the trend evolves.
3. Fibonacci Extension Calculation
Identifies Fibonacci extension levels for future price targets.
Uses previous ZigZag patterns to estimate potential price movements.
4. Trend and Fibonacci Configuration
Allows the user to configure Fibonacci trend analysis.
TrendSw: Sets the trend direction (1 = Bullish, -1 = Bearish, 0 = None).
ZigZagleg: Determines the countback value for retracement calculations.
---Advanced Harmonic Pattern Scanner v5Summary of the Script:
All Patterns Covered: The script includes all major harmonic patterns: Butterfly, Gartley, Crab, Bat, Cypher, and Three Drives. Both bullish and bearish versions are detected.
ZigZag Swings: The zigzag logic helps find swing points (X, A, B, C, D) which are essential for forming these patterns. You can adjust the zigzagDepth parameter to fine-tune how sensitive the pattern detection is to price swings.
Fibonacci Levels: Each pattern uses specific Fibonacci retracement or extension levels to identify potential patterns, and the script compares price movements to these ratios.
Visual Aid: It uses plotshape() to display detected patterns on the chart and optional line.new() functions to connect the swing points for a better visual representation of the patterns.
How to Customize:
Timeframe: You can run this script on different timeframes by changing the chart on TradingView (1 min, 1 hour, 1 day, etc.).
ZigZag Sensitivity: Adjust the zigzagDepth to refine how frequently swing points are detected. Larger numbers will reduce sensitivity and show fewer but more pronounced patterns.
Pattern Refinement: Modify Fibonacci levels to experiment with custom harmonic patterns or adjust thresholds for the existing ones.
This code is an advanced version and scans the market comprehensively for all major harmonic patterns. Let me know if you need further modifications or explanations!

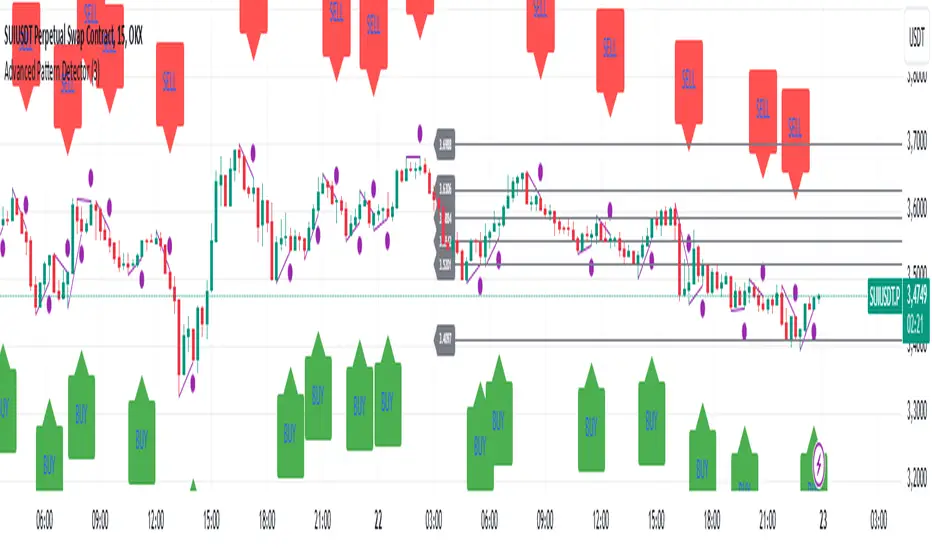
Advanced Pattern Detector**Script Overview**
**Indicator Name:** Advanced Pattern Detector
**Pine Script Version:** v5
**Indicator Type:** Overlaid on the chart (overlay=true)
**Main Features:**
- Detection and visualization of various technical patterns.
- Generation of BUY and SELL signals based on detected patterns.
- Display of Fibonacci levels to identify potential support and resistance levels.
- Ability to enable or disable each pattern through the indicator settings.
---
**Indicator Settings**
**Switches to Enable/Disable Patterns**
At the top of the indicator, there are parameters that allow the user to select which patterns will be displayed on the chart:
- Three Drives
- Rounding Top
- Rounding Bottom
- ZigZag Pattern
- Inverse Head and Shoulders
- Fibonacci Retracement
**Parameters for ZigZag**
Settings are also available for the ZigZag pattern, such as the depth of peak and trough detection, allowing the user to adjust the indicator's sensitivity to price changes.
---
**Pattern Detection**
Each pattern is implemented with its own logic, which checks specific conditions on the current bar (candle). Below are the main patterns:
1. **Three Drives**
- **Description:** This pattern consists of three consecutive price movements in one direction (up or down). It can signal the continuation of the current trend or its reversal.
- **How It Works:**
- **Upward Drive:** The indicator checks that the closing price of each subsequent candle is higher than the previous one for three bars.
- **Downward Drive:** The indicator checks that the closing price of each subsequent candle is lower than the previous one for three bars.
2. **Rounding Top**
- **Description:** A pattern representing a smooth decrease in maximum prices over several bars, which may indicate a potential downward trend reversal.
- **How It Works:**
- The indicator checks that the maximum prices of the last five bars are gradually decreasing, and the current bar shows a decrease in the maximum price.
3. **Rounding Bottom**
- **Description:** A pattern characterized by a smooth increase in minimum prices over several bars, signaling a possible upward trend reversal.
- **How It Works:**
- The indicator checks that the minimum prices of the last five bars are gradually increasing, and the current bar shows an increase in the minimum price.
4. **ZigZag Pattern**
- **Description:** Used to identify corrective movements on the chart. The pattern shows peak and trough points connected by lines, helping to visualize the main price movement.
- **How It Works:**
- The indicator uses a function to determine local maxima and minima based on the specified depth.
- Detected peaks and troughs are connected by lines to create a visual zigzag structure.
5. **Inverse Head and Shoulders**
- **Description:** An inverted head and shoulders formation signals a possible reversal of a downward trend to an upward one.
- **How It Works:**
- The indicator looks for three local minima: the left shoulder, the head (the lowest minimum), and the right shoulder.
- It checks that the left and right shoulders are approximately at the same level and below the head.
6. **Fibonacci Retracement Levels**
- **Description:** Automatically builds key Fibonacci levels based on the maximum and minimum prices over the last 50 bars. These levels are often used as potential support and resistance levels.
- **How It Works:**
- Daily, the minimum and maximum prices over the last 50 bars are calculated.
- Based on these values, Fibonacci levels are drawn: 100%, 23.6%, 38.2%, 50%, 61.8%, and 0%.
- Old levels are removed when a new day begins to keep the chart clean and up-to-date.
---
**Generation of Buy and Sell Signals**
The indicator combines the results of detected patterns to generate trading signals:
- **Buy Signals (BUY):**
- Rounding Bottom
- Three Drives Up
- Inverse Head and Shoulders
- ZigZag Low
- **Sell Signals (SELL):**
- Rounding Top
- Three Drives Down
- Inverse Head and Shoulders
- ZigZag High
**How It Works:**
- If one or more buy conditions are met, a "BUY" label is displayed below the corresponding bar on the chart.
- If one or more sell conditions are met, a "SELL" label is displayed above the corresponding bar on the chart.
---
**Visualization of Patterns on the Chart**
Each detected pattern is visualized using various graphical elements, allowing traders to easily identify them on the chart:
- **Three Drives Up:** Green upward triangle below the bar.
- **Three Drives Down:** Red downward triangle above the bar.
- **Rounding Top:** Orange "RT" label above the bar.
- **Rounding Bottom:** Blue "RB" label below the bar.
- **Inverse Head and Shoulders:** Turquoise "iH&S" label below the bar.
- **ZigZag High/Low:** Purple circles at the peaks and troughs of the zigzag.
---
**Displaying Fibonacci Levels**
Fibonacci levels are displayed as horizontal lines on the chart with corresponding labels. These levels help traders determine potential entry and exit points, as well as support and resistance levels.
---
**Drawing ZigZag Lines**
ZigZag lines connect the detected peaks and troughs, visualizing corrective movements. To avoid cluttering the chart, the number of lines is limited, and old lines are automatically removed as new ones are added.
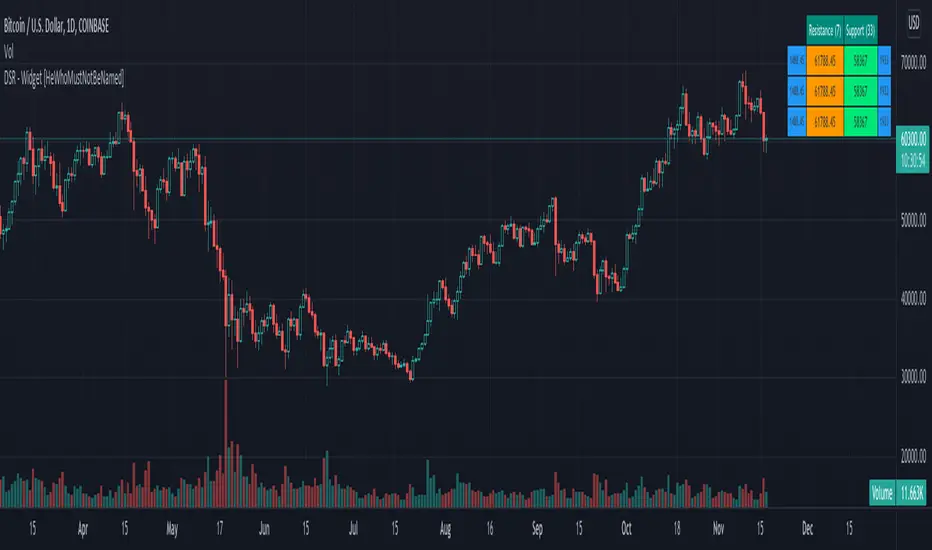
Divergence-Support/Resistance - Widget [HeWhoMustNotBeNamed]Unique live widget which provides information about support and resistance along with distance to immediate levels.
⬜ Custom Candle Source
Three options of candles available
▶ Regular OHLC candles
▶ Heikin-Ashi candles ( Taken leaf out of @Bjorgum's book - but, still could not do it as good as him :) )
▶ Moving average candles
⬜ Multiple zigzags and choice of oscillator
Like any other zigzag based indicator, I prefer using 4 zigzag levels.
And select oscillator of your choice to identify divergence. Oscillator lengths are automatically calculated based on zigzag lengths. You can also chose external oscillator.
⬜ Support and resistance widget settings
▶ Max S/R per zigzag - this is the number of last S/R levels recorded for each zigzag
▶ Max S/R for stats - even though there can be many number of S/R levels, we cannot show all of them in the widget due to space constraint. Hence, this is set to minimal value of 3. Can be changed via this input.
▶ Max S/R for Alerts - When sending stats through alerts, users can decide how many immediate S/R levels to be sent in them.
▶ Alert Choices - Can chose to get alerts when new S/R levels formed and also when existing S/R levels broken.
Personally think it is a very handy widget to have!!
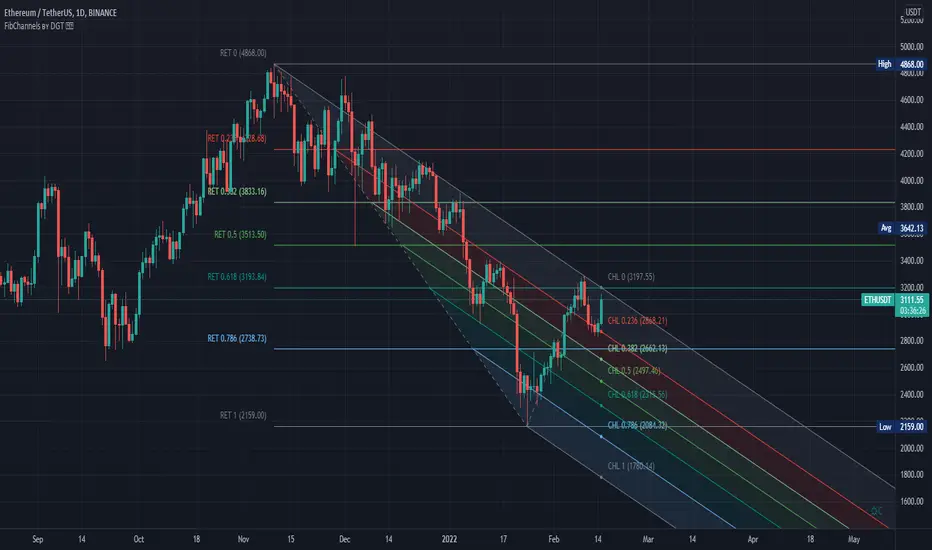
Auto Fib Channels by DGTThe Fibonacci Channel is a technical analysis tool that is used to estimate support and resistance levels based on the Fibonacci numbers. It is a variation of the Fibonacci retracement tool, except with the channel the lines run diagonally rather than horizontally.
This study will automatically place the channels where the levels indicate future areas of support and resistance
For further details please refer to education post
Nobody appears to know whether Fibonacci tools work because markets exhibit some form of natural pattern or because many investors use Fibonacci ratios to predict price movements, making them a self-fulfilling prophecy.
█ Study OPTIONS
Auto Fibonacci Channels , the main aim of the study
- Pivot threshold can be adjusted via “Deviation” and “Depth” input options
- Historical Channels / Retracements option will allow plotting of Channels on previous pivot high/lows
- Ability to set ALERTs for the Channel Levels
- Channel Labels displays the price of the line at the last bar, the price value will be updated in each new bar
Auto Fib Retracement – This is the build-in study of TradingView, customized to be in-line with Fibonacci Channels
- Pivot threshold can be adjusted via “Deviation” and “Depth” input options
- Historical Channels / Retracements option will allow plotting of Retracements on previous pivot high/lows
- Ability to set ALERTs for the Retracement Levels
Zig Zag – Derived from build-in Auto Fib Retracement with some customization options.
Disclaimer :
Trading success is all about following your trading strategy and the indicators should fit within your trading strategy, and not to be traded upon solely
The script is for informational and educational purposes only. Use of the script does not constitute professional and/or financial advice. You alone have the sole responsibility of evaluating the script output and risks associated with the use of the script. In exchange for using the script, you agree not to hold dgtrd TradingView user liable for any possible claim for damages arising from any decision you make based on use of the script