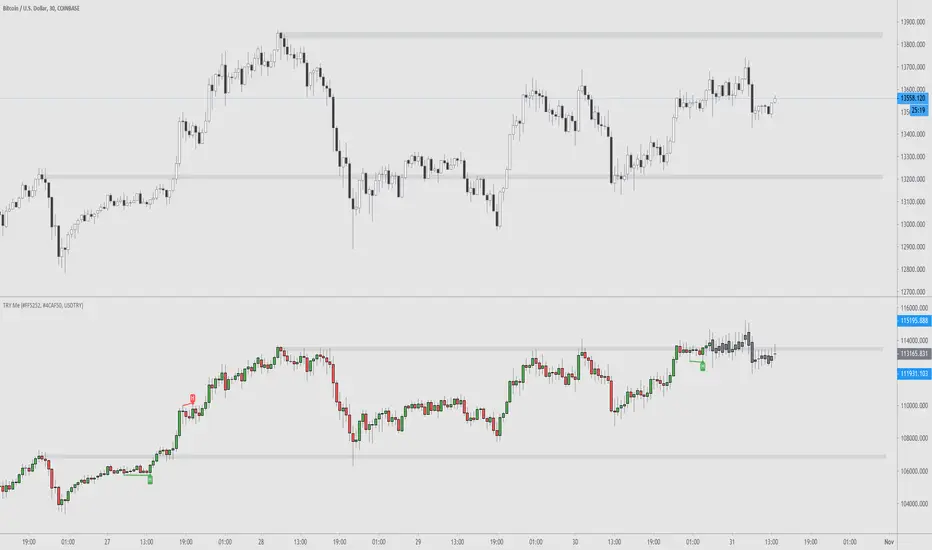
TRY Me - Turkish Lira Quote Currency DivergencesThis is a conceptual indicator that converts the main chart series' quote currency from U.S. dollar to Turkish Lira. Should only be used with USD pairs unless you change the 'Pair' input.
Divergences are created by the difference in price due to the incredible changes in TRY value. The candle colors turn to grey when the forex exchange is closed; this is done to show you that the quote currency value won't change.
Support and resistance levels are also possible to be drawn.
Options to configure are changing the quote pair, colors, and turning the divergences on or off.
在腳本中搜尋"zigzag"
RSI Tops and BottomsHello Traders
This script finds Tops when RSI is in overbought area or Bottoms when RSI is in oversold area and checks the divergence between them. it checks divergence at tops/bottoms after RSI exited from OB/OS areas.
You can change overbought / oversold levels.
You can limit the time that RSI is in OB/OS area with the option "Max Number of Bars in OB/OS"
you can set the minimum/maximum distances between Tops/Bottoms with the options "Min Number of Bars between Tops/Bottoms" and "Max Number of Bars between Topss/Bottoms"
and you can set the color and line widths as you wish.
These tops or bottom must be sequential, means there mustn't be another top while checking tops or bottom while checking bottoms between them.
in next example you can see valid and invalid bottoms:
After you got signal then you better use Stop Order, a few pips higher than the high of colored candle for long positions, ( vise versa in short positions ). so you may escape from traps. ("Stop order" is filled when the price reached a pre-specified price. for example the price is now 10.0 and you set Buy Stop Order at 11.0 then if price reaches 11.0 then your buy order get filled. you can put stoploss a few pips lower than the low of colored candle or you can use ATR to decice stoploss level. how you wish)
For example in following screenshot you can see that buy stop order was not filled and you didn't take long position.
Enjoy!

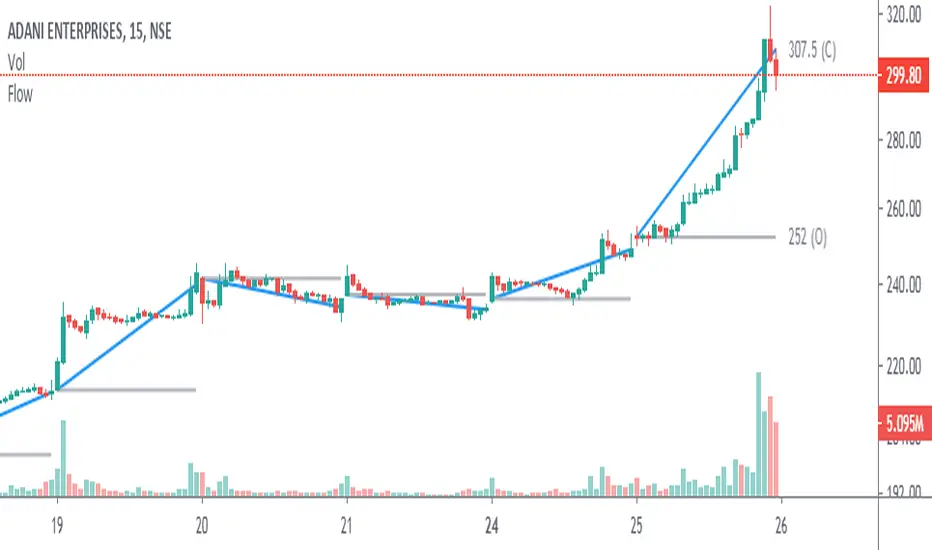
Angle & Price FlowThis is a simple end of the day indicator based on open and close values.
Angles:
Identifying narrow angles helps to find breakouts
Maximum angle = High chance of reversal
Minimum angle = Chance of breakouts on the next day or upcoming days.
Price Flow:
I personally use price flow to simplify the flow of candlestick chart and to identify breakouts using rounding bottoms and rounding top patterns, sharp corners for reversals.
Features:
Multi time frame
Labels
Hide previous period
Combine it with other indicators for better result.

Consolidation Zones - LiveHello Traders!
This is the script that finds Consolidation Zones in Realtime.
How it works?
- The script finds highest/lowest bars by using "Loopback Period"
- Then it calculates direction
- By using the direction and highest/lowest bar info it calculates consolidation zones in realtime
- If the length of consolidation area is equal/greater than user-defined min length then this area is shown as consolidation zone
- Then Consolidation Zone extends automatically if there is no breakout
if you increase the Loopback Length then you get bigger consolidation zones:
You have option to "Paint Consolidation Area" or not:
Enjoy!

Key price levelsFunction: labelling recent highs and lows automatically. Easy and clean.
In this example, we can see the previous low of the ticker is around 105.5, the previous high is around 120.
We can set up our entries and exits by referring to the last lows and highs.
Users can adjust the searching bar range by themselves.

RSI Market StructureThis indicator draws swings on the chart based on the RSI configured within.
The swings are drawn from Overbought to Oversold or vice-versa.
Logic:
From Overbought to Oversold, a line is drawn from the highest price before oversold to the lowest price of the oversold.
The labels can be deactivated from the style menu, it was easier for me to implement this way (It's my first indicator)

Fibonacci + RSI - StrategyStrategy: Fibonacci + RSI:
- Intraday trading strategy (Scalping).
Time Frames Tested with best Results:
30 Minutes.
5 Minutes.
15 Minutes.
1 Minute
Indicators Used:
RSI (30 / 70)
Fibonacci (1 - 0.784)
How it Works:
Once the Price Hits the 1 or -1 Fibonacci Level and bounces a little bit, It checks the RSI if Over Bought or Over Sold According to 30 - 70.
If both conditions are satisfied, it triggers a Long or Short Positions.
Further Notes:
- I have put a Stop-loss with a 2% just for further upgrades.
- Not advised to use in High Volatility Markets.
- No Repaint was observed during a 2-Weeks Tests.
If you have any suggestions or modifications please contact to add.
If you have observed any bad behavior please contact to fix.
Trade wisely.

Smart Indicator 28 - Swing Pivots (Higher Highs and Lower Lows)A simple way to find Higher Highs and Lower Lows (HH and LL) whit automatic Fibonacci Lines in the most common levels.
In this indicator the Higher Highs only happens when a high value are rising from each other in the last "Length of Real Pivots" highs and the next same number of highs are falling in every single bar.
The Lower Lows are inverted, LL only appears if a low is falling in every single bar in the last number of length and the lows price of the "n" bars next are rising.
You can use this Indicator in any kind of market.

Trend LinesHello Everyone! This is my new trend lines script (after beta version that was published almost one year ago)
The idea is to find Pivot Highs (PH) and Pivot Lows(PL) first.
Then, If current PH is smaller then previous PH (means no new higher high and possible downtrend) then draw trend line using them. and also it checks previous trend line (if exits) and if current angle is smaller then don't extend previous one.
Same idea when using Pivot Lows, If current PL is higher then previous PL (means no new lower low and possible uptrend) then draw trend line using them. and also it checks previous trend line (if exits) and if current angle is smaller then don't extend previous one.
Optionally style of old trend lines drawn as dashed.
Hope you enjoy it!

[fikira] Harmonic Patterns 2This is "Harmonic Patterns", part 2 Open Source
(in 2 parts, otherwise many lines are gone because the script is too large):
- Crab
- Bat (+ Alt)
- Butterfly
- Shark
A "Pattern" is created by checking 5 consecutive ( pivot ) points, starting with X, A, B, C, and ending with point D.
At point D all 5 points are compared, calculated and verified.
When confirmed, a "Label" will be plotted at point D, together with the "Entry", "Take Profit" and "Stop Loss" price.
The "Entry", "Take Profit" and "Stop Loss" lines will be plotted as well at point D.
Lastly, a "Drawing" automatically will be displayed which makes the "Pattern" visible.
Please do mind, the "Drawing" is calculated differently, the "Drawing" sometimes can be displayed incorrectly
when prices are too close to each other (for example low Satoshi price changes).
THE "ENTRY", "TAKE PROFIT", "STOP LOSS" PRICES AND LINES ARE NOT AFFECTED AT ALL BY THIS, THEY WILL SHOW CORRECTLY!
- 1 "TP point" can be changed ("TP Level 0.618")
- "Labels", "Lines", "Drawings" can be disabled/enabled
- "Labels" can be made smaller or bigger ("Size Label")
- "Labels" can be placed further or closer to the bar ("Distance TP Label" > higher = closer, lower = further)
- "Lines" can be made thicker or thinner ("TP Linewidth")
- "Drawings" can be made thicker or thinner ("Drawings Linewidth")
- "Drawings" are created by comparing with 100 bars back in history (default), should it be (very rarely) a triangle is displayed flat on the left side,
possibly the first point(s) is/are further than 100 bars ago, in this case increase "Period Drawings" above 100.
- Animal symbols can be enabled/disabled
- When several "Patterns" appear on the chart, the oldest ones won't be displayed anymore, first the "Drawings", then the "Lines"
The last (present) ones will always be displayed in total without a problem!
- If you want to see "Patterns" with less correct measurement, change "Error Marge" 0.9 - 1" and "Error Marge" 1 - 1.1"), this gives max. about 10% extra margin
- Added more settings regarding "Drawing Lines"
Thank you very much!

Average True Range PercentageUseful in finding the percent change in the ATR. Google it and see how you can implement it. I use it in a zig zag indicator made by Ricardo Santos.
Happy Trading!

Higher High Lower Low Strategy (With Source Code)This script finds pivot highs and pivot lows then calculates higher highs & lower lows. And also it calculates support/resistance by using HH-HL-LL-LH points.
Generally HH and HL shows up-trend, LL and LH shows down-trend.
If price breaks resistance levels it means the trend is up or if price breaks support level it means the trend is down, so the script changes bar color blue or black. if there is up-trend then bar color is blue, or if down-trend then bar color is black. also as you can see support and resistance levels change dynamically.
If you use smaller numbers for left/right bars then it will be more sensitive.
source code of :

Fractal Regression Channel V0.1Port of @RicardoSantos' Fractal Regression Channel V0 from pinescript 2 to pinescript 3.
// Source:
// Original Author: @RicardoSantos


Noro's ZigTrend Strategy v1.0Trend reverse trade strategy. The indicator a zigzag is used.
If the candle is closed above than the line of a zigzag - to open a long position.
If the candle is closed below than the line of a zigzag - to open a short position.


IndicatorsLibrary "Indicators"
this has a calculation for the most used indicators.
macd4C(fastMa, slowMa)
this calculates macd 4c
Parameters:
fastMa (simple int) : is the period for the fast ma. the minimum value is 7
slowMa (simple int) : is the period for the slow ma. the minimum value is 7
Returns: the macd 4c value for the current bar
rsi(rsiSourceInput, rsiLengthInput)
this calculates rsi
Parameters:
rsiSourceInput (float) : is the source for the rsi
rsiLengthInput (simple int) : is the period for the rsi
Returns: the rsi value for the current bar
ao(source, fastPeriod, slowPeriod)
this calculates ao
Parameters:
source (float) : is the source for the ao
fastPeriod (int) : is the period for the fast ma
slowPeriod (int) : is the period for the slow ma
Returns: the ao value for the current bar
kernelAoOscillator(kernelFastLookback, kernelSlowLookback, kernelFastWeight, kernelSlowWeight, kernelFastRegressionStart, kernelSlowRegressionStart, kernelFastSmoothPeriod, kernelSlowSmoothPeriod, kernelFastSmooth, kernelSlowSmooth, source)
this calculates our own kernel ao oscillator which we made
Parameters:
kernelFastLookback (simple int)
kernelSlowLookback (simple int)
kernelFastWeight (simple float)
kernelSlowWeight (simple float)
kernelFastRegressionStart (simple int)
kernelSlowRegressionStart (simple int)
kernelFastSmoothPeriod (int)
kernelSlowSmoothPeriod (int)
kernelFastSmooth (bool)
kernelSlowSmooth (bool)
source (float) : is the source for the ao
Returns: the kernel ao oscillator value for the current bar, the colors for both the fast and slow kernel, the fast & slow kernel
signalLineKernel(lag, h, r, x_0, smoothColors, _src, c_bullish, c_bearish)
Parameters:
lag (int)
h (float)
r (float)
x_0 (int)
smoothColors (bool)
_src (float)
c_bullish (color)
c_bearish (color)
zigzagCalc(Depth, Deviation, Backstep, repaint, Show_zz, line_thick, text_color)
Parameters:
Depth (int)
Deviation (int)
Backstep (int)
repaint (bool)
Show_zz (bool)
line_thick (int)
text_color (color)

HASHRATE and MINER REVENUEThis script uses daily data points from Quandl which measure Bitcoin mining hashrate, and miner revenue, and averages the two. The two data sets are fairly zigzaggy, so to smooth the data I am use a John Ehlers' filter to reduce the noise. Why did I combine the two? Both have correlation to BTC price action, and by combining hashrate and revenue, I believe it produces a stronger and more accurate signal. At times when the background is green (also displayed with a green square at the bottom), conditions are good in Bitcoinland with miner revenue/hashrate going up. No color in the background and no dot, means the combined miner revenue and hashrate indicator is dropping, but nothing to get worried about. Seeing red dots on the bottom along with a red background signals a rapidly dropping rate of hashrate/miner revenue, and with a fairly strong correlation to the Bitcoin price. Not every red zone foretells a drop in the Bitcoin price, but a significant number of them do. I wrote this script as an early warning system for when to move out of Bitcoin. Use at your own risk. Feel free to modify this code to suit your personal needs. Please only use on BTC /USD pairs with 1D bars. Since there is only one data point per day published by Quandl, it will not give accurate data for shorter timeframes. Enjoy.

Fib and Slope Trend Detector [EWT] + MTF Dashboard🚀 Overview
The Momentum Structure Trend Detector is a sophisticated trend-following tool that combines Price Velocity (Slope) with Market Structure (Fibonacci) to identify high-probability trend reversals and continuations.
Unlike traditional indicators that rely heavily on lagging moving averages, this script analyzes the speed of price action in real-time. It operates on the core principle of market structure: Impulse moves are fast and steep, while corrections are slow and shallow.
🧠 The Logic: Physics Meets Market Structure
This indicator determines the trend direction by calculating the Slope (Velocity) of price swings.
ZigZag Calculation: It first identifies market swings (Highs and Lows) using a standard pivot detection algorithm.
Slope Calculation: It calculates the velocity of every completed leg using the formula: $Slope = \frac{|Price Change|}{|Time Duration|}$.
Trend Definition:
Uptrend : If the previous Up-move was fast (Impulse) and the subsequent Down-move is slower (Correction), the market is primed for an uptrend.
Downtrend : If the previous Down-move was fast (Impulse) and the subsequent Up-move is slower (Correction), the market is primed for a downtrend.
🔥 Key Features
1. Aggressive Real-Time Detection (No Lag)
Most structure indicators wait for a "Higher High" to confirm a trend, which often leads to late entries. This script uses an Aggressive Live Slope calculation:
It compares the current developing slope of the live price action against the slope of the previous completed leg.
Result: As soon as the current move becomes "steeper" (faster) than the previous correction, the trend flips immediately. This allows you to catch the "meat" of the move before a new pivot is even confirmed.
2. Fibonacci Validity Filter
Momentum alone isn't enough; we need structural integrity.
The script calculates the 78.6% Retracement level of the impulse leg.
If a correction moves deeper than this Fibonacci limit (on a closing basis), the trend structure is considered "broken" or "invalid," and the indicator switches to a Neutral state. This filters out choppy/ranging markets.
3. Multi-Timeframe (MTF) Dashboard
A customizable dashboard on the chart allows for fractal analysis. You can view the trend state (UP/DOWN/NEUTRAL) across 9 different timeframes (1m to 1M) simultaneously.
Green Row : Uptrend
Red Row : Downtrend
Gray : Neutral/Indeterminate
4. Smart Visuals
Background Colo r: Changes dynamically (Teal for Bullish, Red for Bearish, Gray for Neutral) to give you an instant read of the market state.
Slope Labels : Displays the calculated numeric slope on the chart, helping you visualize the momentum difference between impulse and corrective waves.
Invalidation Levels : Automatically plots the invalidation line (Stop Loss level) based on the market structure.
🛠️ Settings & Inputs
Strategy Settings
Pivot Deviation Length : Sensitivity of the ZigZag calculation (Default: 5). Lower numbers = more sensitive to small swings.
Max Retracement % : The Fibonacci limit for a valid correction (Default: 78.6%).
Min Bars for Live Calc : To prevent noise, the script waits for this many bars after a pivot before calculating the "Live Slope" (Default: 3).
Dashboard Settings
Show Dashboard : Toggle the table on/off.
Timeframe Toggles : Enable/Disable specific timeframes (1m, 5m, 15m, 30m, 1H, 4H, 1D, 1W, 1M) to suit your trading style.
🎯 How to Use
Wait for Background Change : When the background turns Teal, it indicates that a corrective pullback has ended and a new impulse with high velocity has begun.
Check Invalidation : Look at the plotted Stop Loss Level. If price closes below this line, the trade idea is invalid.
Confirm with Dashboard : Use the table to ensure the higher timeframes (e.g., 1H, 4H) align with your current chart's direction for higher probability setups.
Disclaimer : This tool is designed for trend analysis and educational purposes. Past performance (momentum) is not indicative of future results. Always manage your risk.

UltimateFlow by Kate V0.2Ultimate Flow Script: Tracks market structure breaks, buy/sell entries (CE/SE), and trends with a Zero Lag SMA. Highlights Bullish & Bearish Order Blocks (OB, BB, MM) with dynamic boxes and tiny labels. Zigzag swings visualize market structure for smart entries. Play with the various settings to suit your trading style. Alerts available for MSB changes and price in OB zones.
Disclaimer: This script is for educational and informational purposes only. It should be used in line with your own trading strategy, risk management, and discretion. Past performance is not indicative of future results.
This script is designed for price action, market structure, and order block analysis on TradingView. It includes:
Buy & Sell Signals (CE/SE) – Highlights potential entries based on market structure breaks and trend changes. Mini triangles or markers indicate possible reversals.
Zero Lag SMA (ZSMA) – Smooths price action for trend confirmation without delay. Helps identify trend direction and support/resistance areas.
Order Blocks (OBs) – Highlights key Bullish (Bu-OB) and Bearish (Be-OB) order blocks on the chart. Boxes dynamically extend as price evolves and include tiny labels (Bu-OB, Be-BB, MM, etc.) for clarity.
Zigzag Market Structure – Draws swing highs and lows to visualize market structure breaks (MSB).
How it works:
OB boxes extend automatically and change when price breaks them.
CE/SE markers help identify high-probability trade entries.
ZSMA confirms trend direction.
Alerts can be set for MSB changes or when price enters an OB zone.

5 SMA/EMA_ZigzagThis indicator combines five SMA/EMA/WMA lines with the “ZigZag with Fibonacci Levels” indicator by LonesomeTheBlue, designed to trade according to Thắng Đoàn SMT’s method.
EMA 21 34
Zigzag 3/5

Elliott Wave (𝐒𝐓𝐄𝐄𝐋 𝐂𝐈𝐓𝐘 𝐂𝐑𝐄𝐀𝐓𝐎𝐑𝐒)This indicator provides a rules-based helper for visually identifying potential Elliott Wave patterns — including 1–5 impulse structures and optional A–B–C corrective moves. It automatically detects pivot highs/lows using the user-defined left/right swing settings and connects them with a ZigZag line filtered by either ATR or percentage change to reduce market noise.
When a valid 5-wave impulse structure is found (either bullish or bearish), the indicator labels waves 1–5 on the chart. After completion of the fifth wave, it optionally monitors for an A–B–C corrective pattern and labels those points when detected. Alerts are generated when an impulse or correction is confirmed.
Features
✅ Automatic pivot detection using configurable left/right swing bars.
✅ ATR or %-based swing filter to avoid small fluctuations.
✅ ZigZag plotting to visualize price structure.
✅ Automatic labeling of potential Elliott impulse waves (1–5).
✅ Optional A–B–C correction detection after wave 5.
✅ Alerts when impulses and corrections complete.
✅ Customizable visuals (colors, sensitivity, pivot length).
✅ Works on all symbols and timeframes.
Usage Tips
For best results, use larger timeframes (e.g., 1H–1D) where Elliott structures are cleaner.
Adjust Pivot Left/Right and ATR Multiplier for your chart’s volatility.
Remember: Elliott Wave theory is interpretive — this tool provides objective swing logic to assist manual analysis, not a guaranteed automatic wave count.
