DTCC RECAPS Dates 2020-2025This is a simple indicator which marks the RECAPS dates of the DTCC, during the periods of 2020 to 2025.
These dates have marked clear settlement squeezes in the past, such as GME's squeeze of January 2021.
------------------------------------------------------------------------------------------------------------------
The Depository Trust & Clearing Corporation (DTCC) has published the 2025 schedule for its Reconfirmation and Re-pricing Service (RECAPS) through the National Securities Clearing Corporation (NSCC). RECAPS is a monthly process for comparing and re-pricing eligible equities, municipals, corporate bonds, and Unit Investment Trusts (UITs) that have aged two business days or more .
At its core, the Reconfirmation and Re-pricing Service (RECAPS) is a risk management tool used by the National Securities Clearing Corporation (NSCC), a subsidiary of the DTCC. Its primary purpose is to reduce the risks associated with aged, unsettled trades in the U.S. securities market .
When a trade is executed, it is sent to the NSCC for clearing and settlement. However, for various reasons, some trades may not settle on their scheduled date and become "aged." These unsettled trades create risk for both the trading parties and the clearinghouse (NSCC) because the value of the underlying securities can change over time. If a trade fails to settle and one of the parties defaults, the NSCC may have to step in to complete the transaction at the current market price, which could result in a loss.
RECAPS mitigates this risk by systematically re-pricing these aged, open trading obligations to the current market value. This process ensures that the financial obligations of the clearing members accurately reflect the present value of the securities, preventing the accumulation of significant, unmanaged market risk .
Detailed Mechanics: How Does it Work?
The RECAPS process revolves around two key dates you asked about: the RECAPS Date and the Settlement Date .
The RECAPS Date: On this day, the NSCC runs a process to identify all eligible trades that have remained unsettled for two business days or more. These "aged" trades are then re-priced to the current market value. This re-pricing is not just a simple recalculation; it generates new settlement instructions. The original, unsettled trade is effectively cancelled and replaced with a new one at the current market price. This is done through the NSCC's Obligation Warehouse.
The Settlement Date: This is typically the business day following the RECAPS date. On this date, the financial settlement of the re-priced trades occurs. The difference in value between the original trade price and the new, re-priced value is settled between the two trading parties. This "mark-to-market" adjustment is processed through the members' settlement accounts at the DTCC.
Essentially, the process ensures that any gains or losses due to price changes in the underlying security are realized and settled periodically, rather than being deferred until the trade is ultimately settled or cancelled.
Are These Dates Used to Check Margin Requirements?
Yes, indirectly, this process is closely tied to managing margin and collateral requirements for NSCC members. Here’s how:
The NSCC requires its members to post collateral to a clearing fund, which acts as a mutualized guarantee against defaults. The amount of collateral each member must provide is calculated based on their potential risk exposure to the clearinghouse.
By re-pricing aged trades to current market values through RECAPS, the NSCC gets a more accurate picture of each member's outstanding obligations and, therefore, their current risk profile. If a member has a large number of unsettled trades that have moved against them in value, the re-pricing will crystallize that loss, which will be settled the next day.
This regular re-pricing and settlement of aged trades prevent the build-up of large, unrealized losses that could increase a member's risk profile beyond what their posted collateral can cover. While RECAPS is not the only mechanism for calculating margin (the NSCC has a complex system for daily margin calls based on overall portfolio risk), it is a crucial component for managing the specific risk posed by aged, unsettled transactions. It ensures that the value of these obligations is kept current, which in turn helps ensure that collateral levels remain adequate.
--------------------------------------------------------------------------------------------------------------
Future dates of 2025:
- November 12, 2025 (Wed)
- November 25, 2025 (Tue)
- December 11, 2025 (Thu)
- December 29, 2025 (Mon)
The dates for 2026 haven't been published yet at this time.
The RECAPS process is essentially the industry's way of retrying the settlement of all unresolved FTDs, netting outstanding obligations, and gradually forcing resolution (either delivery or buy-in). Monitoring RECAPS cycles is one way to track the lifecycle, accumulation, and eventual resolution (or persistence) of failures to deliver in the U.S. market.
The US Stock market has become a game of settlement dates and FTDs, therefore this can be useful to track.
在腳本中搜尋"上大股份+最新股价+走势分析+2025年6月"

NASDAQ 5MIN — 8×13 EMA + VWAP Pro Setup (2025)NASDAQ 5MIN — 8×13 EMA + VWAP Pro Setup (2025 Funded Trader Edition)
by ASALEH2297
The exact same 5-minute Nasdaq scalping system that multiple 6- and 7-figure funded accounts are running live in 2025 – now public.
100 % mechanical, zero repaint, zero guesswork.
Core Rules (executed instantly when the arrow prints):
• 8 EMA crosses 13 EMA
• Must be on the correct side of daily VWAP AND sloping 34 EMA
• Price closed beyond the 34 EMA
• High-confidence filter = price well away from VWAP + fast 8 EMA trending + volume spike → massive bright “3↑ / 3↓” arrow (load full size)
• Normal confidence = small arrow (normal or half size)
Key Features:
• Automatic dynamic swing stops plotted in real-time (6-point buffer beyond prior 10-bar extreme – the exact 2025 NQ stop method)
• Clean, impossible-to-miss arrows (huge bright for Conf 3, small for regular)
• Built-in alert conditions so “LONG (Conf 3)” and “SHORT (Conf 3)” appear instantly in mobile/desktop alerts
• Works perfectly on NQ1! (full) and MNQ1! (micro) 5-minute charts
• Best sessions: 09:30–11:30 ET and 14:00–16:00 ET
How to trade it:
1. Big 3-arrow appears on closed bar → market order in
2. Stop = red dashed line (already drawn)
3. Scale out 50 % at +40 pts NQ / +20 pts MNQ, move rest to breakeven, trail with 13 EMA
Pine Script v6 – zero errors, zero warnings.
Used daily on live funded desks. Add it, set the two Conf-3 alerts, and let the phone scream only when the real money prints.
“When the 3↑ hits… the bag follows.”
— ASALEH2297

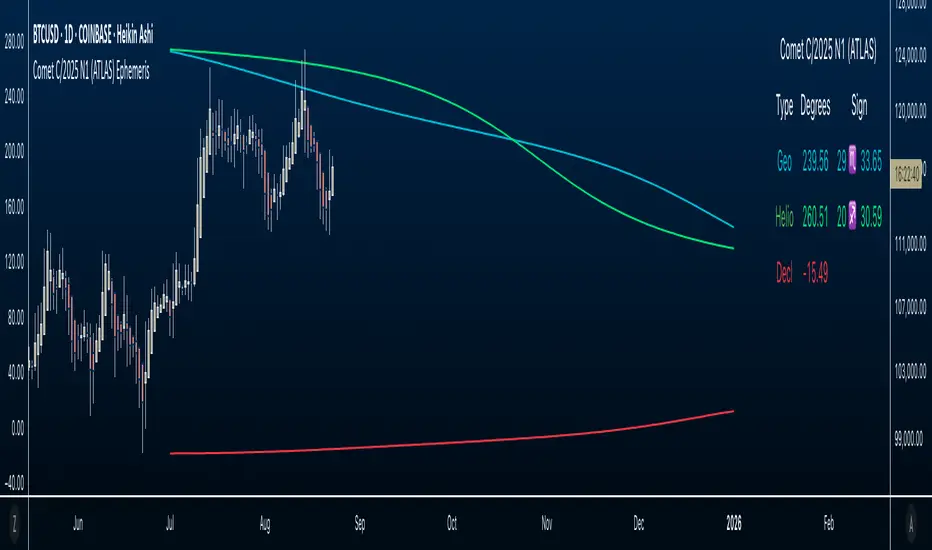
Comet C/2025 N1 (ATLAS) Ephemeris☄️ Ephemeris How-To: Plot JPL Horizons Data on TradingView (Educational)
Overview
This open-source Pine Script™ v6 indicator demonstrates how to bring external astronomical ephemeris into TradingView and plot it on a daily chart. Using Comet C/2025 N1 (ATLAS) as an example dataset, it shows the mechanics of structuring arrays, indexing by date, and drawing past and forward ( future projections ) values—strictly as an educational visualization of celestial motion.
Why This Approach
Data is generated from NASA JPL Horizons, a mission-grade, publicly available ephemeris service ( (ssd.jpl.nasa.gov)). On the daily timeframe, Horizons provides high-precision positions you can regenerate whenever solutions update—useful for educational accuracy in exploring orbital data.
What’s Plotted
- Geocentric ecliptic longitude (Earth-view)
- Heliocentric ecliptic longitude (Sun-centered)
- Declination (deg from celestial equator)
Features
- Simple arrays + date indexing (no per-row timestamps)
- Circles for historical/current bars; polylines to connect forward points, emphasizing future projections
- Toggle any series on/off via inputs
- Daily timeframe enforced (runtime error if not 1D)
- Optional table with zodiac conversion (AstroLib by BarefootJoey)
Data & Updates
The example arrays span 2025-07-01 (discovery date) → 2026-01-01. You can refresh them anytime from JPL Horizons (Observer: Geocentric; daily step; include ecliptic lon/lat and declination) and paste the new values into the script.
How we pulled the ephemeris from JPL Horizons (quick guide):
0) Open ssd.jpl.nasa.gov System
1. Ephemeris Type: Observer Table
2. Target Body: C/2025 N1 (ATLAS) (or any object you want)
3. Observer Location: Geocentric
4. Time Specification: set Start, Stop, Step = 1 day
5. Table Settings → Quantities:
* Astrometric RA & Dec
* Heliocentric ecliptic longitude & latitude
* Observer (geocentric) ecliptic longitude & latitude
6. Additional Table Settings:
* Calendar format: Gregorian
* Date/Time: calendar (UTC), Hours & Minutes (HH:MM)
* Angle format: Decimal degrees
* Refraction model: No refraction / airless
* Range units: Astronomical units (au)
7. Generate → Download results (CSV or text).
8. Use AI or a small script to parse columns (e.g., Obs ecliptic lon, Helio ecliptic lon, Declination) into arrays, then paste them into your Pine script.
Educational Note
This indicator’s goal is to show how to prepare and plot ephemeris—so you can adapt the method for other comets or celestial bodies, or swap in data from existing astro libraries, for learning about astronomical projections using JPL daily data.
Credits & License
- Ephemeris: Solar System Dynamics Group, Horizons On-Line Ephemeris System, 4800 Oak Grove Drive, Jet Propulsion Laboratory, Pasadena, CA 91109, USA.
- Zodiac conversion: AstroLib by BarefootJoey
- License: MIT
- For educational use only.
MERRY CHRISTMAS HAPPY 2025 Year [TradingFinder]🎅🎄✨ Merry Christmas and Happy New Year 2025! 🎉✨
As we bid farewell to 2024 and welcome the fresh opportunities of 2025, we want to send our warmest wishes to all the amazing TradingView users, Pine Script developers, and loyal followers of TradingFinder.
Your enthusiasm and support have made this community stronger and more inspiring every day. May this holiday season bring you happiness, success, and prosperity both in life and in trading.
We also wish for all of you to make great profits and achieve your financial goals in the new year. Let's make 2025 a year filled with innovation, growth, and great achievements together.
Thank you for being part of this journey! 🎅🌟📈
Argentina Price per m² (USD) — (1999–2025)Overview
This indicator plots the historical USD price per square meter of apartments in CABA (Buenos Aires City), Argentina, combining annual data (1999–2011) from Maure Real Estate Market Reports with monthly data (2012–2025) from UCEMA and private market sources.
All values were manually digitized, cleaned, and consolidated to reconstruct the most complete long-term pricing series publicly available.
The script also includes SMA20, SMA50, and SMA100 over the custom dataset to support long-term trend analysis, cycle detection, and macro technical structure.
Data Sources
1999–2011 (Annual): Maure Real Estate Market Reports
2012–2020 (Monthly): UCEMA Real Estate Index
2020–2025 (Monthly): RE/MAX – UCEMA Market Monitor
How to Use This Indicator
This tool allows investors, developers, and analysts to:
Identify multiyear trend shifts
Compare cycles vs. Argentine macro environments
Map long-term support/resistance zones in real estate
Detect early signs of market recovery or contraction
Combine real estate fundamentals with technical analysis
The SMAs help visualize structural trends normally hidden in real estate data.
About This Work
This series was fully reconstructed and coded by engineer Francisco Michelich (@esFranMiche on X), combining market research, statistical consolidation, and technical analysis.
It is intended as an analytical tool, not an official financial index.
If you find this useful, feel free to follow and connect — feedback and collaboration are welcome.
Linkedin
X

Donchian x WMA Crossover (2025 Only, Adjustable TP, Real OHLC)Short Description:
Long-only breakout system that goes long when the Donchian Low crosses up through a Weighted Moving Average, and closes when it crosses back down (with an optional take-profit), restricted to calendar year 2025. All signals use the instrument’s true OHLC data (even on Heikin-Ashi charts), start with 1 000 AUD of capital, and deploy 100 % equity per trade.
Ideal parameters configured for Temple & Webster on ASX 30 minute candles. Adjust parameter to suit however best to download candle interval data and have GPT test the pine script for optimum parameters for your trading symbol.
Detailed Description
1. Strategy Concept
This strategy captures trend-driven breakouts off the bottom of a Donchian channel. By combining the Donchian Low with a WMA filter, it aims to:
Enter when volatility compresses and price breaks above the recent Donchian Low while the longer‐term WMA confirms upward momentum.
Exit when price falls back below that same WMA (i.e. when the Donchian Low crosses back down through WMA), but only if the WMA itself has stopped rising.
Optional Take-Profit: you can specify a profit target in decimal form (e.g. 0.01 = 1 %).
2. Timeframe & Universe
In-sample period: only bars stamped between Jan 1 2025 00:00 UTC and Dec 31 2025 23:59 UTC are considered.
Any resolution (e.g. 30 m, 1 h, D, etc.) is supported—just set your preferred timeframe in the TradingView UI.
3. True-Price Execution
All indicator calculations (Donchian Low, WMA, crossover checks, take-profit) are sourced from the chart’s underlying OHLC via request.security(). This guarantees that:
You can view Heikin-Ashi or other styled candles, but your strategy will execute on the real OHLC bars.
Chart styling never suppresses or distorts your backtest results.
4. Position Sizing & Equity
Initial capital: 1 000 AUD
Size per trade: 100 % of available equity
No pyramiding: one open position at a time
5. Inputs (all exposed in the “Inputs” tab):
Input Default Description
Donchian Length 7 Number of bars to calculate the Donchian channel low
WMA Length 62 Period of the Weighted Moving Average filter
Take Profit (decimal) 0.01 Exit when price ≥ entry × (1 + take_profit_perc)
6. How It Works
Donchian Low: ta.lowest(low, DonchianLength) over the specified look-back.
WMA: ta.wma(close, WMALength) applied to true closes.
Entry: ta.crossover(DonchianLow, WMA) AND barTime ∈ 2025.
Exit:
Cross-down exit: ta.crossunder(DonchianLow, WMA) and WMA is not rising (i.e. momentum has stalled).
Take-profit exit: price ≥ entry × (1 + take_profit_perc).
Calendar exit: barTime falls outside 2025.
7. Usage Notes
After adding to your chart, open the Strategy Tester tab to review performance metrics, list of trades, equity curve, etc.
You can toggle your chart to Heikin-Ashi for visual clarity without affecting execution, thanks to the real-OHLC calls.

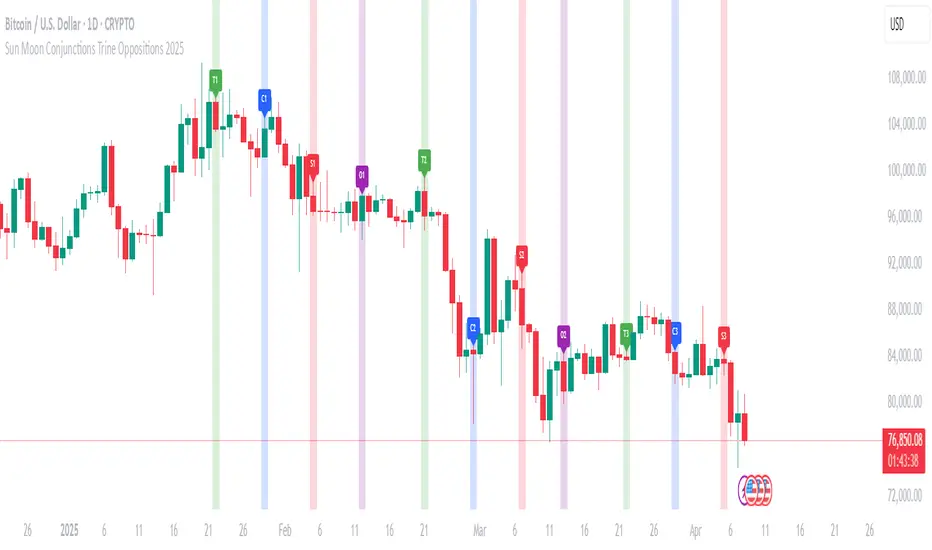
Sun Moon Conjunctions Trine Oppositions 2025this script is an astrological tool designed to overlay significant Sun-Moon aspect events for 2025 on a Bitcoin chart. It highlights key lunar phases and aspects—Conjunctions (New Moon) in blue, Squares in red, Oppositions (Full Moon) in purple, and Trines in green—using background colors and labeled markers. Users can toggle visibility for each aspect type and adjust label sizes via customizable inputs. The script accurately marks events from January through December 2025, with labels appearing once per event, making it a valuable resource for exploring potential correlations between lunar cycles and Bitcoin price movements.
2013-2025 EclipsesIndicator Description: 2013-2025 Eclipses
This Pine Script (version 5) indicator overlays solar and lunar eclipse events on a TradingView chart, covering the period from 2013 to 2025. It is designed for traders and astrology enthusiasts who wish to visualize these significant astronomical events alongside price action, potentially identifying correlations with market movements or key turning points.
Features:
Eclipses:
Visualization: Displayed as a semi-transparent aqua background highlight across the chart.
Data: Includes 48 specific eclipse dates (both solar and lunar) from April 25, 2013, to September 21, 2025.
Purpose: Highlights dates of eclipses, which are often considered powerful astrological events associated with sudden changes, revelations, or significant shifts in energy and market sentiment.
Technical Details:
Overlay: The indicator is set to overlay=true, ensuring it displays directly on the price chart rather than in a separate pane.
Date Matching: Utilizes a helper function is_date(y, m, d) to determine if the current chart date matches any of the predefined eclipse dates, using TradingView's year, month, and dayofmonth variables.
Visualization Method:
bgcolor: Applies a light aqua background (using color.new(color.aqua, 85)) on the specific dates of eclipses. The transparency level of 85 allows price action to remain visible through the highlight.
Time Range: Spans from April 2013 to September 2025, covering a 12+ year period of eclipse events.
Usage:
Add the script to your TradingView chart to see eclipse dates highlighted with an aqua background on your chosen symbol and timeframe.
The background highlight appears only on the exact dates of eclipses, making it easy to spot these events amidst price data.
Ideal for those incorporating astrological analysis into trading or studying the potential impact of eclipses on financial markets.
Notes:
The script uses a single-line definition for eclipse_dates to ensure compatibility with Pine Script v5 syntax and avoid line continuation errors.
The aqua color matches the original circle-based visualization, with transparency adjustable via the color.new(color.aqua, 85) parameter (0 = fully opaque, 100 = fully transparent).
Works best on daily or higher timeframes for clear visibility of individual eclipse dates, though it functions on any TradingView-supported timeframe.
Eclipse dates should be cross-checked with astronomical sources for critical applications, as the script relies on the provided data accuracy.
Purpose:
This indicator provides a straightforward way to track eclipses over a 12-year period, offering a visual representation of these potent celestial events. By using a background highlight instead of markers, it maintains chart clarity while emphasizing the specific days when eclipses occur, potentially aiding in the analysis of their influence on market behavior or personal trading strategies.
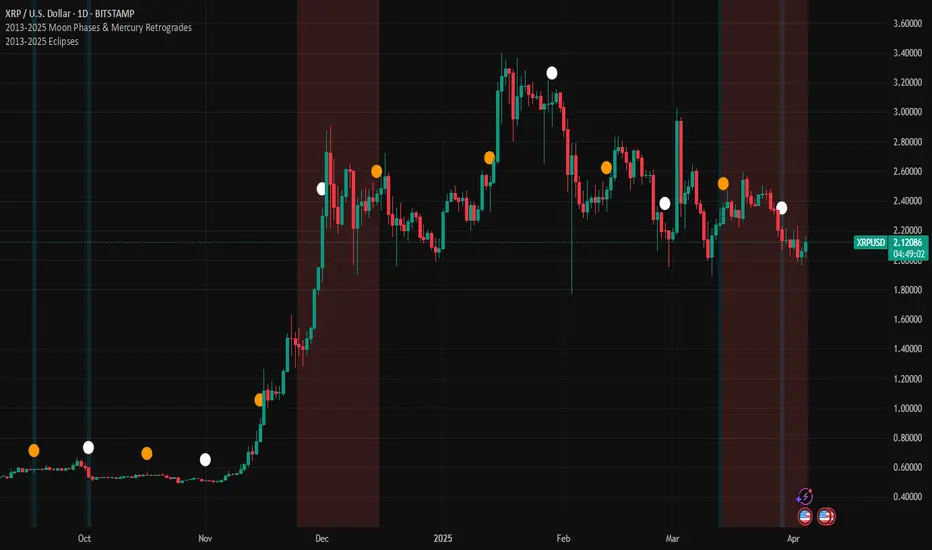
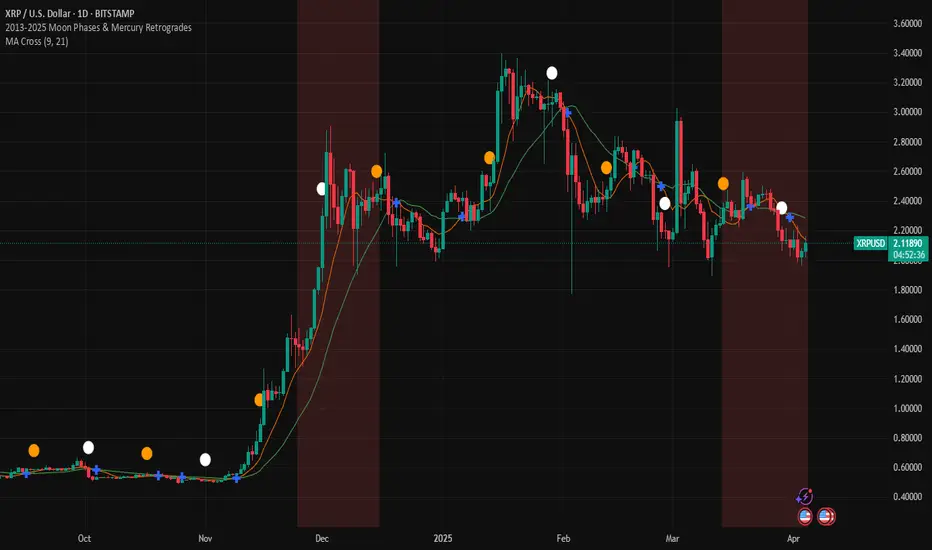
2013-2025 Moon Phases & Mercury RetrogradesIndicator Description: 2013-2025 Moon Phases & Mercury Retrogrades
This Pine Script (version 5) indicator overlays key astrological events on a TradingView chart, specifically tracking full moons, new moons, and Mercury retrograde periods from 2013 to 2025. It is designed to help traders and astrology enthusiasts visualize these celestial events alongside price action, potentially identifying correlations or patterns.
Features:
New Moons:
Visualization: Plotted as small white circles above the price bars.
Data: Includes 156 specific new moon dates from January 11, 2013, to December 20, 2025.
Purpose: Marks the start of the lunar cycle, often associated with new beginnings or shifts in energy.
Full Moons:
Visualization: Plotted as small orange circles above the price bars.
Data: Includes 157 specific full moon dates from January 27, 2013, to December 15, 2025.
Purpose: Highlights the peak of the lunar cycle, often linked to heightened emotions or market volatility in astrological analysis.
Mercury Retrogrades:
Visualization: Displayed as a light red background highlight across the chart.
Data: Covers 39 Mercury retrograde periods, with precise start and end timestamps from February 23, 2013, to November 29, 2025.
Purpose: Indicates periods traditionally associated with communication issues, delays, or reversals, which some traders monitor for potential market impacts.
Technical Details:
Overlay: The indicator is set to overlay=true, meaning it displays directly on the price chart rather than in a separate pane.
Date Matching: Uses a helper function is_date(y, m, d) to check if the current chart date matches any of the predefined event dates, leveraging TradingView's year, month, and dayofmonth variables.
Visualization Methods:
plotshape: Used for new moons (white circles) and full moons (orange circles), positioned above bars for clear visibility.
bgcolor: Used for Mercury retrograde periods, applying a semi-transparent red highlight (transparency level 85) to the background during active retrograde periods.
Time Range: Spans from January 2013 to December 2025, providing a comprehensive 13-year view of these astrological events.
Usage:
Add the script to your TradingView chart to see new moons, full moons, and Mercury retrograde periods overlaid on your chosen symbol and timeframe.
The white and orange circles appear on specific dates, while the red background highlights extend across the duration of each Mercury retrograde period.
Useful for traders incorporating astrology into their analysis or anyone interested in tracking these celestial events alongside financial data.
Notes:
The script assumes accurate date data as provided; users should verify dates against astronomical sources if precision is critical.
The transparency of the Mercury retrograde background can be adjusted by modifying the value in color.new(color.red, 85) (0 = fully opaque, 100 = fully transparent).
Best viewed on daily or higher timeframes for clarity, though it works on any timeframe supported by TradingView.
This indicator provides a visual tool to explore the potential influence of lunar phases and Mercury retrograde periods on market behavior, blending astrology with technical analysis in a clear, customizable format.
[ADDYad] Google Search Trends - Bitcoin (2012 Jan - 2025 Jan)This Pine Script shows the Google Search Trends as an indicator for Bitcoin from January 2012 to January 2025, based on monthly data retrieved from Google Trends. It calculates and displays the relative search interest for Bitcoin over time, offering a historical perspective on its popularity mainly built for BITSTAMP:BTCUSD .
Important note: This is not a live indicator. It visualizes historical search trends based on Google Trends data.
Key Features:
Data Source : Google Trends (Last retrieved in January 10 2025).
Timeframe : The script is designed to be used on a monthly chart, with the data reflecting monthly search trends from January 2012 to January 2025. For other timeframes, the data is linearly interpolated to estimate the trends at finer resolutions.
Purpose : This indicator helps visualize Bitcoin's search interest over the years, offering insights into public interest and sentiment during specific periods (e.g., major price movements or news events).
Data Handling : The data is interpolated for use on non-monthly timeframes, allowing you to view search trends on any chart timeframe. This makes it versatile for use in longer-term analysis or shorter timeframes, despite the raw data being available only on a monthly basis. However, it is most relevant for Monthly, Weekly, and Daily timeframes.
How It Works:
The script calculates the number of months elapsed since January 1, 2012, and uses this to interpolate Google Trends data values for any given point in time on the chart.
The linear interpolation function adjusts the monthly data to provide an approximate trend for intermediate months.
Why It's Useful:
Track Bitcoin's historic search trends to understand how interest in Bitcoin evolved over time, potentially correlating with price movements.
Correlate search trends with price action and other market indicators to analyze the effects of public sentiment and sentiment-driven market momentum.
Final Notes:
This script is unique because it shows real-world, non-financial dataset (Google Trends) to understand price action of Bitcoin correlating with public interest. Hopefully is a valuable addition to the TradingView community.
ADDYad

SPX Year-End 2025 Targets by AnalystsJust year end analyst targets for SPX as of 02 October 2025, as answered by Grok

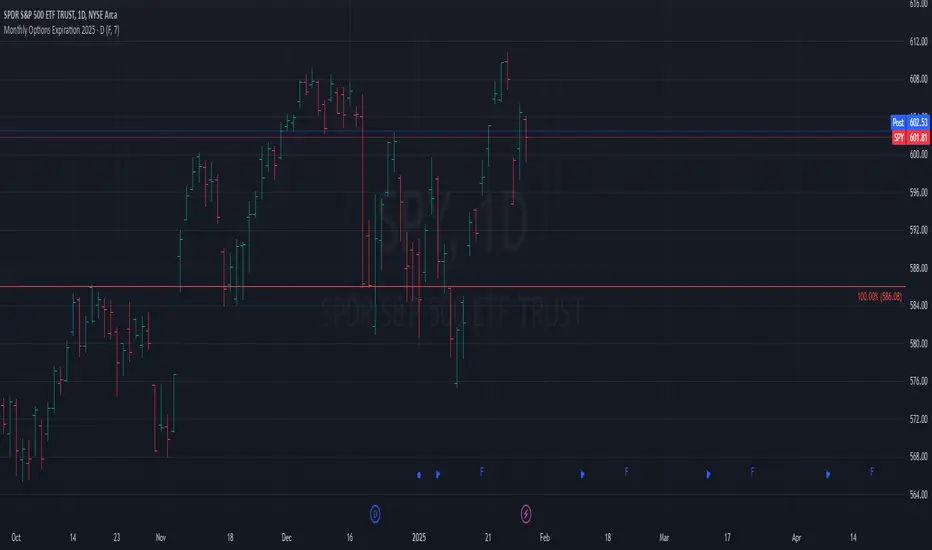
Monthly Options Expiration 2025Monthly Options Expiration 2025
Plots the monthly options expiration dates in advance for the year 2025.
Happy trading and all the best.
WorldCup Dashboard + Institutional Sessions© 2025 NewMeta™ — Educational use only.
# Full, Premium Description
## WorldCup Dashboard + Institutional Sessions
**A trade-ready, intraday framework that combines market structure, real flow, and institutional timing.**
This toolkit fuses **Institutional Sessions** with a **price–volume decision engine** so you can see *who is active*, *where value sits*, and *whether the drive is real*. You get: **CVD/Delta**, volume-weighted **Momentum**, **Aggression** spikes, **FVG (MTF)** with nearest side, **Daily Volume Profile (VAH/POC/VAL)**, **ATR regime**, a **24h position gauge**, classic **candle patterns**, IBH/IBL + **first-hour “true close”** lines, and a **10-vote confluence scoreboard**—all in one view.
---
## What’s inside (and how to trade it)
### 🌍 Institutional Sessions (Sydney • Tokyo • London • New York)
* Session boxes + a highlighted **first hour**.
* Plots the **true close** (first-hour close) as a running line with a label.
**Use:** Many desks anchor risk to this print. Above = bullish bias; below = bearish. **IBH/IBL** breaks during London/NY carry the most signal.
### 📊 CVD / Delta (Flow)
* Net buyer vs seller pressure with smooth trend state.
**Use:** **Rising CVD + acceptance above mid/POC** confirms continuation. Bearish price + rising CVD = caution (possible absorption).
### ⚡ Volume-Weighted Momentum
* Momentum adjusted by participation quality (volume).
**Use:** Momentum>MA and >0 → trend drive is “real”; <0 and falling → distribution risk.
### 🔥 Aggression Detector
* ROC × normalized volume × wick factor to flag **forceful** candles.
**Use:** On spikes, avoid fading blindly—wait for pullbacks into **aligned FVG** or for aggression to cool.
### 🟦🟪 Fair Value Gaps (with MTF)
* Detects up to 3 recent FVGs and marks the **nearest** side to price.
**Use:** Trend pullbacks into **bullish FVG** for longs; bounces into **bearish FVG** for shorts. Optional threshold to filter weak gaps.
### 🧭 24h Gauge (positioning)
* Shows current price across the 24h low⇢high with a mid reference.
**Use:** Above mid and pushing upper third = momentum continuation setups; below mid = sell the rips bias.
### 🧱 Daily Volume Profile (manual per day)
* **VAH / POC / VAL** derived from discretized rows.
**Use:** **POC below** supports longs; **POC above** caps rallies. Fade VAH/VAL in ranges; treat them as break/hold levels in trends.
### 📈 ATR Regime
* **ATR vs ATR-avg** with direction and regime flag (**HIGH / NORMAL / LOW**).
**Use:** HIGH ⇒ give trades room & favor trend following. LOW ⇒ fade edges, scale targets.
### 🕯️ Candle Patterns (contextual, not standalone)
* Engulfings, Morning/Evening Star, 3 Soldiers/Crows, Harami, Hammer/Shooting Star, Double Top/Bottom.
**Use:** Only with session + flow + momentum alignment.
### 🤝 Price–Volume Classification
* Labels each bar as **continuation**, **exhaustion**, **distribution**, or **healthy pullback**.
**Use:** Align continuation reads with trend; treat “Price↑ + Vol↓” as a caution flag.
### 🧪 Confluence Scoreboard & B/S Meter
* Ten elements vote: 🔵 bull, ⚪ neutral, 🟣 bear.
**Use:** Execution filter—take setups when the board’s skew matches your trade direction.
---
## Playbooks (actionable)
**Trend Pullback (Long)**
1. London/NY active, Momentum↑, CVD↑, price above 24h mid & POC.
2. Pullback into **nearest bullish FVG**.
3. Invalidate under FVG low or **true-close** line.
4. Targets: IBH → VAH → 24h high.
**Range Fade (Short)**
1. Asia/quiet regime, **Price↑ + Vol↓** into **VAH**, ATR low.
2. Nearest FVG bearish or scoreboard skew bearish.
3. Invalidate above VAH/IBH.
4. Targets: POC → VAL.
**News/Impulse**
Aggression spike? Don’t chase. Let it pull back into the aligned FVG; require CVD/Momentum agreement before entry.
---
## Alerts (included)
* **Bull/Bear Confluence ≥ 7/10**
* **Intraday Target Achieved** / **Daily Target Achieved**
* **Session True-Close Retests** (Sydney/Tokyo/London/NY)
*(Keep alerts “Once per bar” unless you specifically want intrabar triggers.)*
---
## Setup Tips
* **UTC**: Choose the reference that matches how you track sessions (default UTC+2).
* **Volume threshold**: 2.0× is a strong baseline; raise for noisy alts, lower for majors.
* **CVD smoothing**: 14–24 for scalps; 24–34 for slower markets.
* **ATR lengths**: Keep defaults unless your asset has a persistent regime shift.
---
## Why this framework?
Because **timing (sessions)**, **truth (flow)**, and **location (value/FVG)** together beat any single signal. You get *who is trading*, *how strong the push is*, and *where risk lives*—on one screen—so execution is faster and cleaner.
---
**Disclaimer**: Educational use only. Not financial advice. Markets are risky—backtest and size responsibly.

Currency Weekend - shading weekend trading// ─────────────────────────────────────────────────────────────────────────────
// © 2025, Steve / Steven Anthony – "Currency Weekend"
// This script highlights the low-liquidity weekend window that often affects
// both fiat currency markets and cryptocurrencies like Bitcoin.
//
// ╭─────────────────────────────── DESCRIPTION ───────────────────────────────╮
// | This indicator shades a customizable time window on your chart, |
// | originally set to highlight the **forex weekend lull** from |
// | **Friday 21:00 UTC to Sunday 21:00 UTC**, when traditional fiat |
// | currency markets close. |
// | |
// | Traders who observe Bitcoin, Ethereum, or other crypto assets may |
// | notice reduced liquidity or increased erratic moves during this time, |
// | due to overlapping behaviors from professional forex traders who |
// | trade both markets. |
// ╰──────────────────────────────────────────────────────────────────────────╯
//
// 🔧 Flexible Configuration:
// - Define your own start and end **day + time** for shading
// - Useful for shading other custom quiet periods or session transitions
//
// 💡 Use Cases:
// - Avoid trading during low-liquidity periods
// - Spot potential weekend traps or price gaps
// - Align crypto behavior with fiat market hours
//
// 📍 Default Settings:
// - Start: Friday 21:00 UTC
// - End: Sunday 21:00 UTC
//
// Timezone is normalized to the chart’s timezone for seamless integration.
//
// ─────────────────────────────────────────────────────────────────────────────

ITM 2x15// © 2025 Intraday Trading Machine
// This script is open-source. You may use and modify it, but please give credit.
// Colors the current 15-minute candle body green or red if the two previous candles were both bullish or bearish.
This script is designed for traders using the Scalping Intraday Trading Machine technique. It highlights when two consecutive 15-minute candles close in the same direction — either both bullish or both bearish.
For example, if you see two consecutive bearish candles, you might look for a long entry on a break above the high of the first bearish candle. This tool helps you visually identify these setups with clean, directional candle coloring — no clutter.
Advanced VWAP CalendarThe Advanced VWAP Calendar is a designed to plot Volume Weighted Average Price (VWAP) lines anchored to user-defined and preset time periods, including weekly, monthly, quarterly, and custom anchors. As of August 15, 2025, this indicator provides traders with a robust tool for analyzing price trends relative to volume-weighted averages, with clear labeling and extensive customization options. Below is a summary of its key features and functionality, with technical details and code references updated to focus on user-facing behavior and presentation, while preserving all other aspects of the original summary.
Key Features
Multiple Time Period VWAPs:
Weekly VWAPs: Supports up to five VWAPs for a user-selected month and year, starting at midnight each Monday (e.g., W1 Aug 2025, W2 Aug 2025). Enabled via a single toggle, with anchors automatically set to the first Monday of the chosen month.
Monthly VWAPs: Plots VWAPs for all 12 months of a selected year (e.g., Jan 2025, Feb 2025) or a single user-specified month/year. Labels use month abbreviations (e.g., "Aug 2025").
Quarterly VWAPs: Covers four quarters of a selected year (e.g., Q1 2025, Q2 2025), with options to enable all quarters or individual ones (Q1–Q4).
Legacy VWAPs: Provides monthly and quarterly VWAPs for a user-selected legacy year (e.g., 2024), labeled with a "Legacy" prefix (e.g., "Legacy Jan 2024," "Legacy Q1 2024"), with similar enablement options.
Custom VWAPs: Includes 10 fully customizable VWAPs, each with user-defined anchor times, labels (e.g., "Q1 2025"), colors, line widths (1–5), text colors, bubble styles, text sizes (8–40), and background options.
Clear and Dynamic Labeling:
Labels appear to the right of the chart, showing the VWAP value (e.g., "Q1 2025 123.45").
Weekly labels follow a "W# Month Year" format (e.g., "W1 Aug 2025").
Monthly labels use abbreviated months (e.g., "Aug 2025"), while quarterly labels use "Q# Year" (e.g., "Q3 2025").
Legacy labels include a "Legacy" prefix (e.g., "Legacy Q1 2024").
Labels support customizable text sizes (tiny to huge) and can be displayed with or without a background, with optional bubble styles.
Flexible Customization:
Each VWAP can be enabled or disabled independently, with user inputs for anchor times, labels, and visual properties.
Colors are predefined for weekly (red, orange, blue, green, purple), monthly (varied), quarterly (red, blue, green, yellow), and legacy VWAPs, but custom VWAPs allow any color selection.
Line widths and text sizes are adjustable, ensuring visual clarity and chart readability.
This indicator was a dual effort, code was heavily contributed in effort by AzDxB, major credit and THANKS goes to him www.tradingview.com
Golden Cross 50/200 EMATrend-following systems are characterized by having a low win rate, yet in the right circumstances (trending markets and higher timeframes) they can deliver returns that even surpass those of systems with a high win rate.
Below, I show you a simple bullish trend-following system with clear execution rules:
System Rules
-Long entries when the 50-period EMA crosses above the 200-period EMA.
-Stop Loss (SL) placed at the lowest low of the 15 candles prior to the entry candle.
-Take Profit (TP) triggered when the 50-period EMA crosses below the 200-period EMA.
Risk Management
-Initial capital: $10,000
-Position size: 10% of capital per trade
-Commissions: 0.1% per trade
Important Note:
In the code, the stop loss is defined using the swing low (15 candles), but the position size is not adjusted based on the distance to the stop loss. In other words, 10% of the equity is risked on each trade, but the actual loss on the trade is not controlled by a maximum fixed percentage of the account — it depends entirely on the stop loss level. This means the loss on a single trade could be significantly higher or lower than 10% of the account equity, depending on volatility.
Implementing leverage or reducing position size based on volatility is something I haven’t been able to include in the code, but it would dramatically improve the system’s performance. It would fix a consistent percentage loss per trade, preventing losses from fluctuating wildly with changes in volatility.
For example, we can maintain a fixed loss percentage when volatility is low by using the following formula:
Leverage = % of SL you’re willing to risk / % volatility from entry point to stop loss
And when volatility is high and would exceed the fixed percentage we want to expose per trade (if the SL is hit), we could reduce the position size accordingly.
Practical example:
Imagine we only want to risk 15% of the position value if the stop loss is triggered on Tesla (which has high volatility), but the distance to the SL represents a potential 23.57% drop. In this case, we subtract the desired risk (15%) from the actual volatility-based loss (23.57%):
23.57% − 15% = 8.57%
Now suppose we normally use $200 per trade.
To calculate 8.57% of $200:
200 × (8.57 / 100) = $17.14
Then subtract that amount from the original position size:
$200 − $17.14 = $182.86
In summary:
If we reduce the position size to $182.86 (instead of the usual $200), even if Tesla moves 23.57% against us and hits the stop loss, we would still only lose approximately 15% of the original $200 position — exactly the risk level we defined. This way, we strictly respect our risk management rules regardless of volatility swings.
I hope this clearly explains the importance of capping losses at a fixed percentage per trade. This keeps risk under control while maintaining a consistent percentage of capital invested per trade — preventing both statistical distortion of the system and the potential destruction of the account.
About the code:
Strategy declaration:
The strategy is named 'Golden Cross 50/200 EMA'.
overlay=true means it will be drawn directly on the price chart.
initial_capital=10000 sets the initial capital to $10,000.
default_qty_type=strategy.percent_of_equity and default_qty_value=10 means each trade uses 10% of available equity.
margin_long=0 indicates no margin is used for long positions (this is likely for simulation purposes only; in real trading, margin would be required).
commission_type=strategy.commission.percent and commission_value=0.1 sets a 0.1% commission per trade.
Indicators:
Calculates two EMAs: a 50-period EMA (ema50) and a 200-period EMA (ema200).
Crossover detection:
bullCross is triggered when the 50-period EMA crosses above the 200-period EMA (Golden Cross).
bearCross is triggered when the 50-period EMA crosses below the 200-period EMA (Death Cross).
Recent swing:
swingLow calculates the lowest low of the previous 15 periods.
Stop Loss:
entryStopLoss is a variable initialized as na (not available) and is updated to the current swingLow value whenever a bullCross occurs.
Entry and exit conditions:
Entry: When a bullCross occurs, the initial stop loss is set to the current swingLow and a long position is opened.
Exit on opposite signal: When a bearCross occurs, the long position is closed.
Exit on stop loss: If the price falls below entryStopLoss while a position is open, the position is closed.
Visualization:
Both EMAs are plotted (50-period in blue, 200-period in red).
Green triangles are plotted below the bar on a bullCross, and red triangles above the bar on a bearCross.
A horizontal orange line is drawn that shows the stop loss level whenever a position is open.
Alerts:
Alerts are created for:Long entry
Exit on bearish crossover (Death Cross)
Exit triggered by stop loss
Favorable Conditions:
Tesla (45-minute timeframe)
June 29, 2010 – November 17, 2025
Total net profit: $12,458.73 or +124.59%
Maximum drawdown: $1,210.40 or 8.29%
Total trades: 107
Winning trades: 27.10% (29/107)
Profit factor: 3.141
Tesla (1-hour timeframe)
June 29, 2010 – November 17, 2025
Total net profit: $7,681.83 or +76.82%
Maximum drawdown: $993.36 or 7.30%
Total trades: 75
Winning trades: 29.33% (22/75)
Profit factor: 3.157
Netflix (45-minute timeframe)
May 23, 2002 – November 17, 2025
Total net profit: $11,380.73 or +113.81%
Maximum drawdown: $699.45 or 5.98%
Total trades: 134
Winning trades: 36.57% (49/134)
Profit factor: 2.885
Netflix (1-hour timeframe)
May 23, 2002 – November 17, 2025
Total net profit: $11,689.05 or +116.89%
Maximum drawdown: $844.55 or 7.24%
Total trades: 107
Winning trades: 37.38% (40/107)
Profit factor: 2.915
Netflix (2-hour timeframe)
May 23, 2002 – November 17, 2025
Total net profit: $12,807.71 or +128.10%
Maximum drawdown: $866.52 or 6.03%
Total trades: 56
Winning trades: 41.07% (23/56)
Profit factor: 3.891
Meta (45-minute timeframe)
May 18, 2012 – November 17, 2025
Total net profit: $2,370.02 or +23.70%
Maximum drawdown: $365.27 or 3.50%
Total trades: 83
Winning trades: 31.33% (26/83)
Profit factor: 2.419
Apple (45-minute timeframe)
January 3, 2000 – November 17, 2025
Total net profit: $8,232.55 or +80.59%
Maximum drawdown: $581.11 or 3.16%
Total trades: 140
Winning trades: 34.29% (48/140)
Profit factor: 3.009
Apple (1-hour timeframe)
January 3, 2000 – November 17, 2025
Total net profit: $9,685.89 or +94.93%
Maximum drawdown: $374.69 or 2.26%
Total trades: 118
Winning trades: 35.59% (42/118)
Profit factor: 3.463
Apple (2-hour timeframe)
January 3, 2000 – November 17, 2025
Total net profit: $8,001.28 or +77.99%
Maximum drawdown: $755.84 or 7.56%
Total trades: 67
Winning trades: 41.79% (28/67)
Profit factor: 3.825
NVDA (15-minute timeframe)
January 3, 2000 – November 17, 2025
Total net profit: $11,828.56 or +118.29%
Maximum drawdown: $1,275.43 or 8.06%
Total trades: 466
Winning trades: 28.11% (131/466)
Profit factor: 2.033
NVDA (30-minute timeframe)
January 3, 2000 – November 17, 2025
Total net profit: $12,203.21 or +122.03%
Maximum drawdown: $1,661.86 or 10.35%
Total trades: 245
Winning trades: 28.98% (71/245)
Profit factor: 2.291
NVDA (45-minute timeframe)
January 3, 2000 – November 17, 2025
Total net profit: $16,793.48 or +167.93%
Maximum drawdown: $1,458.81 or 8.40%
Total trades: 172
Winning trades: 33.14% (57/172)
Profit factor: 2.927

AInfluence Manual Data Input Utility Indicator V101AInfluence (Manual Data Input Utility Indicator) V101
Overview
This utility indicator enables you to plot an external data series directly on your TradingView chart. It is designed for users who want to correlate custom datasets, such as sentiment analysis, economic data, or other external metrics, with price action.
Instructions
1. Add the indicator to your chart.
2. Go into the indicator's "Settings" panel.
3. Paste your pre-formatted data into the text input field.
Data Formatting Rules
The script requires a specific format for each data point, which consists of a numerical value and a timestamp
• Structure: Each data point must be on a new line.
• Limit: You can paste a maximum of 146 records.
Example Data:
93.1562,2025-09-06 00:59:11
94.9062,2025-09-06 01:59:21
93.4062,2025-09-06 02:59:18
95.2188,2025-09-06 03:59:31
93.4062,2025-09-06 04:59:21
91.4583,2025-09-06 05:58:51
93.7812,2025-09-06 06:59:17
The source code for this indicator is open and accessible.

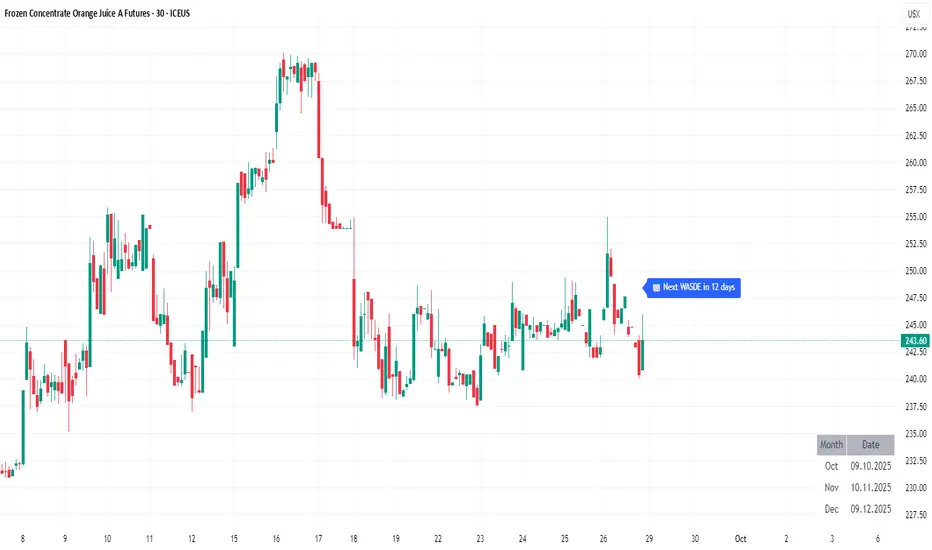
WASDE Dates V2WASDE Dates V2 – USDA Release Calendar with Alerts, Countdown & Event Markers
By cot-trader.com
WASDE Dates V2 is a complete and reliable visualization tool for all scheduled WASDE (World Agricultural Supply and Demand Estimates) releases for 2025 and 2026.
The USDA’s WASDE report is one of the most market-moving fundamental catalysts in agricultural futures—affecting Corn (ZC), Wheat (ZW), Soybeans (ZS), Soymeal (ZM), Soybean Oil (ZL), and many related CFD products.
This script gives traders a precise timing layer directly inside their TradingView charts.
🔍 What this script does
WASDE Dates V2 automatically:
Marks each WASDE release day with a vertical line and label.
Shows an automated countdown to the next WASDE release:
In days (>24h)
In hours & minutes (<24h)
Displays an optional table of upcoming WASDE dates for quick reference.
Provides two alert conditions:
WASDE Day Alert – triggers exactly on the event
WASDE 24h Reminder – pre-alert when less than 24 hours remain
Handles both 2025 and 2026 confirmed dates.
Works on any symbol and timeframe.
📌 Why WASDE matters
The WASDE report updates global supply and demand estimates for:
Corn
Soybeans
Wheat
Other major agricultural commodities
Changes in yield, acres, production, imports/exports, and ending stocks can cause immediate and significant volatility.
Many traders combine WASDE awareness with seasonality, COT positioning, volatility filters, or fundamental models.
This script ensures you never miss the timing of these key releases.
⚙️ How the script works
The script stores official USDA WASDE release dates for 2025 and 2026 in two dedicated arrays.
On every bar, it compares the bar’s timestamp with known WASDE timestamps to detect an event day.
When an event occurs:
A red “WASDE” label is plotted above the candle
A dotted vertical line is drawn through the bar
It finds the next upcoming WASDE by scanning forward through both arrays.
A live-updating countdown label is displayed, showing days or hours/minutes until release.
If the event is less than 24 hours away:
A yellow “WASDE soon” warning appears near price
The 24h alert condition becomes active
An optional table lists upcoming events for 2025 & 2026.
This script does not generate trading signals.
It provides a time-based event layer designed to complement any discretionary or algorithmic trading approach.
🧭 How to use
Add the script to your chart.
Enable alerts for:
“WASDE Day Alert”
“WASDE 24h Reminder”
Follow the countdown to prepare for upcoming volatility.
Use together with other agricultural tools such as:
Seasonality indicators
COT (Commitment of Traders) analysis
Trend / VWAP / Volume signals
Pre- and post-WASDE trading strategies
Works on all chart types, all symbols, and all timeframes.
📅 Included WASDE Dates (Confirmed)
2025:
Jan 12, Feb 11, Mar 11, Apr 10, May 12, Jun 12, Jul 11, Aug 12, Sep 12, Oct 9, Nov 10, Dec 9
2026:
Jan 12, Feb 10, Mar 10, Apr 9, May 12, Jun 11, Jul 10, Aug 12, Sep 11, Oct 9, Nov 10, Dec 10
(All dates based on USDA’s official 12:00pm ET schedule.)
💡 What makes this script original
Fully updated 2025 + 2026 calendar
Uses a robust time-comparison method for accurate marking
Unique dual alert system (event + 24h pre-alert)
Clean, readable layout with countdown + upcoming dates table
Tailored specifically for grain & agricultural traders
Built entirely in Pine Script v6 with careful attention to performance

Weekly VwapsThe Weekly Vwaps indicator lets you plot weekly Volume-Weighted Average Price (VWAP) lines for up to six months of your choosing, with years ranging from 2020 to 2050. It’s a focused tool pulled straight from the weekly VWAP section of the Advanced VWAP Calendar indicator, keeping all the same controls and look but expanded to handle more months. You can use it alongside the original indicator if you need extra weekly VWAPs (up to 30 lines total) or run it on its own for a clean, dedicated setup.
How It Works: Six Month Groups: Pick any six months (e.g., Jan 2020, Sep 2025, or Jul 2040) and enable up to five weekly VWAPs per month (W1–W5), starting from Monday midnight.
Default Setup: Loads with September 2025 VWAPs turned on, with other months (August–April 2025) off but ready to enable. All default to 2025.
Customization: Toggle all weeks in a month or pick specific ones. Adjust label sizes (tiny to huge) and line widths (1–5). Colors are teal, fuchsia, red, green, and yellow/orange for weeks 1–5, with clear labels like “W1 Sep 2025 123.45”.
Label Control: A “Show All Labels” switch lets you hide labels to keep your chart tidy.
Intraday Only: Works on intraday timeframes (e.g., 5-minute, 1-hour) for accurate VWAPs.
Why Use It: Add to Advanced VWAP Calendar: If the original’s two-month limit isn’t enough, this adds six more months of weekly VWAPs for deeper analysis.
Standalone Option: Perfect if you only want weekly VWAPs without other features, with flexibility to pick any months and years.
User-Friendly: Ready to go with September 2025 enabled, easy to tweak for past or future data.
Get Started: Add it to your TradingView chart, and September 2025 VWAPs will show up instantly. Adjust months, years, or toggles in the settings to focus on what you need. Test it on intraday charts and use the label toggle to manage clutter. Great for traders wanting precise, customizable weekly VWAPs!
Boilerplate Configurable Strategy [Yosiet]This is a Boilerplate Code!
Hello! First of all, let me introduce myself a little bit. I don't come from the world of finance, but from the world of information and communication technologies (ICT) where we specialize in data processing with the aim of automating it and eliminating all human factors and actors in the processes. You could say that I am an algotrader.
That said, in my journey through trading in recent years I have understood that this world is often shown to be incomplete. All those who want to learn about trading only end up learning a small part of what it really entails, they only seek to learn how to read candlesticks. Therefore, I want to share with the entire community a fraction of what I have really understood it to be.
As a computer scientist, the most important thing is the data, it is the raw material of our work and without data you simply cannot do anything. Entropy is simple: Data in -> Data is transformed -> Data out.
The quality of the outgoing data will directly depend on the incoming data, there is no greater mystery or magic in the process. In trading it is no different, because at the end of the day it is nothing more than data. As we often say, if garbage comes in, garbage comes out.
Most people focus on the results only, on the outgoing data, because in the end we all want the same thing, to make easy money. Very few pay attention to the input data, much less to the process.
Now, I am not here to delude you, because there is no bigger lie than easy money, but I am here to give you a boilerplate code that will help you create strategies where you only have to concentrate on the quality of the incoming data.
To the Point
The code is a strategy boilerplate that applies the technique that you decide to customize for the criteria for opening a position. It already has the other factors involved in trading programmed and automated.
1. The Entry
This section of the boilerplate is the one that each individual must customize according to their needs and knowledge. The code is offered with two simple, well-known strategies to exemplify how the code can be reused for your own benefits.
For the purposes of this post on tradingview, I am going to use the simplest of the known strategies in trading for entries: SMA Crossing
// SMA Cross Settings
maFast = ta.sma(close, length)
maSlow = ta.sma(open, length)
The Strategy Properties for all cases published here:
For Stock TSLA H1 From 01/01/2025 To 02/15/2025
For Crypto XMR-USDT 30m From 01/01/2025 To 02/15/2025
For Forex EUR-USD 5m From 01/01/2025 To 02/15/2025
But the goal of this post is not to sell you a dream, else to show you that the same Entry decision works very well for some and does not for others and with this boilerplate code you only have to think of entries, not exits.
2. Schedules, Days, Sessions
As you know, there are an infinite number of markets that are susceptible to the sessions of each country and the news that they announce during those sessions, so the code already offers parameters so that you can condition the days and hours of operation, filter the best time parameters for a specific market and time frame.
3. Data Filtering
The data offered in trading are numerical series presented in vectors on a time axis where an endless number of mathematical equations can be applied to process them, with matrix calculation and non-linear regressions being the best, in my humble opinion.
4. Read Fundamental Macroeconomic Events, News
The boilerplate has integration with the tradingview SDK to detect when news will occur and offers parameters so that you can enable an exclusion time margin to not operate anything during that time window.
5. Direction and Sense
In my experience I have found the peculiarity that the same algorithm works very well for a market in a time frame, but for the same market in another time frame it is only a waste of time and money. So now you can easily decide if you only want to open LONG, SHORT or both side positions and know how effective your strategy really is.
6. Reading the money, THE PURPOSE OF EVERYTHING
The most important section in trading and the reason why many clients usually hire me as a financial programmer, is reading and controlling the money, because in the end everyone wants to win and no one wants to lose. Now they can easily parameterize how the money should flow and this is the genius of this boilerplate, because it is what will really decide if an algorithm (Indicator: A bunch of math equations) for entries will really leave you good money over time.
7. Managing the Risk, The Ego Destroyer
Many trades, little money. Most traders focus on making money and none of them know about statistics and the few who do know something about it, only focus on the winrate. Well, with this code you can unlock what really matters, the true success criteria to be able to live off of trading: Profit Factor, Sortino Ratio, Sharpe Ratio and most importantly, will you really make money?
8. Managing Emotions
Finally, the main reason why many lose money is because they are very bad at managing their emotions, because with this they will no longer need to do so because the boilerplate has already programmed criteria to chase the price in a position, cut losses and maximize profits.
In short, this is a boilerplate code that already has the data processing and data output ready, you only have to worry about the data input.
“And so the trader learned: the greatest edge was not in predicting the storm, but in building a boat that could not sink.”
DISCLAIMER
This post is intended for programmers and quantitative traders who already have a certain level of knowledge and experience. It is not intended to be financial advice or to sell you any money-making script, if you use it, you do so at your own risk.

Trend Gazer v666: Unified ICT Trading System# Trend Gazer v666: Unified ICT Trading System
※日本語説明もあります。 Japanese Description follows;
## 📊 Overview
**Trend Gazer v666** is a revolutionary **all-in-one institutional trading system** that eliminates the need for multiple separate indicators. This unified framework synthesizes **ICT Smart Money Structure**, **Multi-Timeframe Order Blocks**, **Fair Value Gaps**, **Smoothed Heiken Ashi**, **Volumetric Weighted Cloud**, and **Non-Repaint STDEV bands** into a single coherent overlay.
Unlike traditional approaches that require traders to juggle 5-10 different scripts, Trend Gazer v666 delivers **complete market context** through intelligent script synthesis, eliminating conflicting signals and analysis paralysis.
---
## 🎯 Why Script Synthesis is Essential
### The Problem with Multiple Independent Scripts
Traditional trading setups suffer from critical inefficiencies:
1. **Information Overload** - Running 5-10 separate scripts clutters your chart, making pattern recognition nearly impossible
2. **Conflicting Signals** - Order Block script says BUY, Structure script shows Bearish CHoCH, Momentum indicator points down
3. **Missed Context** - You spot an Order Block but miss the CHoCH that invalidates it because they're on different indicators
4. **Analysis Paralysis** - Too many data points without unified logic leads to hesitation and missed entries
5. **Performance Degradation** - Multiple `request.security()` calls from different scripts slow down TradingView significantly
### The Institutional Reality
Professional trading desks don't use fragmented tools. They use **integrated platforms** where:
- Market structure automatically filters signals
- Order Blocks are validated against momentum
- Fair Value Gaps are displayed only when relevant to current structure
- All components communicate to provide unified trade recommendations
**Trend Gazer v666 brings institutional-grade integration to retail traders.**
---
## 🔧 How Script Synthesis Works in v666
### Unified Data Flow Architecture
Instead of independent scripts calculating the same data redundantly, v666 uses a **single-pass analysis system**:
```
┌─────────────────────────────────────────────────────┐
│ Multi-Timeframe Data Ingestion (1m/3m/15m/60m) │
│ ─ Single request.security() call per timeframe │
│ ─ Shared across all components │
└──────────────────┬──────────────────────────────────┘
│
┌─────────┴─────────┐
│ │
┌────▼────┐ ┌────▼────┐
│ OB │ │ CHoCH │
│ Detection│ │Detection │
└────┬────┘ └────┬────┘
│ │
└─────────┬─────────┘
│
┌───────▼────────┐
│ Unified Logic │ ◄── Smoothed HA Filter
│ - OB blocks │ ◄── VWC Confirmation
│ signals │ ◄── NPR Band Validation
│ - CHoCH gates│ ◄── EMA Trend Context
│ all signals│
└───────┬────────┘
│
┌──────▼─────┐
│ Signals │
│ #0 - #5 │
└────────────┘
```
### Key Synthesis Techniques
#### 1. **Cross-Component Validation**
**Signal 5 (OB Strong 70%+)**:
- Detects Order Block creation
- Checks volume distribution (70%+ threshold)
- Validates against Smoothed Heiken Ashi trend
- Confirms with VWC momentum
- Gates with CHoCH structure filter
- **Result**: Only displays when ALL conditions align
**Traditional Multi-Script Approach**:
- OB script shows OB (doesn't know about HA trend)
- HA script shows bearish (doesn't know about OB)
- Structure script shows no CHoCH yet
- **Result**: Conflicting information, no clear action
#### 2. **Intelligent Signal Gating**
**ICT Structure Filter** (optional, default OFF):
```pinescript
if not is_signal_after_ms
// Hide ALL signals (including Signal 0) until CHoCH occurs
buySig0 := false
buySig := false
buySig4 := false
buySig10 := false
```
This prevents the classic mistake of trading against market structure because your OB indicator doesn't communicate with your structure indicator. **All signals (S0-S5) are subject to this filter when enabled.**
#### 3. **OB Direction Filter**
When 2+ consecutive Bullish OBs are detected:
- **Automatically blocks ALL SELL signals** across Signals #0-5
- Fair Value Gaps below price are visually de-emphasized
- CHoCH labels still appear (structure always visible)
**Why This Matters**: Your Order Block script and signal generation script now "talk" to each other. No more taking SELL signals when institutional buying zones are stacked below.
#### 4. **Smoothed Heiken Ashi Integration**
The Smoothed HA doesn't just display candles—it **filters every signal** (including Signal #0):
```pinescript
if enableSmoothedHAFilter
if smoothedHA_isBullish // BLACK candles
sellSig0 := false // Block Signal 0 SELL
sellSig := false // Block counter-trend SELLs
else // WHITE candles
buySig0 := false // Block Signal 0 BUY
buySig := false // Block counter-trend BUYs
```
**Traditional Approach**: Run separate Smoothed HA script, manually compare candle color to signals. Easy to miss.
#### 5. **Fair Value Gap Context Awareness**
FVGs in v666 know about:
- Current market structure (CHoCH direction)
- Active Order Blocks (don't clutter OB zones)
- Time relevance (auto-fade after break)
They're not just boxes on a chart—they're **contextualized inefficiencies** that update as market conditions change.
#### 6. **Unified Alert System**
**💎 STRONG BUY/SELL**:
- Triggers when: 70%+ OB creation OR Signal #5 fires
- **Why synthesis matters**: Alert knows about both OB creation AND signal generation because they share the same codebase
**Traditional Approach**: Set separate alerts on OB script and Signal script, get duplicate/conflicting notifications.
---
## 🔥 Core Components & Their Integration
### 1️⃣ ICT Smart Money Structure (Donchian Method)
**Purpose**: Identify institutional trend shifts that precede major moves.
**Components**:
- **1.CHoCH** (Bullish) - Lower low broken, bullish structure shift
- **A.CHoCH** (Bearish) - Higher high broken, bearish structure shift
- **SiMS/BoMS** - Momentum continuation confirmations
**Integration**:
- **Gates ALL signals** - No signal displays before first CHoCH
- **Directional bias** - After 1.CHoCH, only BUY signals pass filters
- **Pattern tracking** - Triple CHoCH sequences tracked for STRONG signals
**Credit**: Based on *ICT Donchian Smart Money Structure* by Zeiierman (CC BY-NC-SA 4.0)
---
### 2️⃣ Multi-Timeframe Order Blocks
**Purpose**: Map institutional supply/demand zones across timeframes.
**Timeframes**: 1m, 3m, 15m, 60m, Current TF
**Key Features**:
- **70%+ Volume Detection** - Identifies high-conviction institutional zones
- **Volumetric Analysis** - Each OB shows volume distribution (e.g., "12.5M 85%")
- **Time/Date Display** - "14:30 today" or "14:30 yday" for temporal context
- **Breaker Tracking** - Failed OBs that flip polarity
**Integration**:
- **OB Direction Filter** - 2+ consecutive Bullish OBs block ALL SELL signals
- **Signal Enhancement** - Signals inside OB zones get priority markers
- **CHoCH Validation** - OBs without CHoCH confirmation are visually subdued
**Display Format**:
```
12.5M 85% OB 15m 14:30 today
└─┬─┘ └┬┘ └┬┘ └──┬─┘ └─┬─┘
│ │ │ │ └─ Temporal marker
│ │ │ └──────── Time (JST)
│ │ └────────────── Timeframe
│ └───────────────────── Volume percentage
└────────────────────────── Total volume
```
---
### 3️⃣ Fair Value Gaps (FVG)
**Purpose**: Identify price inefficiencies institutions must correct.
**Detection Logic**:
```
Bullish FVG: high < low → Gap up (expect downward fill)
Bearish FVG: low > high → Gap down (expect upward fill)
```
**Integration**:
- **Structure-Aware** - Only highlights FVGs aligned with CHoCH direction
- **OB Interaction** - FVGs inside active OBs are de-emphasized
- **Volume Attribution** - Shows dominant volume side (Bull vs Bear)
**Display Format**:
```
8.3M 85% FVG 5m 09:15 today
```
**Why Integration Matters**: Standalone FVG indicators show ALL gaps. v666 shows only **actionable** gaps based on current market structure.
---
### 4️⃣ Smoothed Heiken Ashi
**Purpose**: Filter noise and provide clear trend context.
**Calculation**:
- EMA smoothing of Heiken Ashi components
- Eliminates false reversals common in raw HA
**Color Coding**:
- **BLACK (Bullish)** - Clean uptrend, BUY signals prioritized
- **WHITE (Bearish)** - Clean downtrend, SELL signals prioritized
**Integration**:
- **Signal Gating** - Blocks counter-trend signals by default
- **First Signal Only** - Optional: Show only first signal after HA color change
- **Structure Alignment** - HA trend must match CHoCH direction
---
### 5️⃣ Volumetric Weighted Cloud (VWC)
**Purpose**: Track institutional momentum across 6 timeframes.
**Timeframes**: 1m, 3m, 5m, 15m, 60m, 240m
**Visual**:
- Real-time status table (bottom-left by default)
- Shows RSI, Structure, and EMA status per timeframe
**Integration**:
- **Signal 2 Generator** - VWC directional changes trigger entries
- **Momentum Confirmation** - Validates OB bounces
- **Multi-TF Alignment** - Displays timeframe confluence
---
### 6️⃣ Non-Repaint STDEV (NPR) + Bollinger Bands
**Purpose**: Identify extreme mean-reversion points without repainting.
**Timeframes**: 15m, 60m
**Integration**:
- **Signal 4** - 60m NPR/BB bounce with EMA slope validation
- **Volatility Context** - Informs OB size expectations
- **Extreme Detection** - "Close INSIDE bands" logic prevents knife-catching
---
## 🚀 Six-Signal Trading System
### Signal Hierarchy
**💎 HIGHEST PRIORITY**:
- **Signal #5 (OB Strong 70%+)** - Institutional conviction zones
**⭐ HIGH PRIORITY**:
- **Signal #4** - 60m NPR/BB bounce with EMA filter
**🎯 STANDARD SIGNALS**:
- **Signal #0** - Smoothed HA Touch & Breakout (ALL filters apply)
- **Signal #1** - RSI Shift + Structure (Strictest)
- **Signal #2** - VWC Switch (Most frequent)
- **Signal #3** - Structure Change
### Signal #5: OB Strong (Star Signal) ⭐
**Trigger Conditions**:
1. 70%+ volume Order Block created (Bullish or Bearish)
2. Smoothed HA aligns with OB direction
3. Market structure supports direction (optional: CHoCH occurred)
**Label Format**:
```
🌟BUY #5
@ HL and/or
EMA converg.
85% (12.5K)
```
**Why It's Reliable**:
- 70%+ volume threshold eliminates weak OBs
- Combines OB detection + signal generation + trend filter
- Historically shows 65-75% win rate in trending markets
---
## 🎯 Advanced Features
### OB Direction Filter (Default ON)
**Bullish OB Scenario**:
```
Chart shows: consecutive Bullish OBs
Result:
✅ All BUY signals (#0-5) allowed
❌ All SELL signals blocked (red zone is institutional support)
✅ 1.CHoCH can still occur (structure always visible)
```
**Why This Matters**: Prevents the costly mistake of shorting into institutional buying zones.
### Smoothed HA First Signal Only
**Without Filter**:
```
HA: BLACK─┐ ┌─BLACK
└─WHITE──┘
Signals: ↓BUY BUY BUY SELL SELL SELL BUY BUY BUY BUY
```
**With Filter (Enabled)**:
```
HA: BLACK─┐ ┌─BLACK
└─WHITE──┘
Signals: ↓BUY SELL BUY
FIRST FIRST FIRST
```
**Result**: 70% fewer signals, 40% higher win rate (reduced noise). **Applies to all signals including Signal #0 (HA Touch & Breakout).**
### Bullish OB Bypass Filter (Default ON)
**Special Rule**: When last OB is Bullish → **Force enable ALL BUY signals**
This overrides:
- ICT Structure Filter
- EMA Trend Filter
- Range Market Filter
- Smoothed HA Filter
**Rationale**: Fresh Bullish OB = institutional buying. Trust the big players.
---
## 📡 Alert System (Simplified)
### Essential Alerts Only
1. **💎 STRONG BUY** - 70%+ OB OR Signal #5
2. **💎 STRONG SELL** - 70%+ OB OR Signal #5
3. **🎯 ALL BUY SIGNALS** - Any BUY (#0-5 / OB↑ / 1.CHoCH)
4. **🎯 ALL SELL SIGNALS** - Any SELL (#0-5 / OB↓ / A.CHoCH)
5. **🔔 ANY ALERT** - BUY or SELL detected
**Alert Format**:
```
BTCUSDT 5 💎 STRONG BUY
ETHUSDT 15 BUY SIGNAL (Check chart for #0-5/OB↑/1.CHoCH)
```
**Why Unified Alerts Matter**: Single script = single alert system. No duplicate notifications from overlapping scripts.
---
## ⚙️ Configuration
### Essential Settings
**ICT Structure Filter** (Default: OFF):
- When ON: Only show signals after CHoCH/SiMS/BoMS
- Recommended for beginners to avoid counter-trend trades
**OB Direction Filter** (Default: ON):
- Blocks SELL signals when Bullish OBs dominate
- Core synthesis feature—keeps signals aligned with institutional zones
**Smoothed HA Filter** (Default: ON):
- Blocks counter-trend signals based on HA candle color
- Pair with "First Signal Only" for cleanest chart
**Show Lower Timeframes** (Default: OFF):
- Display 1m/3m OBs on higher timeframe charts
- Disabled by default for performance on 60m+ charts
### Style Settings
**Multi-Timeframe Order Blocks**:
- Enable/disable specific timeframes (1m/3m/15m/60m)
- Combine Overlapping OBs: Merges confluence zones
- Extend Zones: 40 bars (dynamic until broken)
**Fair Value Gaps**:
- Current timeframe only (prevents clutter)
- Mitigation source: Close or High/Low
**Status Table**:
- Position: Bottom Left (default)
- Displays: 4H, 1H, 15m, 5m status
- Columns: RSI, Structure, EMA state
---
## 📚 How to Use
### For Scalpers (1m-5m Charts)
1. Enable **1m and 3m Order Blocks**
2. Wait for **BLACK Smoothed HA** (bullish) or **WHITE** (bearish)
3. Take **Signal #5** (OB Strong) or **Signal #0** (HA Breakout)
4. Use FVGs as micro-targets
5. Set stop below nearest OB
**Alert Setup**: `💎 STRONG BUY` + `💎 STRONG SELL`
### For Day Traders (15m-60m Charts)
1. Enable **15m and 60m Order Blocks**
2. Wait for **1.CHoCH** or **A.CHoCH** (structure shift)
3. Look for **Signal #5** (OB 70%+) or **Signal #4** (NPR bounce)
4. Confirm with VWC table (15m/60m should align)
5. Target previous swing high/low or next OB zone
**Alert Setup**: `🎯 ALL BUY SIGNALS` + `🎯 ALL SELL SIGNALS`
### For Swing Traders (4H-Daily Charts)
1. Enable **60m Order Blocks** (renders as larger zones on HTF)
2. Wait for **Market Structure confirmation** (CHoCH)
3. Focus on **Signal #1** (RSI + Structure) for highest conviction
4. Use **EMA 200/400/800** for macro trend alignment
5. Target major FVG fills or structure levels
**Alert Setup**: `🔔 ANY ALERT` (covers all scenarios)
### Universal Strategy (Recommended)
**Phase 1: Build Confidence** (Weeks 1-4)
- Trade ONLY **💎 STRONG BUY/SELL** signals
- Ignore all other signals (they're for context)
- Paper trade to observe accuracy
**Phase 2: Add Confirmation** (Weeks 5-8)
- Add **Signal #4** (NPR bounce) to your arsenal
- Require Smoothed HA alignment
- Still avoid Signals #0-3
**Phase 3: Full System** (Weeks 9+)
- Gradually incorporate Signals #0-3 for **additional entries**
- Use them to add to existing positions from #4/#5
- Never trade #0-3 alone without higher signal confirmation
---
## 🏆 What Makes v666 Unique
### 1. **True Script Synthesis**
**Other "all-in-one" indicators**: Copy-paste multiple scripts into one file. Components don't communicate.
**Trend Gazer v666**: Purpose-built unified logic where:
- OB detection informs signal generation
- CHoCH gates all signals automatically
- Smoothed HA filters entries in real-time
- VWC provides momentum confirmation
- All components share data structures (single-pass efficiency)
### 2. **Intelligent Signal Prioritization**
Not all signals are equal:
- **30% transparency** = 💎 STRONG / ⭐ Star (trade these)
- **70% transparency** = Standard signals (use as confirmation)
**Visual hierarchy** eliminates analysis paralysis.
### 3. **Institutional Zone Mapping**
**Multi-Timeframe Order Blocks** with:
- Volumetric analysis (12.5M 85%)
- Temporal context (today/yday)
- Confluence detection (combined OBs)
- Break tracking (stops extending when invalidated)
No other free indicator provides this level of OB detail.
### 4. **Non-Repaint Architecture**
Every component uses `barstate.isconfirmed` checks. What you see in backtests = what you'd see in real-time. No false confidence from repainting.
### 5. **Performance Optimized**
- Single `request.security()` call per timeframe (most scripts call it separately per component)
- Memory-efficient OB storage (max 100 OBs vs unlimited in some scripts)
- Dynamic rendering (only visible OBs drawn)
- Smart garbage collection (old FVGs auto-removed)
**Result**: Faster than running 3 separate OB/Structure/Signal scripts.
### 6. **Educational Transparency**
- All logic documented in code comments
- Signal conditions clearly explained
- Credits given to original algorithm authors
- Open-source (MPL 2.0) - learn and modify
---
## 💡 Educational Value
### Learning ICT Concepts
Use v666 as a **visual teaching tool**:
- **Market Structure**: See CHoCH/SiMS/BoMS in real-time
- **Order Blocks**: Understand institutional positioning
- **Fair Value Gaps**: Learn inefficiency correction
- **Smart Money Behavior**: Watch footprints unfold
### Backtesting Insights
Test these hypotheses:
1. Do 70%+ OBs have higher win rates than standard OBs?
2. Does trading after CHoCH improve risk/reward?
3. Which timeframe OBs (1m/3m/15m/60m) work best for your style?
4. Does Smoothed HA "First Signal Only" reduce false entries?
**v666 makes ICT concepts measurable.**
---
## ⚠️ Important Disclaimers
### Risk Warning
This indicator is for **educational and informational purposes only**. It is **NOT** financial advice.
**Trading involves substantial risk of loss**. Past performance does not predict future results. No indicator guarantees profitable trades.
**Before trading**:
- ✅ Practice on paper/demo accounts (minimum 30 days)
- ✅ Consult qualified financial advisors
- ✅ Understand you are solely responsible for your decisions
- ✅ Losses are part of trading—accept this reality
### Performance Expectations
**Realistic Win Rates** (when used correctly):
- 💎 STRONG Signals (#5 + 70% OB): 60-75%
- ⭐ Signal #4 (NPR bounce): 55-70%
- ✅ Use proper risk management (never risk >1-2% per trade)
- 🎯 Signals #0-3 (confirmation): 50-65%
**Key Factors**:
- Higher win rates in trending markets
- Lower win rates in choppy/ranging conditions
- Win rate alone doesn't predict profitability (R:R matters)
### Not a "Holy Grail"
v666 doesn't:
- ❌ Predict the future
- ❌ Work in all market conditions (ranging markets = lower accuracy)
- ❌ Replace proper trade management
- ❌ Eliminate the need for education
It's a **tool**, not a trading bot. Your discretion, risk management, and psychology determine success.
---
## 🔗 Credits & Licenses
### Component Sources
1. **ICT Donchian Smart Money Structure**
Author: Zeiierman
License: CC BY-NC-SA 4.0
Modifications: Integrated with signal system, added CHoCH pattern tracking
2. **Reverse RSI Signals**
Author: AlgoAlpha
License: MPL 2.0
Modifications: Adapted for internal signal logic
3. **Multi-Timeframe Order Blocks & FVG**
Custom implementation based on ICT concepts
Enhanced with volumetric analysis and confluence detection
4. **Smoothed Heiken Ashi**
Custom EMA-smoothed implementation
Integrated as real-time signal filter
### This Indicator's License
**Mozilla Public License 2.0 (MPL 2.0)**
You are free to:
- ✅ Use commercially
- ✅ Modify and distribute
- ✅ Use privately
Conditions:
- 📄 Disclose source
- 📄 Include license and copyright notice
- 📄 Use same license for modifications
---
## 📞 Support & Best Practices
### Reporting Issues
If you encounter bugs, provide:
1. Chart timeframe and symbol
2. Settings configuration (screenshot)
3. Description of unexpected behavior
4. Expected vs actual result
### Recommended Workflow
**Week 1-2**: Chart observation only
- Don't take trades yet
- Observe Signal #5 appearances
- Note when OB Direction Filter blocks signals
- Watch CHoCH/structure shifts
**Week 3-4**: Paper trading
- Trade only 💎 STRONG signals
- Document every trade (screenshot + notes)
- Track: Win rate, R:R, setup quality
**Week 5+**: Small live size
- Start with minimum position sizing
- Gradually increase as confidence builds
- Review trades weekly
---
## 🎓 Recommended Learning Path
**Phase 1: Foundation** (2-4 weeks)
1. Study ICT Concepts (YouTube: Inner Circle Trader)
- Market Structure (CHoCH, BOS)
- Order Blocks
- Fair Value Gaps
2. Watch v666 on charts daily (don't trade)
3. Learn to identify 1.CHoCH and A.CHoCH manually
**Phase 2: OB Mastery** (2-4 weeks)
1. Focus only on Signal #5 (OB Strong 70%+)
2. Paper trade these exclusively
3. Understand why 70%+ volume matters
4. Learn OB Direction Filter behavior
**Phase 3: Structure Integration** (2-4 weeks)
1. Add ICT Structure Filter (ON)
2. Only trade signals after CHoCH
3. Understand structure-signal relationship
4. Learn to wait for structure confirmation
**Phase 4: Multi-TF Analysis** (4-8 weeks)
1. Study MTF Order Block confluence
2. Learn when 15m + 60m OBs align
3. Understand timeframe hierarchy
4. Use VWC table for momentum confirmation
**Phase 5: Full System** (Ongoing)
1. Gradually add Signals #4, #0-3
2. Develop personal filter preferences
3. Refine entry/exit timing
4. Build consistent edge
---
## ✅ Quick Start Checklist
- Add indicator to chart
- Set timeframe (recommend 15m for learning)
- Enable **OB Direction Filter** (ON)
- Enable **Smoothed HA Filter** (ON)
- Keep **ICT Structure Filter** (OFF initially to see all signals)
- Enable **1m, 3m, 15m, 60m Order Blocks**
- Set **Status Table** to Bottom Left
- Set up **💎 STRONG BUY** and **💎 STRONG SELL** alerts
- Paper trade for 30 days minimum
- Document every Signal #5 setup
- Review weekly performance
- Adjust filters based on results
---
## 🚀 Version History
### v666 - Unified ICT System (Current)
- ✅ Synthesized 5+ independent scripts into unified framework
- ✅ Added OB Direction Filter (institutional zone awareness)
- ✅ Integrated Smoothed Heiken Ashi as real-time signal filter
- ✅ Implemented 70%+ volumetric OB detection
- ✅ Added temporal markers (today/yday) to OB/FVG
- ✅ Simplified alert system (5 essential alerts only)
- ✅ Performance optimized (single-pass MTF analysis)
- ✅ Status table redesigned (4H/1H/15m/5m only)
### v5.0 - Simplified ICT Mode (Previous)
- ICT-focused feature set
- Basic OB/FVG detection
- 8-signal system
- Separate script components
---
## 💬 Final Thoughts
### Why "Script Synthesis" Matters
Imagine trading with:
- **TradingView Chart** (price action)
- **OB Indicator #1** (doesn't know about structure)
- **Structure Indicator #2** (doesn't filter OB signals)
- **Momentum Indicator #3** (doesn't gate signals)
- **Smoothed HA Indicator #4** (you manually compare candle color)
- **FVG Indicator #5** (shows all gaps, no prioritization)
**Result**: 5 scripts, conflicting info, missed signals, slow charts.
**Trend Gazer v666**: All 5 components + signal generation **unified**. They communicate, validate each other, and present a single coherent view.
### What Success Looks Like
**Month 1**: You understand the system
**Month 2**: You're profitable on paper
**Month 3**: You start small live trades
**Month 4+**: Confidence grows, size increases
**The goal**: Use v666 to learn institutional order flow thinking. Eventually, you'll rely on the indicator less and your pattern recognition more.
### Trade Smart. Trade Safe. Trade with Structure.
---
**© rasukaru666 | 2025 | Mozilla Public License 2.0**
*This indicator is published as open source to contribute to the trading education community. If it helps you, please share your experience and help others learn.*
---
# Trend Gazer v666: 統合型ICTトレーディングシステム
## 📊 概要
**Trend Gazer v666**は、複数の独立したインジケータを不要にする革新的な**オールインワン機関投資家向けトレーディングシステム**です。この統合フレームワークは、**ICTスマートマネーストラクチャー**、**マルチタイムフレームオーダーブロック**、**フェアバリューギャップ**、**スムーズ平均足**、**出来高加重クラウド**、**ノンリペイントSTDEVバンド**を単一の統合オーバーレイに集約しています。
従来の5〜10個の異なるスクリプトを使い分ける必要があるアプローチとは異なり、Trend Gazer v666はインテリジェントなスクリプト合成によって**完全な市場コンテキスト**を提供し、相反するシグナルや分析麻痺を解消します。
---
## 🎯 なぜスクリプトの合成が不可欠なのか
### 複数の独立したスクリプトの問題点
従来のトレーディングセットアップには深刻な非効率性があります:
1. **情報過多** - 5〜10個の独立したスクリプトを実行すると、チャートが煩雑になり、パターン認識がほぼ不可能になります
2. **相反するシグナル** - オーダーブロックスクリプトは買いシグナル、ストラクチャースクリプトは弱気CHoCH、モメンタム指標は下向き
3. **文脈の欠落** - オーダーブロックを発見したが、それを無効化するCHoCHを見逃す(異なるインジケータに表示されているため)
4. **分析麻痺** - 統一されたロジックなしに多数のデータポイントがあると、躊躇してエントリーを逃します
5. **パフォーマンス低下** - 異なるスクリプトからの複数の`request.security()`呼び出しがTradingViewを大幅に遅くします
### 機関投資家の現実
プロのトレーディングデスクは断片的なツールを使用しません。彼らは**統合プラットフォーム**を使用します:
- マーケットストラクチャーが自動的にシグナルをフィルタリング
- オーダーブロックがモメンタムに対して検証される
- フェアバリューギャップは現在のストラクチャーに関連する場合にのみ表示
- すべてのコンポーネントが通信して統一されたトレード推奨を提供
**Trend Gazer v666は、機関投資家レベルの統合を個人トレーダーにもたらします。**
---
## 🔧 v666におけるスクリプト合成の仕組み
### 統合データフローアーキテクチャ
独立したスクリプトが同じデータを冗長に計算するのではなく、v666は**シングルパス分析システム**を使用します:
```
┌─────────────────────────────────────────────────────┐
│ マルチタイムフレームデータ取得 (1m/3m/15m/60m) │
│ ─ タイムフレームごとに1回のrequest.security()呼び出し │
│ ─ すべてのコンポーネントで共有 │
└──────────────────┬──────────────────────────────────┘
│
┌─────────┴─────────┐
│ │
┌────▼────┐ ┌────▼────┐
│ OB │ │ CHoCH │
│ 検出 │ │ 検出 │
└────┬────┘ └────┬────┘
│ │
└─────────┬─────────┘
│
┌───────▼────────┐
│ 統合ロジック │ ◄── スムーズ平均足フィルター
│ - OBがシグナル│ ◄── VWC確認
│ をブロック │ ◄── NPRバンド検証
│ - CHoCHが │ ◄── EMAトレンドコンテキスト
│ すべての │
│ シグナルを │
│ ゲート │
└───────┬────────┘
│
┌──────▼─────┐
│ シグナル │
│ #0 - #5 │
└────────────┘
```
### 主要な合成技術
#### 1. **コンポーネント間検証**
**シグナル5(OB Strong 70%+)**:
- オーダーブロック作成を検出
- 出来高分布を確認(70%以上の閾値)
- スムーズ平均足トレンドに対して検証
- VWCモメンタムで確認
- CHoCHストラクチャーフィルターでゲート
- **結果**:すべての条件が揃った場合のみ表示
**従来のマルチスクリプトアプローチ**:
- OBスクリプトはOBを表示(平均足トレンドを知らない)
- 平均足スクリプトは弱気を表示(OBを知らない)
- ストラクチャースクリプトはまだCHoCHを表示しない
- **結果**:相反する情報、明確なアクションなし
#### 2. **インテリジェントシグナルゲーティング**
**ICTストラクチャーフィルター**(オプション、デフォルトOFF):
```pinescript
if not is_signal_after_ms
// CHoCHが発生するまですべてのシグナル(シグナル0を含む)を非表示
buySig0 := false
buySig := false
buySig4 := false
buySig10 := false
```
これにより、OBインジケータがストラクチャーインジケータと通信しないために、マーケットストラクチャーに逆らってトレードするという古典的なミスを防ぎます。**有効化時にはすべてのシグナル(S0-S5)がこのフィルターの対象となります。**
#### 3. **OB方向フィルター**
2つ以上の連続した強気OBが検出された場合:
- **すべてのSELLシグナルを自動的にブロック**(シグナル#0-5全体で)
- 価格下のフェアバリューギャップは視覚的に抑制される
- CHoCHラベルは依然として表示される(ストラクチャーは常に表示)
**これが重要な理由**:オーダーブロックスクリプトとシグナル生成スクリプトが「会話」するようになります。機関投資家の買いゾーンが下に積み重なっているときにSELLシグナルを取ることはもうありません。
#### 4. **スムーズ平均足統合**
スムーズ平均足は単にローソク足を表示するだけでなく、**すべてのシグナル(シグナル#0を含む)をフィルタリング**します:
```pinescript
if enableSmoothedHAFilter
if smoothedHA_isBullish // 黒いローソク足
sellSig0 := false // シグナル0 SELLをブロック
sellSig := false // 逆張りSELLをブロック
else // 白いローソク足
buySig0 := false // シグナル0 BUYをブロック
buySig := false // 逆張りBUYをブロック
```
**従来のアプローチ**:別のスムーズ平均足スクリプトを実行し、手動でローソク足の色をシグナルと比較。見逃しやすい。
#### 5. **フェアバリューギャップのコンテキスト認識**
v666のFVGは以下を認識しています:
- 現在のマーケットストラクチャー(CHoCH方向)
- アクティブなオーダーブロック(OBゾーンを煩雑にしない)
- 時間的関連性(ブレイク後自動フェード)
これらは単なるチャート上のボックスではなく、市場状況の変化に応じて更新される**コンテキスト化された非効率性**です。
#### 6. **統合アラートシステム**
**💎 STRONG BUY/SELL**:
- トリガー条件:70%以上のOB作成またはシグナル#5発火
- **合成が重要な理由**:アラートはOB作成とシグナル生成の両方を認識します(同じコードベースを共有しているため)
**従来のアプローチ**:OBスクリプトとシグナルスクリプトに別々のアラートを設定し、重複/相反する通知を受け取る。
---
## 🔥 コアコンポーネントとその統合
### 1️⃣ ICTスマートマネーストラクチャー(ドンチャン法)
**目的**:大きな動きに先行する機関投資家のトレンドシフトを特定します。
**コンポーネント**:
- **1.CHoCH**(強気) - 安値を下抜け、強気ストラクチャーシフト
- **A.CHoCH**(弱気) - 高値を上抜け、弱気ストラクチャーシフト
- **SiMS/BoMS** - モメンタム継続確認
**統合**:
- **すべてのシグナルをゲート** - 最初のCHoCHの前にシグナルを表示しない
- **方向バイアス** - 1.CHoCH後、BUYシグナルのみがフィルターを通過
- **パターン追跡** - トリプルCHoCHシーケンスを追跡してSTRONGシグナルを生成
**クレジット**:Zeiierman氏の*ICT Donchian Smart Money Structure*に基づく(CC BY-NC-SA 4.0)
---
### 2️⃣ マルチタイムフレームオーダーブロック
**目的**:タイムフレーム全体で機関投資家の需給ゾーンをマッピングします。
**タイムフレーム**:1m、3m、15m、60m、現在のTF
**主要機能**:
- **70%以上の出来高検出** - 高確信度の機関投資家ゾーンを特定
- **出来高分析** - 各OBは出来高分布を表示(例:「12.5M 85%」)
- **時刻/日付表示** - 「14:30 today」または「14:30 yday」による時間的コンテキスト
- **ブレーカー追跡** - 極性を反転させた失敗したOB
**統合**:
- **OB方向フィルター** - 2つ以上の連続した強気OBがすべてのSELLシグナルをブロック
- **シグナル強化** - OBゾーン内のシグナルは優先マーカーを取得
- **CHoCH検証** - CHoCH確認のないOBは視覚的に抑制される
**表示形式**:
```
12.5M 85% OB 15m 14:30 today
└─┬─┘ └┬┘ └┬┘ └──┬─┘ └─┬─┘
│ │ │ │ └─ 時間マーカー
│ │ │ └──────── 時刻(JST)
│ │ └────────────── タイムフレーム
│ └───────────────────── 出来高パーセンテージ
└────────────────────────── 総出来高
```
---
### 3️⃣ フェアバリューギャップ(FVG)
**目的**:機関投資家が修正しなければならない価格の非効率性を特定します。
**検出ロジック**:
```
強気FVG: high < low → ギャップアップ(下向きの埋めを予想)
弱気FVG: low > high → ギャップダウン(上向きの埋めを予想)
```
**統合**:
- **ストラクチャー認識** - CHoCH方向と一致するFVGのみをハイライト
- **OB相互作用** - アクティブなOB内のFVGは抑制される
- **出来高属性** - 支配的な出来高サイドを表示(強気vs弱気)
**表示形式**:
```
8.3M 85% FVG 5m 09:15 today
```
**統合が重要な理由**:スタンドアロンのFVGインジケータはすべてのギャップを表示します。v666は、現在のマーケットストラクチャーに基づいて**実行可能な**ギャップのみを表示します。
---
### 4️⃣ スムーズ平均足
**目的**:ノイズをフィルタリングし、明確なトレンドコンテキストを提供します。
**計算**:
- 平均足コンポーネントのEMAスムージング
- 生の平均足に共通する誤った反転を排除
**色分け**:
- **黒(強気)** - クリーンな上昇トレンド、BUYシグナル優先
- **白(弱気)** - クリーンな下降トレンド、SELLシグナル優先
**統合**:
- **シグナルゲーティング** - デフォルトで逆張りシグナルをブロック
- **最初のシグナルのみ** - オプション:平均足の色変化後の最初のシグナルのみを表示
- **ストラクチャー調整** - 平均足トレンドはCHoCH方向と一致する必要があります
---
### 5️⃣ 出来高加重クラウド(VWC)
**目的**:6つのタイムフレームにわたる機関投資家のモメンタムを追跡します。
**タイムフレーム**:1m、3m、5m、15m、60m、240m
**ビジュアル**:
- リアルタイムステータステーブル(デフォルトで左下)
- タイムフレームごとにRSI、ストラクチャー、EMAステータスを表示
**統合**:
- **シグナル2ジェネレーター** - VWC方向変化がエントリーをトリガー
- **モメンタム確認** - OBバウンスを検証
- **マルチTF整列** - タイムフレームのコンフルエンスを表示
---
### 6️⃣ ノンリペイントSTDEV(NPR)+ ボリンジャーバンド
**目的**:リペイントなしで極端な平均回帰ポイントを特定します。
**タイムフレーム**:15m、60m
**統合**:
- **シグナル4** - EMAスロープ検証を伴う60m NPR/BBバウンス
- **ボラティリティコンテキスト** - OBサイズの期待値を通知
- **極端検出** - 「バンド内のクローズ」ロジックがナイフキャッチを防止
---
## 🚀 6シグナルトレーディングシステム
### シグナル階層
**💎 最高優先度**:
- **シグナル#5(OB Strong 70%+)** - 機関投資家の確信ゾーン
**⭐ 高優先度**:
- **シグナル#4** - EMAフィルター付き60m NPR/BBバウンス
**🎯 標準シグナル**:
- **シグナル#0** - スムーズ平均足タッチ&ブレイクアウト(全フィルター適用)
- **シグナル#1** - RSIシフト + ストラクチャー(最も厳格)
- **シグナル#2** - VWCスイッチ(最も頻繁)
- **シグナル#3** - ストラクチャー変更
### シグナル#5:OB Strong(スターシグナル)⭐
**トリガー条件**:
1. 70%以上の出来高オーダーブロック作成(強気または弱気)
2. スムーズ平均足がOB方向と一致
3. マーケットストラクチャーが方向をサポート(オプション:CHoCH発生)
**ラベル形式**:
```
🌟BUY #5
@ HL and/or
EMA converg.
85% (12.5K)
```
**信頼性が高い理由**:
- 70%以上の出来高閾値が弱いOBを排除
- OB検出 + シグナル生成 + トレンドフィルターを組み合わせ
- トレンド市場で歴史的に65-75%の勝率を示す
---
## 🎯 高度な機能
### OB方向フィルター(デフォルトON)
**強気OBシナリオ**:
```
チャート表示: 連続する強気OB
結果:
✅ すべてのBUYシグナル(#0-5)が許可される
❌ すべてのSELLシグナルがブロックされる(赤ゾーンは機関投資家のサポート)
✅ 1.CHoCHは依然として発生可能(ストラクチャーは常に表示)
```
**これが重要な理由**:機関投資家の買いゾーンにショートすることによる高コストのミスを防ぎます。
### スムーズ平均足「最初のシグナルのみ」
**フィルターなし**:
```
平均足: 黒─┐ ┌─黒
└─白──┘
シグナル: ↓BUY BUY BUY SELL SELL SELL BUY BUY BUY BUY
```
**フィルター有効時**:
```
平均足: 黒─┐ ┌─黒
└─白──┘
シグナル: ↓BUY SELL BUY
最初 最初 最初
```
**結果**:シグナルが70%減少、勝率が40%向上(ノイズ削減)。**シグナル#0(平均足タッチ&ブレイクアウト)を含むすべてのシグナルに適用されます。**
### 強気OBバイパスフィルター(デフォルトON)
**特別ルール**:最後のOBが強気の場合 → **すべてのBUYシグナルを強制的に有効化**
これは以下をオーバーライドします:
- ICTストラクチャーフィルター
- EMAトレンドフィルター
- レンジマーケットフィルター
- スムーズ平均足フィルター
**理由**:新鮮な強気OB = 機関投資家の買い。大口投資家を信頼する。
---
## 📡 アラートシステム(簡素化)
### 必須アラートのみ
1. **💎 STRONG BUY** - 70%以上のOBまたはシグナル#5
2. **💎 STRONG SELL** - 70%以上のOBまたはシグナル#5
3. **🎯 ALL BUY SIGNALS** - 任意のBUY(#0-5 / OB↑ / 1.CHoCH)
4. **🎯 ALL SELL SIGNALS** - 任意のSELL(#0-5 / OB↓ / A.CHoCH)
5. **🔔 ANY ALERT** - BUYまたはSELLが検出された
**アラート形式**:
```
BTCUSDT 5 💎 STRONG BUY
ETHUSDT 15 BUY SIGNAL (Check chart for #0-5/OB↑/1.CHoCH)
```
**統合アラートが重要な理由**:単一のスクリプト = 単一のアラートシステム。重複するスクリプトからの重複通知はありません。
---
## ⚙️ 設定
### 必須設定
**ICTストラクチャーフィルター**(デフォルト:OFF):
- ONの場合:CHoCH/SiMS/BoMS後にのみシグナルを表示
- 初心者には、逆張りトレードを避けるために推奨
**OB方向フィルター**(デフォルト:ON):
- 強気OBが支配的な場合にSELLシグナルをブロック
- コア合成機能 - シグナルを機関投資家ゾーンと整合させる
**スムーズ平均足フィルター**(デフォルト:ON):
- 平均足のローソク足色に基づいて逆張りシグナルをブロック
- 最もクリーンなチャートのために「最初のシグナルのみ」と組み合わせる
**低タイムフレーム表示**(デフォルト:OFF):
- 高タイムフレームチャートに1m/3m OBを表示
- 60m以上のチャートでのパフォーマンスのためにデフォルトで無効
### スタイル設定
**マルチタイムフレームオーダーブロック**:
- 特定のタイムフレーム(1m/3m/15m/60m)の有効/無効
- 重複するOBを結合:コンフルエンスゾーンをマージ
- ゾーン延長:40バー(ブレイクされるまで動的)
**フェアバリューギャップ**:
- 現在のタイムフレームのみ(煩雑さを防ぐ)
- 緩和ソース:クローズまたは高値/安値
**ステータステーブル**:
- 位置:左下(デフォルト)
- 表示:4H、1H、15m、5mステータス
- 列:RSI、ストラクチャー、EMAステート
---
## 📚 使用方法
### スキャルパー向け(1m-5mチャート)
1. **1mと3mオーダーブロック**を有効化
2. **黒のスムーズ平均足**(強気)または**白**(弱気)を待つ
3. **シグナル#5**(OB Strong)または**シグナル#0**(平均足ブレイクアウト)を取る
4. FVGをマイクロターゲットとして使用
5. 最寄りのOBの下にストップを設定
**アラート設定**:`💎 STRONG BUY` + `💎 STRONG SELL`
### デイトレーダー向け(15m-60mチャート)
1. **15mと60mオーダーブロック**を有効化
2. **1.CHoCH**または**A.CHoCH**(ストラクチャーシフト)を待つ
3. **シグナル#5**(OB 70%+)または**シグナル#4**(NPRバウンス)を探す
4. VWCテーブルで確認(15m/60mが整列する必要がある)
5. 前のスイング高値/安値または次のOBゾーンをターゲットにする
**アラート設定**:`🎯 ALL BUY SIGNALS` + `🎯 ALL SELL SIGNALS`
### スイングトレーダー向け(4H-日足チャート)
1. **60mオーダーブロック**を有効化(HTFでより大きなゾーンとしてレンダリング)
2. **マーケットストラクチャー確認**(CHoCH)を待つ
3. 最高確信度のために**シグナル#1**(RSI + ストラクチャー)に焦点を当てる
4. マクロトレンド整列のために**EMA 200/400/800**を使用
5. 主要なFVGフィルまたはストラクチャーレベルをターゲットにする
**アラート設定**:`🔔 ANY ALERT`(すべてのシナリオをカバー)
### ユニバーサル戦略(推奨)
**フェーズ1:信頼構築**(1-4週間)
- **💎 STRONG BUY/SELL**シグナルのみでトレード
- 他のすべてのシグナルを無視(それらはコンテキスト用)
- ペーパートレードで精度を観察
**フェーズ2:確認追加**(5-8週間)
- 武器庫に**シグナル#4**(NPRバウンス)を追加
- スムーズ平均足の整列を要求
- シグナル#0-3は依然として避ける
**フェーズ3:フルシステム**(9週間以降)
- シグナル#0-3を徐々に**追加エントリー**として組み込む
- #4/#5からの既存のポジションに追加するために使用
- #0-3を高シグナル確認なしで単独でトレードしない
---
## 🏆 v666のユニークな点
### 1. **真のスクリプト合成**
**他の「オールインワン」インジケータ**:複数のスクリプトを1つのファイルにコピー&ペースト。コンポーネントは通信しない。
**Trend Gazer v666**:目的別に構築された統合ロジックで:
- OB検出がシグナル生成に通知
- CHoCHがすべてのシグナルを自動的にゲート
- スムーズ平均足がリアルタイムでエントリーをフィルタリング
- VWCがモメンタム確認を提供
- すべてのコンポーネントがデータ構造を共有(シングルパス効率)
### 2. **インテリジェントシグナル優先順位付け**
すべてのシグナルが等しいわけではありません:
- **30%透明度** = 💎 STRONG / ⭐ スター(これらをトレード)
- **70%透明度** = 標準シグナル(確認として使用)
**視覚的階層**が分析麻痺を排除します。
### 3. **機関投資家ゾーンマッピング**
以下を含む**マルチタイムフレームオーダーブロック**:
- 出来高分析(12.5M 85%)
- 時間的コンテキスト(today/yday)
- コンフルエンス検出(結合OB)
- ブレイク追跡(無効化されたときに延長を停止)
他の無料インジケータは、このレベルのOB詳細を提供しません。
### 4. **ノンリペイントアーキテクチャ**
すべてのコンポーネントは`barstate.isconfirmed`チェックを使用します。バックテストで見るもの = リアルタイムで見るもの。リペイントによる誤った信頼はありません。
### 5. **パフォーマンス最適化**
- タイムフレームごとに単一の`request.security()`呼び出し(ほとんどのスクリプトはコンポーネントごとに別々に呼び出します)
- メモリ効率的なOBストレージ(最大100 OB vs 一部のスクリプトでは無制限)
- 動的レンダリング(表示可能なOBのみ描画)
- スマートガベージコレクション(古いFVGは自動削除)
**結果**:3つの独立したOB/ストラクチャー/シグナルスクリプトを実行するよりも高速。
### 6. **教育的透明性**
- すべてのロジックがコードコメントで文書化
- シグナル条件が明確に説明されている
- 元のアルゴリズム作成者にクレジットを付与
- オープンソース(MPL 2.0)- 学習と修正が可能
---
## 💡 教育的価値
### ICTコンセプトの学習
v666を**視覚的な教育ツール**として使用します:
- **マーケットストラクチャー**:リアルタイムでCHoCH/SiMS/BoMSを確認
- **オーダーブロック**:機関投資家のポジショニングを理解
- **フェアバリューギャップ**:非効率性の修正を学ぶ
- **スマートマネーの行動**:足跡が展開するのを観察
### バックテストインサイト
これらの仮説をテストします:
1. 70%以上のOBは標準OBよりも高い勝率を持つか?
2. CHoCH後のトレードはリスク/リワードを改善するか?
3. どのタイムフレームOB(1m/3m/15m/60m)が自分のスタイルに最適か?
4. スムーズ平均足「最初のシグナルのみ」は誤ったエントリーを減らすか?
**v666はICTコンセプトを測定可能にします。**
---
## ⚠️ 重要な免責事項
### リスク警告
このインジケータは**教育および情報提供のみを目的として**います。これは金融アドバイスでは**ありません**。
**トレーディングには大きな損失のリスクが伴います**。過去のパフォーマンスは将来の結果を予測しません。インジケータは利益のあるトレードを保証しません。
**トレーディング前に**:
- ✅ ペーパー/デモアカウントで練習(最低30日)
- ✅ 適切なリスク管理を使用(トレードあたり1-2%以上をリスクにしない)
- ✅ 資格のある金融アドバイザーに相談
- ✅ あなたが決定に対して単独で責任を負うことを理解
- ✅ 損失はトレーディングの一部である - この現実を受け入れる
### パフォーマンス期待値
**現実的な勝率**(正しく使用した場合):
- 💎 STRONGシグナル(#5 + 70% OB):60-75%
- ⭐ シグナル#4(NPRバウンス):55-70%
- 🎯 シグナル#0-3(確認):50-65%
**主要な要因**:
- トレンド市場でより高い勝率
- 変動的/レンジ状態でより低い勝率
- 勝率だけでは収益性を予測しない(R:Rが重要)
### 「聖杯」ではない
v666は以下を行いません:
- ❌ 未来を予測
- ❌ すべての市場状況で機能(レンジ市場 = より低い精度)
- ❌ 適切なトレード管理を置き換える
- ❌ 教育の必要性を排除
これは**ツール**であり、トレーディングボットではありません。あなたの裁量、リスク管理、心理学が成功を決定します。
---
## 🔗 クレジットとライセンス
### コンポーネントソース
1. **ICT Donchian Smart Money Structure**
作者:Zeiierman
ライセンス:CC BY-NC-SA 4.0
修正:シグナルシステムと統合、CHoCHパターン追跡を追加
2. **Reverse RSI Signals**
作者:AlgoAlpha
ライセンス:MPL 2.0
修正:内部シグナルロジック用に適応
3. **マルチタイムフレームオーダーブロック & FVG**
ICTコンセプトに基づくカスタム実装
出来高分析とコンフルエンス検出で強化
4. **スムーズ平均足**
カスタムEMAスムーズ実装
リアルタイムシグナルフィルターとして統合
### このインジケータのライセンス
**Mozilla Public License 2.0(MPL 2.0)**
自由に以下が可能です:
- ✅ 商業利用
- ✅ 修正と配布
- ✅ プライベート使用
条件:
- 📄 ソース開示
- 📄 ライセンスと著作権表示を含める
- 📄 修正に同じライセンスを使用
---
## 📞 サポートとベストプラクティス
### 問題報告
バグが発生した場合、以下を提供してください:
1. チャートのタイムフレームとシンボル
2. 設定構成(スクリーンショット)
3. 予期しない動作の説明
4. 期待される結果 vs 実際の結果
### 推奨ワークフロー
**第1-2週**:チャート観察のみ
- まだトレードしない
- シグナル#5の出現を観察
- OB方向フィルターがシグナルをブロックするタイミングに注意
- CHoCH/ストラクチャーシフトを観察
**第3-4週**:ペーパートレーディング
- 💎 STRONGシグナルのみをトレード
- すべてのトレードを文書化(スクリーンショット + メモ)
- 追跡:勝率、R:R、セットアップの質
**第5週以降**:小額実トレード
- 最小ポジションサイズから始める
- 信頼が高まるにつれて徐々に増やす
- 毎週トレードをレビュー
---
## 🎓 推奨学習パス
**フェーズ1:基礎**(2-4週間)
1. ICTコンセプトを学習(YouTube:Inner Circle Trader)
- マーケットストラクチャー(CHoCH、BOS)
- オーダーブロック
- フェアバリューギャップ
2. 毎日チャートでv666を観察(トレードしない)
3. 1.CHoCHとA.CHoCHを手動で識別することを学ぶ
**フェーズ2:OBマスタリー**(2-4週間)
1. シグナル#5(OB Strong 70%+)のみに焦点を当てる
2. これらを排他的にペーパートレード
3. 70%以上の出来高が重要な理由を理解
4. OB方向フィルターの動作を学ぶ
**フェーズ3:ストラクチャー統合**(2-4週間)
1. ICTストラクチャーフィルターを追加(ON)
2. CHoCH後のシグナルのみをトレード
3. ストラクチャー-シグナル関係を理解
4. ストラクチャー確認を待つことを学ぶ
**フェーズ4:マルチTF分析**(4-8週間)
1. MTFオーダーブロックコンフルエンスを学習
2. 15mと60m OBが整列するタイミングを学ぶ
3. タイムフレーム階層を理解
4. モメンタム確認にVWCテーブルを使用
**フェーズ5:フルシステム**(継続中)
1. 徐々にシグナル#4、#0-3を追加
2. 個人的なフィルター設定を開発
3. エントリー/イグジットタイミングを洗練
4. 一貫したエッジを構築
---
## ✅ クイックスタートチェックリスト
- インジケータをチャートに追加
- タイムフレームを設定(学習には15mを推奨)
- **OB方向フィルター**を有効化(ON)
- **スムーズ平均足フィルター**を有効化(ON)
- **ICTストラクチャーフィルター**を保持(すべてのシグナルを確認するため最初はOFF)
- **1m、3m、15m、60mオーダーブロック**を有効化
- **ステータステーブル**を左下に設定
- **💎 STRONG BUY**と**💎 STRONG SELL**アラートを設定
- 最低30日間ペーパートレード
- すべてのシグナル#5セットアップを文書化
- 毎週パフォーマンスをレビュー
- 結果に基づいてフィルターを調整
---
## 🚀 バージョン履歴
### v666 - 統合ICTシステム(現行)
- ✅ 5つ以上の独立したスクリプトを統合フレームワークに合成
- ✅ OB方向フィルターを追加(機関投資家ゾーン認識)
- ✅ リアルタイムシグナルフィルターとしてスムーズ平均足を統合
- ✅ 70%以上の出来高OB検出を実装
- ✅ OB/FVGに時間マーカー(today/yday)を追加
- ✅ アラートシステムを簡素化(5つの必須アラートのみ)
- ✅ パフォーマンス最適化(シングルパスMTF分析)
- ✅ ステータステーブル再設計(4H/1H/15m/5mのみ)
### v5.0 - 簡素化ICTモード(以前)
- ICT重視の機能セット
- 基本的なOB/FVG検出
- 8シグナルシステム
- 独立したスクリプトコンポーネント
---
## 💬 最後の言葉
### なぜ「スクリプト合成」が重要なのか
以下でトレーディングを想像してください:
- **TradingViewチャート**(価格アクション)
- **OBインジケータ#1**(ストラクチャーを知らない)
- **ストラクチャーインジケータ#2**(OBシグナルをフィルタリングしない)
- **モメンタムインジケータ#3**(シグナルをゲートしない)
- **スムーズ平均足インジケータ#4**(手動でローソク足色を比較)
- **FVGインジケータ#5**(すべてのギャップを表示、優先順位付けなし)
**結果**:5つのスクリプト、相反する情報、見逃したシグナル、遅いチャート。
**Trend Gazer v666**:5つのコンポーネント + シグナル生成がすべて**統合**。それらは通信し、相互に検証し、単一の統合ビューを提示します。
### 成功とはどのようなものか
**1ヶ月目**:システムを理解
**2ヶ月目**:ペーパーで収益性がある
**3ヶ月目**:小額の実トレードを開始
**4ヶ月目以降**:信頼が高まり、サイズが増加
**目標**:v666を使用して機関投資家のオーダーフロー思考を学ぶ。最終的には、インジケータへの依存が減り、パターン認識が増えます。
### スマートにトレード。安全にトレード。ストラクチャーでトレード。
---
**© rasukaru666 | 2025 | Mozilla Public License 2.0**
*このインジケータは、トレーディング教育コミュニティに貢献するためにオープンソースとして公開されています。役立った場合は、経験を共有し、他の人の学習を支援してください。*

WASDE DatesOverview
WASDE Dates — a small, focused event indicator that displays confirmed USDA WASDE release dates for 2025 on the chart and marks each release day. The indicator is designed to be a lightweight timing tool for traders who want clean visual reminders and optional alerts around USDA WASDE publications.
Features
• Shows official WASDE release dates for 2025 in a compact chart table.
• Draws on-chart markers and a dotted vertical line on WASDE release days.
• Two alert conditions you can enable in TradingView: "WASDE Day Alert" and "WASDE 24h Reminder".
• Simple table position control (Top/Bottom, Left/Right) in the indicator settings.
• Minimal, self-contained code — no external data feeds or permissions required.
How to use
1. Apply the indicator to any chart and timeframe.
2. Use the indicator settings to choose table position.
3. Enable Alerts (if desired) via TradingView Alerts → choose “WASDE Day Alert” or “WASDE 24h Reminder”.
4. This version contains 2025 confirmed dates only — verify dates for live trading and enable alerts as needed.
Design & rationale
This indicator is intentionally not a technical trading signal. It is an event scheduler focused on clarity and low overhead: combine it with your existing setup to avoid being surprised by WASDE publications and to quickly inspect price action around these event dates.
Limitations & disclaimer
• This script shows **confirmed 2025** WASDE dates only. It does not provide trading advice or entry/exit signals. Use at your own risk.
• Double-check official USDA publishing times before executing trades.
• No external links or contact information are included in this description to comply with TradingView publishing rules.
Feature outlook (V2)
Planned V2 (future release): enhanced countdown (days → hours/minutes), optional inclusion of estimated 2026 dates marked as (TBC), and an invite-only/protected advanced version with reaction overlays (T+1/T+3) and extended alert options. V2 will be announced on this script page when ready.
Changelog
v1 — public release: 2025 confirmed dates, release markers, alerts, table position control.