Combined EMA/Smiley & DEM System## 🔷 General Overview
This script creates an advanced technical analysis system for TradingView, combining multiple Exponential Moving Averages (EMAs), Simple Moving Averages (SMAs), dynamic Fibonacci levels, and ATR (Average True Range) analysis. It presents the results clearly through interactive, real-time tables directly on the chart.
---
## 🔹 Indicator Structure
The script consists of two main parts:
### **1. EMA & SMA Combined System with Fibonacci**
- **Purpose:**
Provides visual insights by comparing multiple EMA/SMA periods and identifying significant dynamic price levels using Fibonacci ratios around a calculated "Golden" line.
- **Components:**
- **Moving Averages (MAs)**:
- 20 EMAs (periods from 20 to 400)
- 20 SMAs (also from 20 to 400)
- **Golden Line:**
Calculated as the average of all EMAs and SMAs.
- **Dynamic Fibonacci Levels:**
Key ratios around the Golden line (0.5, 0.618, 0.786, 1.0, 1.272, 1.414, 1.618, 2.0) dynamically adjust based on market conditions.
- **Fibonacci Labels:**
Labels are shown next to Fibonacci lines, indicating their numeric value clearly on the chart.
- **Table (Top Right Corner):**
- Displays:
- **Input:** EMA/SMA periods sorted by their current average price levels.
- **AVG:** The average of corresponding EMA & SMA pairs.
- **EMA & SMA Values:** Individual EMA/SMA values clearly marked.
- **Dynamic Highlighting:** Highlights the row whose average (EMA+SMA)/2 is closest to the current price, helping identify immediate price action significance.
- **Sorting Logic:**
Each EMA/SMA pair is dynamically sorted based on their average values. Color coding (red/green) is used:
- **Green:** EMA/SMA pairs with shorter periods when their average is lower.
- **Red:** EMA/SMA pairs with longer periods when their average is lower.
- **Star (⭐):** Represents the "Golden" average clearly.
---
### **2. DEM System (Dynamic EMA/ATR Metrics)**
- **Purpose:**
Provides detailed ATR statistics to assess market volatility clearly and quickly.
- **Components:**
- **Moving Averages:**
- SMA lines: 25, 50, 100, 200.
- **Bollinger Bands:**
- Based on 20-period SMA of highs and standard deviation of lows.
- **ATR Analysis:**
- ATR calculations for multiple periods (1-day, 10, 20, 30, 40, 50).
- **ATR Premium:** Average ATR of all calculated periods, providing an overarching volatility indicator.
- **ATR Table (Bottom Right Corner):**
- Displays clearly structured ATR values and percentages relative to the current close price:
- Columns: **ATR Period**, **Value**, and **% of Close**.
- Rows: Each specific ATR (1D, 10, 20, 30, 40, 50), plus ATR premium.
- The ATR premium is highlighted in yellow to signify its importance clearly.
---
## 🔹 Key Features and Logic Explained
- **Dynamic EMA/SMA Sorting:**
The script computes the average of each EMA/SMA pair and sorts them dynamically on each bar, highlighting their relative importance visually. This allows traders to easily interpret the strength of current support/resistance levels based on moving averages.
- **Closest EMA/SMA Pair to Current Price:**
Calculates the absolute difference between the current price and all EMA/SMA averages, highlighting the closest one for quick reference.
- **Fibonacci Ratios:**
- Dynamically calculated Fibonacci levels based on the "Golden" EMA/SMA average give clear visual guidance for potential targets, supports, and resistances.
- Labels are continuously updated and placed next to levels for clarity.
- **ATR Volatility Analysis:**
- Provides immediate insight into market volatility with absolute and relative (percentage-based) ATR values.
- ATR premium summarizes volatility across multiple timeframes clearly.
---
## 🔹 Practical Use Case:
- Traders can quickly identify support/resistance and critical price zones through EMA/SMA and Fibonacci combinations.
- Useful in assessing immediate volatility, guiding stop-loss and take-profit levels through detailed ATR metrics.
- The dynamic highlighting in tables provides intuitive, real-time decision support for active traders.
---
## 🔹 How to Use this Script:
1. **Adjust EMA & SMA Lengths** from indicator settings if different periods are preferred.
2. **Monitor dynamic Fibonacci levels** around the "Golden" average to identify possible reversal or continuation points.
3. **Check EMA/SMA table:** Rows highlighted indicate immediate significance concerning current market price.
4. **ATR table:** Use volatility metrics for better risk management.
---
## 🔷 Conclusion
This advanced Pine Script indicator efficiently combines multiple EMAs, SMAs, dynamic Fibonacci retracement levels, and volatility analysis using ATR into a comprehensive real-time analytical tool, enhancing traders' decision-making capabilities by providing clear and actionable insights directly on the TradingView chart.
在腳本中搜尋"信达股份40周年"

Green*DiamondGreen*Diamond (GD1)
Unleash Dynamic Trading Signals with Volatility and Momentum
Overview
GreenDiamond is a versatile overlay indicator designed for traders seeking actionable buy and sell signals across various markets and timeframes. Combining Volatility Bands (VB) bands, Consolidation Detection, MACD, RSI, and a unique Ribbon Wave, it highlights high-probability setups while filtering out noise. With customizable signals like Green-Yellow Buy, Pullback Sell, and Inverse Pullback Buy, plus vibrant candle and volume visuals, GreenDiamond adapts to your trading style—whether you’re scalping, day trading, or swing trading.
Key Features
Volatility Bands (VB): Plots dynamic upper and lower bands to identify breakouts or reversals, with toggleable buy/sell signals outside consolidation zones.
Consolidation Detection: Marks low-range periods to avoid choppy markets, ensuring signals fire during trending conditions.
MACD Signals: Offers flexible buy/sell conditions (e.g., cross above signal, above zero, histogram up) with RSI divergence integration for precision.
RSI Filter: Enhances signals with customizable levels (midline, oversold/overbought) and bullish divergence detection.
Ribbon Wave: Visualizes trend strength using three EMAs, colored by MACD and RSI for intuitive momentum cues.
Custom Signals: Includes Green-Yellow Buy, Pullback Sell, and Inverse Pullback Buy, with limits on consecutive signals to prevent overtrading.
Candle & Volume Styling: Blends MACD/RSI colors on candles and scales volume bars to highlight momentum spikes.
Alerts: Set up alerts for VB signals, MACD crosses, Green*Diamond signals, and custom conditions to stay on top of opportunities.
How It Works
Green*Diamond integrates multiple indicators to generate signals:
Volatility Bands: Calculates bands using a pivot SMA and standard deviation. Buy signals trigger on crossovers above the lower band, sell signals on crossunders below the upper band (if enabled).
Consolidation Filter: Suppresses signals when candle ranges are below a threshold, keeping you out of flat markets.
MACD & RSI: Combines MACD conditions (e.g., cross above signal) with RSI filters (e.g., above midline) and optional volume spikes for robust signals.
Custom Logic: Green-Yellow Buy uses MACD bullishness, Pullback Sell targets retracements, and Inverse Pullback Buy catches reversals after downmoves—all filtered to avoid consolidation.
Visuals: Ribbon Wave shows trend direction, candles blend momentum colors, and volume bars scale dynamically to confirm signals.
Settings
Volatility Bands Settings:
VB Lookback Period (20): Adjust to 10–15 for faster markets (e.g., 1-minute scalping) or 25–30 for daily charts.
Upper/Lower Band Multiplier (1.0): Increase to 1.5–2.0 for wider bands in volatile stocks like AEHL; decrease to 0.5 for calmer markets.
Show Volatility Bands: Toggle off to reduce chart clutter.
Use VB Signals: Enable for breakout-focused trades; disable to focus on Green*Diamond signals.
Consolidation Settings:
Consolidation Lookback (14): Set to 5–10 for small caps (e.g., AEHL) to catch quick consolidations; 20 for higher timeframes.
Range Threshold (0.5): Lower to 0.3 for stricter filtering in choppy markets; raise to 0.7 for looser signals.
MACD Settings:
Fast/Slow Length (12/26): Shorten to 8/21 for scalping; extend to 15/34 for swing trading.
Signal Smoothing (9): Reduce to 5 for faster signals; increase to 12 for smoother trends.
Buy/Sell Signal Options: Choose “Cross Above Signal” for classic MACD; “Histogram Up” for momentum plays.
Use RSI Div + MACD Cross: Enable for high-probability reversal signals.
RSI Settings:
RSI Period (14): Drop to 10 for 1-minute charts; raise to 20 for daily.
Filter Level (50): Set to 55 for stricter buys; 45 for sells.
Overbought/Oversold (70/30): Tighten to 65/35 for small caps; widen to 75/25 for indices.
RSI Buy/Sell Options: Select “Bullish Divergence” for reversals; “Cross Above Oversold” for momentum.
Color Settings:
Adjust bullish/bearish colors for visibility (e.g., brighter green/red for dark themes).
Border Thickness (1): Increase to 2–3 for clearer candle outlines.
Volume Settings:
Volume Average Length (20): Shorten to 10 for scalping; extend to 30 for swing trades.
Volume Multiplier (2.0): Raise to 3.0 for AEHL’s volume surges; lower to 1.5 for steady stocks.
Bar Height (10%): Increase to 15% for prominent bars; decrease to 5% to reduce clutter.
Ribbon Settings:
EMA Periods (10/20/30): Tighten to 5/10/15 for scalping; widen to 20/40/60 for trends.
Color by MACD/RSI: Disable for simpler visuals; enable for dynamic momentum cues.
Gradient Fill: Toggle on for trend clarity; off for minimalism.
Custom Signals:
Enable Green-Yellow Buy: Use for momentum confirmation; limit to 1–2 signals to avoid spam.
Pullback/Inverse Pullback % (50): Set to 30–40% for small caps; 60–70% for indices.
Max Buy Signals (1): Increase to 2–3 for active markets; keep at 1 for discipline.
Tips and Tricks
Scalping Small Caps (e.g., AEHL):
Use 1-minute charts with VB Lookback = 10, Consolidation Lookback = 5, and Volume Multiplier = 3.0 to catch $0.10–$0.20 moves.
Enable Green-Yellow Buy and Inverse Pullback Buy for quick entries; disable VB Signals to focus on Green*Diamond logic.
Pair with SMC+ green boxes (if you use them) for reversal confirmation.
Day Trading:
Try 5-minute charts with MACD Fast/Slow = 8/21 and RSI Period = 10.
Enable RSI Divergence + MACD Cross for high-probability setups; set Max Buy Signals = 2.
Watch for volume bars turning yellow to confirm entries.
Swing Trading:
Use daily charts with VB Lookback = 30, Ribbon EMAs = 20/40/60.
Enable Pullback Sell (60%) to exit after rallies; disable RSI Color for cleaner candles.
Check Ribbon Wave gradient for trend strength—bright green signals strong bulls.
Avoiding Noise:
Increase Consolidation Threshold to 0.7 on volatile days to skip false breakouts.
Disable Ribbon Wave or Volume Bars if the chart feels crowded.
Limit Max Buy Signals to 1 for disciplined trading.
Alert Setup:
In TradingView’s Alerts panel, select:
“GD Buy Signal” for standard entries.
“RSI Div + MACD Cross Buy” for reversals.
“VB Buy Signal” for breakout plays.
Set to “Once Per Bar Close” for confirmed signals; “Once Per Bar” for scalping.
Backtesting:
Replay on small caps ( Float < 5M, Price $0.50–$5) to test signals.
Focus on “GD Buy Signal” with yellow volume bars and green Ribbon Wave.
Avoid signals during gray consolidation squares unless paired with RSI Divergence.
Usage Notes
Markets: Works on stocks, forex, crypto, and indices. Best for volatile assets (e.g., small-cap stocks, BTCUSD).
Timeframes: Scalping (1–5 minutes), day trading (15–60 minutes), or swing trading (daily). Adjust settings per timeframe.
Risk Management: Combine with stop-losses (e.g., 1% risk, $0.05 below AEHL entry) and take-profits (3–5%).
Customization: Tweak inputs to match your strategy—experiment in replay to find your sweet spot.
Disclaimer
Green*Diamond is a technical tool to assist with trade identification, not a guarantee of profits. Trading involves risks, and past performance doesn’t predict future results. Always conduct your own analysis, manage risk, and test settings before live trading.
Feedback
Love Green*Diamond? Found a killer setup?

DI+/- Cross Strategy with ATR SL and 2% TPDI+/- Cross Strategy with ATR Stop Loss and 2% Take Profit
📝 Script Description for Publishing:
This strategy is based on the directional movement of the market using the Average Directional Index (ADX) components — DI+ and DI- — to generate entry signals, with clearly defined risk and reward targets using ATR-based Stop Loss and Fixed Percentage Take Profit.
🔍 How it works:
Buy Signal: When DI+ crosses above 40, signaling strong bullish momentum.
Sell Signal: When DI- crosses above 40, indicating strong bearish momentum.
Stop Loss: Dynamically calculated using ATR × 1.5, to account for market volatility.
Take Profit: Fixed at 2% above/below the entry price, for consistent reward targeting.
🧠 Why it’s useful:
Combines momentum breakout logic with volatility-based risk management.
Works well on trending assets, especially when combined with higher timeframe filters.
Clean BUY and SELL visual labels make it easy to interpret and backtest.
✅ Tips for Use:
Use on assets with clear trends (e.g., major forex pairs, trending stocks, crypto).
Best on 30m – 4H timeframes, but can be customized.
Consider combining with other filters (e.g., EMA trend direction or Bollinger Bands) for even better accuracy.

Dskyz Adaptive Futures Elite (DAFE)Dskyz Adaptive Futures Edge (DAFE)
imgur.com
A Dynamic Futures Trading Strategy
DAFE adapts to market volatility and price action using technical indicators and advanced risk management. It’s built for high-stakes futures trading (e.g., MNQ, BTCUSDT.P), offering modular logic for scalpers and swing traders alike.
Key Features
Adaptive Moving Averages
Dynamic Logic: Fast and slow SMAs adjust lengths via ATR, reacting to momentum shifts and smoothing in calm markets.
Signals: Long entry on fast SMA crossing above slow SMA with price confirmation; short on cross below.
RSI Filtering (Optional)
Momentum Check: Confirms entries with RSI crossovers (e.g., above oversold for longs). Toggle on/off with custom levels.
Fine-Tuning: Adjustable lookback and thresholds (e.g., 60/40) for precision.
Candlestick Pattern Recognition
Eng|Enhanced Detection: Identifies strong bullish/bearish engulfing patterns, validated by volume and range strength (vs. 10-period SMA).
Conflict Avoidance: Skips trades if both patterns appear in the lookback window, reducing whipsaws.
Multi-Timeframe Trend Filter
15-Minute Alignment: Syncs intrabar trades with 15-minute SMA trends; optional for flexibility.
Dollar-Cost Averaging (DCA) New!
Scaling: Adds up to a set number of entries (e.g., 4) on pullbacks/rallies, spaced by ATR multiples.
Control: Caps exposure and resets on exit, enhancing trend-following potential.
Trade Execution & Risk Management
Entry Rules: Prioritizes moving averages or patterns (user choice), with volume, volatility, and time filters.
Stops & Trails:
Initial Stop: ATR-based (2–3.5x, volatility-adjusted).
Trailing Stop: Locks profits with configurable ATR offset and multiplier.
Discipline
Cooldown: Pauses post-exit (e.g., 0–5 minutes).
Min Hold: Ensures trades last a set number of bars (e.g., 2–10).
Visualization & Tools
Charts: Overlays MAs, stops, and signals; trend shaded in background.
Dashboard: Shows position, P&L, win rate, and more in real-time.
Debugging: Logs signal details for optimization.
Input Parameters
Parameter Purpose Suggested Use
Use RSI Filter - Toggle RSI confirmation *Disable 4 price-only
trading
RSI Length - RSI period (e.g., 14) *7–14 for sensitivity
RSI Overbought/Oversold - Adjust for market type *Set levels (e.g., 60/40)
Use Candlestick Patterns - Enables engulfing signals *Disable for MA focus
Pattern Lookback - Pattern window (e.g., 19) *10–20 bars for balance
Use 15m Trend Filter - Align with 15-min trend *Enable for trend trades
Fast/Slow MA Length - Base MA lengths (e.g., 9/19) *10–25 / 30–60 per
timeframe
Volatility Threshold - Filters volatile spikes *Max ATR/close (e.g., 1%)
Min Volume - Entry volume threshold *Avoid illiquid periods
(e.g., 10)
ATR Length - ATR period (e.g., 14) *Standard volatility
measure
Trailing Stop ATR Offset - Trail distance (e.g., 0.5) *0.5–1.5 for tightness
Trailing Stop ATR Multi - Trail multiplier (e.g., 1.0) *1–3 for trend room
Cooldown Minutes - Post-exit pause (e.g., 0–5) *Prevents overtrading
Min Bars to Hold - Min trade duration (e.g., 2) *5–10 for intraday
Trading Hours - Active window (e.g., 9–16) *Focus on key sessions
Use DCA - Toggle DCA *Enable for scaling
Max DCA Entries - Cap entries (e.g., 4) *Limit risk exposure
DCA ATR Multiplier Entry spacing (e.g., 1.0) *1–2 for wider gaps
Compliance
Realistic Testing: Fixed quantities, capital, and slippage for accurate backtests.
Transparency: All logic is user-visible and adjustable.
Risk Controls: Cooldowns, stops, and hold periods ensure stability.
Flexibility: Adapts to various futures and timeframes.
Summary
DAFE excels in volatile futures markets with adaptive logic, DCA scaling, and robust risk tools. Currently in prop account testing, it’s a powerful framework for precision trading.
Caution
DAFE is experimental, not a profit guarantee. Futures trading risks significant losses due to leverage. Backtest, simulate, and monitor actively before live use. All trading decisions are your responsibility.

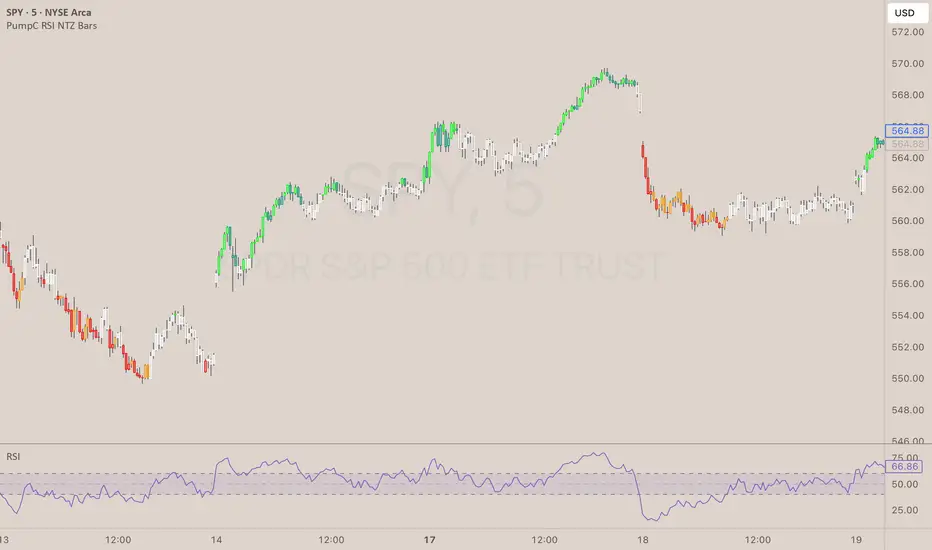
PumpC RSI NTZ BarsPumpC RSI NTZ Bars — Slope-Aware RSI Momentum Overlay
The PumpC RSI NTZ Bars indicator builds on the classic RSI by combining it with slope detection and custom bar highlighting, helping traders quickly identify strong momentum breakouts while avoiding sideways chop — the (NTZ) or No Trade Zone .
What is (NTZ)?
(NTZ) stands for No Trade Zone — the neutral RSI area between bullish and bearish thresholds. In this zone, RSI lacks directional strength, which often reflects indecision or consolidation in price. This indicator helps visually separate the chop from true momentum, so you can trade the breakout, not the noise .
Core Features
Dynamic RSI-Based Bar Coloring with Slope Awareness
Bars change color based on RSI value and its slope:
Bright Green: RSI ≥ Bullish Threshold and sloping upward
Teal Green: RSI ≥ Bullish Threshold but sloping downward
Bright Red: RSI ≤ Bearish Threshold and sloping downward
Orange: RSI ≤ Bearish Threshold but sloping upward
White: RSI is between thresholds (NTZ)
Slope Detection Logic
RSI slope is used to confirm directional bias and filter out weak or fading momentum.
Clean Visual Integration
Choose how signals appear: full bar color, border-only style, background shading, or a mix of all three.
RSI Smoothing Option
Optional smoothing to reduce noise — especially useful on faster timeframes.
Built-In Alerts
RSI crossing above the bullish threshold with an upward slope
RSI crossing below the bearish threshold with a downward slope
User Inputs & Customization Options
RSI Length: Default 14
RSI Source: Default Close
Smooth RSI: On or Off
Smoothing Length: Default 2
Bullish Threshold: Default 60
Bearish Threshold: Default 40
Bar Highlight Style: Full Bar or Border Only
Display Mode: Bar Color, Background, or Both
How to Use It
Step 1 – Adjust Your RSI Settings:
Start by setting the RSI Length (default is 14) and choosing which price source to use — typically close , but you can experiment with hl2 , ohlc4 , etc.
You can also turn on smoothing if you want to reduce noise, especially on fast timeframes like the 1m or 5m chart.
Step 2 – Define Your No Trade Zone (NTZ):
The NTZ is the space between the bullish and bearish thresholds (default 60 and 40).
This is where momentum is weak and price is often ranging or chopping. You don’t want to trade in this zone — you're waiting for RSI to break out of it with conviction.
Step 3 – Choose Your Visual Style:
You can choose to: Highlight the entire candle (Full Bar)
Just highlight the outline (Border Only)
Add a background color behind the chart
Or use a combination of the above This makes the signal easy to see without changing your whole chart look.
Step 4 – Read the Colors for Quick Clarity:
Bright Green / Bright Red = Strong Momentum (with RSI slope confirmation)
Teal / Orange = Momentum is weakening — RSI value is above/below threshold but losing slope strength
White = RSI is in the No Trade Zone (NTZ) — not enough strength to trade
Use this color feedback to stay out during weak periods and act when the trend gains strength.
Step 5 – Use Alerts for Clean Signals:
Set alerts when RSI breaks out of the NTZ with slope confirmation .
These are high-quality signals you can use to trigger your setups or review potential entries.
Disclaimer
This indicator is for educational and informational purposes only and should not be considered financial advice. Always combine tools like this with proper market context and risk management.
RSI + ADX + ATR Combo Indicator: RSI + ADX + ATR Combo Filter
This indicator is a confluence filter tool that combines RSI, ADX, and ATR into a single, easy-to-read chart overlay. It is designed to help traders identify low-volatility, non-trending zones with balanced momentum—ideal for strategies that rely on breakouts or reversals.
🔍 Core Components:
RSI (Relative Strength Index)
Standard RSI with custom upper and lower bounds (default: 60 and 40).
Filters out extreme overbought/oversold regions and focuses on price consolidation zones.
ADX (Average Directional Index)
Measures trend strength.
When ADX is below a custom threshold (default: 20), it indicates a weak or range-bound trend.
ATR (Average True Range)
Represents volatility.
Low ATR values (default threshold: 2.5) are used to filter out high-volatility environments, helping refine entries.
🟣 Signal Logic:
A signal is highlighted with a background color when all three conditions are met:
RSI is between lower and upper bounds (e.g., 40 < RSI < 60) ✅
ADX is below the trend threshold (e.g., ADX < 20) ✅
ATR is below the volatility threshold (e.g., ATR < 2.5) ✅
These combined conditions suggest a low-volatility, low-trend strength, and balanced momentum zone—perfect for anticipating breakouts or strong directional moves.

Normalized VolumeOVERVIEW
The Normalized Volume (NV) is an attempt at visualizing volume in a format that is more understandable by placing the values on a scale of 0 to 100. 0 in this case is the lowest volume candle available on the chart, and 100 being the highest. Calling a candle “high volume” can be misleading without having something to compare to. For example, in scaling the volume this way we can clearly see that a given candle had 80% of the peak volume or 20%, and gauge the validity of price moves more accurately.
FEATURES
NV by session
Allows user to filter the volume values across 4 different sessions. This can add context to the volume output, because what it high volume during London session may not be high volume relative to New York session.
Overlay plotting
When volume boxes are turned on, this will allow you to toggle how they are plotted.
Color theme
A standard color theme will color the NV based on if the respective candle closed green or red. Selecting variables will color the NV plot based on which range the value falls within.
Session inputs
Activated with the “By session?” Input. Allows user to break the day up into 4 sessions to more accurately gauge volume relative to time of day.
Show Box (X)
Toggles on chart boxes on and off.
Show historical boxes
Will plot prior occurrences of selected volume boxes, deleting them when price fully moves through them in the opposite direction of the initial candle.
Color inputs
Allows for intensive customization in how this tool appears visually.
INTERPRETATION
There are 6 pre-defined ranges that NV can fall within.
NV <= 10
Volume is insignificant
In this range, volume should not be a confirmation in your trading strategy.
NV > 10 and <= 20
Volume is low
In this range, volume should not be a confirmation in your trading strategy.
NV > 20 and <= 40
Volume is fair
In this range, volume should not be the primary confirmation in your trading strategy.
NV > 40 and <= 60
Volume is high
In this range, volume can be the primary confirmation in your trading strategy.
NV > 60 and <= 80
Volume is very high
In this range, volume can be the primary confirmation in your trading strategy.
NV > 80
Volume is extreme
In this range, volume is likely news driven and caution should be taken. High price volatility possible.
To utilize this tool in conjunction with your current strategy, follow the range explanations above section in this section. The higher the NV value, the stronger you can feel about your directional confirmation.
If NV = 100, this means that the highest volume candle occurred up to that point on your selected timeframe. All future data points will be weighed off of this value.
LIMITATIONS
This tool will not load on tickers that do not have volume data, such as VIX.
STRATEGY
The Normalized Volume plot can be used in exactly the same way as you would normally utilize volume in your trading strategy. All we are doing is weighing the volume relative to itself.
Volume boxes can be used as targets to be filled in a similar way to commonly used “fair value gap” strategies. To utilize this strategy, I recommend selecting “Plot to Wicks” in Overlay Plotting and toggling on Show Historical Boxes.
Volume boxes can be used as areas for entry in a similar way to commonly used “order block” strategies. To utilize this strategy, I recommend selecting “Open To Close” in Overlay Plotting.
NOTES
You are able to plot an info label on right side of NV plot using the "Toggle box label" input. When a box is toggled on this label will tell you when the most recent box of that intensity occurred.
This tool is deeply visually customizable, with the ability to adjust line width for plotted boxes, all colors on both box overlays, and all colors on NV panel. Customize it to your liking!
I have a handful of additional features that I plan on adding to this tool in future updates. If there is anything you would like to see added, any bugs you identify, or any strategies you encounter with this tool, I would love to hear from you!
Huge shoutout to @joebaus for assisting in bringing this tool to life, please check out his work here on TradingView!

*Auto Backtest & Optimize EngineFull-featured Engine for Automatic Backtesting and parameter optimization. Allows you to test millions of different combinations of stop-loss and take profit parameters, including on any connected indicators.
⭕️ Key Futures
Quickly identify the optimal parameters for your strategy.
Automatically generate and test thousands of parameter combinations.
A simple Genetic Algorithm for result selection.
Saves time on manual testing of multiple parameters.
Detailed analysis, sorting, filtering and statistics of results.
Detailed control panel with many tooltips.
Display of key metrics: Profit, Win Rate, etc..
Comprehensive Strategy Score calculation.
In-depth analysis of the performance of different types of stop-losses.
Possibility to use to calculate the best Stop-Take parameters for your position.
Ability to test your own functions and signals.
Customizable visualization of results.
Flexible Stop-Loss Settings:
• Auto ━ Allows you to test all types of Stop Losses at once(listed below).
• S.VOLATY ━ Static stop based on volatility (Fixed, ATR, STDEV).
• Trailing ━ Classic trailing stop following the price.
• Fast Trail ━ Accelerated trailing stop that reacts faster to price movements.
• Volatility ━ Dynamic stop based on volatility indicators.
• Chandelier ━ Stop based on price extremes.
• Activator ━ Dynamic stop based on SAR.
• MA ━ Stop based on moving averages (9 different types).
• SAR ━ Parabolic SAR (Stop and Reverse).
Advanced Take-Profit Options:
• R:R: Risk/Reward ━ sets TP based on SL size.
• T.VOLATY ━ Calculation based on volatility indicators (Fixed, ATR, STDEV).
Testing Modes:
• Stops ━ Cyclical stop-loss testing
• Pivot Point Example ━ Example of using pivot points
• External Example ━ Built-in example how test functions with different parameters
• External Signal ━ Using external signals
⭕️ Usage
━ First Steps:
When opening, select any point on the chart. It will not affect anything until you turn on Manual Start mode (more on this below).
The chart will immediately show the best results of the default Auto mode. You can switch Part's to try to find even better results in the table.
Now you can display any result from the table on the chart by entering its ID in the settings.
Repeat steps 3-4 until you determine which type of Stop Loss you like best. Then set it in the settings instead of Auto mode.
* Example: I flipped through 14 parts before I liked the first result and entered its ID so I could visually evaluate it on the chart.
Then select the stop loss type, choose it in place of Auto mode and repeat steps 3-4 or immediately follow the recommendations of the algorithm.
Now the Genetic Algorithm at the bottom right will prompt you to enter the Parameters you need to search for and select even better results.
Parameters must be entered All at once before they are updated. Enter recommendations strictly in fields with the same names.
Repeat steps 5-6 until there are approximately 10 Part's left or as you like. And after that, easily pour through the remaining Parts and select the best parameters.
━ Example of the finished result.
━ Example of use with Takes
You can also test at the same time along with Take Profit. In this example, I simply enabled Risk/Reward mode and immediately specified in the TP field Maximum RR, Minimum RR and Step. So in this example I can test (3-1) / 0.1 = 20 Takes of different sizes. There are additional tips in the settings.
━
* Soon you will start to understand how the system works and things will become much easier.
* If something doesn't work, just reset the engine settings and start over again.
* Use the tips I have left in the settings and on the Panel.
━ Details:
Sort ━ Sorting results by Score, Profit, Trades, etc..
Filter ━ Filtring results by Score, Profit, Trades, etc..
Trade Type ━ Ability to disable Long\Short but only from statistics.
BackWin ━ Backtest Window Number of Candle the script can test.
Manual Start ━ Enabling it will allow you to call a Stop from a selected point. which you selected when you started the engine.
* If you have a real open position then this mode can help to save good Stop\Take for it.
1 - 9 Сheckboxs ━ Allow you to disable any stop from Auto mode.
Ex Source - Allow you to test Stops/Takes from connected indicators.
Connection guide:
//@version=6
indicator("My script")
rsi = ta.rsi(close, 14)
buy = not na(rsi) and ta.crossover (rsi, 40) // OS = 40
sell = not na(rsi) and ta.crossunder(rsi, 60) // OB = 60
Signal = buy ? +1 : sell ? -1 : 0
plot(Signal, "🔌Connector🔌", display = display.none)
* Format the signal for your indicator in a similar style and then select it in Ex Source.
⭕️ How it Works
Hypothesis of Uniform Distribution of Rare Elements After Mixing.
'This hypothesis states that if an array of N elements contains K valid elements, then after mixing, these valid elements will be approximately uniformly distributed.'
'This means that in a random sample of k elements, the proportion of valid elements should closely match their proportion in the original array, with some random variation.'
'According to the central limit theorem, repeated sampling will result in an average count of valid elements following a normal distribution.'
'This supports the assumption that the valid elements are evenly spread across the array.'
'To test this hypothesis, we can conduct an experiment:'
'Create an array of 1,000,000 elements.'
'Select 1,000 random elements (1%) for validation.'
'Shuffle the array and divide it into groups of 1,000 elements.'
'If the hypothesis holds, each group should contain, on average, 1~ valid element, with minor variations.'
* I'd like to attach more details to My hypothesis but it won't be very relevant here. Since this is a whole separate topic, I will leave the minimum part for understanding the engine.
Practical Application
To apply this hypothesis, I needed a way to generate and thoroughly mix numerous possible combinations. Within Pine, generating over 100,000 combinations presents significant challenges, and storing millions of combinations requires excessive resources.
I developed an efficient mechanism that generates combinations in random order to address these limitations. While conventional methods often produce duplicates or require generating a complete list first, my approach guarantees that the first 10% of possible combinations are both unique and well-distributed. Based on my hypothesis, this sampling is sufficient to determine optimal testing parameters.
Most generators and randomizers fail to accommodate both my hypothesis and Pine's constraints. My solution utilizes a simple Linear Congruential Generator (LCG) for pseudo-randomization, enhanced with prime numbers to increase entropy during generation. I pre-generate the entire parameter range and then apply systematic mixing. This approach, combined with a hybrid combinatorial array-filling technique with linear distribution, delivers excellent generation quality.
My engine can efficiently generate and verify 300 unique combinations per batch. Based on the above, to determine optimal values, only 10-20 Parts need to be manually scrolled through to find the appropriate value or range, eliminating the need for exhaustive testing of millions of parameter combinations.
For the Score statistic I applied all the same, generated a range of Weights, distributed them randomly for each type of statistic to avoid manual distribution.
Score ━ based on Trade, Profit, WinRate, Profit Factor, Drawdown, Sharpe & Sortino & Omega & Calmar Ratio.
⭕️ Notes
For attentive users, a little tricks :)
To save time, switch parts every 3 seconds without waiting for it to load. After 10-20 parts, stop and wait for loading. If the pause is correct, you can switch between the rest of the parts without loading, as they will be cached. This used to work without having to wait for a pause, but now it does slower. This will save a lot of time if you are going to do a deeper backtest.
Sometimes you'll get the error “The scripts take too long to execute.”
For a quick fix you just need to switch the TF or Ticker back and forth and most likely everything will load.
The error appears because of problems on the side of the site because the engine is very heavy. It can also appear if you set too long a period for testing in BackWin or use a heavy indicator for testing.
Manual Start - Allow you to Start you Result from any point. Which in turn can help you choose a good stop-stick for your real position.
* It took me half a year from idea to current realization. This seems to be one of the few ways to build something automatic in backtest format and in this particular Pine environment. There are already better projects in other languages, and they are created much easier and faster because there are no limitations except for personal PC. If you see solutions to improve this system I would be glad if you share the code. At the moment I am tired and will continue him not soon.
Also You can use my previosly big Backtest project with more manual settings(updated soon)

[3Commas] Turtle StrategyTurtle Strategy
🔷 What it does: This indicator implements a modernized version of the Turtle Trading Strategy, designed for trend-following and automated trading with webhook integration. It identifies breakout opportunities using Donchian channels, providing entry and exit signals.
Channel 1: Detects short-term breakouts using the highest highs and lowest lows over a set period (default 20).
Channel 2: Acts as a confirmation filter by applying an offset to the same period, reducing false signals.
Exit Channel: Functions as a dynamic stop-loss (wait for candle close), adjusting based on market structure (default 10 periods).
Additionally, traders can enable a fixed Take Profit level, ensuring a systematic approach to profit-taking.
🔷 Who is it for:
Trend Traders: Those looking to capture long-term market moves.
Bot Users: Traders seeking to automate entries and exits with bot integration.
Rule-Based Traders: Operators who prefer a structured, systematic trading approach.
🔷 How does it work: The strategy generates buy and sell signals using a dual-channel confirmation system.
Long Entry: A buy signal is generated when the close price crosses above the previous high of Channel 1 and is confirmed by Channel 2.
Short Entry: A sell signal occurs when the close price falls below the previous low of Channel 1, with confirmation from Channel 2.
Exit Management: The Exit Channel acts as a trailing stop, dynamically adjusting to price movements. To exit the trade, wait for a full bar close.
Optional Take Profit (%): Closes trades at a predefined %.
🔷 Why it’s unique:
Modern Adaptation: Updates the classic Turtle Trading Strategy, with the possibility of using a second channel with an offset to filter the signals.
Dynamic Risk Management: Utilizes a trailing Exit Channel to help protect gains as trades move favorably.
Bot Integration: Automates trade execution through direct JSON signal communication with your DCA Bots.
🔷 Considerations Before Using the Indicator:
Market & Timeframe: Best suited for trending markets; higher timeframes (e.g., H4, D1) are recommended to minimize noise.
Sideways Markets: In choppy conditions, breakouts may lead to false signals—consider using additional filters.
Backtesting & Demo Testing: It is crucial to thoroughly backtest the strategy and run it on a demo account before risking real capital.
Parameter Adjustments: Ensure that commissions, slippage, and position sizes are set accurately to reflect real trading conditions.
🔷 STRATEGY PROPERTIES
Symbol: BINANCE:ETHUSDT (Spot).
Timeframe: 4h.
Test Period: All historical data available.
Initial Capital: 10000 USDT.
Order Size per Trade: 1% of Capital, you can use a higher value e.g. 5%, be cautious that the Max Drawdown does not exceed 10%, as it would indicate a very risky trading approach.
Commission: Binance commission 0.1%, adjust according to the exchange being used, lower numbers will generate unrealistic results. By using low values e.g. 5%, it allows us to adapt over time and check the functioning of the strategy.
Slippage: 5 ticks, for pairs with low liquidity or very large orders, this number should be increased as the order may not be filled at the desired level.
Margin for Long and Short Positions: 100%.
Indicator Settings: Default Configuration.
Period Channel 1: 20.
Period Channel 2: 20.
Period Channel 2 Offset: 20.
Period Exit: 10.
Take Profit %: Disable.
Strategy: Long & Short.
🔷 STRATEGY RESULTS
⚠️Remember, past results do not guarantee future performance.
Net Profit: +516.87 USDT (+5.17%).
Max Drawdown: -100.28 USDT (-0.95%).
Total Closed Trades: 281.
Percent Profitable: 40.21%.
Profit Factor: 1.704.
Average Trade: +1.84 USDT (+1.80%).
Average # Bars in Trades: 29.
🔷 How to Use It:
🔸 Adjust Settings:
Select your asset and timeframe suited for trend trading.
Adjust the periods for Channel 1, Channel 2, and the Exit Channel to align with the asset’s historical behavior. You can visualize these channels by going to the Style tab and enabling them.
For example, if you set Channel 2 to 40 with an offset of 40, signals will take longer to appear but will aim for a more defined trend.
Experiment with different values, a possible exit configuration is using 20 as well. Compare the results and adjust accordingly.
Enable the Take Profit (%) option if needed.
🔸Results Review:
It is important to check the Max Drawdown. This value should ideally not exceed 10% of your capital. Consider adjusting the trade size to ensure this threshold is not surpassed.
Remember to include the correct values for commission and slippage according to the symbol and exchange where you are conducting the tests. Otherwise, the results will not be realistic.
If you are satisfied with the results, you may consider automating your trades. However, it is strongly recommended to use a small amount of capital or a demo account to test proper execution before committing real funds.
🔸Create alerts to trigger the DCA Bot:
Verify Messages: Ensure the message matches the one specified by the DCA Bot.
Multi-Pair Configuration: For multi-pair setups, enable the option to add the symbol in the correct format.
Signal Settings: Enable the option to receive long or short signals (Entry | TP | SL), copy and paste the messages for the DCA Bots configured.
Alert Setup:
When creating an alert, set the condition to the indicator and choose "alert() function call only".
Enter any desired Alert Name.
Open the Notifications tab, enable Webhook URL, and paste the Webhook URL.
For more details, refer to the section: "How to use TradingView Custom Signals".
Finalize Alerts: Click Create, you're done! Alerts will now be sent automatically in the correct format.
🔷 INDICATOR SETTINGS
Period Channel 1: Period of highs and lows to trigger signals
Period Channel 2: Period of highs and lows to filter signals
Offset: Move Channel 2 to the right x bars to try to filter out the favorable signals.
Period Exit: It is the period of the Donchian channel that is used as trailing for the exits.
Strategy: Order Type direction in which trades are executed.
Take Profit %: When activated, the entered value will be used as the Take Profit in percentage from the entry price level.
Use Custom Test Period: When enabled signals only works in the selected time window. If disabled it will use all historical data available on the chart.
Test Start and End: Once the Custom Test Period is enabled, here you select the start and end date that you want to analyze.
Check Messages: Check Messages: Enable this option to review the messages that will be sent to the bot.
Entry | TP | SL: Enable this options to send Buy Entry, Take Profit (TP), and Stop Loss (SL) signals.
Deal Entry and Deal Exit: Copy and paste the message for the deal start signal and close order at Market Price of the DCA Bot. This is the message that will be sent with the alert to the Bot, you must verify that it is the same as the bot so that it can process properly.
DCA Bot Multi-Pair: You must activate it if you want to use the signals in a DCA Bot Multi-pair in the text box you must enter (using the correct format) the symbol in which you are creating the alert, you can check the format of each symbol when you create the bot.
👨🏻💻💭 We hope this tool helps enhance your trading. Your feedback is invaluable, so feel free to share any suggestions for improvements or new features you'd like to see implemented.
__
The information and publications within the 3Commas TradingView account are not meant to be and do not constitute financial, investment, trading, or other types of advice or recommendations supplied or endorsed by 3Commas and any of the parties acting on behalf of 3Commas, including its employees, contractors, ambassadors, etc.

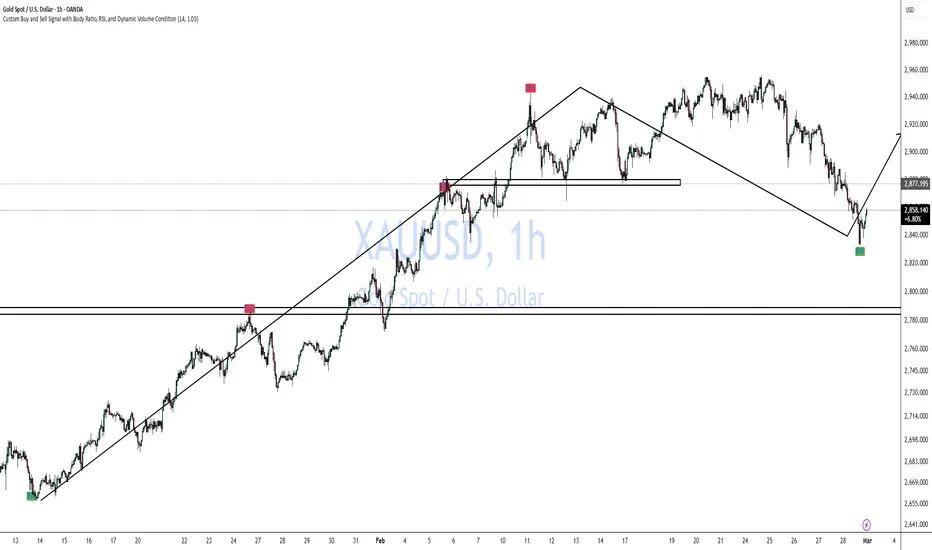
Custom Buy and Sell Signal with Body Ratio and RSI
Indicator Overview:
Name: Custom Buy and Sell Signal with Body Ratio and RSI
Description: This indicator is designed to detect buy and sell opportunities by analyzing the body size and wicks of candles in combination with the RSI indicator and volume. It helps identify trend reversals under high-volume market conditions, which enhances the reliability of the signals.
Indicator Features:
RSI (Relative Strength Index): The RSI indicator is used to assess oversold (RSI < 40) or overbought (RSI > 60) conditions. These zones signal potential reversals when combined with other technical signals.
Candle Body Analysis:
The indicator compares the size of the current and previous candles to validate signals.
For a buy signal, the current candle must be bullish and have a body size proportional to that of the previous bearish candle.
Similarly, for a sell signal, the current candle must be bearish with a body size comparable to the previous bullish candle.
Wick Validation:
The indicator analyzes the wick length to reinforce or exclude signals.
For a buy signal, the lower wick of the bullish candle must be shorter than that of the previous bearish candle.
For a sell signal, the upper wick of the bearish candle must be shorter than that of the previous bullish candle and smaller than 30% of the candle's body.
High Volume:
Signals are only generated when the volume exceeds a certain threshold, ensuring that signals are issued in active market conditions.
The minimum volume should be adjusted based on the asset. For example, for gold, a minimum volume of 9000 is recommended.
Trading Strategy:
Buy Signals:
A bearish (red) candle is followed by a bullish (green) candle with a body size that is comparable to the previous candle (0.9 to 3 times the body size).
The lower wick of the bullish candle is shorter than that of the previous bearish candle, confirming the validity of the signal.
The RSI must be below 40, indicating an oversold condition.
The volume must exceed the defined threshold (e.g., > 9000 for gold) to confirm an active market.
Sell Signals:
A bullish (green) candle is followed by a bearish (red) candle with a comparable body size.
The upper wick of the bearish candle must be shorter than that of the previous bullish candle and must not exceed 30% of the body size.
The RSI must be above 60, indicating an overbought condition.
The volume must also exceed the minimum threshold for a valid signal.
Usage Guidelines:
Volume Adjustment: It is crucial to adjust the volume threshold depending on the asset you're trading. For example, for assets like gold, a minimum volume of 9000 is recommended to filter out weak signals. Each asset has a different volume dynamic, so test different thresholds on historical data to find the optimal setting.
Time Frame:
It is recommended to use this indicator on a 1-hour (1H) chart for the best signal relevance. This time frame provides a good balance between reactivity and filtering false signals.
Confluence:
Combine the signals from this indicator with other tools like support and resistance levels, moving averages, or chart patterns to increase your chances of success. Confluence of indicators improves the reliability of signals.
Risk Management:
Implement strict risk management. Use stop-losses based on volatility, such as ATR (Average True Range), or the wick size to determine exit points.
Backtesting:
Before using it live, conduct backtesting on various assets to fine-tune the parameters, especially the volume threshold, and to verify performance across different market conditions.
This indicator is an excellent tool for traders looking to identify trend reversals based on solid technical criteria such as RSI, candle structure, and volume. It is particularly effective on volatile assets with precise volume adjustment.
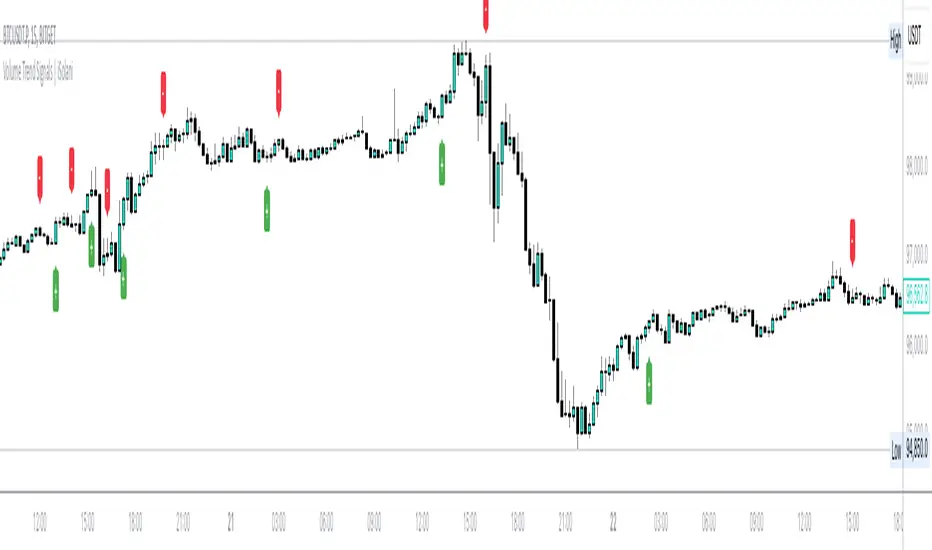
Volume Trend Signals | iSolani
Volume Trend Signals | iSolani: Syncing Price Momentum with Volume Confirmation
In the dance between price action and volume, discerning true trend commitment requires seeing how institutional players vote with their capital. The Volume Trend Signals | iSolani illuminates this interplay by generating precise crossover signals when volume-accelerated price movements gain sustained traction. Unlike conventional volume oscillators, it employs a two-layered confirmation system —blending volatility-adjusted thresholds with adaptive smoothing—to spotlight high-probability entries aligned with smart-money activity.
Core Methodology
The indicator executes a five-phase process to filter meaningful trends:
Logarithmic Price Scaling: Measures percentage-based price changes via HLC3 typical price, reducing large-value bias in volatile markets.
Volatility Dynamic Filter: Uses a 30-bar standard deviation of price changes, scaled by user sensitivity (default 2x), to set momentum thresholds.
Volume Governance: Caps raw volume at 3x its 40-bar SMA, neutralizing outlier spikes while preserving institutional footprints.
Directional Flow Accumulation: Sums volume as positive/negative based on whether price movement breaches volatility-derived boundaries.
Signal Refinement: Smooths the Volume Flow Indicator (VFI) with a 3-bar SMA, then triggers alerts via crosses over a 20-bar EMA signal line.
Breaking New Ground
This tool introduces three evolutionary improvements over traditional volume indicators:
EMA Convergence Signals: Unlike basic zero-cross systems, it requires VFI to overtake its own EMA, confirming sustained momentum shifts.
Context-Aware Volume: The 3x volume cap adapts to current market activity, preventing false signals during news-driven liquidity spikes.
Minimalist Visual Alerts: Uses and symbols below/above candles, reducing chart clutter while emphasizing pivotal moments.
Engine Under the Hood
The script’s logic flows through four computational stages:
Data Conditioning: Computes HLC3 and its log-based rate of change for normalized price analysis.
Threshold Calibration: Derives dynamic entry/exit levels from 30-period volatility multiplied by user sensitivity.
Volume Processing: Filters and signs volume based on price meeting threshold criteria.
Signal Generation: Triggers buy/sell labels when the 3-bar SMA of cumulative flow crosses the 20-bar EMA.
Standard Configuration
Optimized defaults balance responsiveness and reliability:
VFI Length: 40-bar accumulation window
Sensitivity: 2.0 (double the volatility-derived threshold)
Signal Smoothing: 20-bar EMA
Volume Cap: 3x average (hidden parameter)
Smoothing: Enabled (3-bar SMA on VFI)
By fusing adaptive volume filtering with EMA-confirmed momentum, the Volume Trend Signals | iSolani cuts through market noise to reveal institutional-grade trend inflection points. Its unique crossover logic—prioritizing confirmation over speed—makes it particularly effective in swing trading and trend-following strategies across equities, commodities, and forex markets.
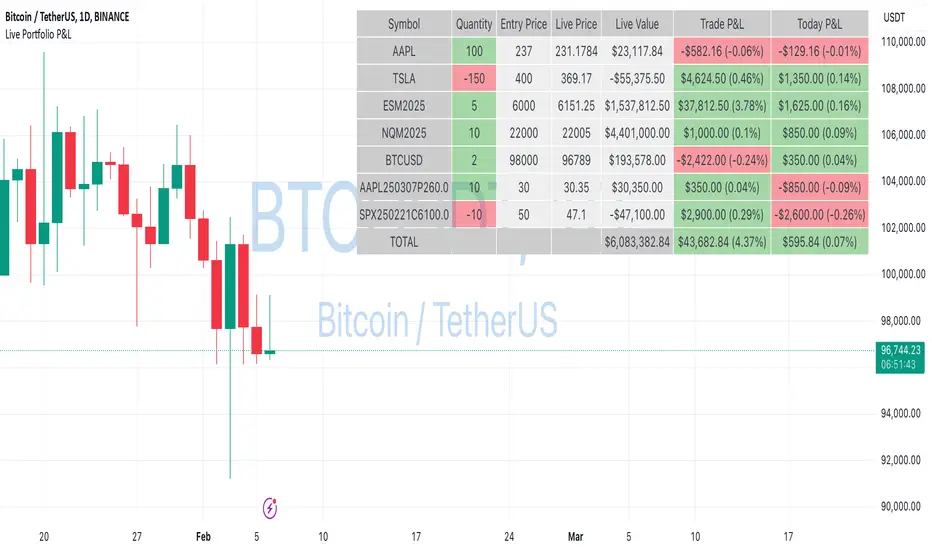
Live Portfolio P<his script calculates live P&L (Profit & Loss) for up to 40 instruments — stocks, ETFs, options, futures, and Forex pairs supported by TradingView. Instead of juggling numerous inputs, you paste your portfolio in CSV format into a single text field, and the script handles the rest. It parses each position and displays a comprehensive table showing the symbol, current price, position value, total P&L, and today’s P&L—all updated in real time.
Key Features
CSV Portfolio Input – Effortlessly import all your positions at once without filling in multiple fields. You can export the position from your broker, save it in the required format, and paste it into this script.
Supports Various Asset Classes – Works with any instrument that TradingView provides data for, including futures, options, and Forex.
Up to 40 Instruments – Track a broad and diverse set of holdings in one place.
Real-Time Updates – Get immediate feedback on live price changes, total value, and current P&L.
Today’s P&L – Monitor your daily performance to gauge short-term trends.
CSV is consumed in the following format:
Symbol (supported TradingView instruments)
Entry Price
Quantity (negative for short position)
Lot Size (for futures/options, it might not be one)
For example:
AAPL,237,100,1
TSLA,400,-150,1
ESM2025,6000,5,50
Planned Enhancements
Multi-Currency Support – Automatically convert and display your positions’ values in different currencies.
Advanced Metrics – Get deeper insights with calculations for drawdown, Sharpe ratio, and more.
Risk Management Tools – Set stop-loss and take-profit levels and receive alerts when thresholds are hit.
Option Greeks & Margin Calculations – Manage complex option strategies and track margin requirements.
Questions for You
What additional features would you like to see?
Are there any specific metrics or analytics you’d find especially valuable?
How might this script fit into your current trading workflow?
Feel free to share your thoughts and suggestions. Your feedback will help shape future updates and make this tool even more helpful for traders like you!
Disclaimer
Please remember that past performance may not be indicative of future results.
Due to various factors, including changing market conditions, the strategy may no longer perform as well as in historical backtesting.
This post and the script don’t provide any financial advice.
Closing Prices for Indices AMMOthe "Closing Prices for Indices" indicator displays the daily closing prices of four major stock indices: FTSE 100, DAX 40, Dow Jones Industrial Average, and NASDAQ Composite. The indicator updates the prices based on their respective market closing times:
FTSE 100 and DAX 40: Updates at 4:30 PM UK time.
Dow Jones and NASDAQ Composite: Updates at 9:00 PM UK time.
Key features:
Customizable Labels: Option to display labels showing the closing prices directly on the chart.
Color-Coded Lines: Plots each index's closing price using distinct, customizable colors for easy differentiation.
User-Friendly Settings: Includes options for customizing line and label colors.
This indicator is perfect for traders and analysts looking to monitor and compare key index closing prices visually on their charts.

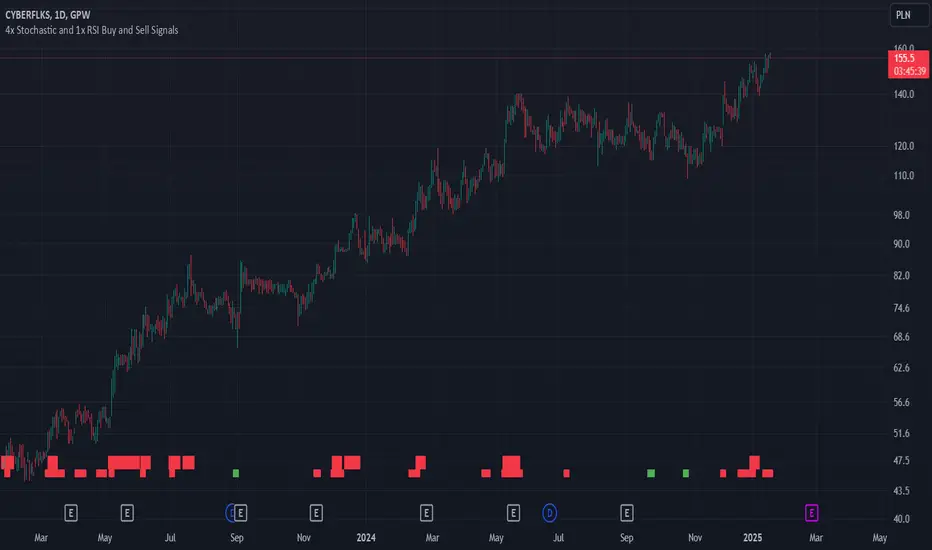
4x Stochastic and 1x RSI Buy and Sell SignalsBuy signal (green), when Stochastic 9, 14, 40 and 60 are bellow 20.
Sell signal (red), when Stochastic 9, 14, 40 and 60 are above 80.
Buy signal is larger, when RSI is also bellow 30.
Sell signal is larger, when RSI is also above 70.
Using RSI is optional and can be disabled.
Use this signals when confirmed by another indicators, like support and resistance levels, EMAs and fundamental analysis.
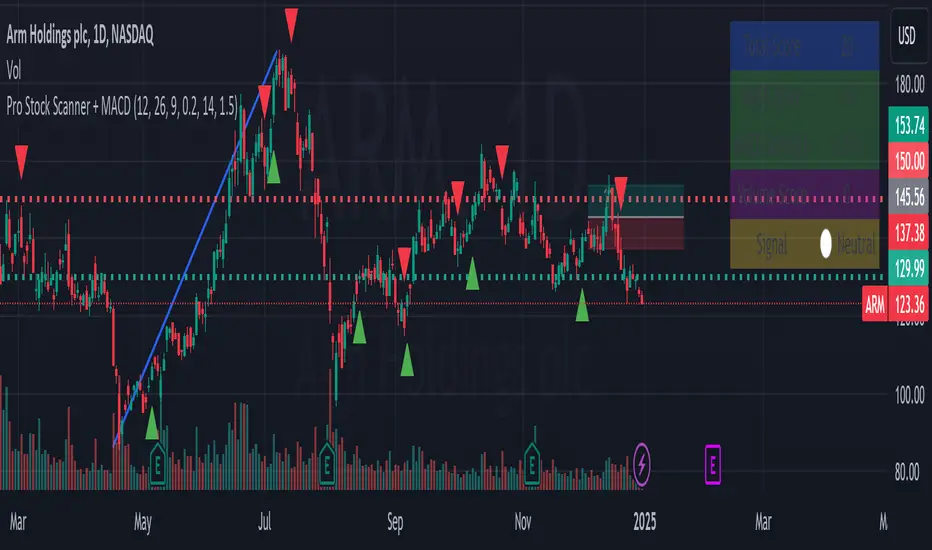
Pro Stock Scanner + MACD# Pro Stock Scanner - Advanced Trading System
### Professional Scanning System Combining MACD, Momentum & Technical Analysis
## 🎯 Indicator Purpose
This indicator was developed to identify high-quality trading opportunities by combining:
- Strong positive momentum
- Clear technical trend
- Significant trading volume
- Precise MACD signals
## 💡 Core Mechanics
The indicator is based on three core components:
### 1. Advanced MACD Analysis (40%)
- MACD line crossover tracking
- Momentum strength measurement
- Positive/negative divergence detection
- Score range: 0-40 points
### 2. Trend Analysis (40%)
- Moving average relationships (MA20, MA50)
- Primary trend direction
- Current trend strength
- Score range: 0-40 points
### 3. Volume Analysis (20%)
- Comparison with 20-day average volume
- Volume breakout detection
- Score range: 0-20 points
## 📊 Scoring System
Total score (0-100) composition:
```
Total Score = MACD Score (40%) + Trend Score (40%) + Volume Score (20%)
```
### Score Interpretation:
- 80-100: Strong Buy Signal 🔥
- 65-79: Developing Bullish Trend ⬆️
- 50-64: Neutral ↔️
- 0-49: Technical Weakness ⬇️
## 📈 Chart Markers
1. **Large Blue Triangle**
- High score (80+)
- Positive MACD
- Bullish MACD crossover
2. **Small Triangles**
- Green: Bullish MACD crossover
- Red: Bearish MACD crossover
## 🎛️ Customizable Parameters
```
MACD Settings:
- Fast Length: 12
- Slow Length: 26
- Signal Length: 9
- Strength Threshold: 0.2%
Volume Settings:
- Threshold: 1.5x average
```
## 📱 Information Panel
Real-time display of:
1. Total Score
2. MACD Score
3. MACD Strength
4. Volume Score
5. Summary Signal
## ⚙️ Optimization Guidelines
Recommended adjustments:
1. **Bull Market**
- Decrease MACD sensitivity
- Increase volume threshold
- Focus on trend strength
2. **Bear Market**
- Increase MACD sensitivity
- Stricter trend conditions
- Higher score requirements
## 🎯 Recommended Trading Strategy
### Phase 1: Initial Scan
1. Look for 80+ total score
2. Verify sufficient trading volume
3. Confirm bullish MACD crossover
### Phase 2: Validation
1. Check long-term trend
2. Identify nearby resistance levels
3. Review earnings calendar
### Phase 3: Position Management
1. Set clear stop-loss
2. Define realistic profit targets
3. Monitor score changes
## ⚠️ Important Notes
1. This indicator is a supplementary tool
2. Combine with fundamental analysis
3. Strict risk management is essential
4. Not recommended for automated trading
## 📈 Usage Examples
Examples included:
1. Successful buy signal
2. Trend reversal identification
3. False signal analysis and lessons learned
## 🔄 Future Updates
1. RSI integration
2. Advanced alerts
3. Auto-optimization features
## 🎯 Key Benefits
1. Clear scoring system
2. Multiple confirmation layers
3. Real-time market feedback
4. Customizable parameters
## 🚀 Getting Started
1. Add indicator to chart
2. Adjust parameters if needed
3. Monitor information panel
4. Wait for strong signals (80+ score)
## 📊 Performance Metrics
- Success rate: Monitor and track
- Best performing in trending markets
- Optimal for swing trading
- Most effective on daily timeframe
## 🛠️ Technical Details
```pine
// Core components
1. MACD calculation
2. Volume analysis
3. Trend confirmation
4. Score computation
```
## 💡 Pro Tips
1. Use multiple timeframes
2. Combine with support/resistance
3. Monitor sector trends
4. Consider market conditions
## 🤝 Support
Feedback and improvement suggestions welcome!
## 📜 License
MIT License - Free to use and modify
## 📚 Additional Resources
- Recommended timeframes: Daily, 4H
- Best performing markets: Stocks, ETFs
- Optimal market conditions: Trending markets
- Risk management guidelines included
## 🔍 Final Notes
Remember:
- No indicator is 100% accurate
- Always use proper position sizing
- Combine with other analysis tools
- Practice proper risk management
// @version=5
// @description Pro Stock Scanner - Advanced trading system combining MACD, momentum and volume analysis
// @author AviPro
// @license MIT
//
// This indicator helps identify high-quality trading opportunities by analyzing:
// 1. MACD momentum and crossovers
// 2. Trend strength and direction
// 3. Volume patterns and breakouts
//
// The system provides:
// - Total score (0-100)
// - Visual signals on chart
// - Information panel with key metrics
// - Customizable parameters
//
// IMPORTANT: This indicator is for educational and informational purposes only.
// Always conduct your own analysis and use proper risk management.
//
// If you find this indicator helpful, please consider leaving a like and comment!
// Feedback and suggestions for improvement are always welcome.
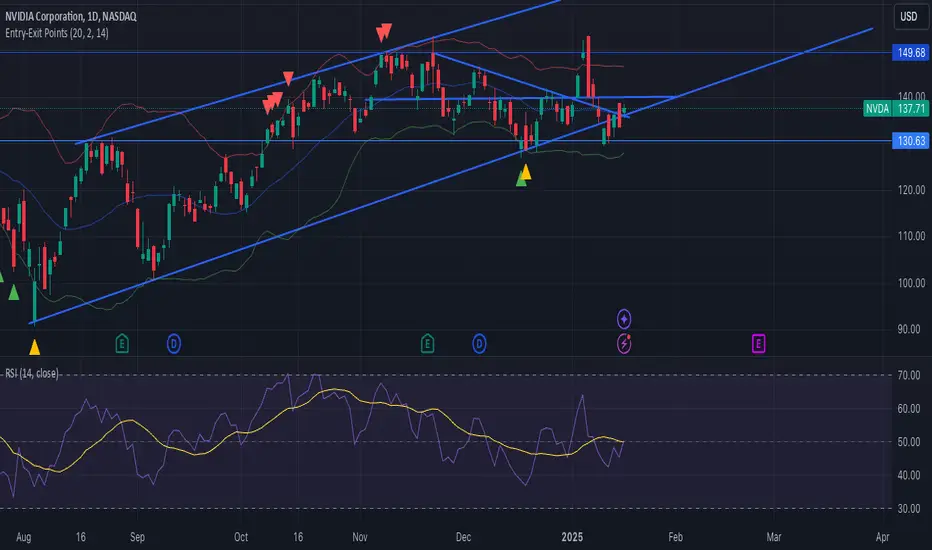
Entry-Exit pointThis indicator combines Bollinger Bands and RSI (Relative Strength Index) to generate entry and exit signals based on price movements and trend conditions.
### Key Features:
- **Bollinger Bands**: The indicator uses Bollinger Bands to assess volatility, with the upper and lower bands plotted around a simple moving average (SMA) of the price. The bands expand and contract based on the standard deviation, providing insights into potential overbought or oversold conditions.
- **RSI**: The RSI is used to determine if the price is overbought or oversold. In this case, it highlights conditions when the RSI is below 40 (oversold) for bullish signals and above 65 (overbought) for bearish signals.
- **Trend Analysis**: The indicator analyzes the previous high and low values to determine the market trend. It identifies uptrend and downtrend conditions based on recent price action.
- **Entry Signals**:
- **Bullish Entry (Green Arrows)**: A signal is generated when the price touches or dips below the lower Bollinger Band, the RSI is under 40, and the current candle shows a downtrend (lower high and low).
- **Bearish Entry (Red Arrows)**: A signal is triggered when the price touches or rises above the upper Bollinger Band, the RSI is above 65, and the current candle shows an uptrend (higher high and low).
### Visuals:
- **Green Up Arrows**: Indicate a potential bullish entry point, plotted below the bar.
- **Red Down Arrows**: Indicate a potential bearish entry point, plotted above the bar.
- **Bollinger Bands**: The upper and lower bands are shown in red and green, with the basis (SMA) in blue.
This indicator provides a clear, rule-based system for detecting potential price reversals based on both volatility (Bollinger Bands) and momentum (RSI), making it useful for traders looking to enter positions during strong trend reversals.
by Frank R.
Abraço primo Lucas Rodrigues
Cabal Dev IndicatorThis is a TradingView Pine Script (version 6) that creates a technical analysis indicator called the "Cabal Dev Indicator." Here's what it does:
1. Core Functionality:
- It calculates a modified version of the Stochastic Momentum Index (SMI), which is a momentum indicator that shows where the current close is relative to the high/low range over a period
- The indicator combines elements of stochastic oscillator calculations with exponential moving averages (EMA)
2. Key Components:
- Uses configurable input parameters for:
- Percent K Length (default 15)
- Percent D Length (default 3)
- EMA Signal Length (default 15)
- Smoothing Period (default 5)
- Overbought level (default 40)
- Oversold level (default -40)
3. Calculation Method:
- Calculates the highest high and lowest low over the specified period
- Finds the difference between current close and the midpoint of the high-low range
- Applies EMA smoothing to both the range and relative differences
- Generates an SMI value and further smooths it using a simple moving average (SMA)
- Creates an EMA signal line based on the smoothed SMI
4. Visual Output:
- Plots the smoothed SMI line in green
- Plots an EMA signal line in red
- Shows overbought and oversold levels as gray horizontal lines
- Fills the areas above the overbought level with light red
- Fills the areas below the oversold level with light green
This indicator appears designed to help traders identify potential overbought and oversold conditions in the market, as well as momentum shifts, which could be used for trading decisions.
Would you like me to explain any specific part of the indicator in more detail?

ORB Screener with Trailing SLThis is an extension to our already published script ORB with ATR Trailing SL indicator
Many people requested to add screener to the existing indicator but since it's slowing down the performance heavily, we decided to add this as a separate screener.
Note: This screener does NOT plot the chart and so you want to have both plotting and screener, use both scripts together.
Overview:
The ORB Screener is a TradingView indicator designed to assist traders in identifying breakout opportunities based on the Opening Range Breakout (ORB) strategy. It features multi-symbol screening, customizable session timeframes, and a detailed table for quick visual reference and stock scanning.
The ORB Screener utilizes the ORB strategy to calculate breakout levels for multiple symbols. It identifies the high and low during a specified session (e.g., first 5 minutes after market open) and provides insights on whether the price is above the high (bullish), below the low (bearish), or between the range (neutral).
Additionally, the script calculates and displays the RSI values for each symbol, aiding traders in assessing momentum alongside breakout status.
Note: One can add up to 40 symbols for screening the stocks.
Key Features and Inputs:
ORB Session Time: Define a specific timeframe (e.g., "0915-0920") during which the ORB high and low are calculated. This serves as the foundation for identifying breakouts.
Multi-Symbol Screening: Screen up to 40 symbols at once, enabling you to monitor multiple opportunities without switching charts.
Breakout Validation:
Select from two methods for confirming a breakout: Close (based on closing prices) or Touch (based on intraday highs/lows).
Breakout Status Indicators:
Above High: Indicates a current bullish breakout when the price exceeds the ORB high.
Below Low: Indicates a current bearish breakout when the price falls below the ORB low.
Between Range: Indicates no breakout (price remains within the range).
RSI Integration : Calculates the RSI for each symbol to help traders evaluate momentum alongside breakout signals.
Customizable Table Display:
Position: Place the data table at the top, middle, or bottom of the chart and align it left, center, or right.
Size: Choose from multiple table size options for optimal visibility (Auto, Huge, Large, Normal, Small, Tiny).
Visual Feedback:
Green Background: Indicates a breakout happened at least once above the ORB high.
Red Background: Indicates a breakout happened at least once below the ORB low.
Gray Background: Indicates price is within the ORB range.
Macros ICT KillZones [TradingFinder] Times & Price Trading Setup🔵 Introduction
ICT Macros, developed by Michael Huddleston, also known as ICT (Inner Circle Trader), is a powerful trading tool designed to help traders identify the best trading opportunities during key time intervals like the London and New York trading sessions.
For traders aiming to capitalize on market volatility, liquidity shifts, and Fair Value Gaps (FVG), understanding and using these critical time zones can significantly improve trading outcomes.
In today’s highly competitive financial markets, identifying the moments when the market is seeking buy-side or sell-side liquidity, or filling price imbalances, is essential for maximizing profitability.
The ICT Macros indicator is built on the renowned ICT time and price theory, which enables traders to track and leverage key market dynamics such as breaks of highs and lows, imbalances, and liquidity hunts.
This indicator automatically detects crucial market times and optimizes strategies for traders by highlighting the specific moments when price movements are most likely to occur. A standout feature of ICT Macros is its automatic adjustment for Daylight Saving Time (DST), ensuring that traders remain synced with the correct session times.
This means you can rely on accurate market timing without the need for manual updates, allowing you to focus on capturing profitable trades during critical timeframes.
🔵 How to Use
The ICT Macros indicator helps you capitalize on trading opportunities during key market moments, particularly when the market is breaking highs or lows, filling Fair Value Gaps (FVG), or addressing imbalances. This indicator is particularly beneficial for traders who seek to identify liquidity, market volatility, and price imbalances.
🟣 Sessions
London Sessions
London Macro 1 :
UTC Time : 06:33 to 07:00
New York Time : 02:33 to 03:00
London Macro 2 :
UTC Time : 08:03 to 08:30
New York Time : 04:03 to 04:30
New York Sessions
New York Macro AM 1 :
UTC Time : 12:50 to 13:10
New York Time : 08:50 to 09:10
New York Macro AM 2 :
UTC Time : 13:50 to 14:10
New York Time : 09:50 to 10:10
New York Macro AM 3 :
UTC Time : 14:50 to 15:10
New York Time : 10:50 to 11:10
New York Lunch Macro :
UTC Time : 15:50 to 16:10
New York Time : 11:50 to 12:10
New York PM Macro :
UTC Time : 17:10 to 17:40
New York Time : 13:10 to 13:40
New York Last Hour Macro :
UTC Time : 19:15 to 19:45
New York Time : 15:15 to 15:45
These time intervals adjust automatically based on Daylight Saving Time (DST), helping traders to enter or exit trades during key market moments when price volatility is high.
Below are the main applications of this tool and how to incorporate it into your trading strategies :
🟣 Combining ICT Macros with Trading Strategies
The ICT Macros indicator can easily be used in conjunction with various trading strategies. Two well-known strategies that can be combined with this indicator include:
ICT 2022 Trading Model : This model is designed based on identifying market liquidity, structural price changes, and Fair Value Gaps (FVG). By using ICT Macros, you can identify the key time intervals when the market is seeking liquidity, filling imbalances, or breaking through important highs and lows, allowing you to enter or exit trades at the right moment.
Silver Bullet Strategy : This strategy, which is built around liquidity hunting and rapid price movements, can work more accurately with the help of ICT Macros. The indicator pinpoints precise liquidity times, helping traders take advantage of market shifts caused by filling Fair Value Gaps or correcting imbalances.
🟣 Capitalizing on Price Volatility During Key Times
Large market algorithms often seek liquidity or fill Fair Value Gaps (FVG) during the intervals marked by ICT Macros. These periods are when price volatility increases, and traders can use these moments to enter or exit trades.
For example, if sell-side liquidity is drained and the market fills an imbalance, the price might move toward buy-side liquidity. By identifying these moments, which may also involve breaking a previous high or low, you can leverage rapid market fluctuations to your advantage.
🟣 Identifying Liquidity and Price Imbalances
One of the important uses of ICT Macros is identifying points where the market is seeking liquidity and correcting imbalances. You can determine high or low liquidity levels in the market before each ICT Macro, as well as Fair Value Gaps (FVG) and price imbalances that need to be filled, using them to adjust your trading strategy. This capability allows you to manage trades based on liquidity shifts or imbalance corrections without needing a bias toward a specific direction.
🔵 Settings
The ICT Macros indicator offers various customization options, allowing users to tailor it to their specific needs. Below are the main settings:
Time Zone Mode : You can select one of the following options to define how time is displayed:
UTC : For traders who need to work with Universal Time.
Session Local Time : The local time corresponding to the London or New York markets.
Your Time Zone : You can specify your own time zone (e.g., "UTC-4:00").
Your Time Zone : If you choose "Your Time Zone," you can set your specific time zone. By default, this is set to UTC-4:00.
Show Range Time : This option allows you to display the time range of each session on the chart. If enabled, the exact start and end times of each interval are shown.
Show or Hide Time Ranges : Toggle on/off for visual clarity depending on user preference.
Custom Colors : Set distinct colors for each session, allowing users to personalize their chart based on their trading style.These settings allow you to adjust the key time intervals of each trading session to your preference and customize the time format according to your own needs.
🔵 Conclusion
The ICT Macros indicator is a powerful tool for traders, helping them to identify key time intervals where the market seeks liquidity or fills Fair Value Gaps (FVG), corrects imbalances, and breaks highs or lows. This tool is especially valuable for traders using liquidity-based strategies such as ICT 2022 or Silver Bullet.
One of the key features of this indicator is its support for Daylight Saving Time (DST), ensuring you are always in sync with the correct trading session timings without manual adjustments. This is particularly beneficial for traders operating across different time zones.
With ICT Macros, you can capitalize on crucial market opportunities during sensitive times, take advantage of imbalances, and enhance your trading strategies based on market volatility, liquidity shifts, and Fair Value Gaps.

SMI Ergodic Indicator/Oscillator▮ Introduction
The Stochastic Momentum Index Ergodic Indicator (SMII) is a technical analysis tool designed to predict trend reversals in the price of an asset.
It functions as a momentum oscillator, measuring the ratio of the smoothed price change to the smoothed absolute price change over a given number of previous periods.
The Ergodic SMI is based on the True Strength Index (TSI) and integrates a signal line, which is an exponential moving average (EMA) of the SMI indicator itself.
It provides a clearer picture of market trends than the traditional stochastic oscillator by incorporating the concept of "ergodicity", which helps remove market noise.
On ther other hand, the Stochastic Momentum Index Ergodic Oscillator (SMIO) is a histogram that measures the difference between TSI and it's signal line.
By default, in TradingView both SMII and SMIO are provided independently.
Here in this script these two indicators are combined, providing a more comprehensive view of price direction and market strength.
▮ Motivation: why another indicator?
The intrinsic value of this indicator lies in the fact that it allows fine adjustments in both calculation parameters, data source and visualization, features that are not present in the standard indicators or similar.
Also, trend lines breakouts and divergences detector were added.
▮ What to look for
When using the indicator, there are a few things to look out for.
First, look at the SMI signal line.
When the line crosses above -40, it is considered a buy signal, while the crossing below +40 is considered a sell signal.
Also, pay attention to divergences between the SMI and the price.
If price is rising but the SMI is showing negative divergence, it could indicate that momentum is waning and a reversal could be in the offing.
Likewise, if price is falling but the SMI is showing positive divergence, this could indicate that momentum is building and a reversal could also be in the offing.
Divergences can be considered in both indicator and/or histogram.
Examples:
▮ Notes
The indicator presented here offers both the "SMII" and the "SMIO", that is, the "Stochastic Momentum Index Ergodic Indicator" together with the "Stochastic Momentum Index Ergodic Oscillator" (histogram), as per the documentation described in reference links.
So it is important to highlight the differences in relation to my other indicator, Stochastic Momentum Index (SMI) Refurbished .
This last one is purely based on the **SMI**, which is implemented using smoothed ratio between the relative range and the high/low range.
Although they may seem the same in some situations, the calculation is actually different. The TSI tends to be more responsive at the expense of being noisier, while the SMI tends to be smoother. Which of these two indicators is best depends on the situation, the context, and the analyst's personal preference.
Please refer to reference links to more info.
▮ References
SMI documentation
SMII documentation
SMIO documentation

SMI Ergodic Indicator/Oscillator of Money Flow Index▮ Introduction
The Stochastic Momentum Index Ergodic (SMII) indicator is a technical analysis tool designed to predict trend reversals in the price of an asset.
It functions as a momentum oscillator, measuring the ratio of the smoothed price change to the smoothed absolute price change over a given number of previous periods.
The Ergodic SMI is based on the True Strength Index (TSI) and integrates a signal line, which is an exponential moving average (EMA) of the SMI indicator itself.
The Ergodic SMI oscillator provides a clearer picture of market trends than the traditional stochastic oscillator by incorporating the concept of 'ergodicity', which helps remove market noise.
On ther other hand, MFI (Money Flow Index) is a technical analysis indicator used to measure the inflow of money into an asset and thus help identify buying and selling pressure in a given financial instrument.
When these two indicators are combined, they can provide a more comprehensive view of price direction and market strength.
▮ Motivation: why another indicator?
By combining SMII with MFI, we can gain even more insights into the market.
One way to do this is to use the MFI as an input to the SMII, rather than just using price.
This means we are measuring momentum based on buying and selling pressure rather than just price.
Furthermore, there is the possibility of making several fine adjustments to both the calculation and visualization parameters that are not present in other indicators.
▮ What to look for
When using the SMII MFI indicator, there are a few things to look out for.
First, look at the SMII signal line.
When the line crosses above -40, it is considered a buy signal, while the crossing below +40 is considered a sell signal.
Also, pay attention to divergences between the SMII and the price.
If price is rising but the SMII is showing negative divergence, it could indicate that momentum is waning and a reversal could be in the offing.
Likewise, if price is falling but the SMII is showing positive divergence, this could indicate that momentum is building and a reversal could also be in the offing.
Divergences can be considered in both indicator and/or histogram.
Examples:
▮ Notes
The indicator presented here offers both the 'SMII' and the 'SMIO', that is, the 'Stochastic Momentum Index Ergodic Indicator' together with the 'Stochastic Momentum Index Ergodic Oscillator' (histogram), as per the documentation described in reference links.
So it is important to highlight the differences in relation to my other indicator, the 'Stochastic Momentum Index (SMI) of Money Flow Index (MFI)':
This last one is purely based on the SMI , which is implemented using SMA smoothing for the relative range and the high/low range.
Although they may seem the same in some situations, the calculation is actually different. The TSI tends to be more responsive at the expense of being noisier, while the SMI tends to be smoother. Which of these two indicators is best depends on the situation, the context, and the analyst's personal preference.
Please refer to reference links to more info.
▮ References
SMI documentation
SMII documentation
SMIO documentation
MFI documentation
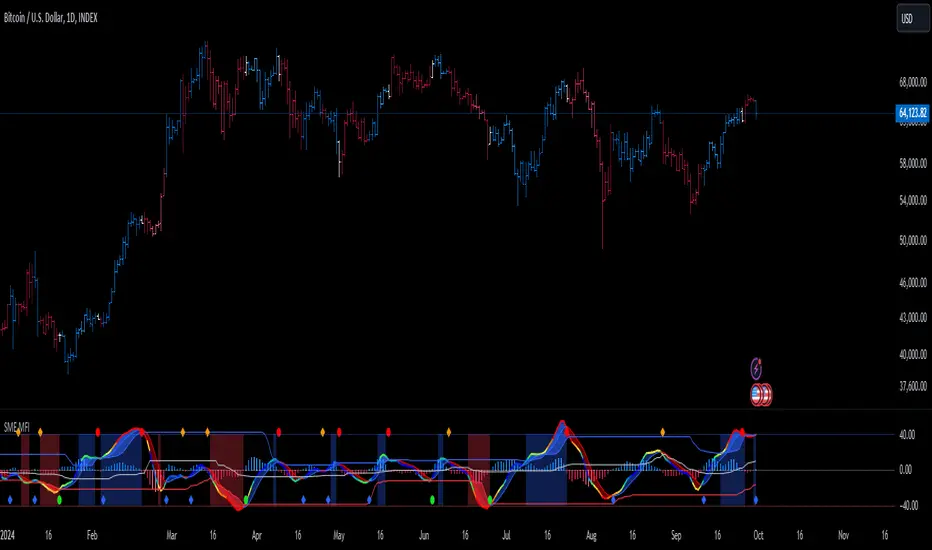
ADX & DI with dynamic threshold indicator
ADX and DI with Dynamic Threshold
This Pine Script indicator, "ADX & DI with Dynamic Threshold," helps traders detect trends, trend reversals, and trend strength using the Average Directional Index (ADX) and the Directional Indexes (DI+ and DI-). It incorporates a dynamic threshold calculated using the average ADX over a user-defined period, along with a fixed minimum threshold, making trend detection more flexible and adaptable.
ADX and Directional Indexes (DI+ and DI-)
ADX measures the strength of a trend, while DI+ and DI- measure the direction of the trend. High DI+ signals upward price strength, and high DI- signals downward price strength.
Dynamic Threshold
A threshold based on the average ADX over a certain number of periods, ensuring the indicator adapts to market conditions. The threshold is compared to DI+ and DI- to generate trend signals.
Fixed Minimum Threshold
A user-defined minimum threshold ensures that signals are only generated in markets with a certain level of trend strength, preventing false signals in low-trending markets.
Visual Highlights
The background color highlights:
Green for potential uptrend,
Red for potential downtrend, and
Orange when directional movement is strong but trend strength is weak, helping traders avoid false signals in sideways markets.
Customization
Several input parameters allow for complete customization of the indicator, ensuring it can adapt to different timeframes and assets.
How to Use
Length (len)
This is the smoothing period used to calculate the ADX and DI+/- values. Range: 5 to 50 (default: 14).
Threshold Period (th_period)
Determines the number of periods over which the dynamic ADX threshold is calculated. Range: 5 to 200 (default: 50).
Fixed Minimum Threshold (fixed_th)
The minimum ADX value that must be exceeded for the indicator to trigger signals. Range: 10 to 40 (default: 20).
Smoothing Method
Choose between SMA (Simple Moving Average) or EMA (Exponential Moving Average) for smoothing the true range and directional movement calculations.
DI+ (Green)
Indicates the strength of upward price movements.
DI- (Red)
Indicates the strength of downward price movements.
ADX (Navy)
Indicates the overall strength of the trend, regardless of direction.
Dynamic Threshold (Gray)
The dynamic threshold used for comparing ADX values.
Fixed Threshold Line
A dotted black line showing the user-defined minimum threshold for ADX.
Green Background
Indicates a potential uptrend when DI+ > DI- and ADX is above the threshold.
Red Background
Indicates a potential downtrend when DI- > DI+ and ADX is above the threshold.
Orange Background
Indicates that DI+ or DI- are strong, but ADX is weak, suggesting a lack of trend strength despite directional movement, which could lead to false signals.
Adjust the length (len) based on the volatility of the asset. A lower len (e.g., 10) may be suitable for faster timeframes (like 5-min charts), while a higher value (e.g., 20-30) may work better on longer timeframes.
Use the threshold period (th_period) to fine-tune the dynamic ADX threshold. A higher value smooths the dynamic threshold over a longer period, making it more resistant to sudden volatility.
Fixed Threshold (fixed_th) should be set based on the strength of trends you want to capture. A higher value (e.g., 30-40) is more conservative and will only trigger signals in very strong trends.
Example Usage
This indicator can be used to:
Identify trends: When the ADX crosses the threshold and DI+ or DI- is dominant, indicating an uptrend or downtrend.
Spot trend reversals: When DI+ and DI- cross each other with a strong ADX reading.
Avoid false signals: By recognizing when DI+ or DI- are strong, but the ADX is below the threshold (highlighted in orange).
Conclusion
The ADX and DI with Dynamic Threshold indicator is a versatile tool for trend-following strategies. It adapts to market conditions using dynamic and fixed thresholds and provides clear visual signals to help traders make informed decisions about market direction and trend strength.
By adjusting the various input parameters, this indicator can be tailored to any asset class or timeframe, making it suitable for all types of traders, from scalpers to swing traders.
Feel free to experiment with different settings and incorporate this indicator into your trading strategy for enhanced market analysis.

Ticker Tape█ OVERVIEW
This indicator creates a dynamic, scrolling display of multiple securities' latest prices and daily changes, similar to the ticker tapes on financial news channels and the Ticker Tape Widget . It shows realtime market information for a user-specified list of symbols along the bottom of the main chart pane.
█ CONCEPTS
Ticker tape
Traditionally, a ticker tape was a continuous, narrow strip of paper that displayed stock prices, trade volumes, and other financial and security information. Invented by Edward A. Calahan in 1867, ticker tapes were the earliest method for electronically transmitting live stock market data.
A machine known as a "stock ticker" received stock information via telegraph, printing abbreviated company names, transaction prices, and other information in a linear sequence on the paper as new data came in. The term "ticker" in the name comes from the "tick" sound the machine made as it printed stock information. The printed tape provided a running record of trading activity, allowing market participants to stay informed on recent market conditions without needing to be on the exchange floor.
In modern times, electronic displays have replaced physical ticker tapes. However, the term "ticker" remains persistent in today's financial lexicon. Nowadays, ticker symbols and digital tickers appear on financial news networks, trading platforms, and brokerage/exchange websites, offering live updates on market information. Modern electronic displays, thankfully, do not rely on telegraph updates to operate.
█ FEATURES
Requesting a list of securities
The "Symbol list" text box in the indicator's "Settings/Inputs" tab allows users to list up to 40 symbols or ticker Identifiers. The indicator dynamically requests and displays information for each one. To add symbols to the list, enter their names separated by commas . For example: "BITSTAMP:BTCUSD, TSLA, MSFT".
Each item in the comma-separated list must represent a valid symbol or ticker ID. If the list includes an invalid symbol, the script will raise a runtime error.
To specify a broker/exchange for a symbol, include its name as a prefix with a colon in the "EXCHANGE:SYMBOL" format. If a symbol in the list does not specify an exchange prefix, the indicator selects the most commonly used exchange when requesting the data.
Realtime updates
This indicator requests symbol descriptions, current market prices, daily price changes, and daily change percentages for each ticker from the user-specified list of symbols or ticker identifiers. It receives updated information for each security after new realtime ticks on the current chart.
After a new realtime price update, the indicator updates the values shown in the tape display and their colors.
The color of the percentages in the tape depends on the change in price from the previous day . The text is green when the daily change is positive, red when the value is negative, and gray when the value is 0.
The color of each displayed price depends on the change in value from the last recorded update, not the change over a daily period. For example, if a security's price increases in the latest update, the ticker tape shows that price with green text, even if the current price is below the previous day's closing price. This behavior allows users to monitor realtime directional changes in the requested securities.
NOTE: Pine scripts execute on realtime bars when new ticks are available in the chart's data feed. If no new updates are available from the chart's realtime feed, it may cause a delay in the data the indicator receives.
Ticker motion
This indicator's tape display shows a list of security information that incrementally scrolls horizontally from right to left after new chart updates, providing a dynamic visual stream of current market data. The scrolling effect works by using a counter that increments across successive intervals after realtime ticks to control the offset of each listed security. Users can set the initial scroll offset with the "Offset" input in the "Settings/Inputs" tab.
The scrolling rate of the ticker tape display depends on the realtime ticks available from the chart's data feed. Using the indicator on a chart with frequent realtime updates results in smoother scrolling. If no new realtime ticks are available in the chart's feed, the ticker tape does not move. Users can also deactivate the scrolling feature by toggling the "Running" input in the indicator's settings.
█ FOR Pine Script™ CODERS
• This script utilizes dynamic requests to iteratively fetch information from multiple contexts using a single request.security() instance in the code. Previously, `request.*()` functions were not allowed within the local scopes of loops or conditional structures, and most `request.*()` function parameters, excluding `expression`, required arguments of a simple or weaker qualified type. The new `dynamic_requests` parameter in script declaration statements enables more flexibility in how scripts can use `request.*()` calls. When its value is `true`, all `request.*()` functions can accept series arguments for the parameters that define their requested contexts, and `request.*()` functions can execute within local scopes. See the Dynamic requests section of the Pine Script™ User Manual to learn more.
• Scripts can execute up to 40 unique `request.*()` function calls. A `request.*()` call is unique only if the script does not already call the same function with the same arguments. See this section of the User Manual's Limitations page for more information.
• This script converts a comma-separated "string" list of symbols or ticker IDs into an array . It then loops through this array, dynamically requesting data from each symbol's context and storing the results within a collection of custom `Tape` objects . Each `Tape` instance holds information about a symbol, which the script uses to populate the table that displays the ticker tape.
• This script uses the varip keyword to declare variables and `Tape` fields that update across ticks on unconfirmed bars without rolling back. This behavior allows the script to color the tape's text based on the latest price movements and change the locations of the table cells after realtime updates without reverting. See the `varip` section of the User Manual to learn more about using this keyword.
• Typically, when requesting higher-timeframe data with request.security() using barmerge.lookahead_on as the `lookahead` argument, the `expression` argument should use the history-referencing operator to offset the series, preventing lookahead bias on historical bars. However, the request.security() call in this script uses barmerge.lookahead_on without offsetting the `expression` because the script only displays results for the latest historical bar and all realtime bars, where there is no future information to leak into the past. Instead, using this call on those bars ensures each request fetches the most recent data available from each context.
• The request.security() instance in this script includes a `calc_bars_count` argument to specify that each request retrieves only a minimal number of bars from the end of each symbol's historical data feed. The script does not need to request all the historical data for each symbol because it only shows results on the last chart bar that do not depend on the entire time series. In this case, reducing the retrieved bars in each request helps minimize resource usage without impacting the calculated results.
Look first. Then leap.