Krowns 10 PACK Combo (5 EMAs, 5 SMAs) - v2Version 2 - Krowns Crypto 10 pack moving average set - written by "Kick Back Time" also known as Mr.Scrogers Neighborhood
...after receiving a lot of likes from the first version I thought I would go ahead and put out the updated version that I've been using
There's a few things I've changed to make it easier to adapt to.
This set is very similar to what Krown uses - I rarely look at the 100 SMA, but I do like the 128 SMA, so I made it default over the 100...
It's all adjustable in values, colors, line thicknesses, etc... it's all good
Tweeks/Improvements:
1) now has a shorter overlay title so it takes up less space on the chart and is less distractive
2) the 30, 50 and 128 SMA's are now default pink which stand out well and are easier to associate as SMA's
在腳本中搜尋"大位科技同行业可替代股票的技术面分析数据(如5日均线、10日均线、支撑位、压力位)"


QEMA - 9 EMAs (10, 20, 50 - 400) / CryptoprospaBy adding this one indicator to your chart, you save time and effort for the EMAs you want.
You can add this and then modify which ones you want visible in the settings.
It covers the 10, 20, 50, 100, 150, 200, 250, 300, 400 EMAs
Enjoy.
Cryptoprospa.

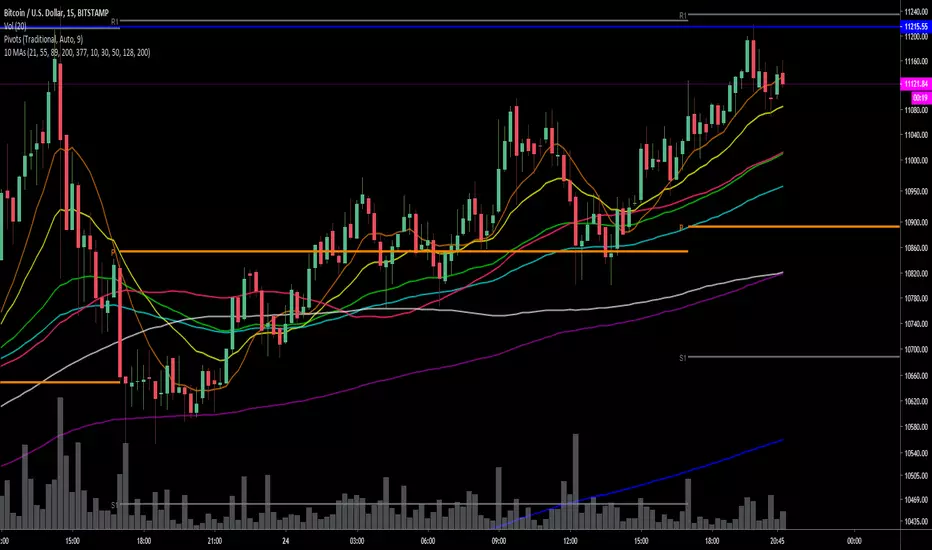
Krowns 10 PACK Combo (5 EMAs,5 SMAs) by Mr.Scrogers'NeighborhoodI wanted to have the full option of 10 MAs like you see Krown use in his recent videos...
This gives you 5 EMAs that are adjustable in value and color...
...As well as 5 SMAs that are also adjustable in value and color
*If you'd like to see the values in color at the top left like you see in Krown's videos here's what you do:
1) click on the settings gear icon in the upper right
2) next click on the 'background' tab
3) next check the 'indicator value' box off/on
*This will take up quite a bit of space so that's why I altered the code to give you a readout of what color each value is already...your choice though
If you find this to be useful please stop by my youtube channel 'Mr.Scrogers'Neighborhood' and give me a sub...as well as Krown's Crypto Cave youtube channel
I plan to post videos soon on TA, just for fun because I have no biases and will trade up and down regardless
Enjoy!


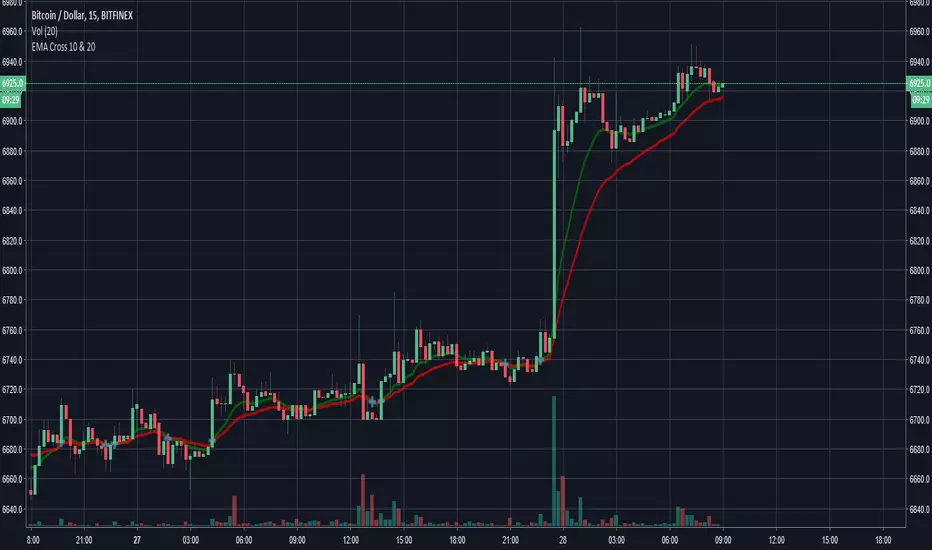
Bitazu MA 5,10Displays 5,10 MAs on a single indicator.
Useful for Crypto trading and reduced the number of indicators needed to view multiple EMAs
When shorter MA crosses over the longer it's a good sign of Bullish/Bearish reversal.
This sentiment is more true at longer timeframes, such as daily candles, as the trend has more momentum.

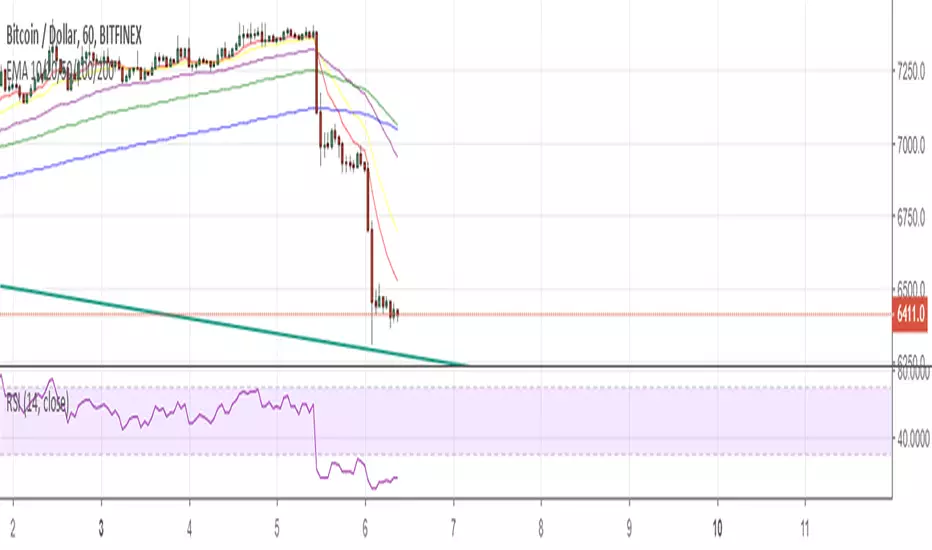
Bitazu MA 10,20Displays 10, 20 MAs on a single indicator.
Useful for Crypto trading and reduced the number of indicators needed to view multiple MAs
When shorter MA crosses over the longer it's a good sign of Bullish/Bearish reversal.
This sentiment is more true at longer timeframes, such as daily candles, as the trend has more momentum.

BB with5-10-50-100-200 SMA Daily and the StratThis script combines Bollinger bands with 5 different SMA (5,10,50,100,200) with indicators for when candles are inside day or outside day i.e the Rob Smith's 1 and 3 in "the Strat"


Daily Simplistic Moving Average Strategy 10/22Indicates crossing over or under of the 10 and 22 SMA
Best used on the daily chart for crypto assets such as BTC & ETH


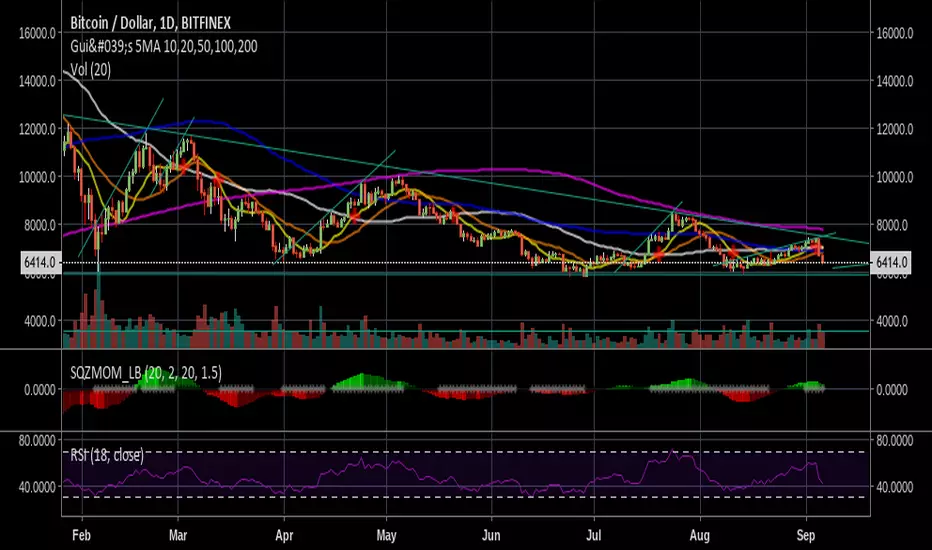
Gui's 5MA 10,20,50,100,2005 Simple Moving Averages for the 10, 20, 50, 100 and 200 day and a cross for whatever you want to read:P
Use it well! Buy high and sell low. Jk:P
Thank you!